Article

Government Restriction Efficiency on Curbing COVID-19 Pandemic Transmission in Western Europe

1
CNR-IMAA, Contrada S. Loja snc, 85050 Tito Scalo, Italy
2
Dipartimento di Fisica e Astronomia, Universita degli Studi di Firenze, Via Sansone 1, 50019 Sesto Fiorentino, Italy
*
Author to whom correspondence should be addressed.
These authors contributed equally to this work.
COVID 2023, 3(8), 1079-1091; https://doi.org/10.3390/covid3080079
Submission received: 29 May 2023 / Revised: 25 July 2023 / Accepted: 26 July 2023 / Published: 28 July 2023

Abstract

:
The World Health Organization (WHO)-confirmed pandemic (March 2020) of the new Coronavirus 2 severe acute respiratory syndrome infection (SARS-CoV-2) reported in Wuhan, China, in December 2019 (first reported cases), then spread to Italy and successively around the world. The objective of this study is to evaluate the effectiveness of the restrictions implemented by different governments from a statistical point of view. We quantitatively evaluated how restrictions influenced the temporal evolution of the distribution of the weekly number of hospitalized patients in the intensive care unit (ICU) for different countries that applied different levels of restrictions, which can be summarized with the average stringency index, a synthetic index that represents a metric for quantifying the severity of the restrictions applied. We found that the stringency index is strongly correlated with the distribution skewness, while standard deviation and kurtosis are poorly and moderately influenced. Furthermore, we compared the values of the skewness of the distribution of hospitalized patients during several pre-pandemic influenza outbreaks in Italy (data not available for other countries). Analysis shows that for normal flu, there is a substantial difference in skewness (as much as 70%) in the distribution with respect to the first COVID-19 pandemic outbreak, where social restrictions were applied. This large difference highlights that the restrictions implemented modify the symmetry of the peak of the distribution of the hospitalized patient in the ICU. Therefore, skewness can be used as a valid indicator to assess whether restriction has any effect on pandemic transmission and can be used as a support for decision makers.

1. Introduction

The World Health Organization (WHO)-declared pandemic (March 2020) of the new Coronavirus 2 severe acute respiratory syndrome infection (SARS-CoV-2) reported in Wuhan, China, in December 2019 (first reported cases), then spread to Italy and successively around the world. Recent studies highlight how meteorological conditions and air pollution influenced pandemic transmission in various parts of the world [1,2,3,4,5,6,7,8] in addition to social and economic factors [9,10] or how quickly asymptomatic carriers are found [11]. Governments around the world have implemented various restrictions to curb the spread of COVID-19. The effectiveness of these restrictions has been a topic of intense debate and research. Recently, several studies have provided new information on the effectiveness of these measures.

1.1. Global Impact and Effectiveness of COVID-19 Restrictions

The effectiveness of COVID-19 restrictions has been widely studied, and several articles highlight the positive impact of such measures on reducing transmission rates and alleviating the burden on healthcare systems. A comprehensive study by [12] indicated that lockdown measures implemented in 11 European countries led to a significant reduction in virus reproduction number (R0), preventing an estimated 3.1 million infections. Similarly, a systematic review by [13] involving 149 countries showed that stringent restrictions, such as school and workplace closures, travel restrictions, and social distancing mandates, were associated with a decrease in COVID-19 case growth rates. Another study by [14] found that nonpharmaceutical interventions, including lockdowns, had a substantial effect on reducing transmission in six countries, preventing an estimated 62 million confirmed cases. Collectively, these findings suggest that the COVID-19 restrictions were vital to curbing the spread of the virus and minimizing its impact on public health.
The effectiveness of COVID-19 restrictions has also been supported by region-specific studies. In the United States, a study by [15] analyzed the impact of social distancing measures and stay-at-home orders on the growth rate of COVID-19 cases, finding that such policies significantly slowed the spread of the virus. In China, a modeling study by [16] reported that the rapid implementation of control measures, including travel restrictions, reduced the virus transmission rate by 44% within 20 days. Furthermore, a study conducted in Brazil by [17] indicated that localized restrictions in the state of São Paulo successfully reduced the effective reproduction number (Rt) of COVID-19 below 1, demonstrating the effectiveness of such measures in curbing transmission.
However, the effectiveness of government interventions has not been uniform in all countries. A study of the spread of the virus in countries with a higher population density and a higher share of employment in the service sector was conducted [13].
Other factors, such as the effectiveness of test and contact tracking programs, also play a role in the effectiveness of government interventions. A study found that contact tracking and testing programs were essential to control the virus spread and that the effectiveness of these programs depended on factors such as case detection speed and resource availability [18]. Despite the positive impact of these restrictions, it is important to note that the implementation and compliance with such measures can vary between different countries and regions, which could affect the overall effectiveness of these policies [19]. Furthermore, the economic and social costs of implementing strict COVID-19 restrictions must be considered, as prolonged lockdowns and other measures have had significant consequences on mental health, employment, and economic growth [20]. In general, these studies suggest that government interventions, particularly early and aggressive interventions, have been effective in reducing the spread of COVID-19. However, the effectiveness of these measures can vary depending on factors such as population density, employment patterns, and the effectiveness of testing and contact tracing programs.
However, there is no full consensus on the efficacy of restriction measurements to stop pandemic spread. Indeed, the criticism of lockdown policies, as measures to contrast the spread of COVID-19, has generated significant controversy in both public and academic discourses. A significant school of thought argues that the socioeconomic consequences of these interventions often outweigh their public health benefits [21,22]. These critics underscore that lockdowns can lead to severe economic recession, job losses, and increased poverty [23]. Other researchers have pointed out that these measures could contribute to the deterioration of mental health, increased domestic violence, and disruption of health services and education [24,25]. Furthermore, studies suggest that the efficacy of lockdowns can vary greatly depending on the timing, strictness, and public adherence, which implies that a one-size-fits-all approach may not be feasible or effective [12,26]. Given the aforementioned complexities and the dynamic nature of COVID-19, it becomes crucial to devise a robust and reliable metric to evaluate the effectiveness of restrictions. Our research stands out due to its unique approach of creating a novel and fast metric that quantifies the effects of restrictions on the temporal distribution of admissions to the intensive care unit (ICU). This initiative is innovative in its attempt to address key questions concerning the efficacy of nonpharmaceutical interventions during a pandemic. The novelty of our research lies in its potential to offer rapid and comprehensive evaluations of trade-offs between the risks and benefits associated with implementing these interventions. By systematically and empirically evaluating these effects, our research could become a valid support for authorities that implement and evaluate public health measures, thus paving the way for more informed, efficient, and effective strategies in response to future public health crises.

1.2. Methodologies Used for Evaluating Nonpharmaceutical Interventions against COVID-19

Various methodologies have been used to assess the efficacy of nonpharmaceutical interventions (NPIs) in curtailing the spread of COVID-19. Here are some of the key methods.

1.3. Proposed Research

In our analysis, we establish a correlation between various statistical parameters that characterize the peak shape of the time series of patients admitted to the ICU weekly in these countries and the average stringency index (SI) [19]. SI is a composite index representing the severity of the the restrictions applied, ranging from 0 (no restriction) to 100 (complete lockdown). We identify the shape parameter that exhibits the strongest correlation with SI and test its significance, indicating its reliability as a proxy for the effectiveness of implemented restrictions. To validate this hypothesis, we compare the statistical parameters of COVID-19 admissions with those of several pre-pandemic influenza outbreaks in Spain.
Through statistical analysis, we establish a correlation between the shape of the peak admissions and the stringency index of the implemented restrictions. This information is valuable to policymakers in evaluating and adapting restrictions accordingly. Furthermore, our study underscores the need for a more uniform implementation of restrictions in European countries to improve their effectiveness. We also emphasize the importance of balancing the effectiveness of restrictions with their economic impact, considering the potential long-term consequences.
To ensure a more accurate assessment of the effective infection rate, we specifically selected the number of hospitalized patients as our variable of choice from among all available options. This is because this variable is considered to be more reliable compared to others, such as the weekly number of people who tested positive, as highlighted in a recent study [1]. The number of hospitalized patients is a reliable indicator as it is not influenced by the number of people who were tested, which could include false positives.

2. Methodology

The objective of this study is to evaluate the effectiveness of restriction from a statistical point of view. To this end, we quantitatively evaluated the differences in the evolution of the number of patients hospitalized in time for seven western European countries that applied different levels of restrictions that can be summarized with the stringency index (SI; [19]).

2.1. Stringency Index

The stringency index (SI; [19]) is a synthetic metric that quantifies the severity of restrictions applied by governments during the COVID-19 pandemic. The index was developed by the Oxford COVID-19 Government Response Tracker team in collaboration with the Blavatnik School of Government at the University of Oxford. The SI ranges from 0 (no restrictions) to 100 (complete lockdown) and is based on eight indicators, including school and workplace closures, restrictions on public gatherings, and international travel controls. The index is calculated by aggregating the different restriction indexes for each country and normalizing the value to the maximum score of 100. The SI has been widely used to compare the response of different countries to the pandemic and to assess the effectiveness of the implemented measures. Although SI does not directly measure the impact of restrictions on public health outcomes, it provides a proxy for the severity of the measures and can be used to compare the effectiveness of different policy responses in countries. However, SI shows some limitations, including its lack of granularity and sensitivity to different aspects of restrictions. Despite these limitations, the SI remains a useful tool for policy makers and researchers to evaluate and compare the stringency of the measures implemented during the COVID-19 pandemic.
The SI index is based on the aggregation of eight closure policies and containment indicators and one public information campaign indicator. Each restriction imposed leads to an increase in SI for the related country. The eight closure policies and containment indicators are listed in Table 1.
The higher the SI, the greater the number of restrictions implemented. Data are freely available from the University of Oxford https://www.bsg.ox.ac.uk/research/research-projects/covid-19-government-response-tracker (accessed on 25 July 2023).
The SI values are available for each country on a daily basis, but, for our purposes and to avoid the volatility of the index, we simply averaged the values along the first pandemic wave (January–May 2020).
Although the stringency index (SI) provides a synthetic metric to quantify the severity of restrictions imposed by governments during the pandemic, it cannot fully capture the real effects of these measures in reducing cases of severe infection. This is because SI is a highly aggregated measure that does not consider the actual enforcement of restrictions by citizens. Even if a country implements the highest level of restrictions (SI = 100), there may be instances where citizens only partially follow the imposed rules, leading to unexpected results in mitigation. On the other hand, the daily number of infected people is a direct measure of the effects of restrictions, but it is often an inaccurate metric due to the inability to track asymptomatic cases or the reduced testing capacity during the early stages of the pandemic. To address these limitations, we chose the number of hospitalized patients as our metric of interest, following the recommendations of [1]. This variable is more reliable than others because it is not affected by false positives and reflects the real burden of severe infection in the healthcare system.

2.2. Temporal Distribution of Weekly ICU Admissions

The trend of the number of hospitalized patients in time can be considered to reflect the effectiveness of restrictions imposed that are quantified by the SI. It should be noted that the weekly admission temporal distributions for all countries are logically aligned, that is, the first value in the sample space coincides with the day when the first cases have been reported in each country, as shown in Figure 1a. In Figure 1b is represented the normalized SI that highlights where restrictions were earlier implemented. Furthermore, it can be observed that the first wave led to a rise in cases, reaching a peak, followed by a decrease. Our working hypothesis is that the change in slope between the ascending and descending segments is correlated with the restrictive laws imposed by the local authorities.
We employed the Bootstrap resampling method, which involves creating multiple pseudo-samples by resampling the original dataset. These pseudo-samples are then used to estimate the variability of sample statistics. By comparing the statistics of the original sample with those obtained from the bootstrap samples, we assessed whether there was any bias present.
In our study, we generated 1000 bootstrap samples. We implemented the bootstrap resampling procedure using a for loop, where each iteration involved drawing a bootstrap sample from the original dataset using the replacement datasample function. Subsequently, we computed the mean for each bootstrap sample.
After generating the bootstrap samples, we calculated the standard error of the sample mean using bootstrap resampling. This was accomplished by determining the standard deviation of the bootstrap means. Additionally, we computed the standard error of the original sample mean. In particular, we observed that the standard errors obtained from both the original sample and the bootstrap samples were nearly identical. This close similarity indicates that if the standard error of the sample mean obtained by bootstrap resampling aligns with the standard error calculated from the original sample, the original sample serves as a good representation of the population distribution.
Consequently, when the bootstrap standard error closely resembles the standard error derived from the original data distribution, it suggests that the original sample is unbiased and effectively represents the population distribution. Furthermore, the standard error calculated from the original sample provides a reliable estimate of the variability of the mean of the sample.

2.3. Statistical Analysis

To quantify this assumed correlation, a systematic process is required capable of unambiguously characterizing a bell-like temporal distribution with one number to quantify this expected correlation. To this end, we can use the following trick. Let X i be the i th component of the time series of length M. This can be thought of as an abstract discrete probability distribution associated with discrete values i = 1 , 2 , , M , that is,
P i = X i j = 1 M X j
Then, by generating a large number of random deviations distributed according to PDF (1) for each country, we can quantify changes in the shape of the time series by computing the sample moments of the (artificial) distribution (1). In particular, the normalized third moment will provide the information sought on the asymmetry between the ascending and descending phases.
In order to generate random samples distributed according to PDF (1), we can proceed as follows. Let C i [ 0 , 1 ] be the cumulative distribution corresponding to PDF (1). This can be easily computed as the cumulative sum of the normalized time series P i . Then, with z as a random number from the uniform distribution of units of interval, take y i i where i { 1 , 2 , , M } is the integer for which C i 1 < z C i . Repetition of this procedure a large number of times N, the corresponding integers { y i 1 , y i 2 , , y i N } will form a population of random deviations extracted from the PDF (1).
Having characterized the distribution’s mean, median, and mode (gauging the number of weeks elapsed between the onset of the wave and its apex), one conventionally characterizes its “width” or “variability” around the mean. The most common is the variance, or the related (its square root) standard deviation. For a random variable vector, Y made up of N scalar observations, y i i = 1 N , the sample standard deviation, σ Y , is defined as follows [27]:
σ Y = 1 N 1 N i = 1 y i μ Y 2 ,
where μ Y is the mean of Y, that is, i = 1 N y i / N .
The higher the standard deviation, the greater the variability of the distribution around its mean. The skewness, s Y , instead, provides a non-dimensional measure for the degree of asymmetry of a distribution around its mean. It is defined for the random variable Y as follows [27]:
s Y = 1 N σ Y 3 N i = 1 y i μ Y 3 ,
For a unimodal distribution, negative skewness indicates that the distribution is skewed to the left of the mean, whereas positive skewness is the opposite. A zero value means that the distribution is symmetric around the mean. For example, the normal distribution has a skewness equal to zero. The kurtosis, k Y , also a non-dimensional quantity, is related to the fourth moment. Quantifies how peaked or flat a distribution is. The index is defined for the random variable Y as follows [27]:
k Y = 1 N σ Y 4 N i = 1 y i μ Y 4 ,
Typically, distributions are gauged with respect to their fourth moment relative to the Gaussian distribution, for which k Y = 3 . A distribution with kurtosis greater than 3 is termed leptokurtic, and less than 3 is termed platykurtic. Leptokurtic distributions have heavier (fatter) tails than the normal distribution. In contrast, the tails of platykurtic distributions fall more rapidly than exp ( y 2 ) .
Next, we assess the correlation between the statistical indicators cited above and the SI averaged during the first wave. Given S = s i i = 1 N c representing the set of SIs of SIs of the average stringency indexes of N c , where N c indicates the total number of countries analyzed and M = m i i = 1 N c the related set of each synthetic index (moments, standard deviation, skewness, or kurtosis), we take advantage of the multivariate regression framework, which points out the possible linear correlation between S and M. Therefore, Pearson’s correlation coefficient, ρ S , M , is calculated to measure the linear correlation between S and M. It is defined as follows:
ρ S , M = σ S , M σ S σ M ,
where σ S and σ M are the two standard deviations for the two vectors N c S and M calculated as in Equation (2), and σ S , M is the sample covariance:
σ S , M = 1 N c 1 N c i = 1 s i μ S m i μ M ,
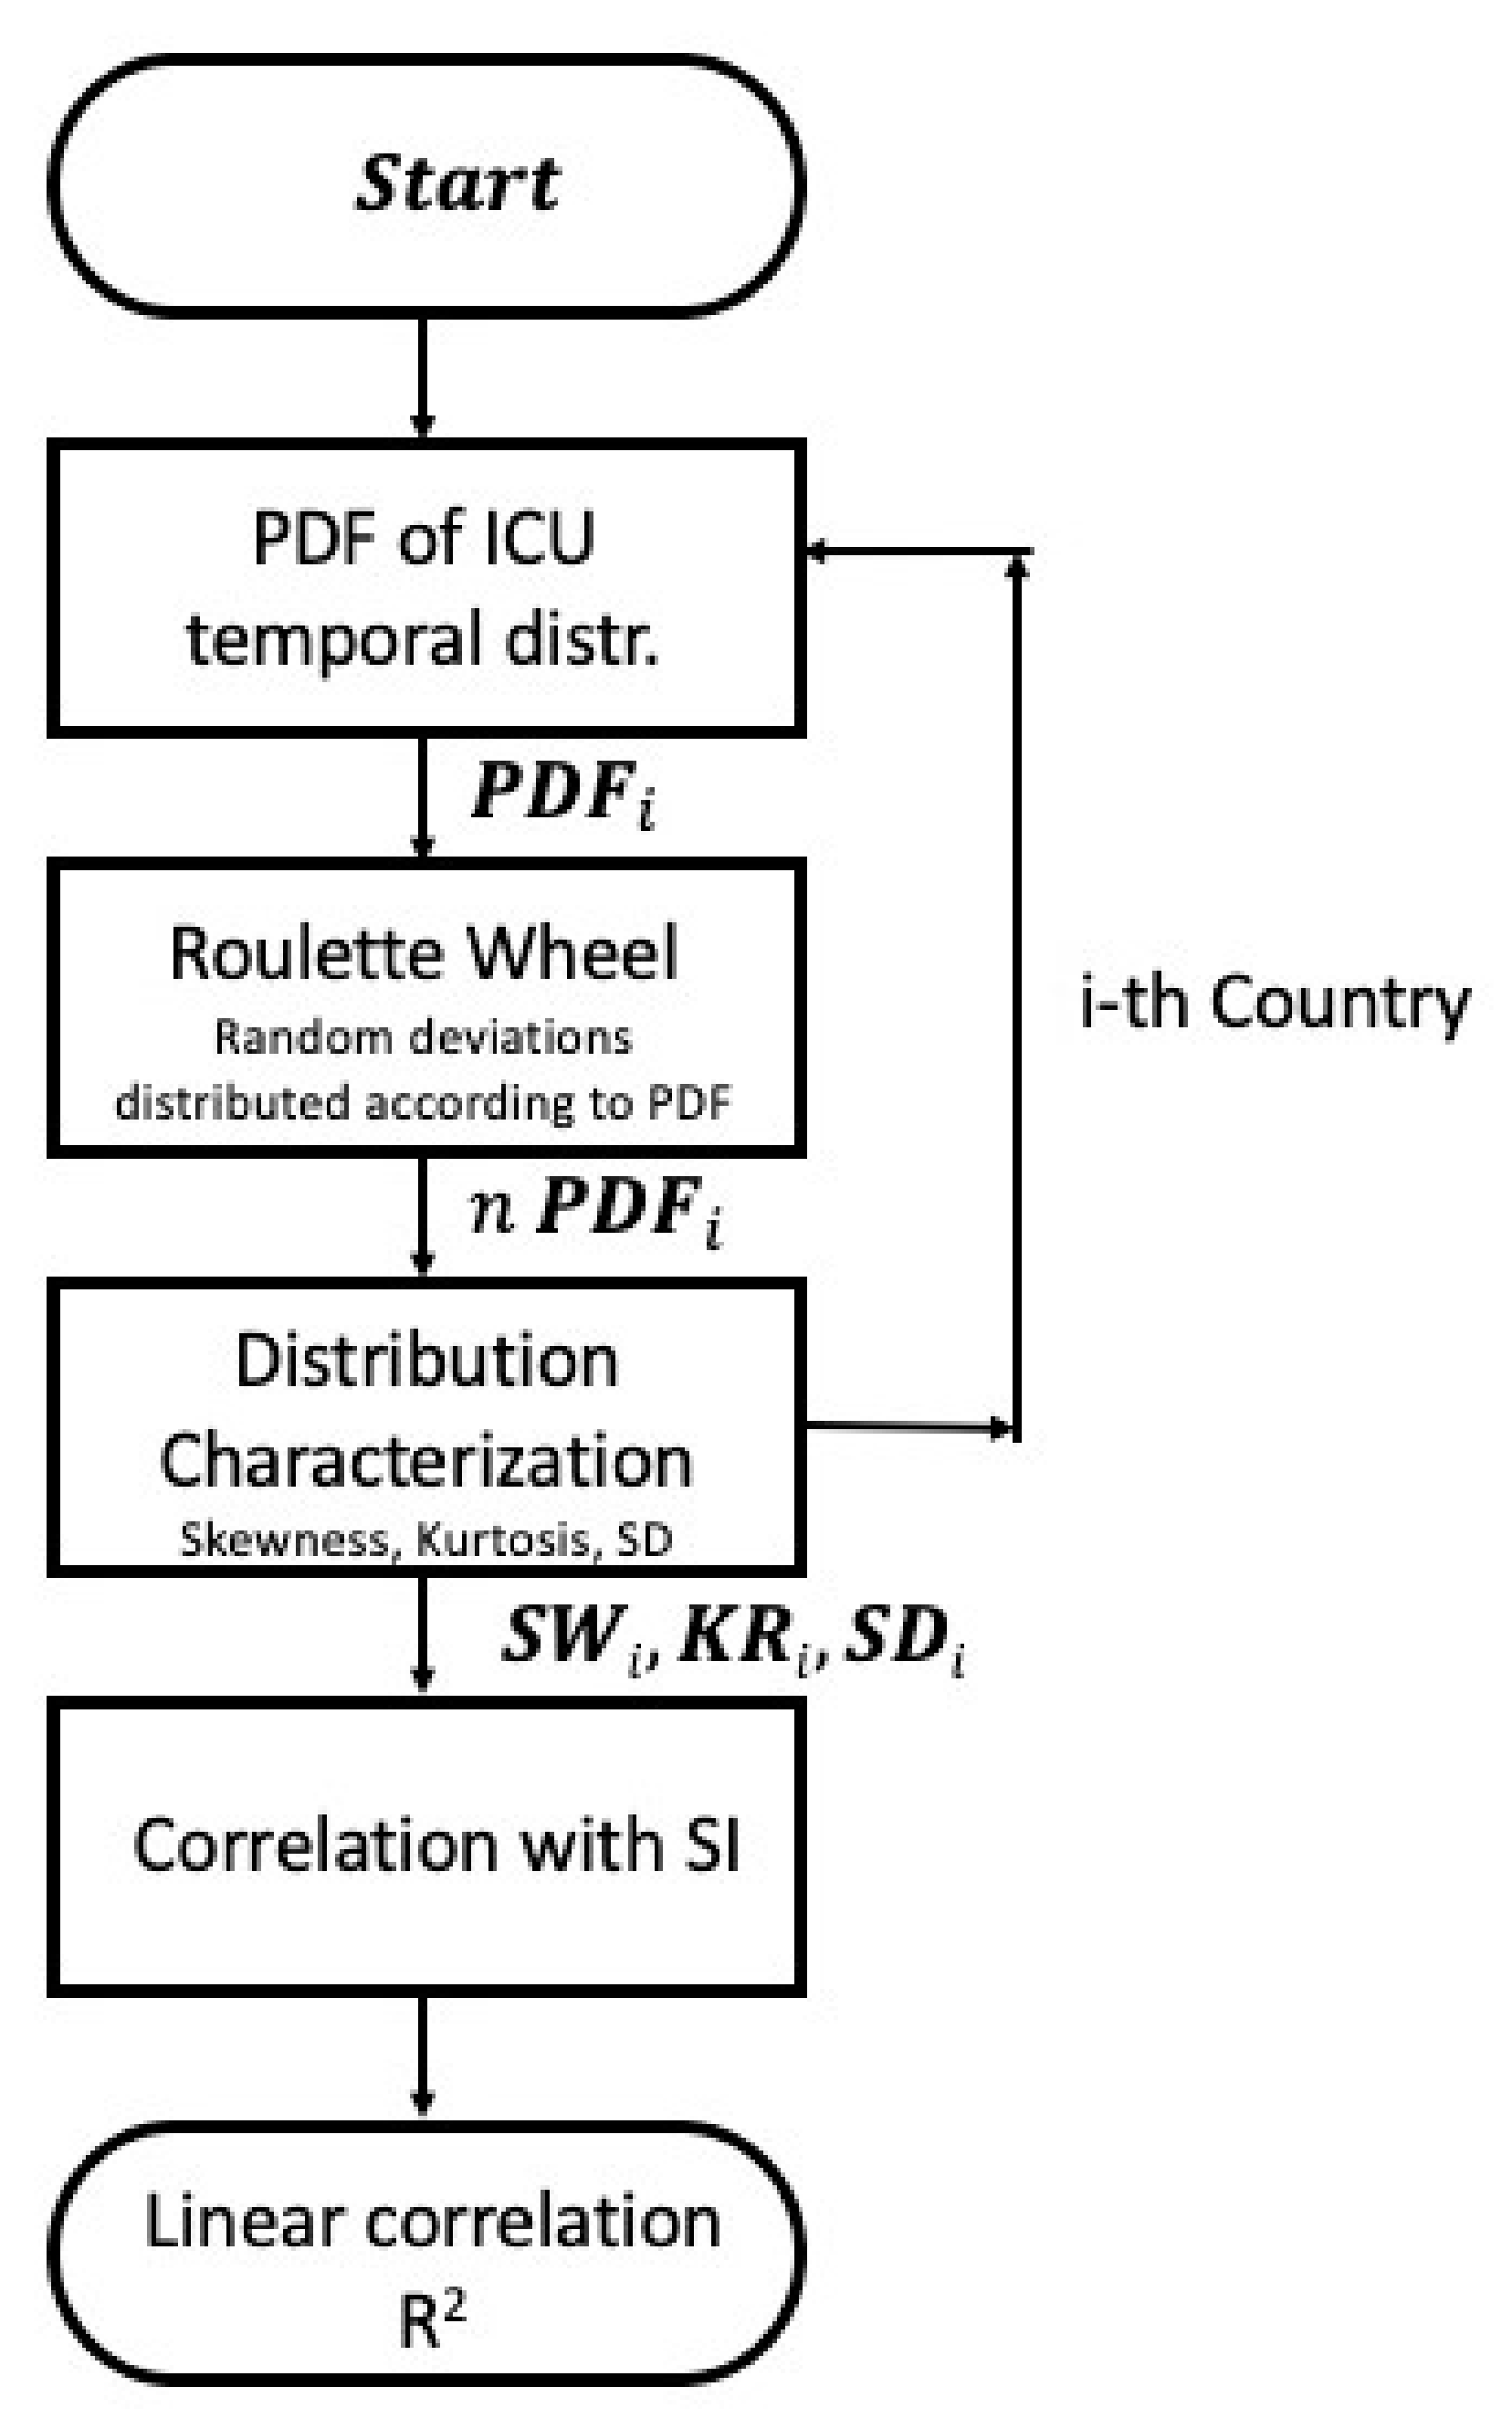
with μ S and μ M being the two sample means. The quantity ρ · , · is a normalized measure of covariance, so it always has a value between 1 and 1. It should be noted that this measure can only reflect a linear correlation of variables, ignoring other types of relationships. A value of 1 implies that there exists a linear equation that describes the relationship between S and M, with all data points along this line. The correlation sign is determined by the regression slope: a value of + 1 implies that all data points lie on a line for which M increases as S increases (that is, S and M are perfectly positively correlated), while for 1 S and M they are perfectly negatively correlated. A value of 0 implies that there is no linear dependency between the two variables. The different steps are depicted in Figure 2.
After identifying the indicators with a strong correlation with SI, we evaluate the significance level of these selected indicators. Specifically, while skewness may serve as a proxy for measuring the effectiveness of imposed restrictions, we need to determine the threshold value at which this index accurately indicates substantial effectiveness beyond the no-restrictions scenario. To address this concern, we examine the consistency of indicators showing a strong correlation with SI by analyzing pre-flu outbreaks. These outbreaks represent similar instances of respiratory virus spread in a country without restrictions. By assuming that SARS-CoV-2 affects the peak shape similarly to seasonal flu, we can compare the divergence in the selected indicators computed for both pre-pandemic flu outbreaks and the initial wave of the SARS-CoV-2 outbreak in a given country. This analysis enables us to determine whether the imposed restrictions yielded a significantly different effect compared to the no-restrictions scenario. In our study, we conducted this analysis for Italy using pre-pandemic flu outbreaks in the following years: 2014–2015, 2016–2017, 2017–2018 and 2018–2019.

3. Results

Before performing the statistical analysis, the normalized time series P i of hospitalizations for each country computed according to Equation (1) are shown in Figure 1. In Table 2, we report the values of the main associated shape indicators, that is, skewness, kurtosis, and standard deviation, and the stringency index for the countries under investigation.
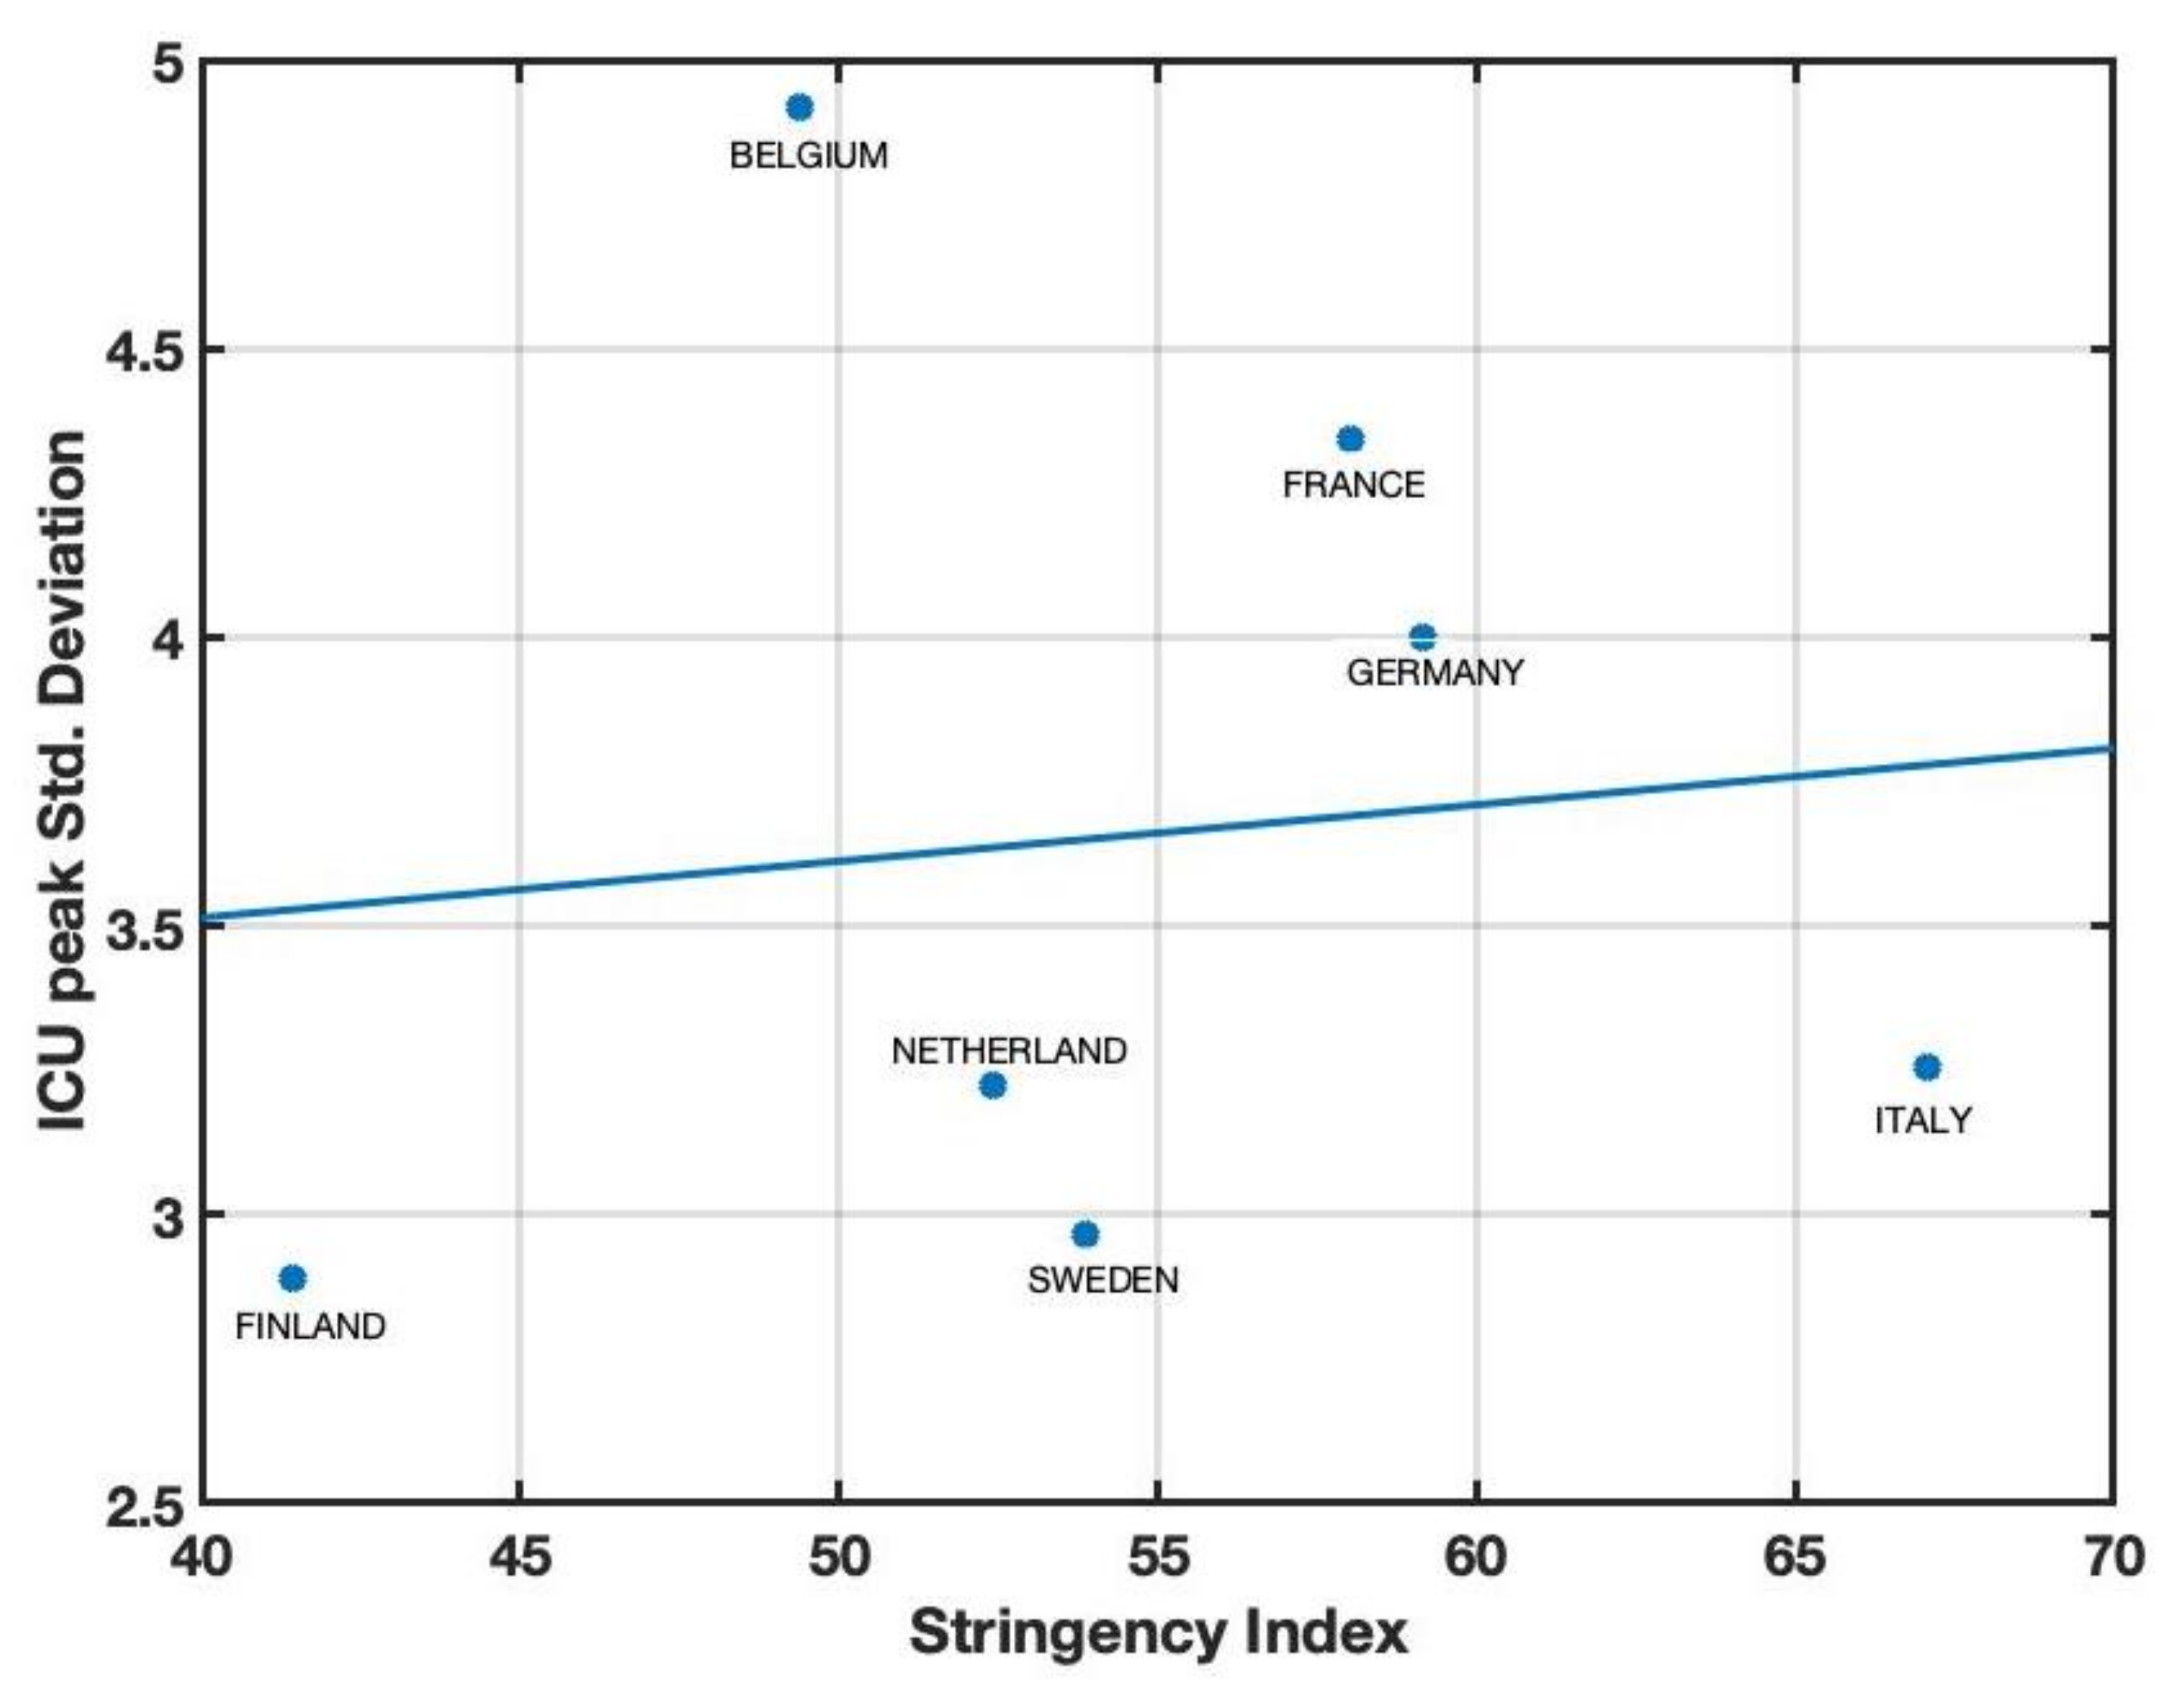
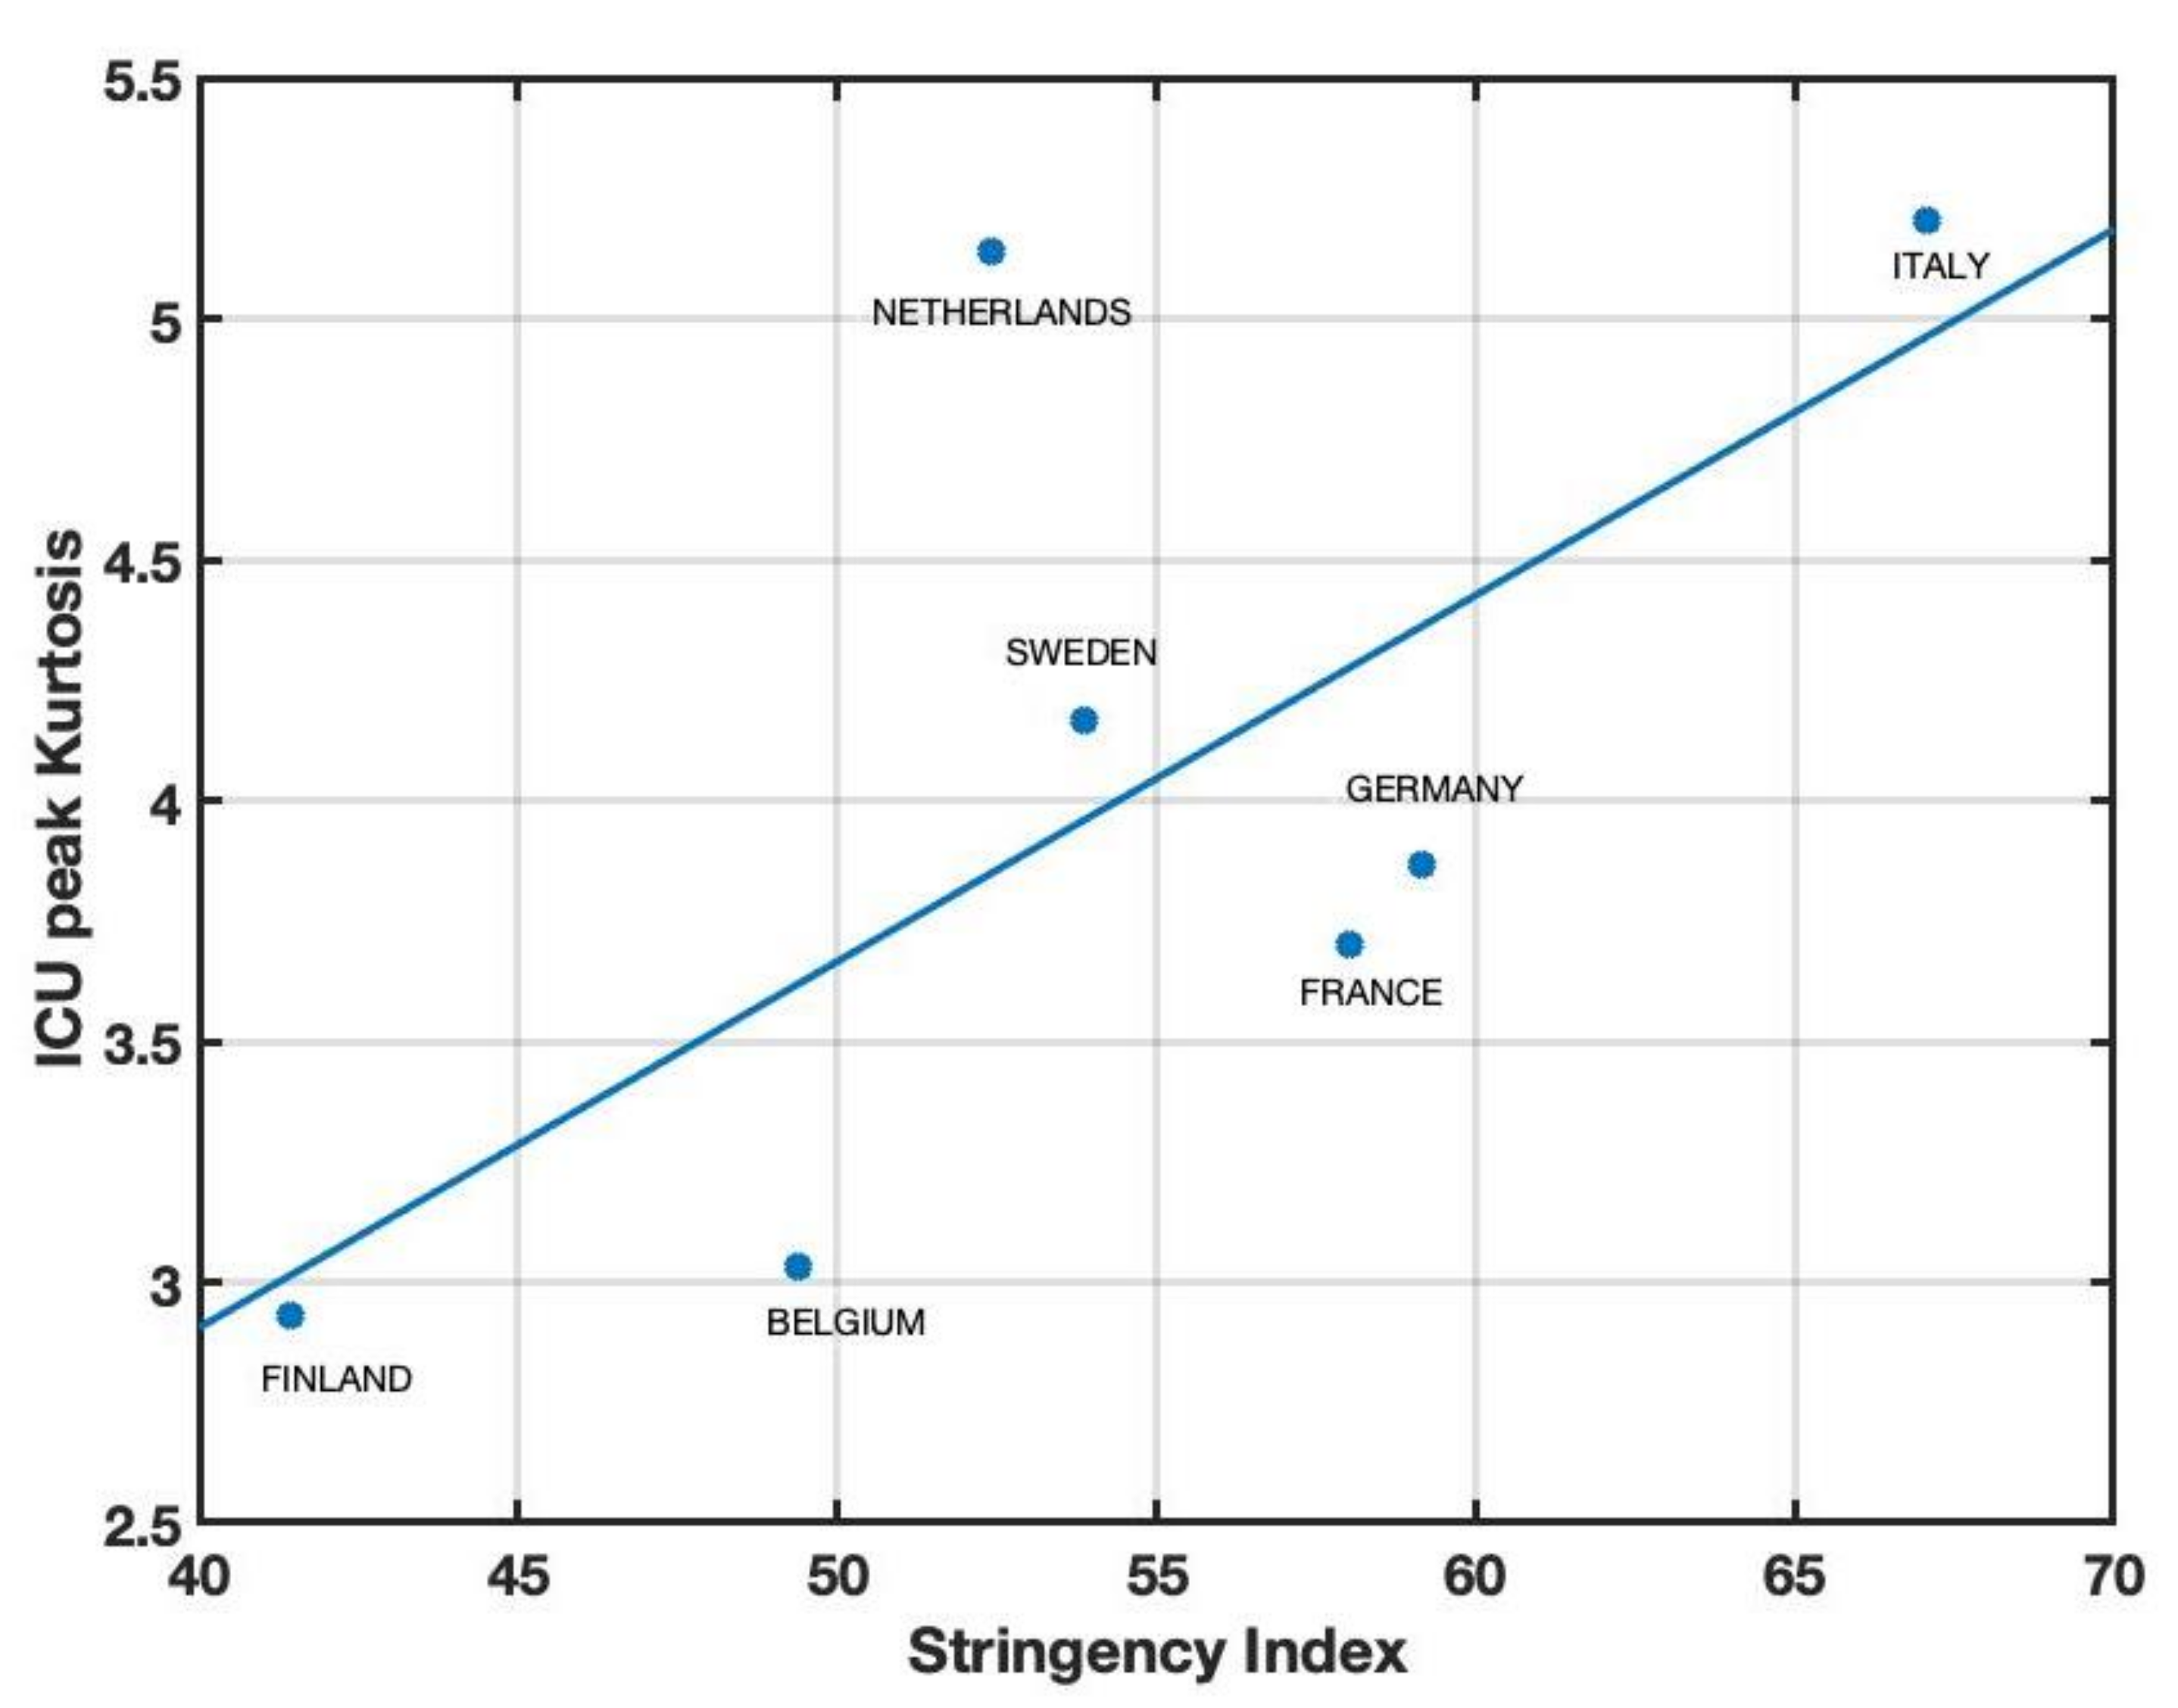
Figure 3, Figure 4 and Figure 5 show the multivariate regression of the statistical parameters computed through Equations (2)–(4) versus the stringency index. For the standard deviation, no significant correlation is found ( R 2 = 0.1 ).
Instead, the multivariate regression between kurtosis and the stringency index shows a certain degree of positive correlation, although it is rather weak ( R 2 = 0.67 ).
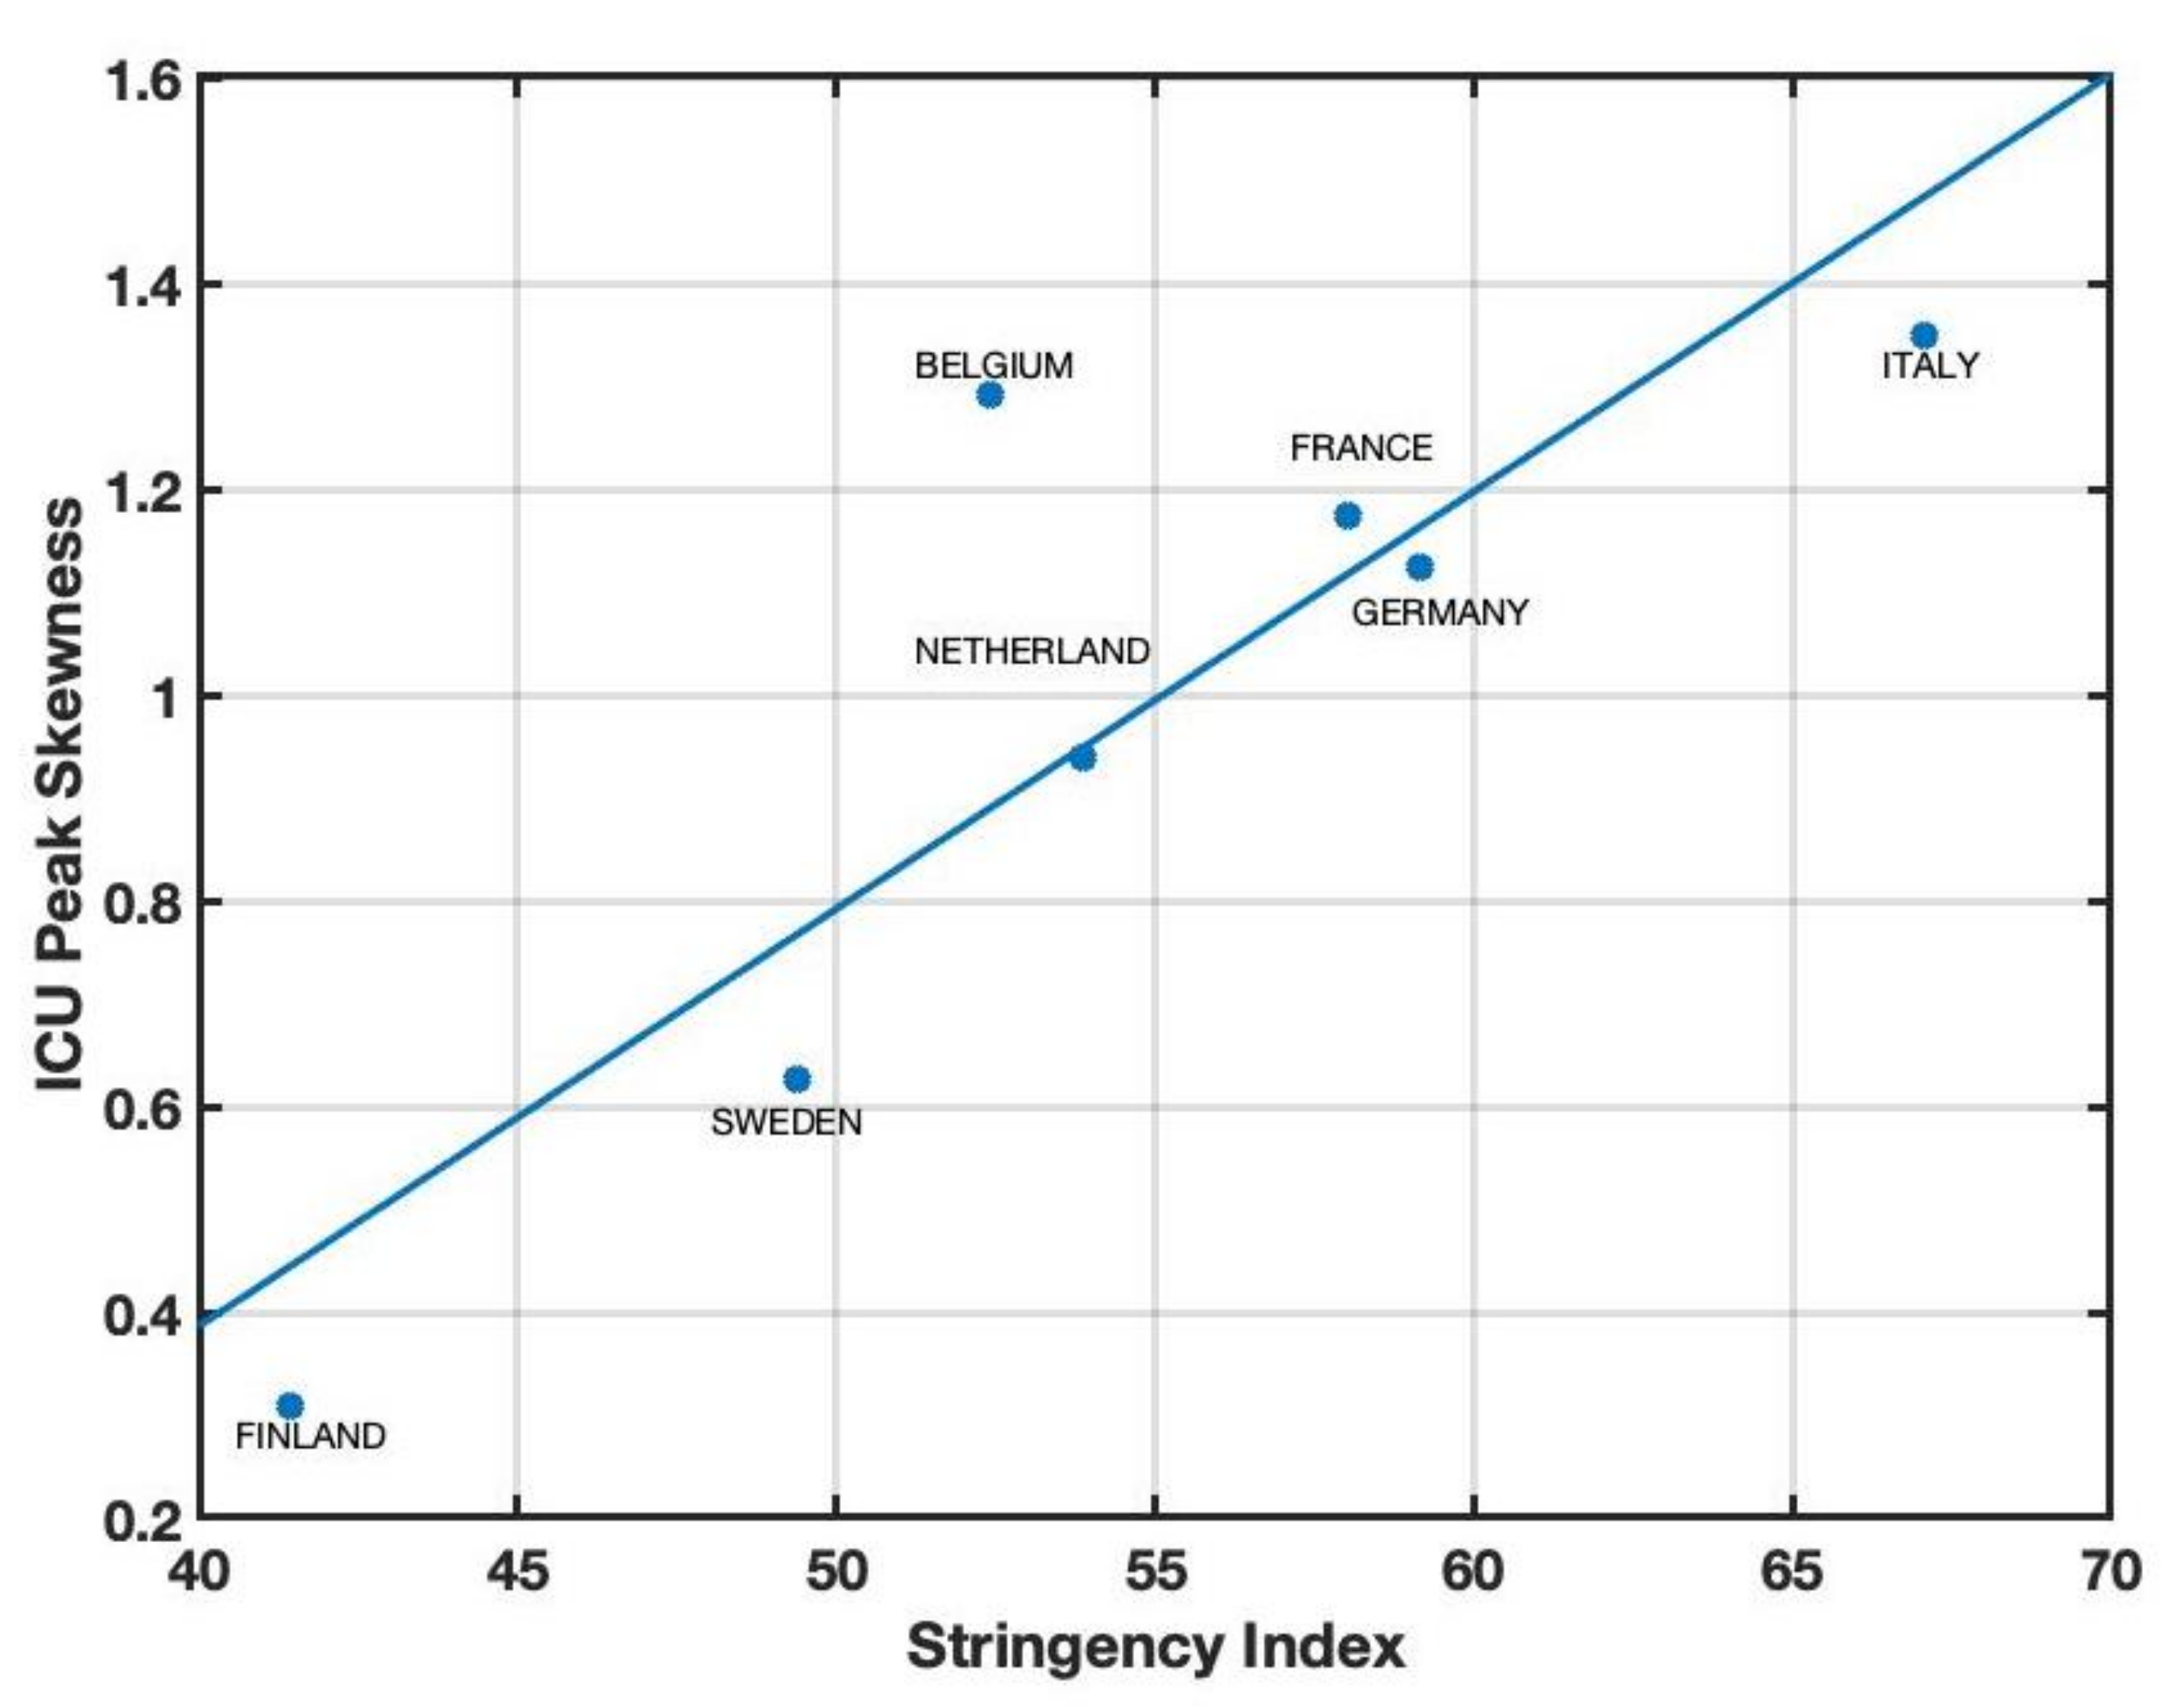
As shown in Figure 5, skewness refers to a distortion or asymmetry that deviates from the perfect symmetric bell-shaped trend and displays a higher degree of correlation with the SI index.
In this case, the multivariate regression indicates a high linear correlation between the skewness and the stringency index, with R 2 = 0.87 . This result implies that the stringency index accounts almost for 90% of the variability of the skewness. For this reason, this moment appears to be the most appropriate to assess the effects of restrictions on the pandemic outbreak. However, as stated previously, a correlation with SI does not prove that the statistical index can be considered a valid proxy for the restrictions implemented.
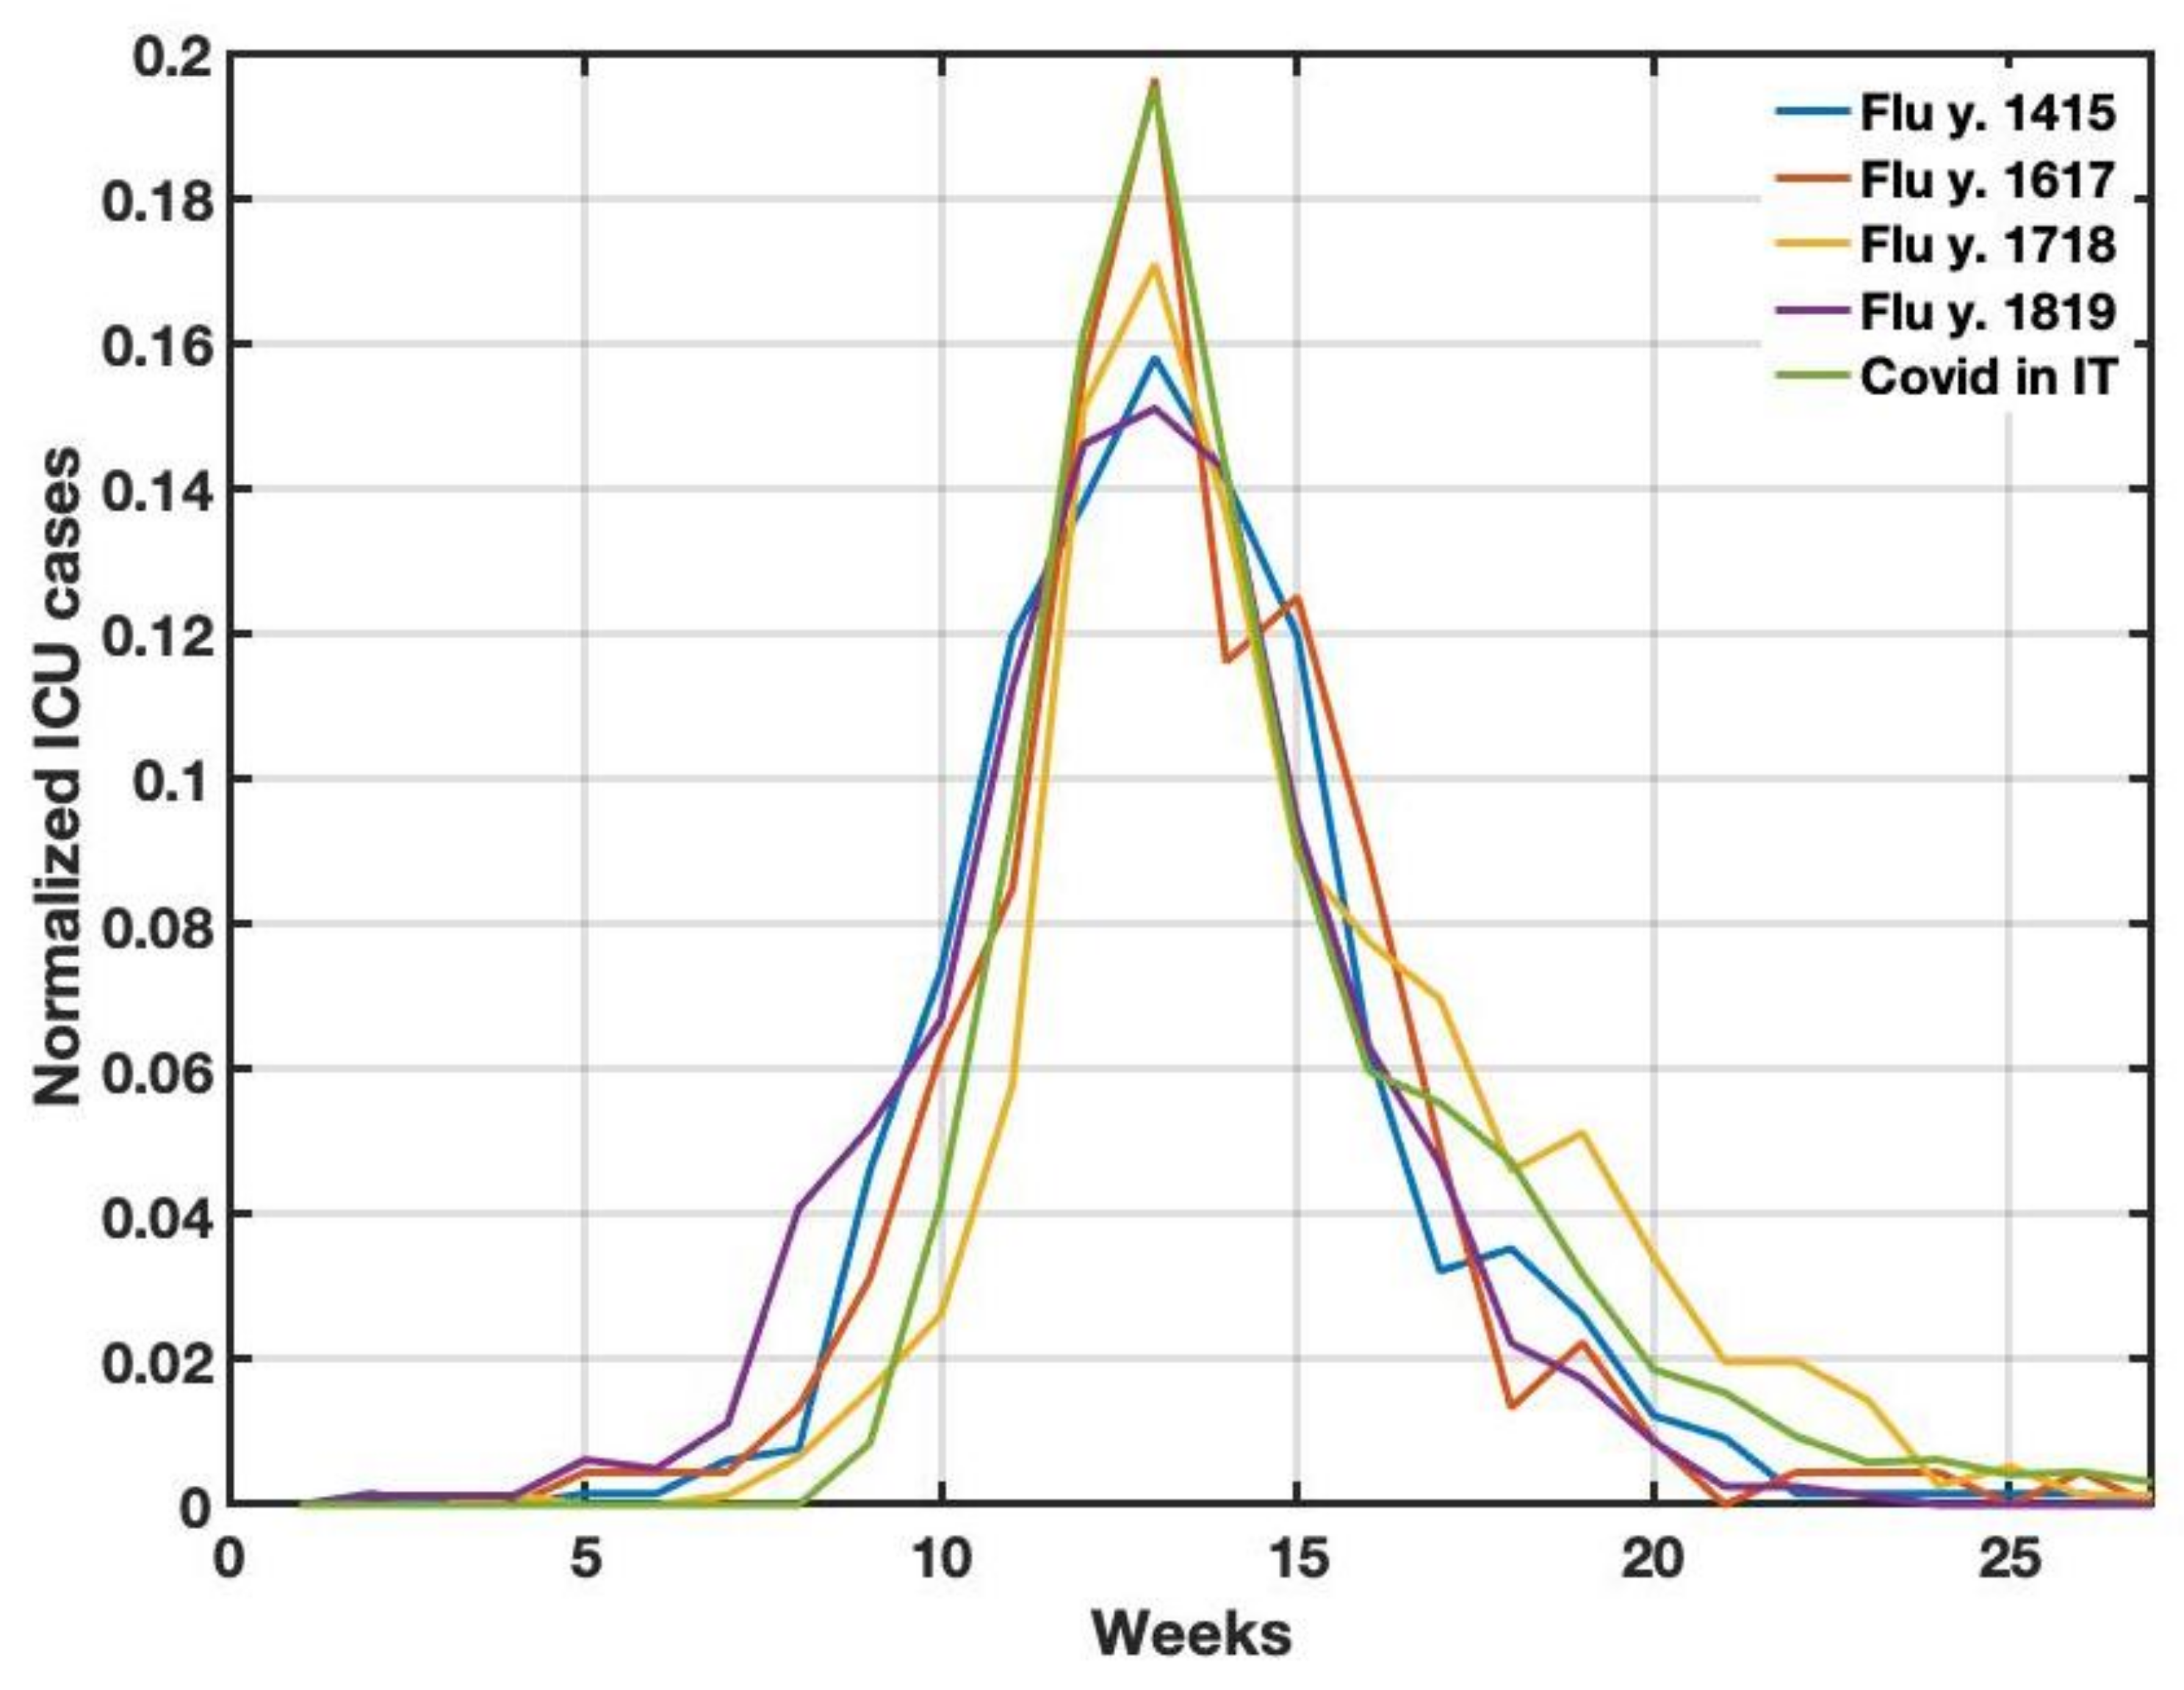
To test the consistency of skewness, we calculated the values of this moment for the time course related to non-pandemic flu outbreaks during 2014–2015, 2016–2017, 2017–2018, and 2018–2019 in Italy where no restrictions were applied, as shown in Figure 6.
The results (Table 3) highlight that the skewness values for the non-pandemic flu outbreaks are substantially different from those measured during the COVID-19 pandemic outbreak.

4. Discussion

In this article, we assess the efficacy of various governmental restrictions imposed across different nations in response to the recent outbreak of the COVID-19 pandemic. The assessment is based on a series of rigorous statistical computations that help to validate the usefulness of the strategic measures implemented.
A crucial aspect of our analysis is the choice of the variable temporal series used to depict the intensity and progression of the COVID-19 pandemic. To this end, we have chosen the weekly count of patients admitted to the Intensive Care Unit (ICU). The salience of this variable has previously been validated through numerous studies that have used it as an effective metric to capture the nuances of the COVID-19 outbreak [1]. This approach is different from previous studies which have based their analyses on variables or indices heavily influenced by policy decisions or test models [28].
We proceeded to normalize the time series of case numbers from various countries, implementing a temporal shift to ensure coincidence of ICU peaks (Figure 1). The metric used to evaluate the implemented restrictions is through a synthetic index, known as the stringency index (SI; [19]). The SI ranges from 0, indicative of no restrictions, to 100, signifying a complete lockdown. The preliminary step of our analytical framework involved examining the correlation between the fundamental statistical parameters that define the shape of the peak, skewness, kurtosis, and standard deviation, and the mean SI values during the initial outbreak of COVID-19 (January–May 2020). This phase was free of any influence of the vaccination campaigns. We discovered a significant correlation with skewness ( R 2 = 0.87 ), while standard deviation and kurtosis demonstrated a weaker ( R 2 = 0.1 ) and moderate ( R 2 = 0.67 ) correlation with SI, respectively.
In an extension of our analysis, we compared the skewness value of Italy during the COVID-19 period with the skewness values recorded for regular flu outbreaks before 2020 when no restrictions were in place. This comparison provided us with a quantifiable measure to determine whether skewness is a significant parameter genuinely impacted by the implemented restrictions. Interestingly, our findings revealed that for a typical flu, skewness was significantly lower, up to 70%, compared to the first wave of the COVID-19 outbreak, where societal restrictions were in place.
This discovery, particularly for Italy, implies that assuming that COVID-19 and normal flu outbreaks have similar patterns, the restrictions implemented considerably influenced the temporal trend of the distribution, thus altering the skewness around the peak. This correlation is a key insight that could help to formulate and adjust future policy decisions as the pandemic evolves.

5. Conclusions

The proposed research, different from analysis through epidemiological models that require assumptions about parameters (e.g., transmission rates), that uses actual data on COVID-19 cases and weekly ICU hospitalizations in different countries, which can provide more direct evidence of the impact of restrictions. Then, by examining the correlation between the statistical parameters of the weekly ICU time series and the stringency index, it is possible to infer the impact of government-imposed restrictions. Specifically, the proposed methodology focuses on scrutinizing the consequences of government-level interventions, distinguishing them from more general statistical investigations that explore a wide array of influences on COVID-19 outcomes. Therefore, this research provides a focused lens on the precise effect of policy decisions, providing valuable information on their efficacy. Analysis of the distribution during COVID-19 in Italy revealed that the left tail of the distribution appeared shorter compared to previous years. This discrepancy suggests the existence of a temporal delay of approximately 10 weeks in comparison to the preceding years. The shorter left tail implies a delay in the onset or accumulation of ICU cases during the COVID-19 period, relative to previous years. This finding highlights a distinctive pattern in the temporal dynamics of ICU cases, potentially attributable to the unique characteristics and impact of the COVID-19 pandemic. While we recognize that skewness alone may not directly indicate pandemic transmission, our analysis revealed a noteworthy correlation between skewness and the SI index, suggesting that implemented restrictions have influenced the asymmetry of the ICU admission time series. To strengthen this finding, we compared the skewness values of normal flu outbreaks, further highlighting the association between skewness and SI. These results provide valuable information on the impact of restrictions on the shape of the admission time series from the ICU. We acknowledge that more research is needed to fully understand the relationship between statistical parameters, pandemic transmission, and the efficacy of government interventions. However, our findings provide valuable evidence to assess the effects of restrictions on healthcare outcomes during the COVID-19 pandemic.
More research is also needed to elucidate the underlying factors that contribute to this observed delay and explore its implications for public health preparedness and intervention strategies. Understanding and interpreting these temporal changes in distribution can provide valuable information on the progression and severity of infectious disease outbreaks and inform timely decision-making processes to effectively mitigate their impact.
As a final statement, we can say that restrictions produced a measurable effect on the temporal trend of admissions to the ICU, but the effects are impossible to estimate in terms of reducing infection and saving lives. As stated above, a limitation of this study lies in the assumption that the normal flu and the COVID-19 pandemic have similar trends.
We again emphasize that the findings presented here, even if promising, are preliminary. A more comprehensive and nuanced analysis is essential to determine the extent of these observations. Specifically, it is imperative to investigate whether similar patterns and results can be observed not only in Europe but across different regions and contexts globally. It would be beneficial to validate these outcomes in various environmental, geographical, and socioeconomic settings to ensure that the conclusions drawn are universally applicable and not merely region specific.

Author Contributions

Conceptualization: S.L. and G.V., Methodology: S.L., G.V. and F.P., Software: S.L. and G.V., Validation: S.L., F.P. and G.V., Formal Analysis: S.L., F.P. and G.V., Investigation: S.L, F.P. and G.V., Data curation: S.L. and G.V., Original Draft Prerparation: S.L. and G.V., Writing—review and editing: S.L., F.P. and G.V. All authors have read and agreed to the published version of the manuscript.

Funding

This research received no external funding.

Institutional Review Board Statement

Not applicable.

Informed Consent Statement

Not applicable.

Data Availability Statement

Data are freely available at the websites indicated in the previous sections.

Conflicts of Interest

The authors declare no conflict of interest.

References

  1. Lolli, S.; Chen, Y.C.; Wang, S.H.; Vivone, G. Impact of meteorological conditions and air pollution on COVID-19 pandemic transmission in Italy. Sci. Rep. 2020, 10, 16213. [Google Scholar] [CrossRef] [PubMed]
  2. Lolli, S.; Vivone, G. The role of tropospheric ozone in flagging COVID-19 pandemic transmission. Bull. Atmos. Sci. Technol. 2020, 1, 551–555. [Google Scholar] [CrossRef]
  3. Aslam, B.; Khalil, U.; Azam, U.; Maqsoom, A. A correlation study between weather and atmosphere with COVID-19 pandemic in Islamabad, Pakistan. Spat. Inf. Res. 2021, 29, 605–613. [Google Scholar] [CrossRef]
  4. Bar, S.; Parida, B.R.; Mandal, S.P.; Pandey, A.C.; Kumar, N.; Mishra, B. Impacts of COVID-19 lockdown on NO2 and PM2.5 levels in major urban cities of Europe and USA. Cities 2021, 117, 103308. [Google Scholar] [CrossRef] [PubMed]
  5. Bhawar, R.; Fadnavis, S.S.; Kumar, V.; Rahul, P.; Sinha, T.; Lolli, S. Radiative impacts of aerosols during COVID-19 lockdown period over the Indian region. Front. Environ. Sci. 2021, 9, 746090. [Google Scholar] [CrossRef]
  6. Meo, S.A.; Abukhalaf, A.A.; Sami, W.; Hoang, T.D. Effect of environmental pollution PM2.5, carbon monoxide, and ozone on the incidence and mortality due to SARS-CoV-2 infection in London, United Kingdom. J. King Saud Univ.-Sci. 2021, 33, 101373. [Google Scholar]
  7. Sangkham, S.; Thongtip, S.; Vongruang, P. Influence of air pollution and meteorological factors on the spread of COVID-19 in the Bangkok Metropolitan Region and air quality during the outbreak. Environ. Res. 2021, 197, 111104. [Google Scholar] [CrossRef]
  8. Lolli, S. Is the Air Too Polluted for Outdoor Activities? Check by Using Your Photovoltaic System as an Air-Quality Monitoring Device. Sensors 2021, 21, 6342. [Google Scholar] [CrossRef]
  9. Bontempi, E.; Vergalli, S.; Squazzoni, F. Understanding COVID-19 diffusion requires an interdisciplinary, multi-dimensional approach. Environ. Res. 2020, 188, 109814. [Google Scholar] [CrossRef]
  10. Tisdell, C.A. Economic, social and political issues raised by the COVID-19 pandemic. Econ. Anal. Policy 2020, 68, 17–28. [Google Scholar] [CrossRef]
  11. Yu, X.; Yang, R. COVID-19 transmission through asymptomatic carriers is a challenge to containment. Influenza Other Respir. Viruses 2020, 14, 474. [Google Scholar] [CrossRef]
  12. Flaxman, S.; Mishra, S.; Gandy, A.; Unwin, H.J.T.; Mellan, T.A.; Coupland, H.; Whittaker, C.; Zhu, H.; Berah, T.; Eaton, J.W.; et al. Estimating the effects of non-pharmaceutical interventions on COVID-19 in Europe. Nature 2020, 584, 257–261. [Google Scholar] [CrossRef]
  13. Chaudhry, R.; Dranitsaris, G.; Mubashir, T.; Bartoszko, J.; Riazi, S. A country level analysis measuring the impact of government actions, country preparedness and socioeconomic factors on COVID-19 mortality and related health outcomes. EClinicalMedicine 2020, 25, 100464. [Google Scholar] [CrossRef]
  14. Hsiang, S.; Allen, D.; Annan-Phan, S.; Bell, K.; Bolliger, I.; Chong, T.; Druckenmiller, H.; Huang, L.Y.; Hultgren, A.; Krasovich, E.; et al. The effect of large-scale anti-contagion policies on the COVID-19 pandemic. Nature 2020, 584, 262–267. [Google Scholar] [CrossRef]
  15. Courtemanche, C.; Garuccio, J.; Le, A.; Pinkston, J.; Yelowitz, A. Strong Social Distancing Measures In The United States Reduced The COVID-19 Growth Rate: Study evaluates the impact of social distancing measures on the growth rate of confirmed COVID-19 cases across the United States. Health Aff. 2020, 39, 1237–1246. [Google Scholar] [CrossRef]
  16. Tian, H.; Liu, Y.; Li, Y.; Wu, C.H.; Chen, B.; Kraemer, M.U.; Li, B.; Cai, J.; Xu, B.; Yang, Q.; et al. An investigation of transmission control measures during the first 50 days of the COVID-19 epidemic in China. Science 2020, 368, 638–642. [Google Scholar] [CrossRef]
  17. Candido, D.S.; Claro, I.M.; De Jesus, J.G.; Souza, W.M.; Moreira, F.R.; Dellicour, S.; Mellan, T.A.; Du Plessis, L.; Pereira, R.H.; Sales, F.C.; et al. Evolution and epidemic spread of SARS-CoV-2 in Brazil. Science 2020, 369, 1255–1260. [Google Scholar] [CrossRef]
  18. Ferretti, L.; Wymant, C.; Kendall, M.; Zhao, L.; Nurtay, A.; Abeler-Dörner, L.; Parker, M.; Bonsall, D.; Fraser, C. Quantifying SARS-CoV-2 transmission suggests epidemic control with digital contact tracing. Science 2020, 368, eabb6936. [Google Scholar] [CrossRef]
  19. Hale, T.; Angrist, N.; Goldszmidt, R.; Kira, B.; Petherick, A.; Phillips, T.; Webster, S.; Cameron-Blake, E.; Hallas, L.; Majumdar, S.; et al. A global panel database of pandemic policies (Oxford COVID-19 Government Response Tracker). Nat. Hum. Behav. 2021, 5, 529–538. [Google Scholar] [CrossRef]
  20. Nicola, M.; Alsafi, Z.; Sohrabi, C.; Kerwan, A.; Al-Jabir, A.; Iosifidis, C.; Agha, M.; Agha, R. The socio-economic implications of the coronavirus pandemic (COVID-19): A review. Int. J. Surg. 2020, 78, 185–193. [Google Scholar] [CrossRef]
  21. Horton, R. The COVID-19 Catastrophe: What’s Gone Wrong and How to Stop It Happening Again; Polity Press: Cambridge, UK, 2020. [Google Scholar]
  22. Ioannidis, J.P. Coronavirus disease 2019: The harms of exaggerated information and non-evidence-based measures. Eur. J. Clin. Investig. 2020, 50, e13222. [Google Scholar] [CrossRef] [PubMed]
  23. Wang, C.; Wang, D.; Abbas, J.; Duan, K.; Mubeen, R. Global financial crisis, smart lockdown strategies, and the COVID-19 spillover impacts: A global perspective implications from Southeast Asia. Front. Psychiatry 2021, 12, 643783. [Google Scholar] [CrossRef] [PubMed]
  24. Brooks, S.K.; Webster, R.K.; Smith, L.E.; Woodland, L.; Wessely, S.; Greenberg, N.; Rubin, G.J. The psychological impact of quarantine and how to reduce it: Rapid review of the evidence. Lancet 2020, 395, 912–920. [Google Scholar] [CrossRef] [PubMed]
  25. Bambra, C.; Riordan, R.; Ford, J.; Matthews, F. COVID-19 and the gender health paradox. Scand. J. Public Health 2020, 49, 19–27. [Google Scholar] [CrossRef]
  26. Haug, N.; Geyrhofer, L.; Londei, A.; Dervic, E.; Desvars-Larrive, A.; Loreto, V.; Pinior, B.; Thurner, S.; Klimek, P. Ranking the effectiveness of worldwide COVID-19 government interventions. Nat. Hum. Behav. 2020, 4, 1303–1312. [Google Scholar] [CrossRef]
  27. Evans, M.; Hastings, N.; Peacock, B.; Forbes, C. Statistical Distributions; John Wiley & Sons: New York, NY, USA, 2011. [Google Scholar]
  28. Di Domenico, L.; Pullano, G.; Sabbatini, C.E.; Boëlle, P.Y.; Colizza, V. Impact of lockdown on COVID-19 epidemic in Île-de-France and possible exit strategies. BMC Med. 2020, 18, 240. [Google Scholar] [CrossRef]
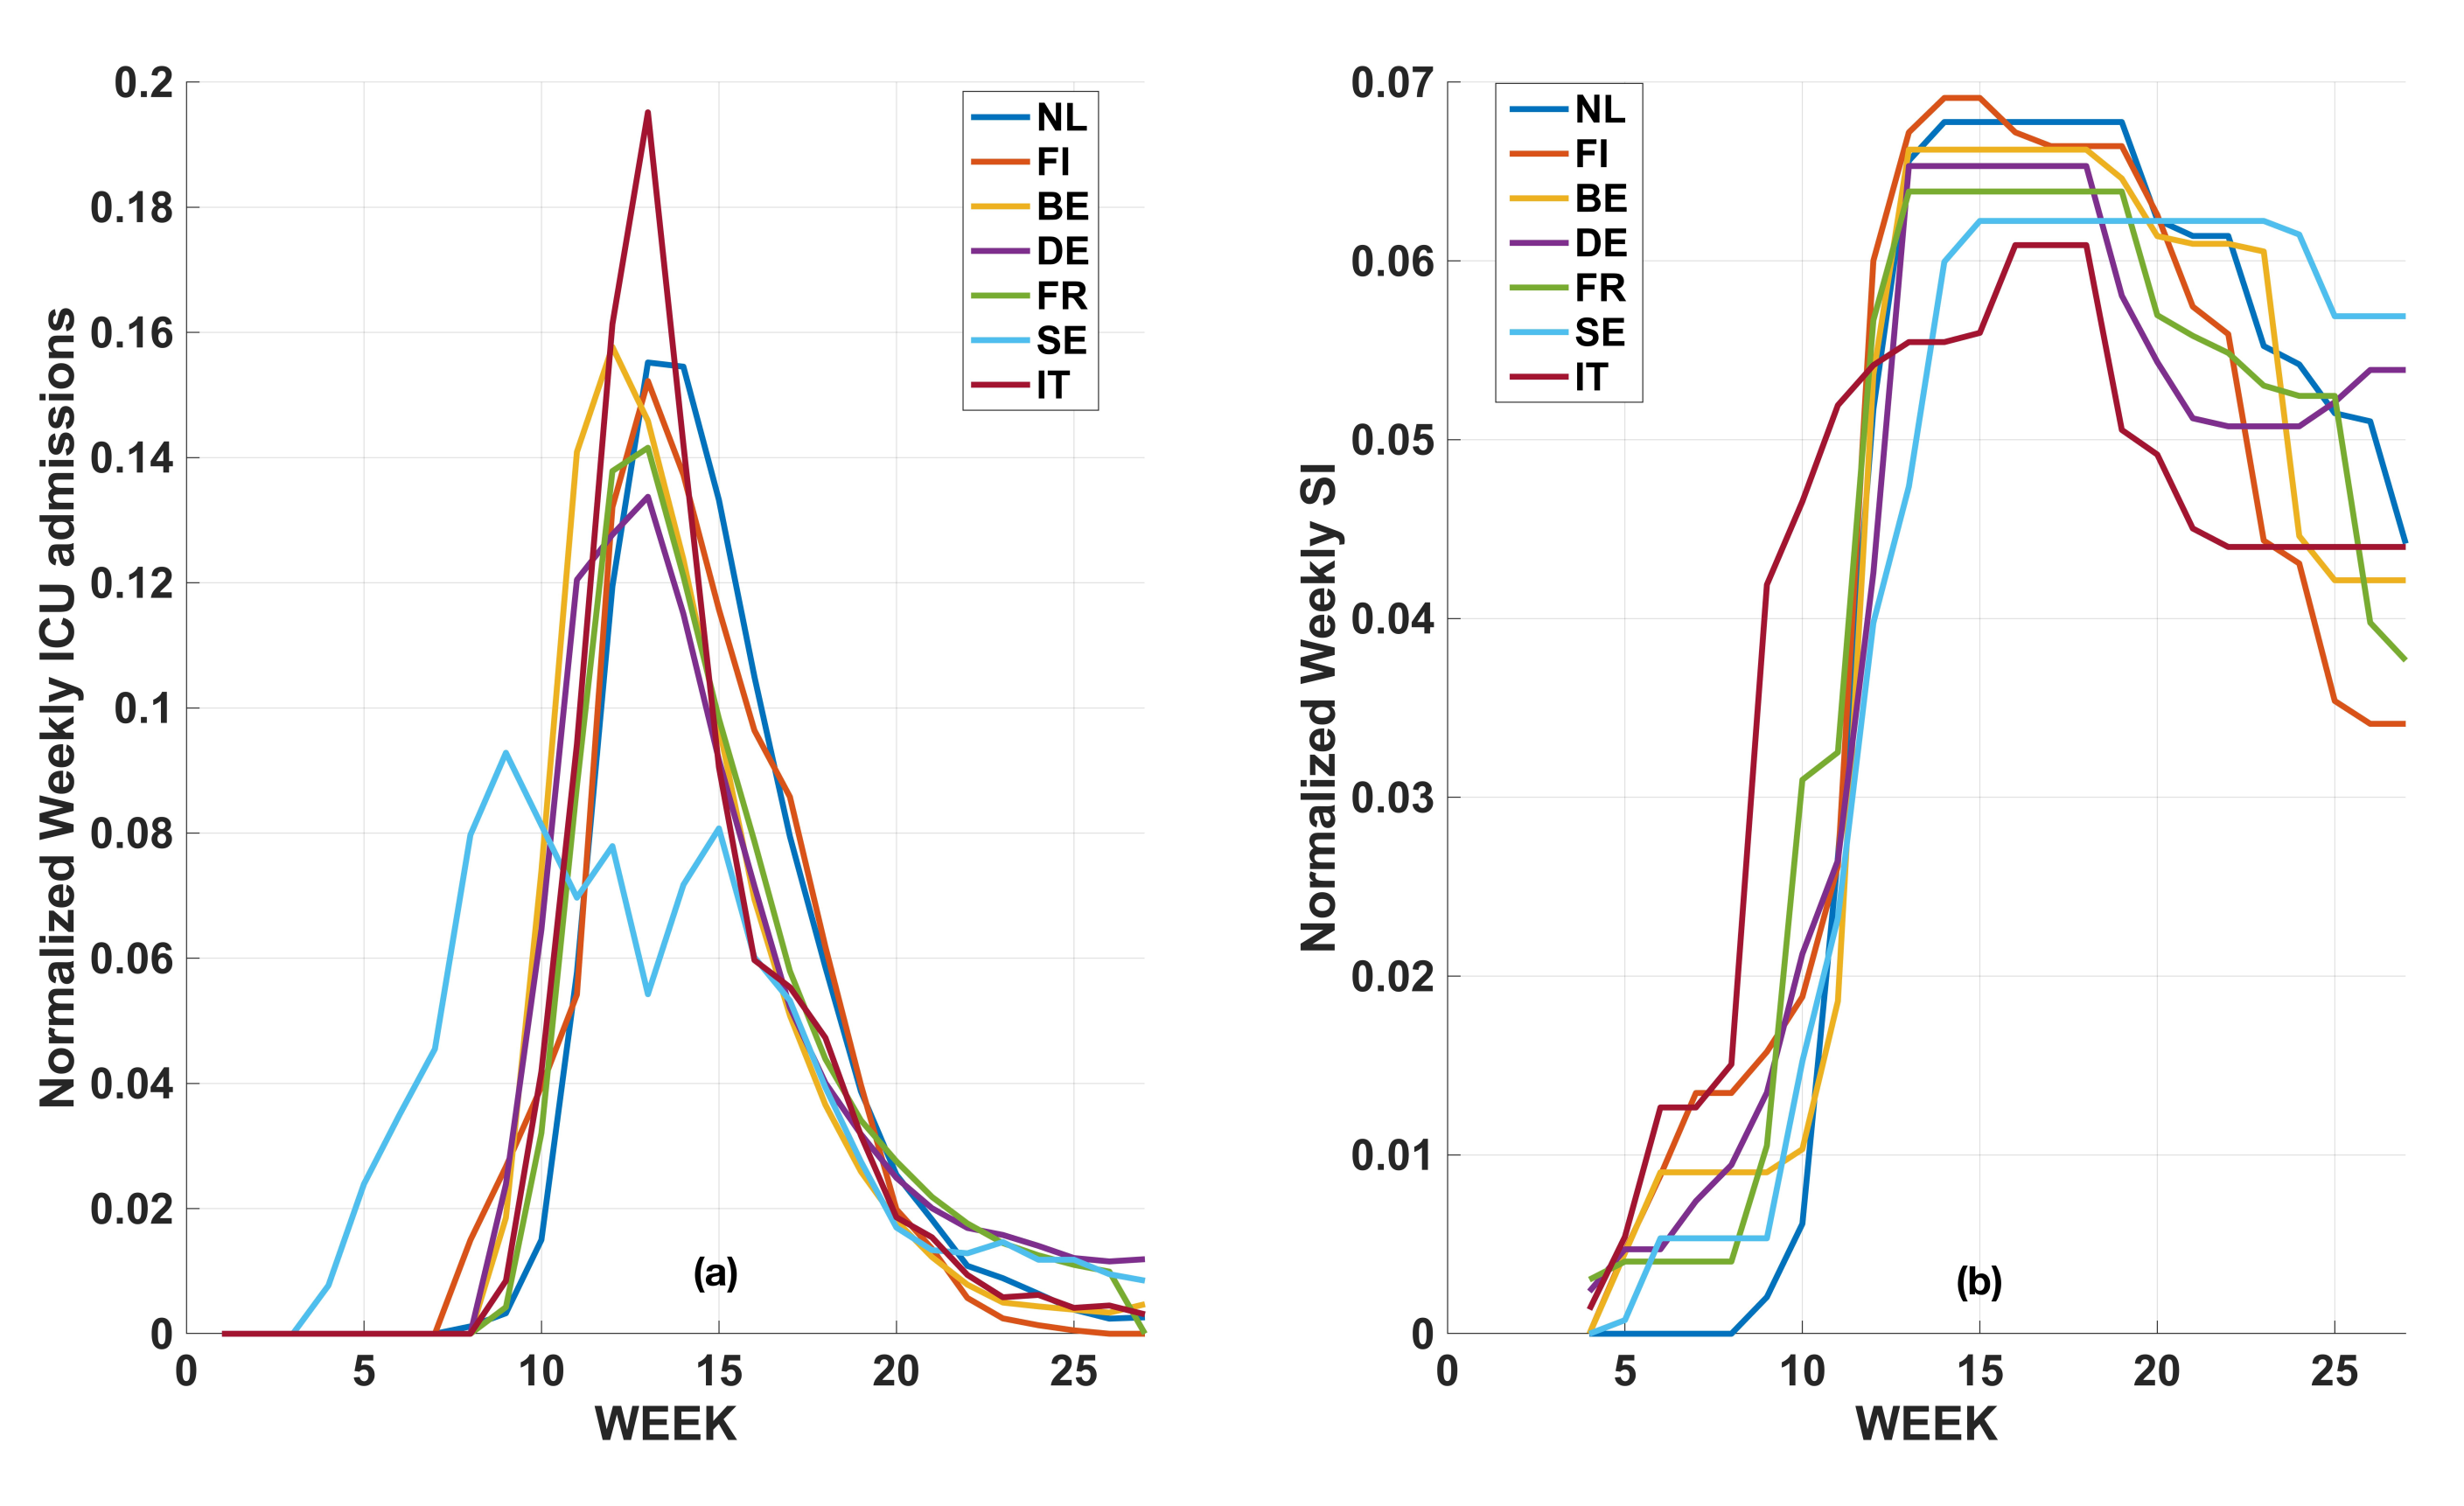
Figure 1. (a) Weekly ICU patient number time series for the seven analyzed western European countries normalized according to Equation (1) and arranged. (b) same as (a), but for the stringency index.
Covid 03 00079 g001
Figure 2. Flowchart of the proposed algorithm. For each country, the Probability Density Function is retrieved. Then, through the Roulette Wheel algorithm, we resampled the ICU temporal distribution. Then, the statistical parameters are computed and the linear correlations vs. the stringency index are tested.
Covid 03 00079 g002
Figure 3. Correlation Std. deviation vs. SI. The multivariate regression between the stringency index and the standard deviation.
Covid 03 00079 g003
Figure 4. Correlation kurtosis vs. SI. The multivariate regression between the stringency index and the kurtosis.
Covid 03 00079 g004
Figure 5. Correlation skewness vs. SI. The multivariate regression between the stringency index and the skewness.
Covid 03 00079 g005
Figure 6. Time series for normal flu versus COVID-19. Time course of patients for normal flu (2014–2015, 2016–2017, 2017–2018, 2018–2019) and for the first COVID-19 outbreak.
Covid 03 00079 g006
Table 1. Main indicators contributing to the stringency index value: 0 no restrictions, 100 full lockdown.
Indicator
School Closing
Workplace Closing
Canceling Public Events
Restriction on gathering size
Close Public Transport
Stay at Home Requirements
Restrictions on Internal Movements
Restrictions on International Travels
Table 2. Statistical parameters and SI.
CountrySkewnessKurtosisStd. Dev.SI
Belgium1.295.143.2252.40
Finland0.302.922.8941.45
France1.173.704.3458.02
Germany1.123.874.0059.14
Italy1.345.203.2567.06
Sweden0.623.034.9249.40
The Netherlands0.934.162.9653.88
Table 3. Skewness of the peak for normal flu and COVID-19 outbreaks. COVID-19 skewness is highlighted, as it shows a much higher value with respect to the normal flu values.
YearSkewness
2014–20150.53
2016–20170.58
2017–20180.77
2018–20190.39
COVID-19 20201.35
Disclaimer/Publisher’s Note: The statements, opinions and data contained in all publications are solely those of the individual author(s) and contributor(s) and not of MDPI and/or the editor(s). MDPI and/or the editor(s) disclaim responsibility for any injury to people or property resulting from any ideas, methods, instructions or products referred to in the content.