Article

Eating Habits and Mental Health of College Students in Japan during the COVID-19 Pandemic

1
Graduate School of Agricultural Science, Tohoku University, Sendai 980-8572, Japan
2
Faculty of Human Informatics, Aichi Shukutoku University, Nagakute 480-1197, Japan
*
Author to whom correspondence should be addressed.
COVID 2023, 3(12), 1721-1732; https://doi.org/10.3390/covid3120119
Submission received: 19 September 2023 / Revised: 21 November 2023 / Accepted: 24 November 2023 / Published: 26 November 2023

Abstract

:
While the relationship between eating habits and mental health has been widely studied, there is limited research focusing on college students during emergency situations such as pandemics. We conducted an online questionnaire survey to address this gap. Clustering analysis was applied to identify students’ eating habits, which are possibly more complex than traditional eating habits. Based on the identified eating habits, the students were separated into five groups. We evaluated the relationship between eating habits and mental health in these five groups using University Personality Inventory scores. Based on the results, the largest group—corresponding to slightly less than half of the participants—had the highest vegetable intake and mental health levels. This aligns with findings from numerous prior studies. However, our novel discovery was the presence of another group within those with higher vegetable intake, who had lower levels of mental health. Conversely, a group with lower vegetable intake had higher levels of mental health; remarkably, students in this group frequently consumed soft drinks, suggesting that, during the COVID-19 emergency, indulgent food and drinks may have played a role in enhancing mental health.

1. Introduction

The pandemic due to the Coronavirus infectious disease that emerged in 2019 (COVID-19) has impacted various spheres of life. In several countries, social lockdowns were implemented as part of infection control measures. While Japan did not enforce a lockdown, citizens were encouraged to exercise self-restraint and reduce outings. These infection control measures led to changes in people’s behavior owing to the restrictions imposed on their movement. With limited opportunities for grocery shopping and dining out as a result of restrictions, significant changes were observed in eating habits. Indeed, a study conducted in Italy shed light on the alterations in eating habits during the COVID-19 pandemic [1,2]. Generally, eating habits have been found to influence not only physical but also mental health [3,4].
In this study, we focused specifically on college students. Some college students left their hometowns and started living alone when they entered college; thus, this can be a period when individuals first experience autonomy with regard to meals. In Japan, face-to-face lectures and extracurricular activities were suspended whenever a governmental state of emergency owing to COVID-19 was declared, making it difficult for students to lead a normal university life. The uncertainty of college life can have a great psychological impact. Even before the COVID-19 pandemic, social anxiety disorder was already observed in young people, raising the risk of depression [5]. Adolescent depression frequently continues until young adulthood [6]. College students are among the most prone to mental health problems; in the United States, approximately 71% experienced increased stress and anxiety owing to COVID-19 [7]. This is consistent with the survey conducted by the National Federation of University Cooperative Associations in Japan [8]; therefore, support to prevent depression is an important strategy in addressing this critical issue for college students [9,10].
The number of studies addressing the relationship between eating habits and mental health has increased. A particularly significant eating habit is skipping breakfast, known to affect students’ grades and motivation; this situation was further worsened by the COVID-19 pandemic [11]. In 25 international studies, the rate of skipping breakfast ranged from 14% to 88% [12]. In addition, eating habits and food quality, such as processed foods, were reported to affect mental instability [13], and Japanese-style delicatessen, rich in potatoes, mushrooms, and vegetables, was reported to enhance health-related quality of life in a study of female university students [14]. Furthermore, Tominaga et al. showed that mental health levels were related to consumed food items [15].
These previous studies support the relationship between eating habits and mental health for individual foods and/or the framework of traditional eating habits, such as Japanese food or the Mediterranean diet. In this study, we focused on combining the consumed food items because of the diversification of eating habits owing to the global development of food transportation, offering various choices not previously available. Therefore, a binary classification—for example, traditional/non-traditional—may not be sufficient to assess this type of complexity. Likewise, there is little knowledge on the relationship between eating habits and mental health during the COVID-19 pandemic. Hence, we examine the relationship between eating habits and mental health in the presence and absence of a state of COVID-19 pandemic emergency. Our results have the potential to clarify adequate dietary content and possible ways to contribute to reducing the prevalence of mental health disorders among college students, including anxiety during pandemic and/or extreme novel epidemic situations, especially given that the yearly probability of occurrence could increase up to threefold in the coming decades [16].

2. Materials and Methods

2.1. Survey Design and Participants

We recruited participants for the online survey, conducted using Google Forms, from Tohoku University. At the time of the survey—December 2020—no state of emergency had been issued, and extracurricular activities were possible at Tohoku University. At the same time, we used the recall method [17,18] to seek information pertaining to April to May 2020—the first time that a state of COVID-19 pandemic emergency was declared in Japan—with the same survey form. One hundred and three students responded by the given deadline.

2.2. Survey Questionnaire on Eating Habits

Our survey used questions related to the participants’ eating habits and intake frequency for each food item (Food Frequency Questionnaire). The food items were taken from Isobe et al.’s [19] study on the food habits of university students (rice, meat, fish, eggs, soybeans, vegetables, green and yellow vegetables, fruits, fried foods, potatoes, milk, soft drinks). Isobe’s 12 food items were based on Ikeda et al. [20], who used 19 items for a survey of older adults. Furthermore, we incorporated three food items—wheat-based foods, instant foods, and alcoholic beverages—used in Ikeda et al. [20] but not in Isobe et al. [19]. The remaining four food items used in Ikeda et al. [20], suitable only for older adults, were not used in this study. We further added two items—snacks and fermented foods—to the current list of 15 food items. The reasons that we focused on these two items are as follows. First, some students prefer to eat snacks instead of meals [21]. Second, as the sales of fermented foods increased during the COVID-19 pandemic [22], we assumed that they were consumed by students because they were highly conscious about their health, as well as for their potential to inhibit viral infection [23]. There were five categories of frequency: not eating at all (1 point), eating once or twice a week (2 points), eating once in two or three days (3 points), eating once a day (4 points), and eating twice a day (almost every meal) (5 points). Additionally, our questionnaire included which food item’s intake increased under the state of emergency (increase or no change); we subsequently calculated the percentage of “increase” responses for each group, explained in the next section.

2.3. Questionnaire on Mental Health

Mental health was assessed using the University Personality Inventory (UPI) [24]. The UPI is commonly used in management offices for student health care to evaluate the mental health of university students in Japan [15]. For example, Tsudajuku University conducted its first survey in 1969 to support a better student life over the long term [25]. The UPI has 60 items to evaluate university students’ physical and mental complaints. Previously, Sakai [26] investigated the use of a smaller number of UPI items and selected 12 items from 60 items, which we used in our questionnaire. With regard to evaluating the impact of the COVID-19 pandemic, we conducted a pilot interview survey with 20 students to determine the items for the evaluation of mental health during the pandemic. As a result, the five items mentioned by multiple individuals were used as survey items in the UPIC; thus, our questionnaire consisted of 17 items.
Table 1 shows the UPI items. The six items of “I feel tired”, “I have no appetite”, “I get tired easily”, “I am having trouble with sleeplessness”, “My eyes feel tired”, and “I feel dizzy or as if I am about to collapse” pertain to the physical aspect of the UPI (UPIP). The six items of “I have emotional ups and downs”, “Being pessimistic”, “Feeling too lethargic to do anything”, “Sometimes anxious or worried about the present or future”, “Loneliness”, and “Having no one I feel free to talk with about what bothers me” pertain to the mental aspect of the UPI (UPIM). The five COVID-19-related items (UPIC) are “I feel uneasy about my income owing to poor economic conditions”, “I want to restart my current school year even if I take a leave of absence or have to repeat a year”, “I don’t fully understand local governments’ system of infection control and inspection”, “I’m worried about getting infected with COVID-19”, and “I may neglect infection control measures”. The UPI total score (UPIT) is the sum of all 17 items. Participants answered the applicable items in the UPI both at the time of the state of emergency and at the time of the investigation (Table 2). Each item checked was given 1 point, resulting in the highest possible score of 17, equivalent to the lowest level of mental health. As mentioned above, there are four types of UPI score—UPIP, UPIM, UPIC, and UPIT—with the addition of “e” representing the state of emergency and “n” representing at the time of the investigation (not under the state of emergency).
We also investigated the health and dietary awareness of each student. The questionnaire included five categories of awareness: not conscious at all (1 point), not very conscious (2 points), average (3 points), conscious (4 points), and quite conscious (5 points).

2.4. Cluster Analysis to Determine the Relationships between Eating Habits and Mental Health

In determining the relationships, we chose hierarchical cluster analysis and heatmap visualization. We performed a cluster analysis of the matrix consisting of participants (horizontal) and food intake frequency for each item (vertical). The heatmap was described based on the results of this cluster analysis (Figure 1). For the cluster analysis of the items’ intake frequency, we transformed them into an adjusted standard deviation score using the following formula.
Adjusted standard deviation score = 10 × deviation/standard deviation + 50
College students’ eating habits were characterized using a cluster analysis. To enhance the interpretability of the results, we narrowed down the items under consideration. Carbohydrates were represented by rice, which had the highest frequency of consumption, while protein was represented by meat. Regarding beverages, alcohol was excluded owing to the inclusion of students below the legal drinking age. Fried and instant foods were included, taking into account the eating habits of college students. Finally, we selected rice, meat, vegetables, green and yellow vegetables, fried food, instant food, and the added food items: snacks and fermented food.

2.5. Statistical Analysis

We displayed the distributions of the UPI scores (UPITe, UPIPe, UPIMn, and UPIMe) using boxplots including the median ± interquartile values (Figures 2 and 3). Statistical analysis was performed using a one-way analysis of variance followed by the Tukey–Kramer test. All statistical analyses were considered significant at p < 0.10, <0.05, <0.01, and <0.001.

2.6. Ethical Considerations

This study was approved by the Department of Agriculture Tohoku University IRB Committee (approval number 21-A-03). Informed consent was obtained from all subjects involved in the study. Responses were anonymous, and no email addresses were collected.

3. Results

3.1. Descriptive Statistics

Two participants had substantial missing values; after excluding them, 101 questionnaires were used for the analysis. The number of male and female participants was 53 (52.5%) and 48 (47.5%), respectively. The number of participants in the first year was 18 (17.8%), second was 15 (14.9%), third was 57 (56.4%), and fourth was 11 (10.9%). The average age was 20.6 years. Female participants tended to have lower levels of mental health compared to male participants (Table 3). Furthermore, mental health levels tended to be lower during a state of emergency. When examining the results by academic year, students of lower academic years tended to have lower levels of mental health (Table 4). In particular, first-year students showed the lowest level of mental health across all aspects during the state of emergency.

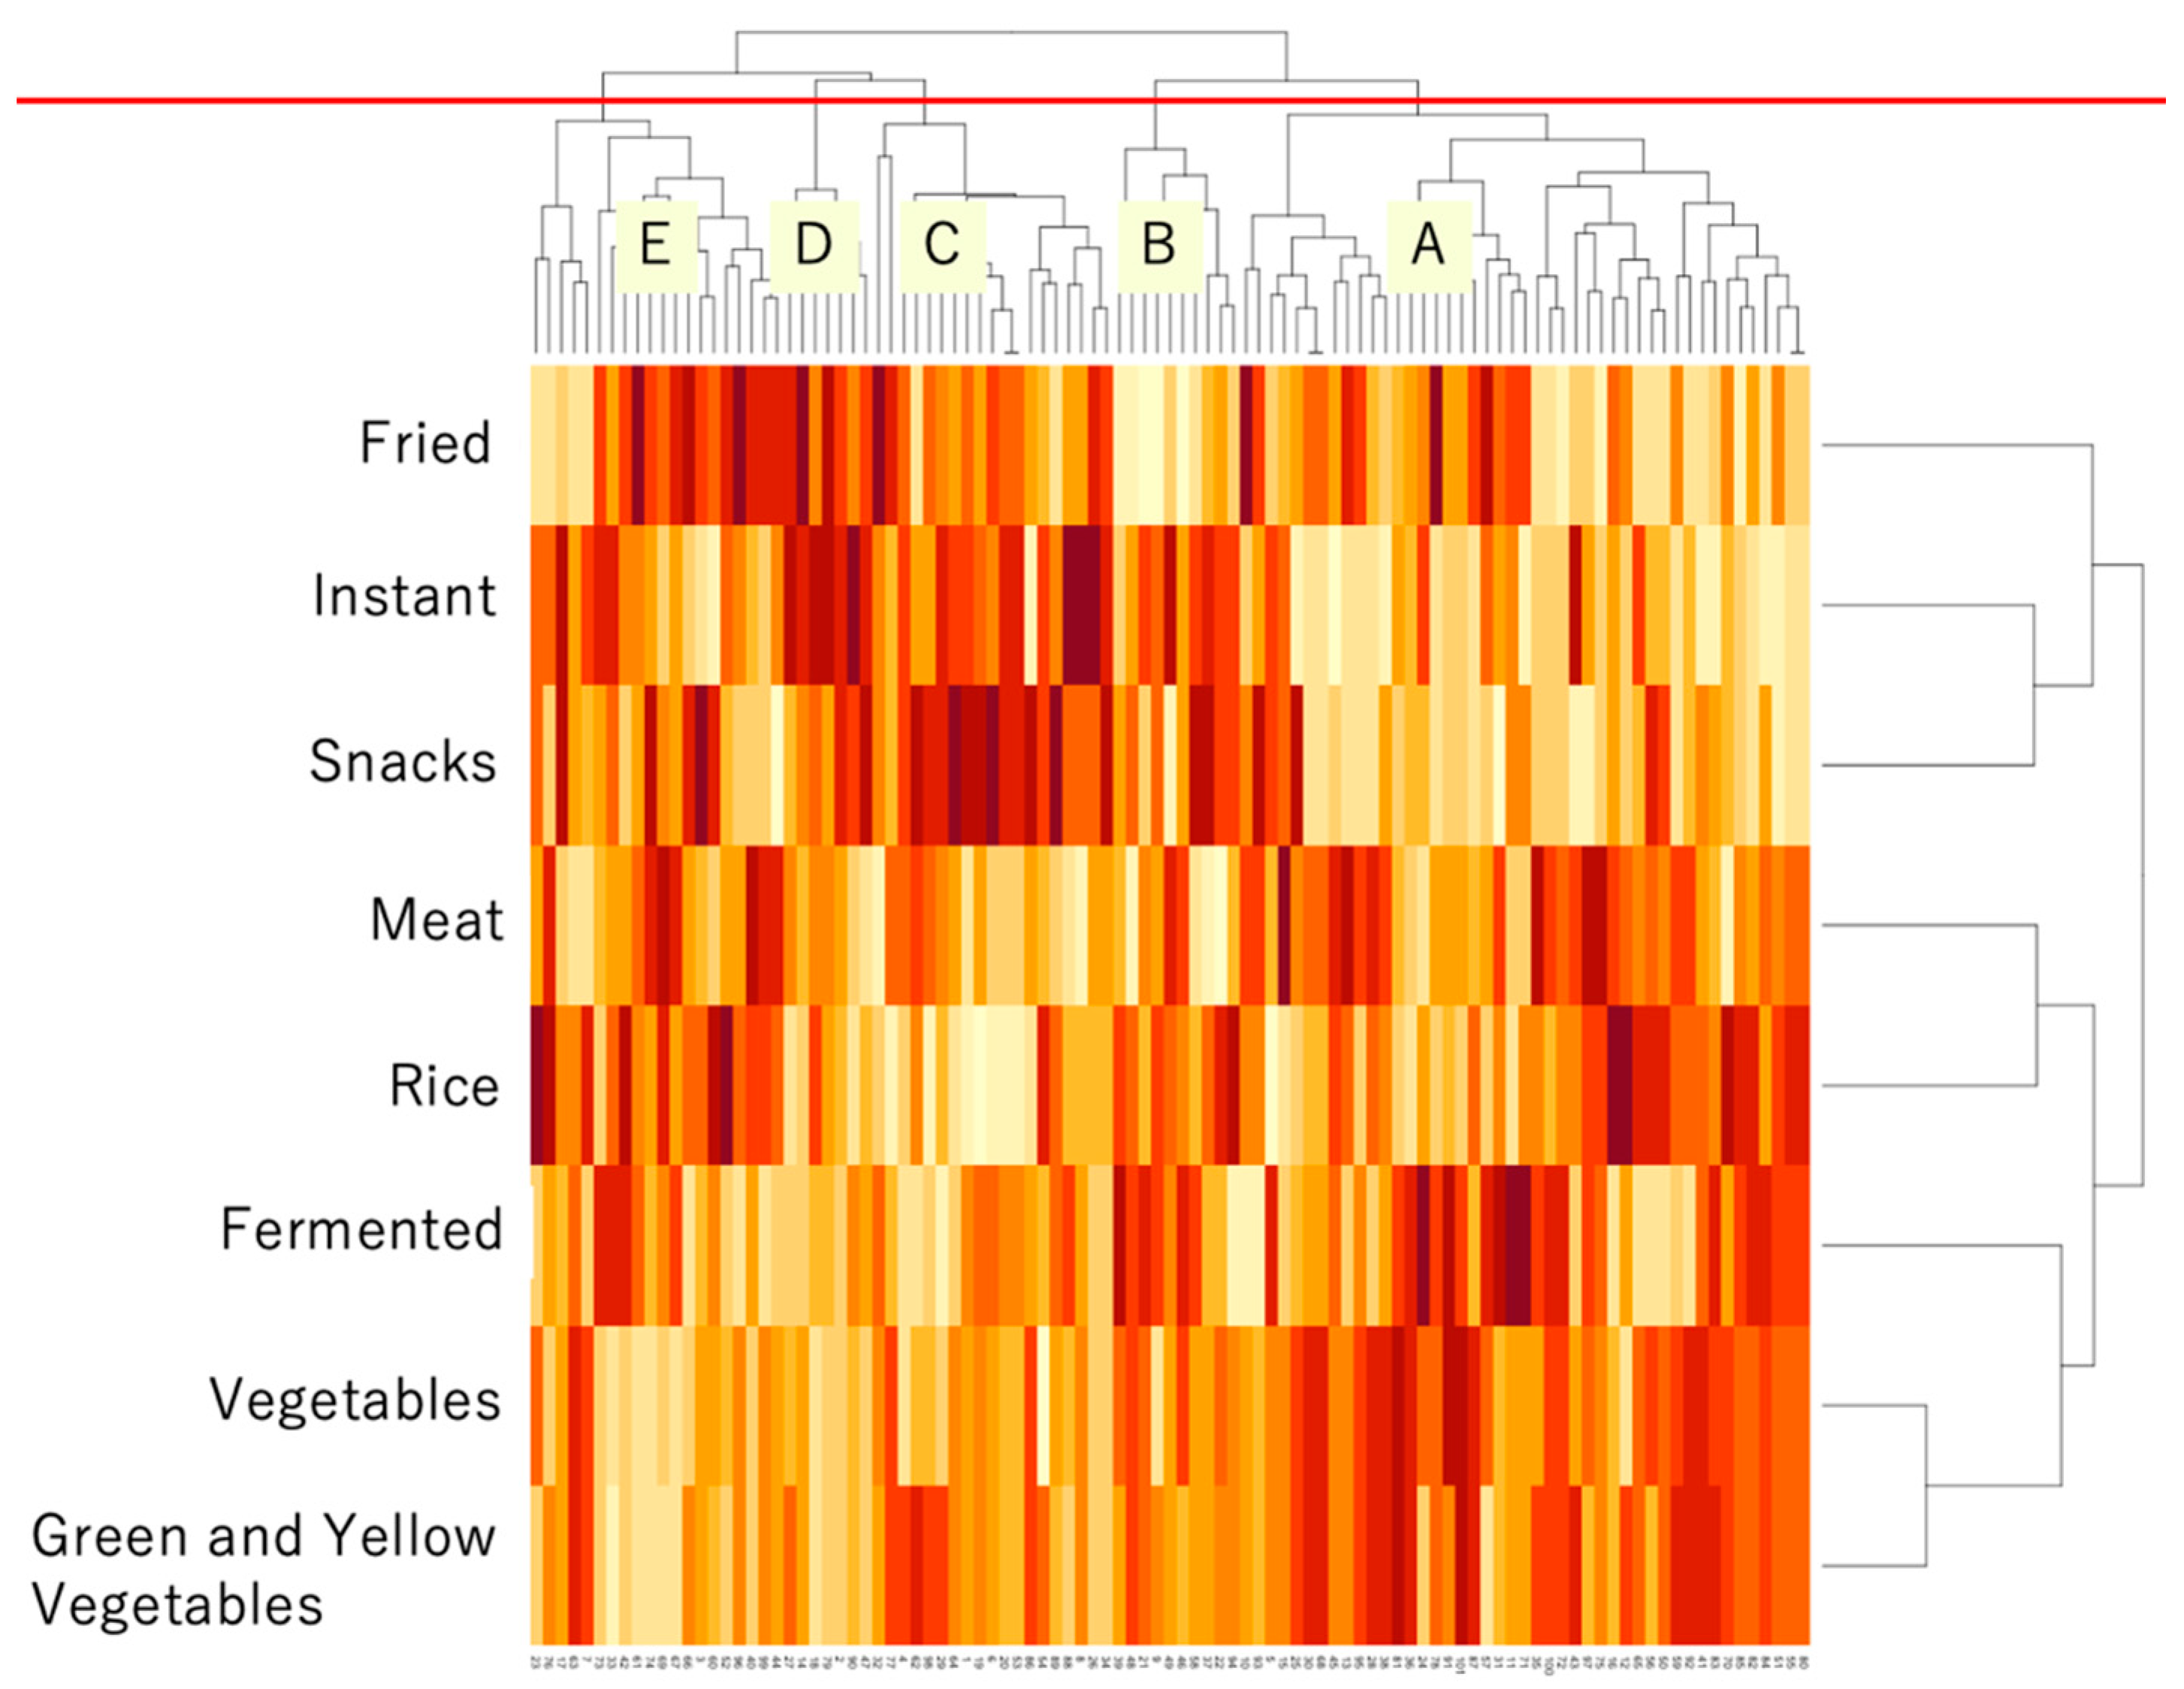
3.2. Results of Cluster Analysis

The results of the cluster analysis are shown in Figure 1. The participants were divided into two groups at the top node of the dendrogram; the left branch more frequently consumed fried foods, instant food, and snacks, while the right tended to consume meat, rice, fermented foods, vegetables, and green and yellow vegetables. These data indicated that the former group had unbalanced eating habits, while the latter had balanced eating habits.
To examine the characteristics of the participant groups in more detail, we cut the resulting tree from the clustering analysis at a certain level to identify the clusters. Among these cuts, the one that maximized the distance between clusters corresponded to two clusters. However, interpreting the results with only two clusters proved challenging. As a result, we decided to use the level with a substantial gap, which was five clusters from A to E (as shown below, by the red line at the top of Figure 1).
To reveal each group’s characteristics, we analyzed the details of food-eating frequency. Table 5 and Table 6 show the deviation value of the frequency of each food item, including or excluding the items used in the cluster analysis, respectively. The deviation values of almost all items of groups A and B were higher than the average values. Comparing groups A and B, we found a difference in the values of meat, snacks, and instant food: Group B frequently consumed not only snacks but also vegetables and fermented foods.
Table 5 also shows that group D frequently consumed fried foods, instant foods, snacks, breads, soft drinks, and alcohol. The deviation value of rice in group E was close to the average; however, the values of the other items were lower than the average.
The questionnaire sheet about health and dietary awareness and its results are shown in Figure 2 and Table 7, respectively. As seen in Table 7, group A had the highest food awareness score; group B had the highest health awareness score; group C had average awareness scores for both; group D had the lowest food awareness score; and group E had the lowest health awareness score and a relatively low food awareness score. Table 8 shows the percentage of “increase” responses for each food item in the questionnaire under the state of emergency. Fermented foods showed the highest percentage in group B, while soft drinks had the highest percentage in group E. As for the detailed characteristics of group B, vegetables, green and yellow vegetables, snacks, soybean, fruits, and alcohol were relatively higher than in the other groups. We presume that this is because the participants increased their intake of these food items, as shown in bold in Table 9, for reasons such as “good health” and “expecting to strengthen immune system”. We also show changes in eating habits (excluding food items) compared to before COVID-19 in Table 10.

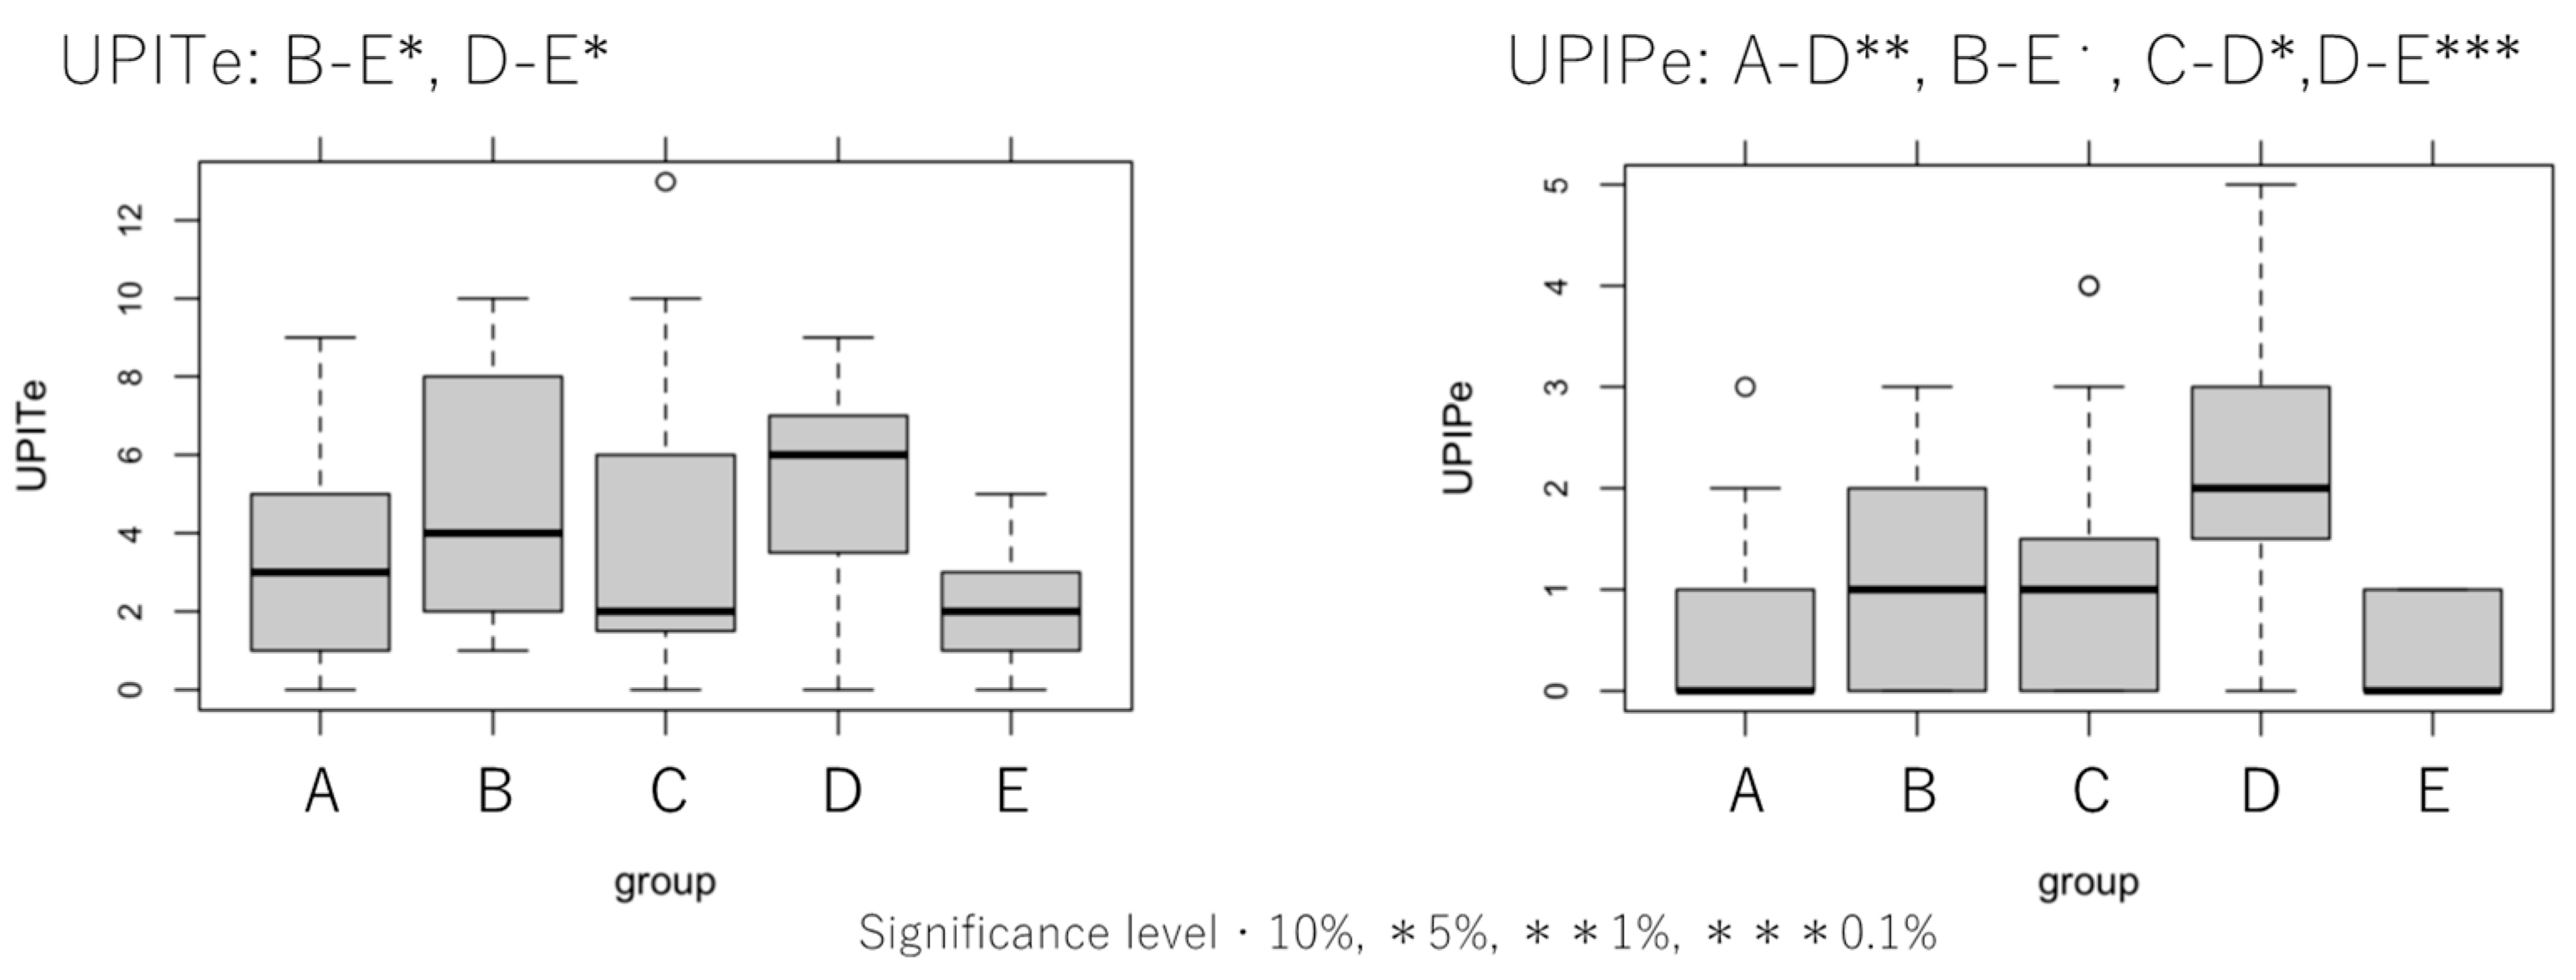
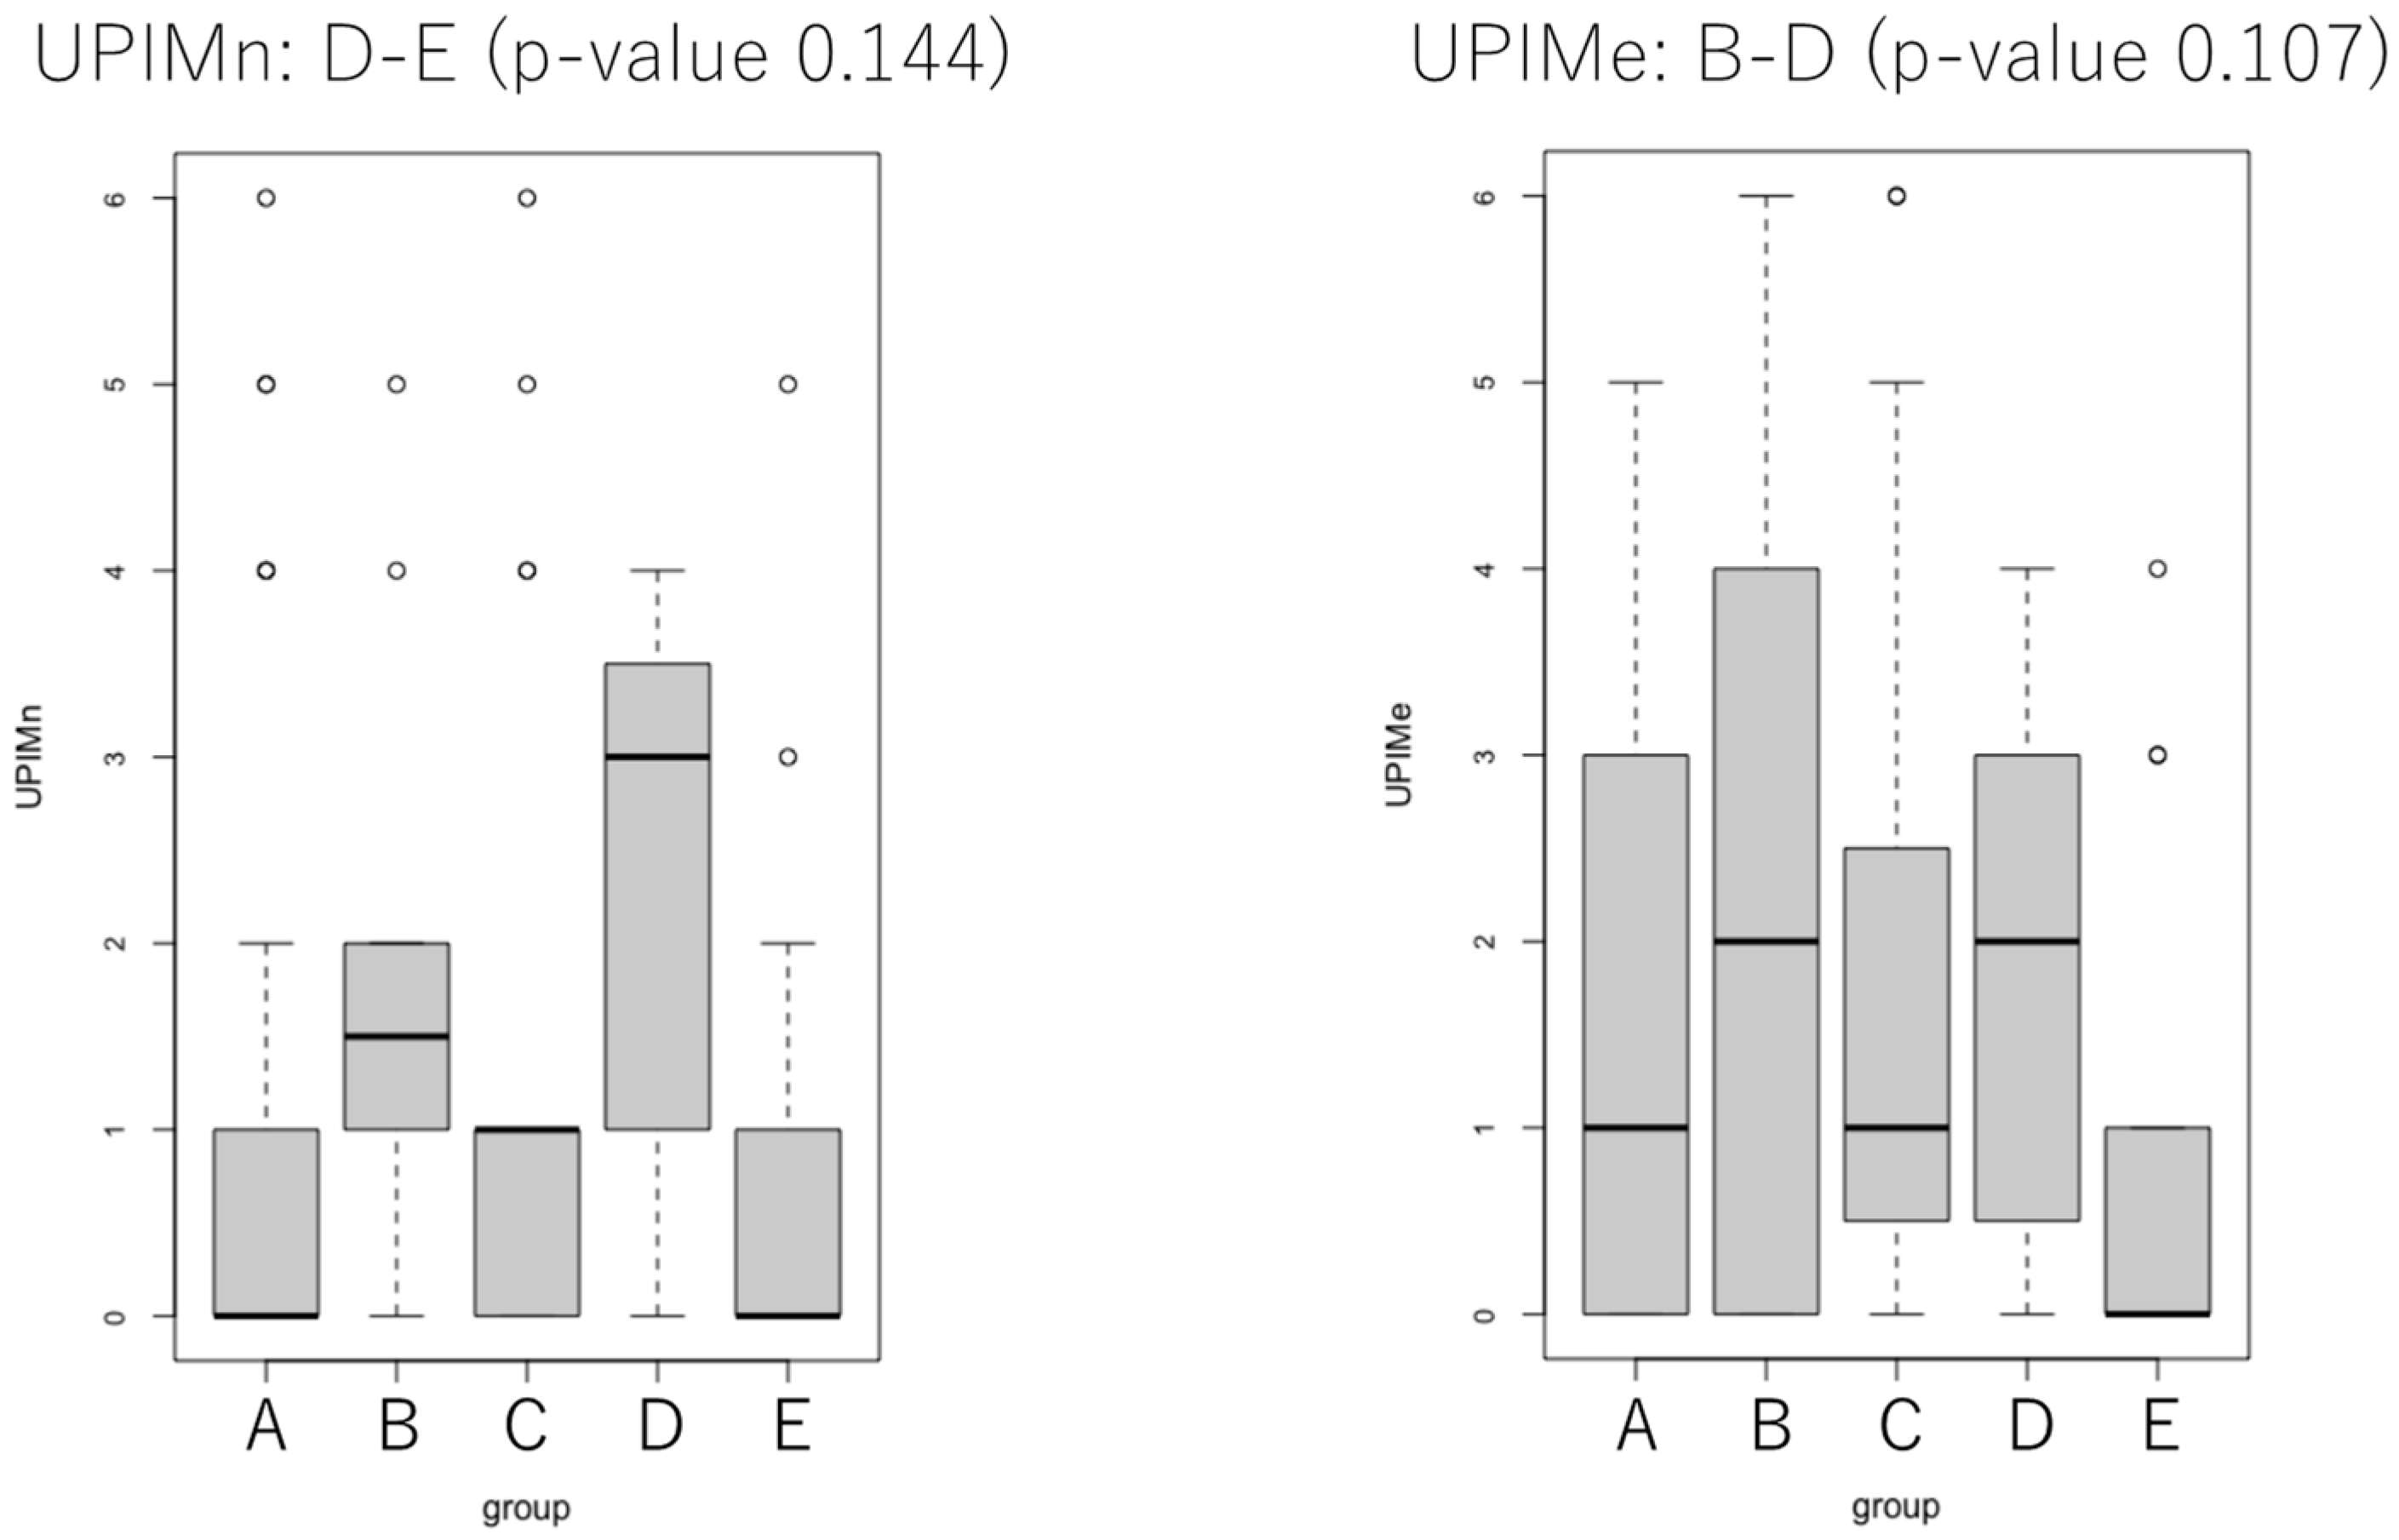
3.3. Results of Statistical Analysis of UPI Scores

Table 11 shows the number of participants, the percentages of first-year students and male participants, and the average UPI scores in each group. We performed a chi-squared test to evaluate the difference in the gender ratio among the five groups; however, the results were not significant (p = 0.187). In each UPI category, the groups with the highest and lowest scores are shown in boldface and italics, respectively. Forty-five participants were categorized in group A. Group E had the lowest score across UPI categories, and the scores of group A followed. On the contrary, either group B or D had the highest UPI scores. From the one-way analysis of variance, we observed significant differences in UPITe and UPIPe scores among the groups. In the case of UPITe, a significant difference was observed between groups B and E and groups D and E. In the case of UPIPe, based on the Tukey–Kramer test, a significant difference was observed between groups A and D, groups B and E, groups C and D, and groups D and E (Figure 2). We expected that there might be a significant difference in UPIM, but this was not the case, as shown in Figure 3.
In our analysis, the higher vegetable intake group was separated into two subgroups (A and B). The UPI score of group A tended to be lower than that of group B. We also focused on people with relatively low vegetable intake. They were separated into three subgroups (C, D, and E). The UPI score of group D tended to be higher than that of groups C and E, but significant differences were observed between groups D and C (UPIPe) and groups D and E (UPITe and UPIPe). From these results, a binary classification using the intake of a single food is insufficient to capture mental health represented by UPI scores.

4. Discussion

We were able to reveal the eating habits of college students in Japan during the COVID-19 pandemic. To reiterate, nowadays, we can consume various foods that we could not acquire before. This may affect the diversity of college students’ dietary patterns. Using cluster analysis, we defined five groups of college students according to the intake of various food items. Previous studies have used traditional dietary patterns, such as Japanese or Mediterranean, as eating habits [1,3,4,13] or categorized the respondents into two groups by the intake of a single food, such as vegetables [14]. The changes in eating habits during the pandemic can be compared to those reported by Grant et al. [1]. Grant et al. [1] revealed that some individuals increased the consumption of specific foods, specifically vegetables and sweets or pastries, which aligns with the trends observed in this study. Adherence to the Mediterranean diet was found in 38% of the participants, close to the proportion of individuals with traditional eating habits in this study (i.e., those who frequently consumed rice and vegetables, denoted as group A), which was 45%.
Comparing all five groups, our analysis showed that groups B and D had poorer mental health. Group B consumed plenty of vegetables and fermented foods but also snacked a lot. The UPI scores related to COVID-19 (UPICn and UPICe) of group B were the highest of all groups. It is possible that group B’s high health consciousness and anxiety regarding the spread of COVID-19 was associated with the increased intake of fermented foods, vegetables, fruits, and soy products. In Japan, at the beginning of COVID-19, the consumption of fermented soybean, also called natto, considered a superfood, increased because fermented foods are believed to be effective in preventing COVID-19 [27] and recently have proven to contain the vitamins necessary to inhibit such viral infections [23,28]. People in group B also increased their intake of snacks and alcohol, the same as group C, which had the highest increase in snack consumption. Our results suggested that people in group B had tried to consume various foods and increased the number of food items that they consumed compared to before the pandemic, owing to their anxiety about COVID-19.
People in group D had the highest intake of fried foods, instant foods, snacks, bread, soft drinks, and alcohol. However, they had relatively lower intake of vegetables. Regarding mental health, they had a relatively low level. Next, groups A and E had higher levels of mental health and group A had the highest awareness of food and intake of a variety of foods. The higher level of mental health in the group of people with a relatively high amount of vegetables was consistent with previous studies. On the contrary, group E had the lowest awareness of health and the second-lowest awareness of food. People in group E had a lower frequency of intake of meat, green and yellow vegetables, fermented foods, instant foods, snacks, bread, fish, eggs, milk, potatoes, and fruit. Nevertheless, their mental health was the best among the five groups. Compared to before COVID-19, the intake of soft drinks in this group increased, which might have relieved stress. For the question regarding the reason for increasing the intake of food, 50% of group E answered that consuming soft drinks distracted them. Group C included the highest percentage of female students (63.2%), and people in this group had the lowest intake of rice. Young women in Japan tend to avoid rice because of its high carbohydrate content, leading to weight gain. Our result for group C may reflect this eating habit among young Japanese women.

5. Conclusions

The eating patterns of college students went beyond the established classification of balanced vs. unbalanced; our cluster analysis clearly revealed divisions into five other patterns. We revealed each group’s eating habits and mental health status during the COVID-19 pandemic. Our results showed the following.
  • Group A, with 45 participants, was the largest; the proportions of male students and those in the first grade were 46.7% and 20.0%, respectively. This group had relatively high vegetable intake, balanced eating habits, and a high level of mental health.
  • Group B included 10 participants. The proportions of male participants and those in the first grade were 60.0% and 20.0%, respectively. This group was similar to group A in eating habits; however, it had a lower degree of mental health. Group B increased the intake of some food items owing to anxiety about COVID-19.
  • Group C, with 19 participants, had the highest proportion of female participants (63.2%). Furthermore, the proportion of participants in the first grade was 21.1%. This group was characterized by the lowest intake of rice. They were at an intermediate level of mental health.
  • Group D, with seven participants, had the highest proportions of male (71.4%) and first-grade (28.6%) participants. They had the highest intake of fried foods, instant foods, snacks, bread, soft drinks, and alcohol; their mental health level was relatively low.
  • Group E, with 20 participants, had the second-highest proportion of male participants (70.0%) and the lowest proportion of those in the first grade (5.0%). They had a relatively low frequency of intake of most foods and increased intake of soft drinks, which may relieve stress; their mental health was the highest among the five groups.
These results correspond to our primary objective. Our approach is considered a data-driven definition of eating habits that enables us to accurately capture the relationships between eating habits and mental health while considering novel epidemic situations.
It should be noted that this study captured a trend over approximately one year, taking into account the rare, short periods of the presence and absence of emergency pandemic situations. Nearly half of the students exhibited well-balanced eating habits and had a high level of mental health. However, it is important to emphasize the observed link between increased soft drink consumption and stress relief during emergencies such as the COVID-19 pandemic. Nevertheless, as we mentioned above, given the survey period, the observed trend might be a short-term one, and the long-term impacts require further investigation. In fact, it is also reported that long-term consumption of soft drinks may have a detrimental impact on mental health [29]. In advancing this field of study, future research should focus on elucidating how eating habits change over time and explore the relationship between long-term eating habits and mental health.
One limitation of this study is that we obtained data about the situation in April–May, when the state of emergency was declared, through a recall method. It is essential to examine the extent to which data obtained through this method can be reproduced when collected twice. On the other hand, April–May was declared as the first state of COVID-19 pandemic emergency in Japan, and the duration of this situation was uncertain. Conducting surveys under such crisis conditions highlights an area that requires further research in the future.
The presence of pre-existing mental illnesses is indeed valuable information. However, we omitted this question from the survey because its inclusion might have led to a reduction in the number of participants. Given the challenges that we faced in recruiting participants for this study, we made this choice. Nonetheless, obtaining information about baseline health status, including any pre-existing conditions, remains a future task. The recruitment of first-year students also posed a challenge because they had not spent enough time on campus, given the switch to online learning. In similar pandemic situations in the future, this study could serve as a resource in considering how to follow up with first-year students and provide support, especially in the context of nutrition.

Author Contributions

Conceptualization, Y.H. and T.I.; methodology, T.I.; software, Y.H. and T.I.; validation, T.I., Y.S., Y.O., and H.S.; formal analysis, T.I.; investigation, T.I.; resources, T.I.; data curation, T.I.; writing—original draft preparation, T.I. and Y.H.; writing—review and editing, H.S.; visualization, T.I. and Y.H.; supervision, T.I.; project administration, T.I.; funding acquisition, T.I. All authors have read and agreed to the published version of the manuscript.

Funding

This research was partly supported by the Grant-in-Aid for Scientific Research (C) (22K05844) of the Japan Society for the Promotion of Science (JSPS), “Research Start Support Program for the Creation of a Sustainable Society” (Tohoku University’s research grant), and a research grant from the Yotta Informatics Center, Tohoku University.

Institutional Review Board Statement

This study was approved by the Department of Agriculture Tohoku University IRB committee. The approval number is 21-A-03.

Informed Consent Statement

Informed consent was obtained from all subjects involved in the study.

Data Availability Statement

Data are contained within the article.

Conflicts of Interest

The authors declare no conflict of interest.

References

  1. Grant, F.; Scalvedi, M.L.; Scognamiglio, U.; Turrini, A.; Rossi, L. Eating habits during the COVID-19 lockdown in Italy: The nutritional and lifestyle side effects of the pandemic. Nutrients 2021, 13, 2279. [Google Scholar] [CrossRef] [PubMed]
  2. Di Renzo, L.; Gualtieri, P.; Pivari, F.; Soldati, L.; Attinà, A.; Cinelli, G.; Leggeri, C.; Caparello, G.; Barrea, L.; Scerbo, F.; et al. Eating habits and lifestyle changes during COVID-19 lockdown: An Italian survey. J. Transl. Med. 2020, 18, 229. [Google Scholar] [CrossRef] [PubMed]
  3. Silva, D.F.O.; Cobucci, R.N.; Gonçalves, A.K.; Lima, S.C.V.C. Systematic review of the association between dietary patterns and perinatal anxiety and depression. BMC Pregnancy Childbirth 2019, 19, 212. [Google Scholar] [CrossRef] [PubMed]
  4. Konishi, K. Associations between healthy Japanese dietary patterns and depression in Japanese women. Public Health Nutr. 2021, 24, 1753–1765. [Google Scholar] [CrossRef] [PubMed]
  5. Beesdo, K.; Bittner, A.; Pine, D.S.; Stein, M.B.; Höfler, M.; Lieb, R.; Wittchen, H.U. Incidence of social anxiety disorder and the consistent risk for secondary depression in the first three decades of life. Arch. Gen. Psychiatry 2007, 64, 903–912. [Google Scholar] [CrossRef]
  6. Lewinsohn, P.M.; Rohde, P.; Seeley, J.R.; Klein, D.N.; Gotlib, I.H. Natural course of adolescent major depressive disorder in a community sample: Predictors of recurrence in young adults. Am. J. Psychiatry 2000, 157, 1584–1591. [Google Scholar] [CrossRef] [PubMed]
  7. Son, C.; Hegde, S.; Smith, A.; Wang, X.; Sasangohar, F. Effects of COVID-19 on college students’ mental health in the United States: Interview survey study. J. Med. Internet. Res. 2020, 22, e21279. [Google Scholar] [CrossRef]
  8. National Federation of University Cooperative Associations. Full report on the Pandemic’s Impact on University Life: A Survey. Available online: https://www.univcoop.or.jp/en/activity/pdf/pdf_activity01.pdf (accessed on 10 August 2021).
  9. Horowitz, J.L.; Garber, J. The prevention of depressive symptoms in children and adolescents: A meta-analytic review. J. Consult. Clin. Psychol. 2006, 74, 401–415. [Google Scholar] [CrossRef]
  10. Miyake, Y.; Okamoto, Y. Mental health of university students. Jpn. J. Psychosom. Med. 2015, 55, 1360–1366. [Google Scholar]
  11. Yokoro, M.; Wakimoto, K.; Otaki, N.; Fukuo, K. Increased prevalence of breakfast skipping in female college students in Covid-19. Asia Pacific J. Public Health 2021, 33, 438–440. [Google Scholar] [CrossRef]
  12. Pendergast, F.J.; Livingstone, K.M.; Worsley, A.; McNaughton, S.A. Correlates of meal skipping in young adults: A systematic review. Int. J. Behav. Nutr. Phys. Act. 2016, 13, 125. [Google Scholar] [CrossRef] [PubMed]
  13. Higuchi, H.; Fujita, T.; Kubo, M. Dietary factors that influence the mental health of university students. Mem. Fac. Agric. Kinki Univ. 2008, 41, 17–25. [Google Scholar]
  14. Konishi, K.; Hyakutake, A.; Muramatsu, T. Dietary patterns and health-related QOL among female university students. Shinshu J. Public Health 2013, 7, 83–94. [Google Scholar]
  15. Tominaga, M.; Shimizu, M.; Mori, T.; Kodama, K.; Sato, K. Relationship between life style focusing on eating habits and mental health of junior and high school students, and university students. J. Home Econ. Jpn. 2001, 52, 499–510. [Google Scholar]
  16. Marani, M.; Katul, G.G.; Pan, W.K.; Parolari, A.J. Intensity and frequency of extreme novel epidemics. Proc. Natl. Acad. Sci. USA 2021, 118, e2105482118. [Google Scholar] [CrossRef] [PubMed]
  17. Poblacion, A.; de Cuba, S.E.; Cook, J.T. Comparing food security before and during the COVID-19 pandemic: Considerations when choosing measures. J. Acad. Nutr. Diet. 2021, 121, 1945–1947. [Google Scholar] [CrossRef]
  18. Le, L.M.; Flores, G.; Edejer, T.T.-T.; Tran, T.K.; Nguyen, C.T.K.; Tran, D.T.; Ho, P.D.; Agorinya, I.A.; Tediosi, F.; Ross, A. Investigating the effect of recall period on estimates of inpatient out-of-pocket expenditure from household surveys in Vietnam. PLoS ONE 2020, 15, e0242734. [Google Scholar] [CrossRef]
  19. Isobe, Y.; Shigematsu, R. Study on the dietary life of university students. Jpn. Bull. Fac. Educ. Mie Univ. 2007, 58, 63–76. [Google Scholar]
  20. Ikeda, J.; Asano, M.; Kitani, T.; Nagata, H. Study on food intake frequency among elderly persons. Jpn. J. Nutr. Diet. 1991, 49, 257–271. [Google Scholar] [CrossRef]
  21. Savige, G.; MacFarlane, A.; Ball, K.; Worsley, A.; Crawford, D. Snacking behaviours of adolescents and their association with skipping meals. Int. J. Behav. Nutr. Phys. Act. 2007, 4, 36. [Google Scholar] [CrossRef]
  22. The Yomiuri Shimbun. Speculation Prompts Rise in Fermented Food Sales. Available online: https://www.yomiuri.co.jp/national/20200517-OYT1T50101/ (accessed on 19 May 2020).
  23. Kagawa, Y. Influence of nutritional intakes in Japan and the United States on COVID-19 infection. Nutrients 2022, 14, 633. [Google Scholar] [CrossRef]
  24. Hirayama, K. The Management of Mental Health in College Students—User guide for the UPI; Sozo-shuppan: Tokyo, Japan, 2020. (In Japanese) [Google Scholar]
  25. Oka, I.; Yoshimura, M.; Yamagishi, T. Changes in mental health of freshwomen at Tsuda University. J. Tsuda Univ. 2015, 47, 175–195. [Google Scholar]
  26. Sakai, W. Reconstruction of University Personality Inventory Based on Student Counseling Model. Doctoral Dissertation, Nagoya University, Nagoya, Japan, 2016. [Google Scholar]
  27. Hobart, E. Japan’s Most Polarising Superfood? BBC.com. Available online: https://www.bbc.com/travel/article/20200727-japans-most-polarising-superfood (accessed on 29 July 2020).
  28. Oba, M.; Rongduo, W.; Saito, A.; Okabayashi, T.; Yokota, T.; Yasuoka, J.; Sato, Y.; Nishifuji, K.; Wake, H.; Nibu, Y.; et al. Natto extract, a Japanese fermented soybean food, directly inhibits viral infections including SARS-COV-2 in vitro. Biochem. Biophys. Res. Commun. 2021, 570, 21–25. [Google Scholar] [CrossRef] [PubMed]
  29. Kim, J.-M.; Lee, E. Association between soft-drink intake and obesity, depression, and subjective health status of male and female adults. Int. J. Environ. Res. Public Health 2021, 18, 10415. [Google Scholar] [CrossRef] [PubMed]
Figure 1. Heatmap of the intake frequency of each food with the dendrogram of the hierarchical cluster analysis. The dark color indicates the deviation value of a higher intake frequency, while the light color indicates that of a lower frequency.
Covid 03 00119 g001
Figure 2. The distributions of “UPI total emergency” (UPITe) (left) and “UPI physical emergency” (UPIPe) (right) are shown by the boxplots for each group. The top of each boxplot shows the result of the Tukey–Kramer test. The statistical significance between the groups is shown by the asterisk.
Covid 03 00119 g002
Figure 3. The distributions of “UPI mental now” (UPIMn) (left) and “UPM mental emergency” (UPIMe) (right) are shown by the boxplots for each group. The top of each boxplot shows the result of the Tukey–Kramer test. The pair of groups with the smallest p-value and its value is shown at the title of each boxplot.
Covid 03 00119 g003
Table 1. University Personality Inventory (UPI) items. The last letters of the title, P, M and C, indicate physical, mental, and COVID-19, respectively.
UPIPUPIMUPIC
1I feel tiredI have emotional ups and downsI feel uneasy about my income owing to poor economic conditions
2I have no appetiteI tend to get pessimisticI want to restart my current school year even if I take a leave of absence or have to repeat a year
3I get tired easilyI’m too lethargic to do anythingI don’t fully understand local governments’ system of infection control and inspection
4I’m having trouble with sleeplessnessI sometimes get anxious or worried about the present or futureI’m worried about getting infected with COVID-19
5My eyes feel tiredI feel lonelyI may neglect infection control measures
6I feel dizzy or as if I am about to collapseI have no one I feel free to talk with about what bothers me
Table 2. Questionnaire sheet about the University Personality Inventory.
Under the State of Emergency (April to May 2020)At the Time of the Survey
I feel tired
I have no appetite
I have emotional ups and downs
I’m having trouble with sleeplessness
I may feel uneasy about my income owing to poor economic conditions
Table 3. Scores on the University Personality Inventory (UPI) by gender.
UPITnUPITeUPIPnUPIPeUPIMnUpiMeUPICnUPICe
Male2.752.940.770.751.061.470.920.72
Female3.423.980.900.981.311.791.211.21
Note. T is total, P is physical, M is mental, C is COVID-19, “e” represents the score under the state of emergency, and “n” represents the score at the time of the investigation.
Table 4. Scores on the University Personality Inventory (UPI) by academic year.
UPITnUPITeUPIPnUPIPeUPIMnUpiMeUPICnUPICe
First year3.224.000.831.001.111.941.281.06
Second year3.673.400.870.871.601.601.200.93
Third year2.983.460.790.771.111.631.091.05
Forth year2.452.451.001.091.091.090.360.27
Note. T is total, P is physical, M is mental, C is COVID-19, “e” represents the score under the state of emergency, and “n” represents the score at the time of the investigation.
Table 5. Deviation values of the eating habits used in the cluster analysis for each group.
GroupnRiceMeatGreenvegeVegeFermentedFriedInstantSnacks
A4553.7555.0956.1556.8754.4049.7346.4347.13
B1058.3049.5056.1557.4359.9044.3358.4458.69
C1937.7642.6446.3443.8143.1549.1051.8754.70
D746.6049.1744.3243.5844.6764.2370.3258.69
E2050.2246.0738.5638.9443.5349.3144.9244.60
Note. The scores written in bold are the maximum.
Table 6. Deviation values of the eating habits not used in the cluster analysis for each group.
GroupnBreadFishEggSoybeanMilkPotatoFruitSoft drinkAlcohol
A4552.2052.7653.9753.7953.5952.2852.4851.2949.58
B1047.2453.8950.9052.5450.4453.3955.0048.3749.58
C1948.4548.4544.7742.8847.6450.4248.8546.4050.64
D755.3450.1347.5252.8146.6451.3346.9656.2252.82
E2046.0343.2646.4645.9945.1242.3144.0849.1649.58
Note. The scores written in bold are the maximum.
Table 7. Average values for health and dietary awareness for each group.
Groupnhealthfood
A453.443.49
B103.703.20
C193.002.89
D73.002.29
E202.852.75
Note. The scores written in bold are the maximum.
Table 8. Percentage of “increase” responses for each food item under the state of emergency. The eight food items listed in the upper part of the table were used in the cluster analysis, whereas the nine food items listed in the lower part were not used.
GroupnRiceMeatGreenvegeVegeFermentdFriedInstantSnacks
A4533.33%8.89%8.89%4.44%20.00%2.22%13.33%17.78%
B1010.00%10.00%20.00%20.00%50.00%0.00%30.00%40.00%
C1921.05%10.53%0.00%0.00%21.05%5.26%36.84%42.11%
D714.29%28.57%0.00%0.00%28.57%28.57%57.14%28.57%
E2030.00%5.00%0.00%0.00%5.00%0.00%20.00%15.00%
GroupnBreadFishEggSoybeanMilkPotatoFruitSoft drinkAlcohol
A4517.78%4.44%11.11%11.11%6.67%0.00%2.22%11.11%8.89%
B100.00%10.00%10.00%20.00%0.00%0.00%20.00%10.00%20.00%
C1926.32%5.26%15.79%5.26%21.05%5.26%10.53%10.53%15.79%
D728.57%14.29%28.57%14.29%0.00%0.00%0.00%0.00%0.00%
E2010.00%0.00%5.00%0.00%0.00%0.00%5.00%25.00%10.00%
Note. The scores written in bold are the maximum in each food item.
Table 9. Percentages of reasons for most increased intake of food.
GroupDistracted by eatingTime saving, convenientCheap, price-performanceGood for healthExpecting strengthen immue system
A26.67%26.67%15.56%20.00%8.89%
B40.00%20.00%30.00%30.00%10.00%
C26.32%52.63%42.11%10.53%0.00%
D28.57%57.14%57.14%28.57%0.00%
E55.00%35.00%25.00%10.00%5.00%
Note. The scores written in bold are the maximum for each reason.
Table 10. Changes in eating habits, food expenses, frequency of having breakfast, frequency of self-catering, and number of foods compared to before COVID-19.
GroupFood expensesBreakfast intakeFrequency of self-cateringNumber of foods
DecreaseNo changeIncreaseDecreaseNo changeIncreaseDecreaseNo changeIncreaseDecreaseNo changeIncrease
A26.7%51.1%22.2%24.4%66.7%8.9%13.3%53.3%33.3%8.9%80.0%11.1%
B40.0%30.0%30.0%20.0%70.0%10.0%20.0%50.0%30.0%10.0%60.0%30.0%
C31.6%47.4%21.1%21.1%68.4%10.5%10.5%63.2%26.3%21.1%78.9%0.0%
D0.0%57.1%42.9%28.6%57.1%14.3%28.6%42.9%28.6%28.6%57.1%14.3%
E15.0%45.0%40.0%20.0%75.0%5.0%15.0%60.0%25.0%5.0%75.0%20.0%
Average22.6%46.1%31.2%22.8%67.4%9,7%17.5%53.9%28.6%14.7%70.2%15.1%
Note. The scores written in bold are the maximum.
Table 11. The averages of the UPI scores. The number of samples, n, and the percentages of first-year students and male participants.
GroupnFirst gradeMaleUPITnUPITeUPIPnUPIPeUPIMnUpiMeUPICnUPICe
A4520.0%46.7%2.843.200.780.691.041.621.020.89
B1020.0%60.0%4.004.900.901.301.802.401.301.20
C1921.1%36.8%3.373.950.951.051.371.791.051.11
D728.6%71.4%5.005.141.432.292.291.861.291.00
E205.0%70.0%2.201.900.600.300.650.800.950.80
Note. The scores in bold are the maximum, and those in italics are the minimum in each column. T is total, P is physical, M is mental, C is COVID-19, “e” represents the score under the state of emergency, and “n” represents the score at the time of the investigation.
Disclaimer/Publisher’s Note: The statements, opinions and data contained in all publications are solely those of the individual author(s) and contributor(s) and not of MDPI and/or the editor(s). MDPI and/or the editor(s) disclaim responsibility for any injury to people or property resulting from any ideas, methods, instructions or products referred to in the content.

