Article

Transmission of COVID-19 in Cities with Weather Conditions of High Air Humidity: Lessons Learned from Turkish Black Sea Region to Face Next Pandemic Crisis

by
Aytac Perihan Akan
1 and
Mario Coccia
2,3,*
1
Department of Environmental Engineering, Hacettepe University, Ankara 06800, Turkey
2
CNR–National Research Council of Italy, Department of Social Sciences-IRCRES-CNR, 10135 Torino, Italy
3
School of Complex Adaptive Systems, Arizona State University, Tempe, AZ 85281-2701, USA
*
Author to whom correspondence should be addressed.
COVID 2023, 3(11), 1648-1662; https://doi.org/10.3390/covid3110113
Submission received: 6 June 2023 / Revised: 18 October 2023 / Accepted: 24 October 2023 / Published: 29 October 2023

Abstract

:
The goal of this study is to analyze associations between COVID-19 transmission and meteorological indicators in cities of the Black Sea region of Turkey, located specifically in the dampest area, with excess rainfall and recurring fog. In particular, the working hypothesis is that the widespread transmission of new coronavirus SARS-CoV-2 (leading to the airborne disease COVID-19) in cities can be explained by specific weather conditions, namely high levels of air humidity. Statistical evidence here does not seem, in general, to support the hypothesis that the accelerated transmission of COVID-19 in the studied cities can be explained by high levels of humidity because different meteorological, environmental, demographic, and socioeconomic factors also plays a critical role in the disease transmission dynamics of the investigated region. The main implications of our findings here are that the demographic structure of the population, climate indicators, organization of the health system, and environmental factors (e.g., air pollution, etc.) should be considered through a systemic approach when designing effective national and regional pandemic plans directed to implement health policies for facing new variants of COVID-19 and/or new airborne diseases, in order to reduce their negative effects on health, social and economic systems.

1. Introduction

In 2023, the negative effects of the Coronavirus Disease 2019 (COVID-19) pandemic are considerably reduced, unlike during the early period of 2020, though many nations and people still have to cope with COVID-19 illnesses driven by new variants [1,2,3,4,5,6,7,8,9]. Numerous studies have focused on identifying the factors that determine the spread of COVID-19 with mutant viral agents [10,11]. Studies show that transmission of COVID-19 can be caused by direct contact (in droplets through person-to-person interactions) or indirect transmission (through contaminated objects or air) [12,13,14,15]. Studies reveal that the climate significantly affects airborne diseases, such as SARS-CoV-1, COVID-19, etc. [16,17,18,19,20,21,22]. Cai et al. [23] investigated the correlations between Severe Acute Respiratory Syndrome (SARS, a viral respiratory disease similar to COVID-19) and manifold meteorological factors including daily average temperature (DAT), daily average air pressure (DAAP), daily average relative humidity (DARH), daily hours of sunshine (DHS), and daily average wind velocity (DAWV). They found that the SARS outbreak was significantly associated with the DAWV. Moreover, DAT, DAAP, DARH, and DHS also impact the transmission of SARS over time and across areas. A study by Yuan et al. [24] also suggested that temperature, relative humidity, and wind speed were associated with SARS transmission. Bashir et al. [16] examined the impact of several meteorological indicators (e.g., average temperature, minimum temperature, maximum temperature, rainfall, average humidity, wind speed, etc.) on the transmission of COVID-19 in New York, USA. They showed that the average and minimum temperatures were significantly associated with COVID-19 diffusion. Tosepu et al. [21] investigated the relationship between climate and the diffusion of COVID-19 in Jakarta (Indonesia) and suggested that only the average temperature was significantly associated with COVID-19 transmission. However, Bolaňo-Ortiz et al. [17] investigated the association between climate-related factors and daily new COVID-19 cases and deaths in Latin America and the Caribbean (LAC). They found that average temperature, minimum temperature, percentage of humidity, wind speed, and rainfall were all significantly associated with the spread of COVID-19 confirmed cases in LAC. Guo et al. [25] also investigated the associations between COVID-19 and meteorological indicators, finding that the incidence of COVID-19 has a stronger, inverse association with temperature compared to relative humidity or wind speed. An increase in temperature from 5 °C to 11 °C was associated with a decrease of about 28% in the cumulative risk of infections of COVID-19 over 14 days. This result suggests a decrease in COVID-19 cases in the Northern Hemisphere countries during the summer months when the temperature is hot. Islam et al. [26] investigated the associations between meteorological variables and COVID-19 cases in Bangladesh. The results showed that all meteorological factors examined had a significant positive correlation with the number of COVID-19 confirmed cases. Moreover, other studies have shown that high levels of air pollution and low wind speed in urban contexts, which prevent the dispersion of air pollutants containing viruses and bacteria and cause them to remain stagnant in the air, increased the number of confirmed cases and fatality rates of COVID-19 [27,28,29]. In addition, the high population density in cities is also a risk factor for the transmission of COVID-19 and related viral agents [27,28,29]. Table 1 summarizes the main studies on the relationship between meteorological factors and COVID-19 transmission in society and the environment.
The goal of the present study is to analyze the relationships between meteorological factors and COVID-19 transmission in specific damp regions with excess rainfall and recurring fogs. A study of the Turkish Black Sea region was performed because it has the following specific average weather conditions: a high level of rainfall and an average temperature of about 19 °C, with many cold and wet months [30]. Previous studies by Aral and Bakır [31] examined Turkish regions and revealed that the diffusion of COVID-19 is heterogeneous over time and across areas because of the effects of weather conditions produced by the Black Sea and terrestrial climate [30]. In this context, a hypothesis of whether the widespread transmission of SARS-CoV-2 can be explained by specific meteorological factors produced by high air humidity has not been clearly verified. In the present study, analyses of the correlation between different weather factors and COVID-19 cases per 100,000 people are analyzed in the Turkish Black Sea region. The idea is to explain the basic climate conditions surrounding the spread of COVID-19 in the dampest regions of Turkey with excess rainfall, moderate temperatures, and fog, even in summer, to improve epidemic plans and the design of effective health policies to cope with future waves of new variants of SARS-CoV-2 and new viral agents in order to reduce their negative effects on health, social, and economic systems. Hence, the remarkable contribution of the present study to the COVID-19 literature is the analysis of a region with specific weather conditions, particularly one having high air humidity and high precipitation (demonstrated here by the Black Sea region in Turkey), to consider the relationship between confirmed cases of COVID-19 and meteorological indicators that may explain the basic determinants of its diffusion, in order to design appropriate health policies for its containment and mitigation to confront future emergences.
Table 1. Recent studies in different countries regarding the impact of meteorological factors on the transmission of COVID-19.
Study PeriodStudy Region
(Country)
IndicatorsStatistical AnalysesResults/SuggestionsReferences
3 February to 14 July 2020SpainSolar radiation, precipitation, daily temperature, and wind speedMultilevel Poisson regressionAir pollution can be a key factor in understanding the mortality rate for COVID-19 in Spain.[32]
1 July to 31 October 2020BrazilAtmospheric pressure, temperature, relative humidity, wind speed, solar irradiation, sunlight, dew point temperature, and total precipitationPearson’s correlation and regression tree analysisThe results present meteorological information as critical in future risk assessment models.[33]
9 March to 19 November 2020Saudi ArabiaWind speed and temperaturePoisson regressionAir pollution could be a significant risk factor for respiratory infections and virus transmission.[34]
February to 10 April 2020CanadaTemperature and humidityThe quantile-on-quantile (QQR) approachTemperature and humidity have a direct negative relationship with COVID-19 infections.[35]
April to May 2020BangladeshRainfall, temperature, relative humidity, and wind speedSpearman’s rank
correlation
Significant positive associations were found between relative humidity and COVID-19 cases, while
with temperature, both positive and negative associations with
[36]
February to June 2020IndiaTemperature, relative humidity, and wind speedPearson correlationmeteorological parameters may have promoted COVID-19 incidences, especially confirmed cases.[37]
3 February to 5 May 2020KoreaTemperature, wind speed,
humidity, and air pressure
Generalized additive model There was a significant nonlinear relationship between daily temperature and humidity and COVID-19 confirmed cases. [38]
1 March to 7 July 2020The U.S.Temperature and humidityPearson, Spearman, and Kendall’s rank correlations The temperature was found to have a negative correlation, while humidity highlighted a positive correlation with daily new cases of COVID-19 in New Jersey. [39]
As of 27 March 2020166 countries excluding ChinaTemperature and humidityA log-linear generalized additive model The COVID-19 pandemic may be partially suppressed by temperature and humidity increases.[40]
Third week of March 202021 countries and the French administrative regionsTemperatureARIMA modelHigh temperatures diminish initial contagion rates, but the effects of seasonal temperature at later stages of the epidemy remain questionable.[41]
Up to 10 February 2020 for China and from 15 March to 25 April 2020 for the U.S.China and the U.S.Temperature and humidityRegression AnalysisHigher temperature and higher relative humidity in summer may potentially reduce the transmission of COVID-19.[42]

2. Materials and Methods

The current study seeks an answer to the following research question:
  • Can the transmission of COVID-19 and other similar airborne diseases be explained by specific meteorological factors produced by high air humidity?
The working hypothesis here is that the widespread transmission of COVID-19 in a specific region can be explained by critical weather indicators of high air humidity. The hypothesis was verified in the Black Sea region of Turkey by analyzing cities which have a higher relative humidity compared to other cities to assess associations between their COVID-19 cases and air humidity compared to other meteorological indicators.

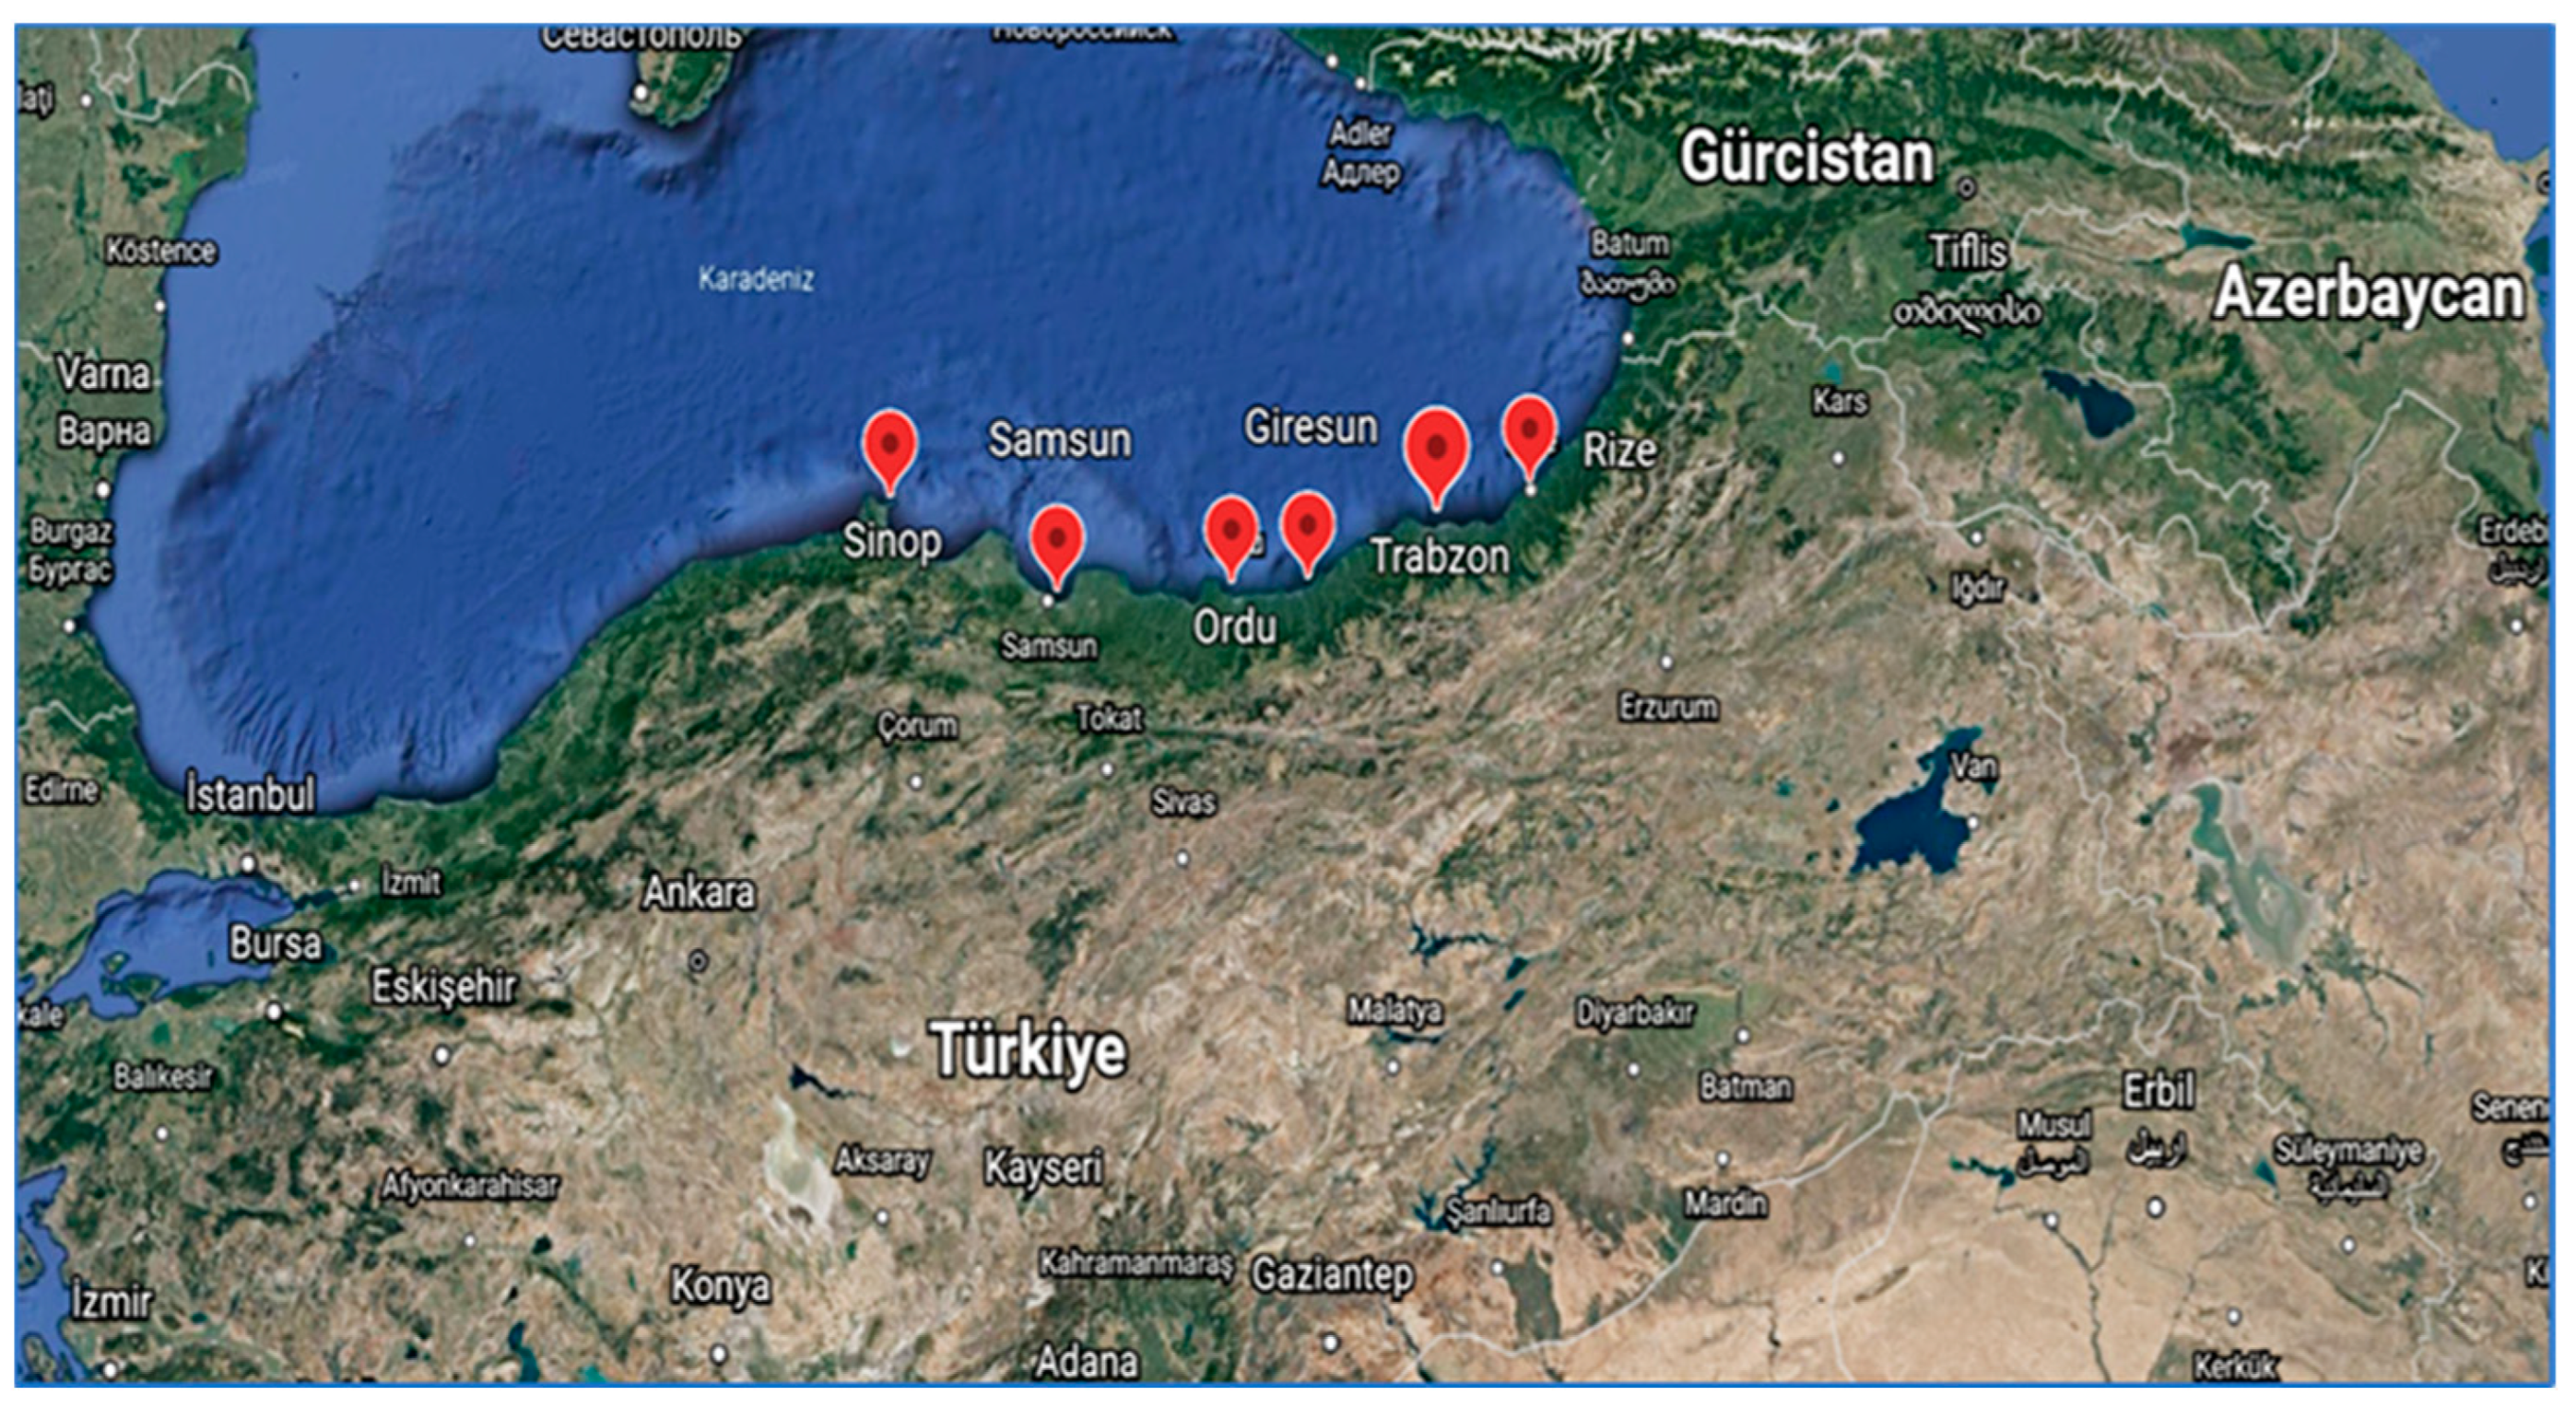
2.1. Sample and Data

This study investigated the Black Sea region in Turkey because it has provinces with relevant weather conditions and the highest number of COVID-19 cases per 100,000 people. In particular, six cities, from west to east, located in the Black Sea region of Turkey, including Sinop, Samsun, Ordu, Giresun, Trabzon, and Rize, were selected to evaluate the associations between COVID-19 cases and meteorological factors from February to September 2021 (see Figure 1). Information on the population densities of the Turkish provinces under investigation is presented in Supplementary Materials (Table S1). Data on the confirmed cases of COVID-19 from 8 February 2021 to 3 September 2021 for the provinces just mentioned were obtained from the COVID-19 information webpage of the Ministry of Health of the Republic of Turkey [43]. Monthly and weekly cases of COVID-19 per 100,000 people from February to August 2021 and from 8 February to 3 September 2021, for all provinces, are also presented in Supplementary Materials (Tables S2 and S3, respectively).
A comparison of the number of COVID-19 cases in these provinces with the general climate in Turkey during the period studied (using the number of COVID-19 cases in the three most populated cities of Turkey: Istanbul, Ankara, and Izmir) is also presented in Supplementary Materials (Tables S2 and S3). The meteorological indicators were obtained from the webpage of the Meteorological Department of the Ministry of Agriculture and Forestry of the Republic of Turkey, and other meteorological factors were obtained from the webpage of World Weather Online [44]. Data in this study are freely available from these websites (see references for details).

2.2. Measurements of Variables

This study focused on the following measures:
  • COVID-19 confirmed cases: Number of infected individuals from 8 February to 3 May 2021, based on the amount of people that tested positive for COVID-19 using Antigen tests.
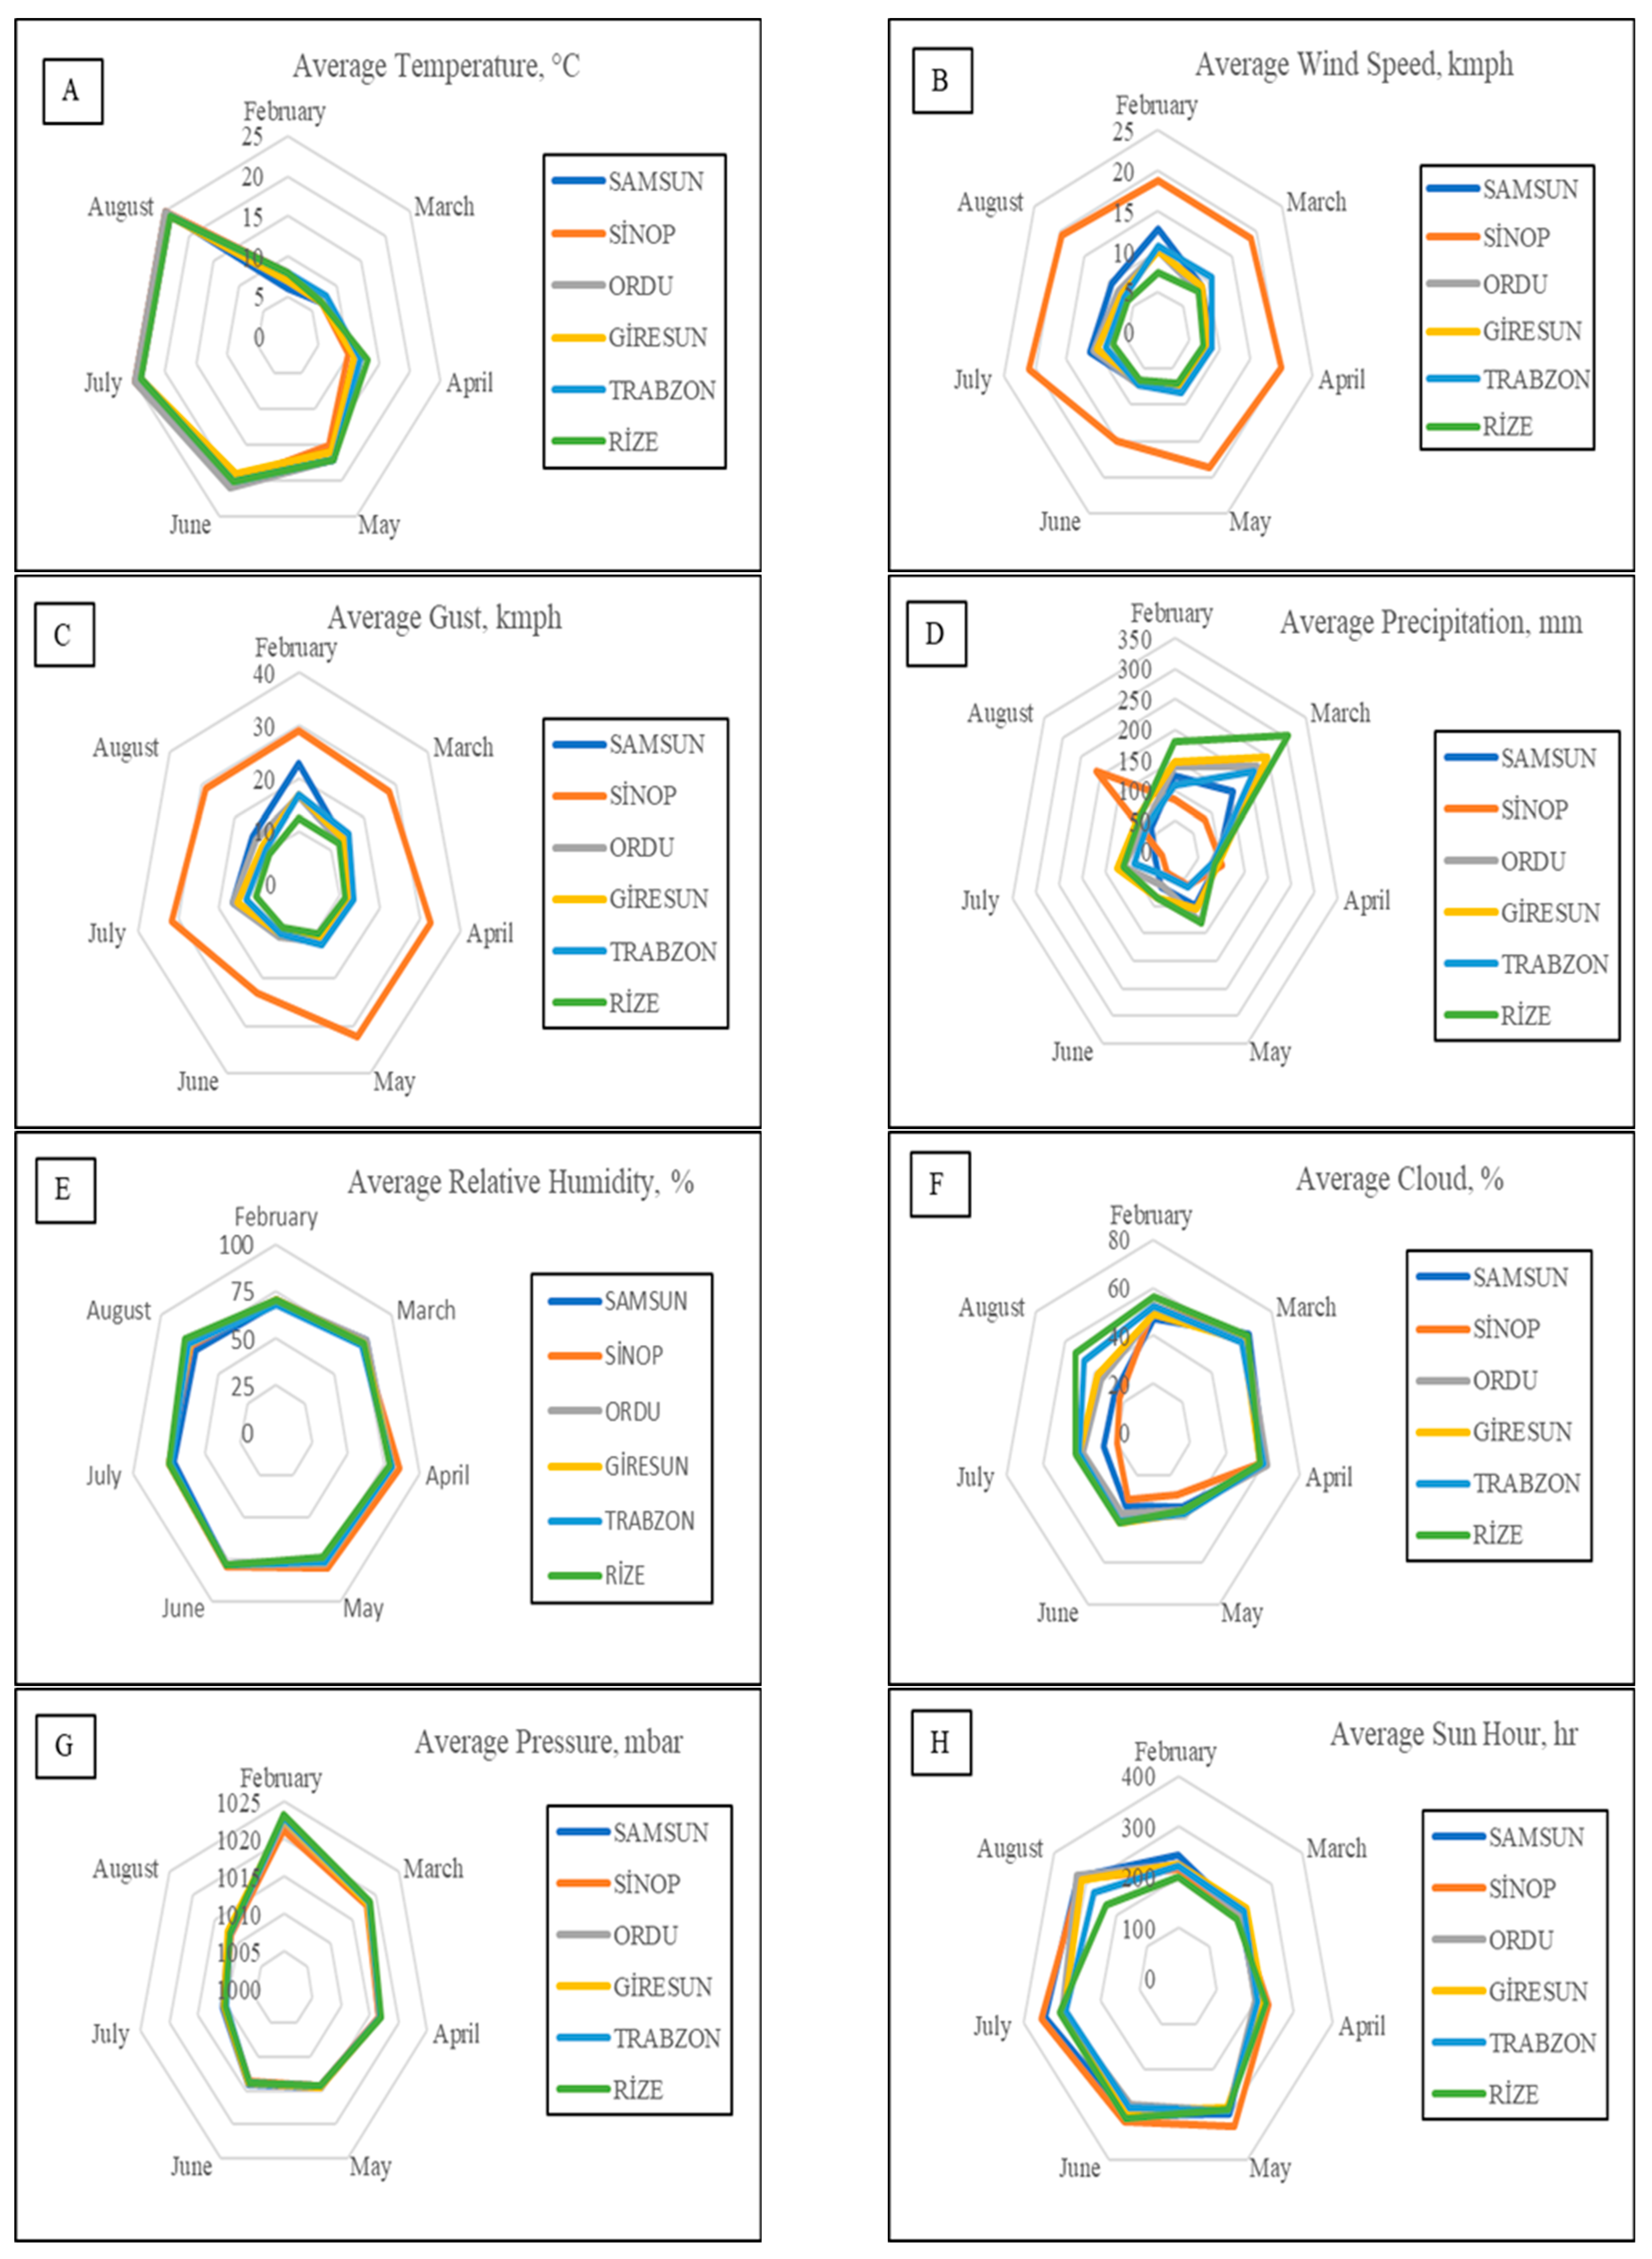
  • Meteorological indicators: Average temperature in °C, average wind speed in kmph, average gust in kmph, average precipitation in mm, average relative humidity%, average cloud%, average atmospheric pressure in mbar, and average hours of sunshine from 8 February to 3 September 2021.

2.3. Data Analysis Procedure

To statistically verify the working hypothesis, the associations between COVID-19 confirmed cases in the Black Sea region of Turkey and meteorological factors in the six Turkish provincial capitals under investigation were analyzed with a non-parametric approach using Spearman’s and Kendall’s rank correlation tests. These two tests were used because the sample size of six cities is small and the distributions of the COVID-19 cases and meteorological factors do not have normality. The Statistics Software IBM SPSS® version 23 was used.

3. Results of Empirical Evidence

3.1. Overview of the Climate in Cities of the Turkish Black Sea Region

A general overview of the climate in the studied region can clarify the results. Weather conditions are presented in Figure 2 and Supplementary Materials (Table S4), respectively. Among the provinces in the Black Sea region, the highest average wind speed was observed in the cities of Sinop and Ordu during April and July, respectively, whereas in the cities of Samsun and Giresun, the highest wind speed was recorded in February, and in the cities of Trabzon and Rize it was in March. Similarly to the wind speed, the highest average gust was also observed in Sinop in April, whereas it was recorded in February for the remaining cities (Figure 2). The maximum rain accumulation was recorded in March and February; however, regarding the rainfall trends occurring in summer, the remarkable amount of precipitation recorded in August, especially in the Sinop province, may be due to possible effects of climate change on weather conditions. Based on results from all provinces, the lowest level of average relative humidity was observed in February, while the highest levels were recorded in April (Figure 2). The highest average relative humidity was recorded in the city of Sinop, which had a level of 86%; the lowest-level city was Samsun, with 69%. The average atmospheric pressure levels were recorded at almost the same values in all provinces of the Black Sea region from February to August. The highest levels of average atmospheric pressure were recorded in the winter months, while the opposite was observed in summer. The change in average hours of sunshine was the opposite of the change in cloud rate (Figure 2). Previous studies have proven that these weather conditions, including monthly average temperature, wind speed, gust, precipitation, relative humidity, atmospheric pressure, and hours of sunshine, significantly affect the spread of COVID-19 [22,45,46,47].

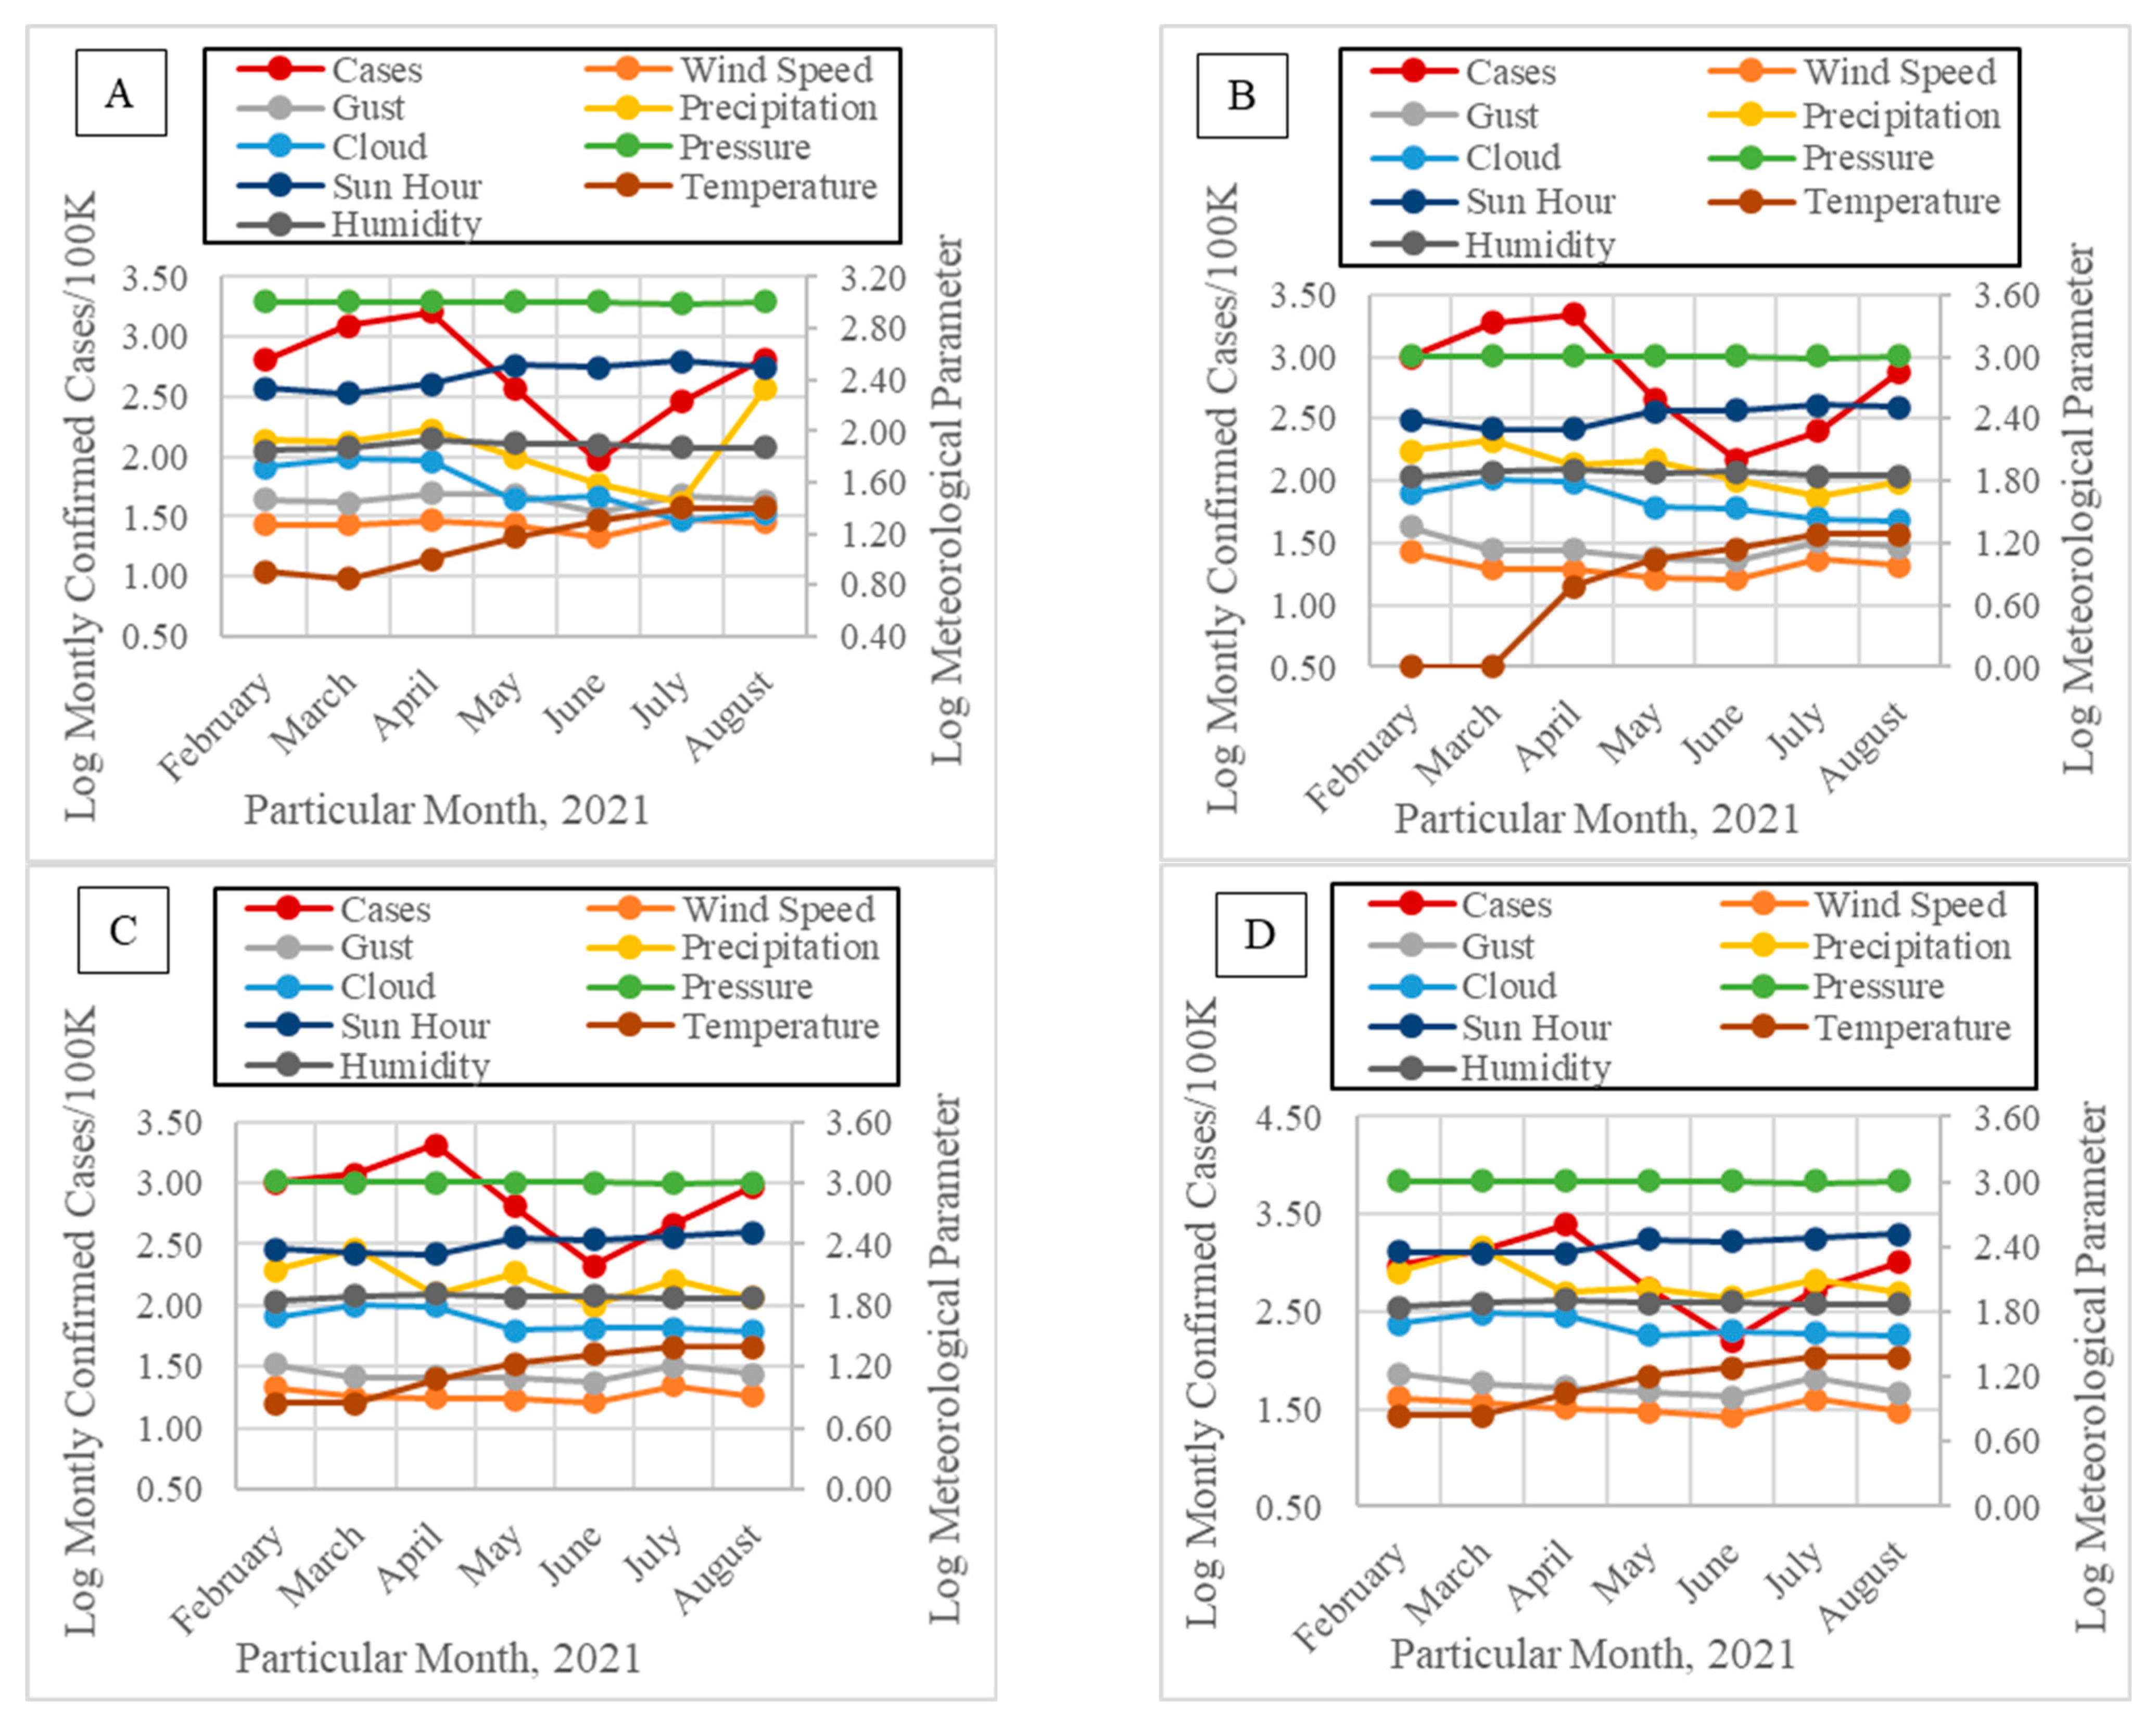
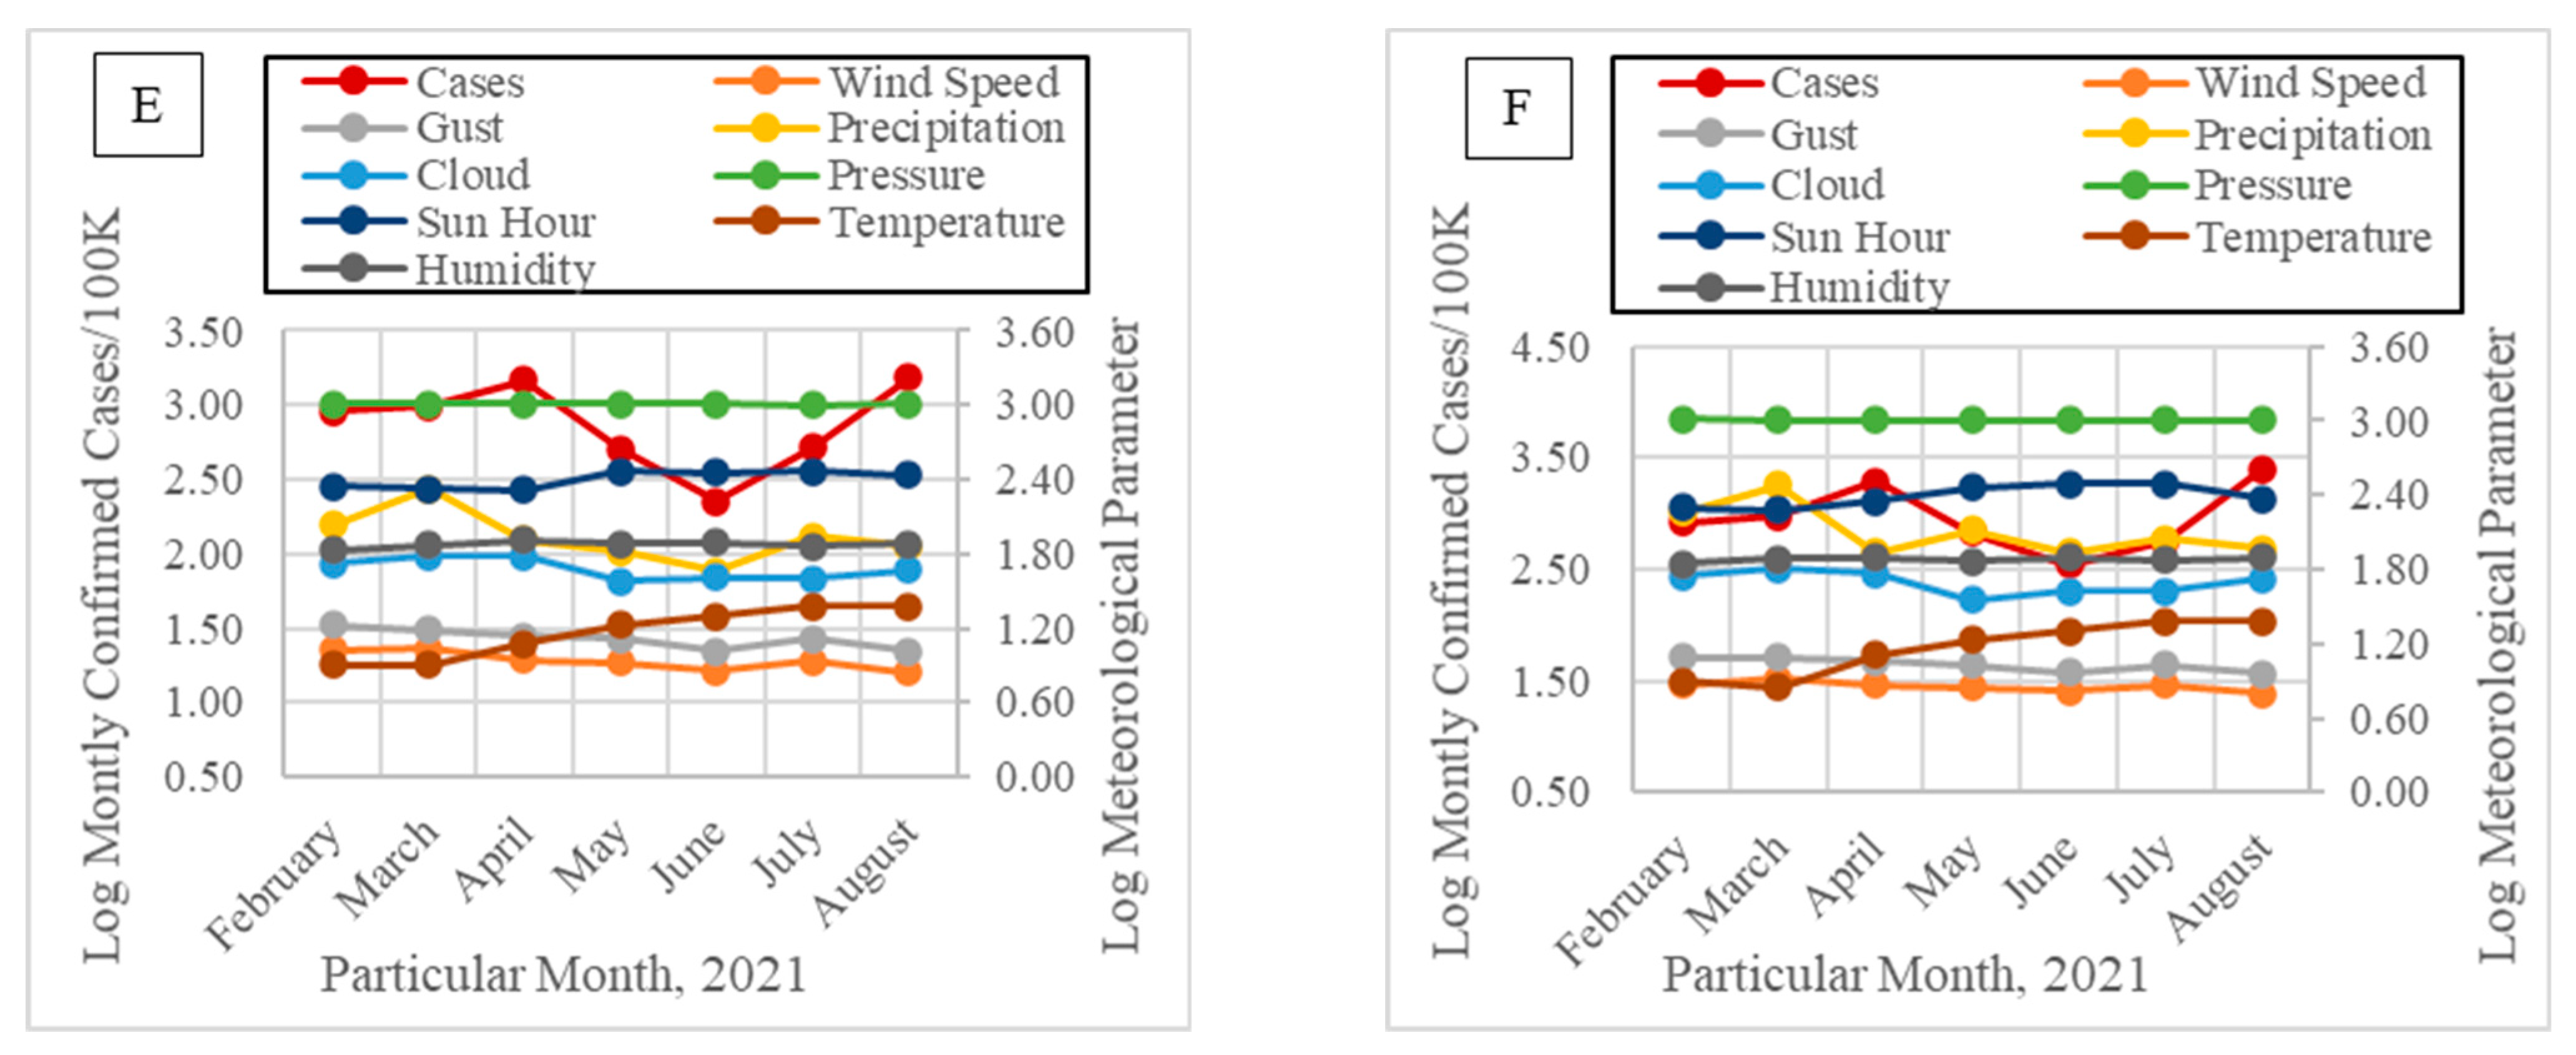
3.2. Relations between COVID-19 Confirmed Cases and Meteorological Factors in the Cities of Turkish Black Sea Region

The monthly logarithmic variations in terms of the number of COVID-19 confirmed cases/100,000 people and meteorological indicators concerning provinces located in the Black Sea region of Turkey from February to September 2021 are in Figure 3; Sections A–F show that the number of COVID-19 cases decreased as the temperature increased in all provinces. All meteorological indicators, except precipitation, showed similar patterns throughout the investigated period. The results in Figure 3 suggest a decreasing trend in the number of COVID-19 cases in May, with the lowest values in June. The reduction in confirmed COVID-19 cases can be also due to the two-and-a-half-week nationwide full lockdown from 29 April to 17 May enforced by the Turkish government to mitigate, wherever possible, the nationwide spread of COVID-19. During this continuous lockdown, all workplaces suspended their activities, except for manufacturing, food, cleaning, and health sectors [48]. Moreover, all households remained in their homes unless performing essential work. This decreasing trend confirms that person-to-person transmission, one of the forms of COVID-19 diffusion, plays a critical role in the rapid spread of SARS-CoV-2 across cities and countries [2,13,15,49].
The changes in the meteorological indicators show that atmospheric pressure, gust, relative humidity, and wind speed followed constant trends throughout the examined periods. The hours of sunshine followed a constant and similar trend in April for all cities in the study, whereas an increase was recorded from April to May; then, a stable trend was again recorded, except for the relatively decreased levels in Rize, from July to August. Similar precipitation trends were observed in Ordu, Giresun, and Rize during the examined period, but in Sinop, unlike the other provinces, a continuous decrease in precipitation was observed during the period from April to July, with a sudden growth level in precipitation in July. We observed that the cloud rate only decreased from April to May in all of the examined provinces and showed a constant trend during other periods. Finally, the results show that a notable increase in temperatures after April was associated with a decrease in COVID-19 cases in all provinces.
The statistical relationship between these meteorological factors (represented in Figure 3) and the spread of COVID-19 in the Black Sea region (where, in the months studied, the highest number of COVID-19 cases per 100,000 people in Turkey was observed) was analyzed with Kendall and Spearman’s correlations; the results are shown in Table 2.
The coefficients of Kendall and Spearman’s rank correlations show that many associations are not statistically significant, except for, in some provinces, the levels of precipitation, pressure, and hours of sunshine. In particular, Spearman’s correlation coefficient shows a statistically significant positive association between average atmospheric pressure and COVID-19 confirmed cases in the city of Samsun (Spearman’s correlation coefficient rs = 0.86, p-value 0.05). Kendall’s correlation coefficient confirms this positive association. The results also show a statistically significant positive association between average precipitation and COVID-19 confirmed cases in the city of Sinop (Spearman’s correlation coefficient rs = 0.79, p-value 0.05), and, finally, a statistically significant negative association between the average hours of sunshine and COVID-19 confirmed cases in the Samsun province (Spearman’s correlation coefficient rs = −0.89, p-value 0.01). Kendall’s correlation coefficient confirms these results.
In contrast to these statistically significant associations, the results in Table 2 suggest that some meteorological factors did not have a significant relationship with the spread of COVID-19 in the studied cities, likely due to manifold confounding factors associated with differences in the demographic and social aspects of the cities. However, in some cities, solar radiation and atmospheric pressure were the only weather factors showing statistically significant associations with the number of COVID-19 cases, while the remaining indicators, except for precipitation in the city of Sinop, generally show a non-significant correlation in these Turkish cities.

4. Discussion

These results are consistent with other studies. Iha et al. [18] suggested that ambient temperature and relative humidity were inversely associated with influenza A infection levels, while high relative humidity was directly associated with influenza B infection levels. A study by Şahin [20] investigated the correlation between weather conditions, including temperature, dew point, humidity, and wind speed, and COVID-19 in nine cities in Turkey using Spearman’s correlation coefficients; the results show that the highest correlations were with atmospheric factors of wind speed and temperature, respectively. Xie and Zhu [50] investigated whether average temperature plays a critical role in the spread of COVID-19 in 122 cities in China from 23 January to 29 February 2020, using a generalized additive model. They found that the mean temperature has a positive linear relationship with the number of COVID-19 cases when its value is below 3 °C; if the temperature exceeds 3 °C, it does not affect the spread of COVID-19 cases. In short, higher temperatures may not limit the transmission of this new coronavirus. Srivastava [22] suggested that local meteorological conditions severely impact the rate of COVID-19 mortality and morbidity. The results were consistent with the outcomes of the current study, emphasizing that an increase in solar radiation caused a decreasing trend in the number of cases of COVID-19, as was observed here, in the city of Samsun. Rosario et al. [46] conducted a study exploring the role of weather conditions (e.g., temperature, humidity, solar radiation, wind speed, and rainfall) on the spread of COVID-19 infections in the city of Rio de Janeiro (Brazil). Their findings suggest that solar radiation was the most significant weather factor, showing a significantly strong correlation, while average temperature and wind speed had a moderate correlation with COVID-19 confirmed cases, similar to the results of our statistical analysis here. Haque and Rahman [45] and Sarkodie and Owusu [47] suggested that increases in temperature and relative humidity can decrease the transmission levels of COVID-19. Studies suggest that viruses contained in droplets survive well when the relative humidity levels are below approximately 50% [12,23,51]. The study here endeavored to verify whether high levels of COVID-19 cases are more associated with humid regions by using a sample of cities in the Turkish Black Sea region which have very high relative humidity due to their specific geographical location and weather conditions. However, our results seem to suggest that relative humidity does not have a statistically significant association with the number of COVID-19 confirmed cases. This result is consistent with those found by Schuit et al. [52], who investigated the effect of meteorological factors including sunlight and relative humidity on the airborne stability of COVID-19. Their findings revealed that simulated sunlight impacts the decay rate of this new viral agent, but relative humidity alone did not affect the decay rate. This suggests the main role of the interactions between various meteorological factors in explaining the transmission dynamics of COVID-19 in society. Other studies by Sarkodie and Owusu [47] suggested that reductions in wind speed, dew/frost points, precipitation, and surface pressure encourage atmospheric stability and stagnant air, which can accelerate the diffusion and infectivity of viral agents similar to SARS-CoV-2 [28].
The fact that associations between the meteorological factors and COVID-19 cases were not consistent across all cities and were limited to one or two cities may be attributed to demographic and social differences based on the different population densities and environmental factors of these cities. These results can be supported by other empirical analyses in the literature. Coccia [53] investigated the associations between people infected with COVID-19 and environmental, demographic, and geographical variables in Italy. The results of the study suggested a positive correlation between people infected by COVID-19 and the average density of people per km2. In light of these scientific results, increases in the number of COVID-19 cases particularly in the cities of Trabzon, Samsun, and Ordu can be attributed to their higher population density compared to other cities in Turkey. In another study, Coccia [28] suggested that regions with high levels of air pollutants and atmospheric stability (with low wind speed) may support the survival of viral agents in the air, such as the SARS-CoV-2 virus, fostering the diffusion of COVID-19 and its negative impact on society. In the present work, the increase in COVID-19 confirmed cases in Giresun and Rize, which have low average wind speeds (8.41 km/h and 7.14 km/h, respectively) compared to average wind speed levels in other Turkish cities, is consistent with these results. In this context, our findings can expand the knowledge of these topics and help governments to design effective public policies for airborne disease containment based on climate-related and environmental factors, to prevent the diffusion of emerging variants of SARS-CoV-2 and similar viral agents in society [5,47,54,55,56,57].

5. Conclusions, Limitations and Prospects

The purpose of the present study was to explain the relationship between the spread of COVID-19 and meteorological factors of humidity, analyzing cities in the Black Sea region (Turkey) from February to September 2021 that have weather conditions involving high level of precipitations and average temperatures below 20 °C, with many cold and wet months [30]. The most important result is that the statistical evidence above seems, in general, to not support the hypothesis which stated that the diffusion of confirmed cases of COVID-19 can be explained by high levels of humidity. However, the results of the Spearman’s correlation coefficient here also suggest a statistically significant positive association between the average atmospheric pressure and COVID-19 cases in the city of Samsun (Spearman’s correlation coefficient rs = 0.86, p-value 0.05); a statistically significant positive association between the average precipitation and COVID-19 confirmed cases in the city of Sinop (Spearman’s correlation coefficient rs = 0.79, p-value 0.05); and finally, a statistically significant negative association between the average hours of sunshine and COVID-19 cases in the city of Samsun (Spearman’s correlation coefficient rs = −0.89, p-value 0.01). In general, statistical analyses here show that some cities in the Black Sea region of Turkey had strong associations between their COVID-19 cases over the February–August period and levels of atmospheric pressure, hours of sunshine, and precipitation compared to other cities. Nevertheless, many of these associations are not always consistent over time and across areas, and as a consequence we cannot conclude scientifically that any specific meteorological factor supports the diffusion of COVID-19 and similar infectious diseases.
Overall, the lessons learned from this study are that manifold aspects of the total environment and its related interactions, including demographic, social, economic, and environmental ones, etc., can explain the transmission dynamics of new viral agents of airborne diseases in society.
Although this study gives interesting results and insights that can support effective mitigation policies for future epidemics or pandemics of respiratory diseases, the results here are, of course, tentative. One of the problems is the difficulty to accurately predict the number of reported and unreported cases of COVID-19 in the studied region. Moreover, the sources and data analyzed may only capture certain aspects of the ongoing associations between meteorological factors and COVID-19 confirmed cases. Another limitation is that confounding situational factors could have essential roles in the transmission dynamics of COVID-19 and similar viral diseases in the cities. Hence, there is a need for much more detailed research into these relations.
In future studies, in addition to meteorological factors, the socioeconomic structures of regions, and the demography, health systems and the behavioral characteristics of their population have to be considered for comprehensive analyses [58]. Other factors to consider as well should be age, gender, welfare level, access to medical technologies, access to health services, etc., which play vital roles in clarifying the overall determinants of the diffusion of pandemic viral agents in society [59,60,61,62,63,64,65,66,67,68,69,70,71,72,73,74,75,76,77,78,79,80]. Due to the difficulty of accessing detailed data concerning cities in the studied region, and because the data are currently being updated, certain different factors were not evaluated in the current paper, but they will be considered in future studies.
Despite these limitations, the results here clearly illustrate statistically significant associations between some meteorological factors and COVID-19 cases in specific cities, and an elaborate and partial role of weather humidity, when considered in isolation, in explaining high levels of diffusion of the COVID-19. Policymakers should consider these results for the designing of effective control measures and health policies based on a systemic approach with manifold social and environmental factors, to minimize the negative effects of future variants of SARS-CoV-2 and/or new viral agents [11,27,28,59,60,61,62,63]. To conclude, a systemic approach for the evaluation of all interactions between meteorological, environmental, and socioeconomic factors can explain the effective transmission dynamics of new viral agents to improve pandemic crisis plans aimed at facing unknown infectious diseases similar to COVID-19 that we know will occur in the future, even if we do not know when.

Supplementary Materials

The following supporting information can be downloaded at: https://www.mdpi.com/article/10.3390/covid3110113/s1, Table S1: the demographic information of the provinces studied; Table S2: monthly COVID-19 cases per 100,000 people between February and August, 2021 for all provinces examined in the current study, Table S3: weekly cases of COVID-19 per 100,000 people from 8 February 2021 to 3 September 2021 for all provinces examined in the current study, Table S4: Average climate parameters in the investigated period for all provinces in Turkey examined in the current study.

Author Contributions

Aytac Perihan Akan (A.P.A.), Mario Coccia (M.C.): Conceptualization, A.P.A.; methodology, A.P.A.; validation, A.P.A. and M.C.; formal analysis, A.P.A.; investigation, A.P.A. and M.C.; data curation, A.P.A.; writing—original draft preparation, A.P.A.; writing—review and editing, A.P.A. and M.C.; visualization, A.P.A. and M.C.; supervision, M.C. All authors have read and agreed to the published version of the manuscript.

Funding

This research received no external funding.

Institutional Review Board Statement

Not applicable.

Informed Consent Statement

Not applicable.

Data Availability Statement

The datasets used and analyzed during the current study are available from the corresponding author on reasonable request.

Acknowledgments

Mario Coccia thanks the Consiglio Nazionale delle Ricerche-Unita’ Relazioni Internazionalifor funding Short TermMobility Program 2023 (n. 224705 del 2023-07-18, 2023-CNR0A00-0224705) at the Arizona State University where this study has been improved also with comments of colleagues of the ASU School of Complex Adaptive Systems.

Conflicts of Interest

The authors declare no conflict of interest.

References

  1. Akan, A.P.; Coccia, M. Changes of Air Pollution between Countries Because of Lockdowns to Face COVID-19 Pandemic. Appl. Sci. 2022, 12, 12806. [Google Scholar] [CrossRef]
  2. Bontempi, E.; Coccia, M. International trade as critical parameter of COVID-19 spread that outclasses demographic, economic, environmental, and pollution factors. Environ. Res. 2021, 201, 111514. [Google Scholar] [CrossRef] [PubMed]
  3. Bontempi, E.; Coccia, M.; Vergalli, S.; Zanoletti, A. Can commercial trade represent the main indicator of the COVID-19 diffusion due to human-to-human interactions? A comparative analysis between Italy, France, and Spain. Environ. Res. 2021, 201, 111529. [Google Scholar] [CrossRef]
  4. Coccia, M. Recurring waves of COVID-19 pandemic with different effects in public health. J. Econ. Bib. 2021, 8, 28–45. [Google Scholar] [CrossRef]
  5. Coccia, M. Pandemic Prevention: Lessons from COVID-19. Encyclopedia 2021, 1, 433–444. [Google Scholar] [CrossRef]
  6. Coccia, M. Optimal levels of vaccination to reduce COVID-19 infected individuals and deaths: A global analysis. Environ. Res. 2022, 204, 112314. [Google Scholar] [CrossRef]
  7. Coccia, M. The Spread of the Novel Coronavirus Disease-2019 in Polluted Cities: Environmental and Demographic Factors to Control for the Prevention of Future Pandemic Diseases. In Socioeconomic Dynamics of the COVID-19 Crisis; Faghih, N., Forouharfar, A., Eds.; Springer: Cham, Switzerland, 2022; pp. 351–369. [Google Scholar] [CrossRef]
  8. Coccia, M. Effects of strict containment policies on COVID-19 pandemic crisis: Lessons to cope with next pandemic impacts. Environ. Sci. Pollut. Res. Int. 2023, 30, 2020–2028. [Google Scholar] [CrossRef]
  9. World Health Organization. WHO Data. 2021. Available online: https://covid19.who.int/ (accessed on 27 September 2021).
  10. Coccia, M. Effects of Air Pollution on COVID-19 and Public Health, Research Article-Environmental Economics-Environmental Policy, ResearchSquare. 2020. Available online: https://www.researchsquare.com/article/rs-41354/v1 (accessed on 27 September 2023).
  11. Coccia, M. High potential of technology to face new respiratory viruses: Mechanical ventilation devices for effective healthcare to next pandemic emergencies. Technol. Soc. 2023, 73, 102233. [Google Scholar] [CrossRef]
  12. Akan, A.P. Transmission of COVID-19 pandemic (Turkey) associated with short-term exposure of air quality and climatological parameters. Environ. Sci. Pollut. Res. 2022, 29, 41695–41712. [Google Scholar] [CrossRef]
  13. Domingo, J.L.; Marquès, M.; Rovira, J. Influence of airborne transmission of SARS-CoV-2 on COVID-19 pandemic. A review. Environ. Res. 2020, 188, 109861. [Google Scholar] [CrossRef]
  14. Núñez-Delgado, A.; Bontempi, E.; Coccia, M.; Kumar, M.; Farkas, K.; Domingo, J.L. SARS-CoV-2 and other pathogenic microorganisms in the environment. Environ. Res. 2021, 201, 111606. [Google Scholar] [CrossRef] [PubMed]
  15. Rahimi, N.R.; Fouladi-Fard, R.; Aali, R.; Shahryari, A.; Rezaali, M.; Ghafouri, Y.; Ghalhari, M.R.; Asadi-Ghalhari, M.; Farzinnia, B.; Gea, O.C.; et al. Bidirectional association between COVID-19 and the environment: A systematic review. Environ. Res. 2021, 194, 110692. [Google Scholar] [CrossRef] [PubMed]
  16. Bashir, M.F.; Ma, B.; Bilal Komal, B.; Bashir, M.A.; Tan, D.; Bashir, M. Correlation between climate indicators and COVID-19 pandemic in New York, USA. Sci. Total Environ. 2020, 728, 138835. [Google Scholar] [CrossRef]
  17. Bolaño-Ortiz, T.R.; Camargo-Caicedo, Y.; Puliafito, S.E.; Ruggeri, M.F.; Bolaño-Diaz, S.; Pascual-Flores, R.; Saturno, J.; Ibarra-Espinosa, S.; Mayol-Bracero, O.L.; Torres-Delgado, E.; et al. Spread of SARS-CoV-2 through Latin America and the Caribbean region: A look from its economic conditions, climate and the air pollution indicators. Environ. Res. 2020, 191, 109938. [Google Scholar] [CrossRef] [PubMed]
  18. Iha, Y.; Kinjo, T.; Parrott, G.; Higa, F.; Mori, H.; Fujita, J. Comparative epidemiology of influenza A and B viral infection in a subtropical region: A 7-year surveillance in Okinawa, Japan. BMC Infect. Dis. 2016, 16, 650. [Google Scholar] [CrossRef] [PubMed]
  19. Lin, Y.; Chang, C.; Chang, S.; Chen, P.; Lin, C.; Wang, Y. Temperature, nitrogen dioxide, circulating respiratory viruses and acute upper respiratory infections among children in Taipei, Taiwan: A population-based study. Environ. Res. 2013, 120, 109–118. [Google Scholar] [CrossRef]
  20. Şahin, M. Impact of weather on COVID-19 pandemic in Turkey. Sci. Total Environ. 2020, 728, 138810. [Google Scholar] [CrossRef]
  21. Tosepu, R.; Gunawan, J.; Effendy, D.S.; Ahmad, L.O.A.I.; Lestari, H.; Bahar, H.; Asfian, P. Correlation between weather and COVID-19 pandemic in Jakarta, Indonesia. Sci. Total Environ. 2020, 725, 138436. [Google Scholar] [CrossRef]
  22. Srivastava, A. COVID-19 and air pollution and meteorology-an intricate relationship: A review. Chemosphere 2021, 263, 128297. [Google Scholar] [CrossRef]
  23. Cai, Q.C.; Lu, J.; Xu, Q.F.; Guo, Q.; Xu, D.Z.; Sun, Q.W.; Yang, H.; Zhao, G.M.; Jiang, Q.W. Influence of meteorological factors and air pollution on the outbreak of severe acute respiratory syndrome. Public Health 2007, 121, 258–265. [Google Scholar] [CrossRef]
  24. Yuan, J.; Yun, H.; Lan, W.; Wang, W.; Sullivan, S.G.; Jia, S.; Bittles, A.H. A climatologic investigation of the SARS-CoV outbreak in Beijing, China. Am. J. Infect. Control 2006, 34, 234–236. [Google Scholar] [CrossRef] [PubMed]
  25. Guo, C.; Bo, Y.; Lin, C.; Li, H.B.; Zeng, Y.; Zhang, Y.; Hossain, S.; Chan, J.W.; Yeung, D.W.; Kwok, K.-O.; et al. Meteorological factors and COVID-19 incidence in 190 countries: An observational study. Sci. Total Environ. 2021, 757, 143783. [Google Scholar] [CrossRef] [PubMed]
  26. Islam, A.R.M.T.; Hasanuzzaman; Azad, A.K.; Salam, R.; Toshi, F.Z.; Khan, S.I.; Alam, G.M.M.; Ibrahim, S.M. Effect of meteorological factors on COVID-19 cases in Bangladesh. Environ. Dev. Sustain. 2021, 23, 9139–9162. [Google Scholar] [CrossRef]
  27. Coccia, M. An index to quantify environmental risk of exposure to future epidemics of the COVID-19 and similar viral agents: Theory and practice. Environ. Res. 2020, 191, 110155. [Google Scholar] [CrossRef] [PubMed]
  28. Coccia, M. The effects of atmospheric stability with low wind speed and of air pollution on the accelerated transmission dynamics of COVID-19. Int. J. Environ. Sci. 2021, 78, 1–27. [Google Scholar] [CrossRef]
  29. Coccia, M. How do low wind speeds and high levels of air pollution support the spread of COVID-19? Atmos. Pol. Res. 2021, 12, 437–445. [Google Scholar] [CrossRef]
  30. Coşkun, H.; Yıldırım, N.; Gündüz, S. The spread of COVID-19 virus through population density and wind in Turkey cities. Sci. Total Environ. 2021, 751, 141663. [Google Scholar] [CrossRef]
  31. Aral, N.; Bakır, H. Spatiotemporal Analysis of COVID-19 in Turkey. Sustain. Cities Soc. 2022, 76, 103421. [Google Scholar] [CrossRef]
  32. Sanchez-Piedra, C.; Cruz-Cruz, C.; Gamiño-Arroyo, A.E.; Prado-Galbarro, F.J. Effects of air pollution and climatology on COVID-19 mortality in Spain. Air Qual. Atmos. Health 2021, 14, 1869–1875. [Google Scholar] [CrossRef]
  33. Olak, A.S.; Santos, W.S.; Susuki, A.M.; Pott-Junior, H.; Skalny, A.V.; Tinkov, A.A.; Aschner, M.; Pinese, J.P.P.; Urbano, M.R.; Paoliello, M.M.B. Meteorological parameters and cases of COVID-19 in Brazilian cities: An observational study. J. Toxicol. Environ. Health A 2021, 85, 14–28. [Google Scholar] [CrossRef]
  34. Maatoug, A.B.; Triki, M.B.; Fazel, H. How do air pollution and meteorological parameters contribute to the spread of COVID-19 in Saudi Arabia? Environ. Sci. Pollut. Res. 2021, 28, 44132–44139. [Google Scholar] [CrossRef] [PubMed]
  35. Sarwar, S.; Shahzad, K.; Fareed, Z.; Shahzad, U. A study on the effects of meteorological and climatic factors on the COVID-19 spread in Canada during 2020. J. Environ. Health Sci. Eng. 2021, 19, 1513–1521. [Google Scholar] [CrossRef] [PubMed]
  36. Pal, S.K.; Masum, M.H. Effects of meteorological parameters on COVID-19 transmission trends in Bangladesh. Environ. Sustain. 2021, 4, 559–568. [Google Scholar] [CrossRef]
  37. Kolluru, S.S.R.; Patra, A.K.; Nazneen Nagendra, S.M.S. Association of air pollution and meteorological variables with COVID-19 incidence: Evidence from five megacities in India. Environ. Res. 2021, 195, 110854. [Google Scholar] [CrossRef]
  38. Hoang, T.; Tran, T.T.A. Ambient air pollution, meteorology, and COVID-19 infection in Korea. J. Med. Virol. 2021, 93, 878–885. [Google Scholar] [CrossRef]
  39. Doğan, B.; Jebli, M.B.; Shahzad KFarooq, T.H.; Shahzad, U. Investigating the Effects of Meteorological Parameters on COVID-19: Case Study of New Jersey, United States. Environ. Res. 2020, 191, 110148. [Google Scholar] [CrossRef]
  40. Wu, Y.; Jing, W.; Liu, J.; Ma, Q.; Yuan, J.; Wang, Y.; Du, M.; Liu, M. Effects of temperature and humidity on the daily new cases and new deaths of COVID-19 in 166 countries. Sci. Total Environ. 2020, 729, 139051. [Google Scholar] [CrossRef]
  41. Demongeot, J.; Flet-Berliac, Y.; Seligmann, H. Temperature decreases spread parameters of the new COVID-19 case dynamics. Biology 2020, 9, 94. [Google Scholar] [CrossRef]
  42. Wang, J.; Tang, K.; Feng, K.; Lv, W. High Temperature and High Humidity Reduce the Transmission of COVID-19. 2020. Available online: https://www.scienceopen.com/document_file/ff8b579c-26ff-4c3c-9aa5-a141bc8e35f6/PubMedCentral/ff8b579c-26ff-4c3c-9aa5-a141bc8e35f6.pdf (accessed on 27 September 2023).
  43. COVID-19. Information about COVID-19 Cases from the Republic of Turkey Ministry of Health. 2021. Available online: https://covid19.saglik.gov.tr/?_Dil=2 (accessed on 25 September 2022).
  44. World Weather Online. WWO Data. 2021. Available online: https://www.worldweatheronline.com (accessed on 27 January 2023).
  45. Haque, S.E.; Rahman, M. Association between temperature, humidity, and COVID-19 outbreaks in Bangladesh. Environ. Sci. Policy 2020, 114, 253–255. [Google Scholar] [CrossRef]
  46. Rosario, D.K.A.; Mutz, Y.S.; Bernardes, P.C.; Conte-Junior, C.A. Relationship between COVID-19 and weather: Case study in a tropical country. Int. J. Hydrog. Environ. Health 2020, 229, 113587. [Google Scholar] [CrossRef]
  47. Sarkodie, S.A.; Owusu, P.A. Impact of meteorological factors on COVID-19 pandemic: Evidence from top 20 countries with confirmed cases. Environ. Res. 2020, 191, 110101. [Google Scholar] [CrossRef] [PubMed]
  48. Coccia, M. COVID-19 pandemic over 2020 (with lockdowns) and 2021 (with vaccinations): Similar effects for seasonality and environmental factors. Environ. Res. 2022, 208, 112711. [Google Scholar] [CrossRef] [PubMed]
  49. Yao, Y.; Pan, J.; Wang, W.; Liu, Z.; Kan, H.; Qui, Y.; Meng, X.; Wang, W. Association of particular matter pollution and case fatality rate of COVID-19 in 49 Chinese cities. Sci. Total Environ. 2020, 741, 140396. [Google Scholar] [CrossRef]
  50. Xie, J.; Zhu, Y. Association between ambient temperature and COVID-19 infection in122 cities from China. Sci. Total Environ. 2020, 724, 138201. [Google Scholar] [CrossRef]
  51. Zoran, M.A.; Savastru, R.S.; Savastru, D.M.; Tautan, M.N. Assessing the relationship between surface levels of PM2.5and PM10 particulate matter impact on COVID-19 in Milan, Italy. Sci. Total Environ. 2020, 738, 139825. [Google Scholar] [CrossRef]
  52. Schuit, M.; Ratnesar-Shumate, S.; Yolitz, J.; Williams, G.; Weaver, W.; Green, B.; Miller, D.; Krause, M.; Beck, K.; Wood, S.; et al. Airborne SARS-CoV-2 is rapidly inactivated by simulated sunlight. J. Infect. Dis. 2020, 222, 564–571. [Google Scholar] [CrossRef]
  53. Coccia, M. Effects of the spread of COVID-19 on public health of polluted cities: Results of the first wave for explaining the dejà vu in the second wave of COVID-19 pandemic and epidemics of future vital agents. Environ. Sci. Pollut. Res. 2021, 28, 19147–19154. [Google Scholar] [CrossRef]
  54. COP26. 26th Conference of Parties, United Nations Framework Convention on Climate Change. 2021. Available online: https://unfccc.int/conference/glasgow-climate-change-conference-october-november-2021 (accessed on 29 December 2021).
  55. Caliskan, B.; Özengin, N.; Cindoruk, S.S. Air quality level, emission sources and control strategies in Bursa/Turkey. Atmos. Pollut. Res. 2020, 11, 2182–2189. [Google Scholar] [CrossRef]
  56. Coccia, M. Comparative Critical Decisions in Management. In Global Encyclopedia of Public Administration, Public Policy, and Governance; Farazmand, A., Ed.; Springer Nature: Cham, Switzerland, 2021. [Google Scholar] [CrossRef]
  57. Coccia, M. The relation between length of lockdown, numbers of infected people and deaths of COVID-19, and economic growth of countries: Lessons learned to cope with future pandemics similar to COVID-19 and to constrain the deterioration of economic system. Sci. Total Environ. 2021, 775, 145801. [Google Scholar] [CrossRef]
  58. Aykaç, N.; Etiler, N. COVID-19 mortality in Istanbul in association with air pollution and socioeconomic status: An ecological study. Environ. Sci. Pollut. Res. 2021, 29, 13700–13708. [Google Scholar] [CrossRef]
  59. Benati, I.; Coccia, M. Global analysis of timely COVID-19 vaccinations: Improving governance to reinforce response policies for pandemic crises. Int. J. Health Gov. 2022, 27, 240–253. [Google Scholar] [CrossRef]
  60. Benati, I.; Coccia, M. Effective Contact Tracing System Minimizes COVID-19 Related Infections and Deaths: Policy Lessons to Reduce the Impact of Future Pandemic Diseases. J. Public Adm. Gov. 2022, 12, 19–33. [Google Scholar] [CrossRef]
  61. Coccia, M.; Benati, I. Comparative Evaluation Systems. In Global Encyclopedia of Public Administration, Public Policy, and Governance; Farazmand, A., Ed.; Springer Nature: Cham, Switzerland, 2018. [Google Scholar] [CrossRef]
  62. Coccia, M. Preparedness of countries to face COVID-19 pandemic crisis: Strategic positioning and factors supporting effective strategies of prevention of pandemic threats. Environ. Res. 2022, 203, 111678. [Google Scholar] [CrossRef]
  63. Coccia, M. Sources, diffusion and prediction in COVID-19 pandemic: Lessons learned to face next health emergency. AIMS Public Health 2023, 10, 145–168. [Google Scholar] [CrossRef]
  64. Coccia, M. Factors determining the diffusion of COVID-19 and suggested strategy to prevent future accelerated viral infectivity similar to COVID. Sci. Total Environ. 2020, 729, 138474. [Google Scholar] [CrossRef]
  65. Coccia, M. Comparative Institutional Changes. In Global Encyclopedia of Public Administration, Public Policy, and Governance; Farazmand, A., Ed.; Springer Nature: Cham, Switzerland, 2019. [Google Scholar] [CrossRef]
  66. Coccia, M. Intrinsic and extrinsic incentives to support motivation and performance of public organizations. J. Econ. Bibliogr. 2019, 6, 20–29. [Google Scholar] [CrossRef]
  67. Coccia, M. General properties of the evolution of research fields: A scientometric study of human microbiome, evolutionary robotics and astrobiology. Scientometrics 2018, 117, 1265–1283. [Google Scholar] [CrossRef]
  68. Coccia, M. Asymmetry of the technological cycle of disruptive innovations. Technol. Anal. Strateg. Manag. 2020, 32, 1462–1477. [Google Scholar] [CrossRef]
  69. Coccia, M. New directions of technologies pointing the way to a sustainable global society. Sustain. Futures 2023, 5, 100114. [Google Scholar] [CrossRef]
  70. Magazzino, C.; Mele, M.; Coccia, M. A machine learning algorithm to analyze the effects of vaccination on COVID-19 mortality. Epidemiol. Infect. 2022, 150, e168. [Google Scholar] [CrossRef]
  71. Coccia, M. A new approach for measuring and analyzing patterns of regional economic growth: Empirical analysis in Italy. Ital. J. Reg. Sci. 2009, 8, 71–95. [Google Scholar] [CrossRef]
  72. Coccia, M. Classification of innovation considering technological interaction. J. Econ. Bib 2018, 5, 76–93. [Google Scholar] [CrossRef]
  73. Coccia, M. Theories of Development. In Global Encyclopedia of Public Administration, Public Policy, and Governance; Farazmand, A., Ed.; Springer: Cham, Switzerland, 2019. [Google Scholar] [CrossRef]
  74. Coccia, M. Improving preparedness for next pandemics: Max level of COVID-19 vaccinations without social impositions to design effective health policy and avoid flawed democracies. Environ. Res. 2022, 213, 113566. [Google Scholar] [CrossRef] [PubMed]
  75. Coccia, M. The Relation between Environmental, Demographic, and Geographical Factors, and COVID-19 Diffusion: A Case Study. J. Adm. Soc. Sci. 2021, 7, 169–209. [Google Scholar] [CrossRef]
  76. Coccia, M. Meta-analysis to explain unknown causes of the origins of SARS-CoV-2. Environ. Res. 2022, 111, 113062. [Google Scholar] [CrossRef]
  77. Coccia, M. COVID-19 Pandemic Crisis: Analysis of Origins, Diffusive Factors and Problems of Lockdowns and Vaccinations to Design Best Policy Responses; KSP Books: Istanbul, Turkey, 2023; Volume 2, ISBN 978-625-7813-54-9. [Google Scholar]
  78. Núñez-Delgado, A.; Zhang, Z.; Bontempi, E.; Coccia, M.; Race, M.; Zhou, Y. New Research on Detection and Removal of Emerging Pollutants. Materials 2023, 16, 725. [Google Scholar] [CrossRef]
  79. Anastopoulos, I.; Bontempi, E.; Coccia, M.; Quina, M.; Shaaban, M. Sustainable strategic materials recovery, what’s next? Next Sustain. 2023, 100006. [Google Scholar] [CrossRef]
  80. Abi-Rached, J.M.; Brandt, A.M. Do Pandemics Ever End? N. Engl. J. Med. 2023, 389, 1349–1351. [Google Scholar] [CrossRef]
Figure 1. Locations of the examined provinces in Turkey including Samsun (41°15′25.2″ N, 36°4′42.6″ E), Sinop (41°39′3.6″ N, 34°51′19.8″ E), Ordu (40°46′28.2″ N, 37°26′52.8″ E), Giresun (40°33′59.4″ N, 38°35′56.4″ E), Trabzon (40°49′6.6″ N, 39°47′27.6″ E), and Rize (40°54′59.4″ N, 40°51′16.2″ E). Taken from Google MapsTM (2023).
Covid 03 00113 g001
Figure 2. Change in average meteorological factors in the studied Turkish cities from 8 February to 3 May 2021: (A) = temperature, (B) = wind speed, (C) = gust, (D) = precipitation, (E) = humidity, (F) = cloud rate, (G) = atmospheric pressure, and (H) = hours of sunshine, respectively.
Covid 03 00113 g002
Figure 3. Logarithmic variations in the number of COVID-19 confirmed cases/100,000 people and meteorological indicators in the studied Turkish cities: (A) Sinop, (B) Samsun, (C) Ordu, (D) Giresun, (E) Trabzon, and (F) Rize.
Covid 03 00113 g003aCovid 03 00113 g003b
Table 2. Kendall and Spearman’s correlation coefficients based on the associations between COVID-19 confirmed cases and meteorological factors in cities of the Black Sea region of Turkey from February to September 2021.
Kendall’s Correlation Coefficients, rk
Cities in the Black Sea Region of Turkey
Meteorological IndicatorsSamsunSinopOrduGiresunTrabzonRize
Minimum Temperature−0.451−0.350−0.488−0.350−0.050−0.150
Maximum Temperature−0.333−0.350−0.451−0.350−0.143−0.150
Average Temperature−0.390−0.390−0.451−0.350−0.050−0.195
Average Wind Speed0.1430.3210.1950.1430.1430.098
Average Gust0.1430.3210.1950.1430.1430.098
Average Precipitation0.4290.6190.4290.1430.3330.195
Average Relative Humidity0.0980.0980.1500.1500.0000.293
Average Cloud Rate0.5240.4290.3900.2930.4880.390
Average Atmospheric Pressure0.714 *0.3330.4290.3330.0480.143
Average Hours of Sunshine−0.810 *−0.429−0.524−0.429−0.429−0.524
Spearman’s Correlation Coefficients, rs
Cities in the Black Sea Region of Turkey
Meteorological IndicatorsSamsunSinopOrduGiresunTrabzonRize
Minimum Temperature−0.673−0.491−0.703−0.491−0.910−0.182
Maximum Temperature−0.607−0.491−0.673−0.491−0.179−0.182
Average Temperature−0.649−0.523−0.673−0.491−0.091−0.198
Average Wind Speed0.2500.3060.1430.2520.1430.144
Average Gust0.2500.3210.5580.2140.1070.900
Average Precipitation0.5710.786 *0.4640.2140.4290.054
Average Relative Humidity0.2340.0720.2730.1820.0540.487
Average Cloud Rate0.7140.6070.6310.5050.6670.631
Average Atmospheric Pressure0.857 *0.5000.6790.5000.1430.214
Average Hours of Sunshine−0.893 **−0.571−0.679−0.536−0.643−0.679
Note: * correlation is significant at 0.05 level (2-tailed); ** correlation is significant at 0.01 level (2-tailed). The family-wise error rate (FWER) for ten comparisons at a 0.05 significance level was calculated at 0.40.
Disclaimer/Publisher’s Note: The statements, opinions and data contained in all publications are solely those of the individual author(s) and contributor(s) and not of MDPI and/or the editor(s). MDPI and/or the editor(s) disclaim responsibility for any injury to people or property resulting from any ideas, methods, instructions or products referred to in the content.

