Abstract
COVID-19 is an acute respiratory illness in humans caused by a coronavirus, capable of producing severe symptoms and, in some cases, death, especially in older people and those with underlying health conditions. It was originally identified in China in 2019 and became a pandemic in 2020. On 6 March 2020, Cameroon recorded its first cases of infection with COVID-19. The Government of Cameroon (GOC) took 13 barrier measures on 18 March 2020. On 1 May 2020, 19 new measures were adopted, easing restrictions and encouraging economic activity. On 1 June, schools and universities were reopened, after which massive screening began to take place throughout the country. In this study, we have modelled the COVID-19 epidemic in Cameroon in order to assess the governmental measures of response and predict the behaviour of epidemic As a result of these measures, the pandemic evolved in three phases. The first phase began on 18 March and ended on 15 May 2020. During this phase, the actual curve of cumulative positive cases based on field data closely fit the theoretical curve resulting from mathematical modelling. In the beginning of May, we predicted that nearly 3000 positive cases would be declared by mid-May 2020. The actual data confirmed these predictions: there were 2954 cases as of 15 May 2020. The second phase, beyond mid-May 2020, encompasses the period when the GOC’s relaxation of measures takes effect. This phase was marked by an acceleration of the cumulative number of positive cases starting in the third week of May, postponing the expected peak by two weeks. Under Phase 2 conditions, the onset of the peak will occur in early June and extend through the first two weeks of June. However, a third phase occurs in the first week of June, with the reopening of schools and universities combined with massive screening; the peak is therefore expected in the second week of June (around 15 June). The GOC should, at this stage, strengthen its response plan by tripling the current coverage capacity to regain the first phase convergence conditions associated with the first 13 measures. The pandemic will begin its descent in the month of august, but COVID-19 will remain endemic for at least one year.
1. Introduction
Mathematical modelling is a process by which a real-world problem is interpreted in terms of abstract symbols [1]. It is the entire process that allows the intervention of mathematics in a science based on experience or observation. Various steps in the modelling process can be distinguished. First, the scientist makes hypotheses about the phenomena studied, and these assumptions are translated mathematically into a model. On the basis of the model, qualitative or quantitative predictions are made and compared with experimental realities. The hypotheses are reviewed, possibly leading to modifications in the model, and the cycle continues. Mathematical modelling has been applied to several disciplines, including economics, biology agriculture, ecology, industry, and public health [2]. In epidemiology, mathematical models help in understanding the spread of infectious agents and predicting or estimating of the impact of mitigating actions, with the major goal of allowing the system to continue to function by flattening the epidemic curve.
Departing from China in Wuhan on 31 December 2019, the coronavirus epidemic rapidly spread worldwide. After three months of the pandemic, 185 countries were affected [3]. As of 12 April 2020, the world has recorded 1.9 million confirmed cases, with more than 120,000 deaths. Italy [4], France, the United States, and Spain have paid the heaviest price in this pandemic. As of 14 April 2020, France reported more than 15,000 deaths, Spain reported more than 18,000, Italy reported more than 20,000, and the United States reported more than 23,000 deaths. As the world entered its sixteenth epidemiological week, the pandemic had become a public health problem for each affected country. Cameroon is one of the most affected countries in Africa, with nearly 1000 cases confirmed as of 15 April 2020. Coronavirus disease is a highly contagious disease, and the strain is SARS-CoV-2 [5]. It belongs to the coronavirus family, which can cause benign diseases in humans, such as a cold, and can also cause serious pathologies such as Severe Acute Respiratory Syndrome (SARS). Basic reproduction number () is an indication of the transmissibility of a virus, representing the average number of new infections generated by an infectious person in a totally naive population. For , the number infected is likely to increase; for , the transmission is likely to die out. The basic reproduction number is a central concept in infectious disease epidemiology, indicating the risk of an infectious agent with respect to epidemic spread [6]. Considerable works can be found regarding the estimation of the reproductive number of novel coronavirus COVID-19 [6,7]. Liu et al. identified 12 studies that estimated the basic reproductive number for COVID-19 from China and overseas. The period covered was from 1 January 2020 to 7 February 2020. They found that the R0 was between to . Several models have been used to understand the spread of COVID-19 better. According to Kathakali Biswas et al., the cumulative data can fit into an empirical form obtained from a Susceptible–Infected–Removed (SIR) model studied on a Euclidean network previously [8]. Wu et al. [9,10] introduced a susceptible–exposed–infectious–recovered model to describe the transmission dynamics. The Chayu et al. model describes the multiple transmission pathways in the infection dynamics and emphasises the role of the environmental reservoir in the transmission and spread of this disease [11,12]. Dashraath et al. found that pregnant women and their fetuses represent a high-risk population during infectious disease outbreaks [9]. Some authors have studied the impact of climate on the spread of novel coronavirus [13,14]. Luo et al. discussed the role of absolute humidity on transmission rates of the novel coronavirus outbreak [15]. Baud et al. showed real estimates of mortality following COVID-19 infection [16]. Zoltan et al. studied COVID-19 epidemic outcome predictions based on logistic fitting and estimation of its reliability. Mathematical models can also be used to calculate certain parameters, such as the basic reproduction rate [17], which corresponds (in a simplified manner) to the average number of individuals that a carrier will infect during the duration of his or her contagious period. Under certain conditions, gives an indication of the proportion of the population likely to be infected during the epidemic. In general, the of SARS-CoV-2 is estimated to be about [7], which would suggest, applying the formula simplistically, that 60% of the world population could be infected. In Cameroon, evolves from at the beginning of the epidemic.
In this work, we present a mathematical model of the 2019 coronavirus disease (COVID-19) in Cameroon. The model is based on : The susceptible compartment—. Susceptible individuals respecting barrier measures—. Carrier, infected person is in period of incubation; therefore, laboratory diagnosis has not been made—. Confirmed case undetected regardless of status (asymptomatic or symptomatic) and living in the community—. Confirmed case hospitalised—. Confirmed case recovered in community compartment—. Confirmed case recovered after hospitalisation compartment—. Novel coronavirus death in the community compartment—. COVID-19 death after hospitalisation compartment—. The second model aims to provide a rapid, but relatively reliable, data-based estimate of the impact of the disease in the community transmission phase of the virus. We estimate the numbers of cumulative cases, active cases, deaths, and recoveries; the time of the spread of the epidemic; and the date of its probable peak. After two cases were confirmed (1 imported and 1 other contaminated) in Yaoundé on 6 March 2020, the Minister of Public Health activated the system management of public health emergencies. Subsequently, the escalation of the outbreak in the world sparked the return of several exposed people to Cameroon. The submerged entry device was only able to capture a few cases. The government has taken a series of measures to reduce the spread of COVID-19. The first 13 government measures to combat the spread of the COVID-19 pandemic have been implemented throughout the country since 18 March 2020, with the key points being the closure of all maritime and land air borders; the closure of public and private schools and universities until further notice; and the systematic quarantine of passengers arriving at the international airports of Douala, Garoua, and Yaoundé. those 13 barrier measures were applied between 18 March 2020 and 1 May 2020.
In Cameroon, more than 40 confirmed cases have been reported. At the beginning of the outbreak, we worked on the impact of undetected infected persons on the spread of the disease, coinciding with the implementation of the 13 government barrier measures [18]. This study led to three different scenarios with a compliance rate of 50%: with 50% of infectious people not detected, we had a peak around 20 May; with 20% of infectious people not detected, we had the peak around 15 June; and with 80% of infectious people not detected, we had the peak around the first week of May. On the other hand, we found out that if is around 5, we will have several waves of the COVID-19 outbreak for at least 8 years; with each new wave, the amplitude of the peak will be less than the previous one; after a few years, the COVID-19 infection will become endemic. On 1 May 2020, relaxation of the precedent measures was introduced, and later, the reopening of universities and mass screening on 1 June. The objective of this work is to highlight the impact of successive measures on the spread of COVID-19 in Cameroon during the period of March to June; some projections will also be presented. This document has ten sections.
The next Section 2 presents the epidemiological situation in May. Section 3 discusses model formulation. Basic reproduction number and disease-free equilibrium are presented in Section 4, followed by calibration in Section 5. Evaluation of the successive responses arrives in Section 7. General spread of infection and prediction of peak is described in Section 8. Section 9 discusses the dynamics of from March to September. The Discussion and conclusion are presented in Section 10.
1.1. Sources Data
We collected the daily numbers of laboratory-confirmed COVID-19 active cases, deaths, and recovered patients, released by the Cameroon Health Emergency Operations Center, from 6 March 2020 to 4 May 2020, to construct a real-time database.
1.2. Foreword
The safest way to deal with an epidemic or pandemic is to break the chain of transmission. This involves the application of personal and collective barrier measures, early detection, awareness-raising, and case management. In this work, compartmentalised models are used to predict the evolution of the COVID-19 pandemic in Cameroon. Such modelling is essential for decision making by policy makers and health authorities. We hope that it will strengthen the country’s response mechanism and clarify the thinking of decision makers concerning the impact of the measures they adopt.
2. Epidemiological Situation in May, Two Months after the Beginning of Outbreak
2.1. Evolution of COVID-19 Total Cases in Cameroon from February to May 2020
Cameroon registered its first case of COVID-19 on 6 March 2020. Two months later, in the early morning hours of 22 May 2020, there were 4156 total cases, released by the Cameroon Health Emergency Operations Center of Yaoundé (figure according to http://coronavirus.politologue.com/coronavirus-Cameroun.cm [19]) (Accessed on 1 June 2021). The number of active cases is also rising sharply. This means that community transmission is very intense. The number of deaths also follows this trend, with a fairly low slope; after two months of outbreak, Cameroon had less than 500 deaths from COVID-19 (see Appendix A.3)
2.2. Geographical Distribution of COVID-19
During the month of May 2020, the epidemic was in its rising phase; consequently, the activities related to the commemoration of the national day (20 May) were cancelled. More than 3500 cases in total were reported by May 20 (Figure 1). The epicentre of the pandemic started in the central and coastal regions of Cameroon. Gradually, the pandemic spread to the western; eastern; southwestern; and lastly, the far north regions (Table 1).
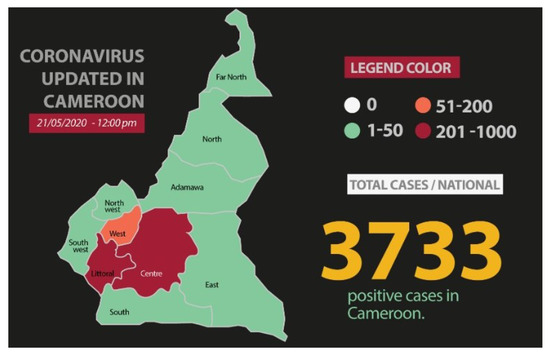
Figure 1.
Total cases reported by 21 May.

Table 1.
Regional distribution of COVID-19 cases in Cameroon in early May.
3. Model Formulation
Epidemiologists are currently developing, testing, and adjusting models to simulate the spread of severe acute respiratory syndrome coronavirus 2 (SARS-CoV-2) [16,20,21,22] in order to better understand the COVID-19 pandemic and optimise interventions to control it. The most common models are those derived from the famous S.I.R model developed in 1927 [23] by Kermack and McKendrick, which describes the transition between Susceptible (S), Infectious (I), and Recovered (R) populations of individuals. Susceptible individuals are those not immune to the contagious agent. Infectious individuals are those currently infected; without necessarily being symptomatic themselves, they may infect susceptible individuals. Recovered individuals are immune to the disease after having fought it. This model is too simple to take into account all the subtleties of the reality of human exchanges. In the case of SARS-CoV-2, it would better reflect reality to add compartments to the basic model. In this work, we propose a compartmental model () based on the disease’s clinical progression and the epidemiological status of individuals. Specifically, the population is subdivided into several compartments: The susceptible compartment—. Susceptible individuals respecting barrier measures—. Carrier, infected person is in period of incubation; therefore, laboratory diagnosis has not been made—. Confirmed case undetected regardless of status (asymptomatic or symptomatic) and living in the community—. Confirmed case hospitalised—. Confirmed case recovered in community compartment—. Confirmed case recovered after hospitalisation compartment—. COVID-19 death in the community compartment—. COVID-19 death after hospitalisation compartment—. Our model includes a net inflow of susceptible individuals into the region at a rate of per unit time. This parameter includes new births, immigration, and emigration. The susceptible population is reduced by the rate—the proportion of susceptible population that applies barrier measures. Moreover, the susceptible population decreases after infection, acquired through interaction between a susceptible individual and a Confirmed case hospitalised person or Confirmed case in community person at a rate of . Despite the respect of barriers measures, the population remains susceptible to some extent and decreases after infection, acquired through interaction between a susceptible individual and a Confirmed case hospitalised person or Confirmed case recovered in community person at a rate of (). A newly infected susceptible individual from group S or becomes a carrier individual, and the rate of infection is given by for S and for , where , are the rate of transmission of compartments S and , respectively. Carriers individuals are infected individuals that have not been exposed to the community. Once a carrier, individuals progress through the Confirmed case hospitalised person (infectious) or Confirmed case in community person (infectious) stages with an average . A fraction p of carrier individuals progress to the confirmed case hospitalised stage, while a fraction of carrier individuals progress to the confirmed case in the community stage. is the disease-caused death rate for compartment, and is the disease-caused death rate for compartment. The recovery rate of the confirmed case in the community () is and the recovery rate of the confirmed case hospitalised () is . The confirmed case in the community population is reduced by the rate, which is the proportion of patients who leave the community for the hospital. The abovementioned biological descriptions lead to the following compartmental scheme (flow diagram) Figure 2 and a system of nonlinear differential Equation (1), whose state variables and parameters are displayed in Table 2.
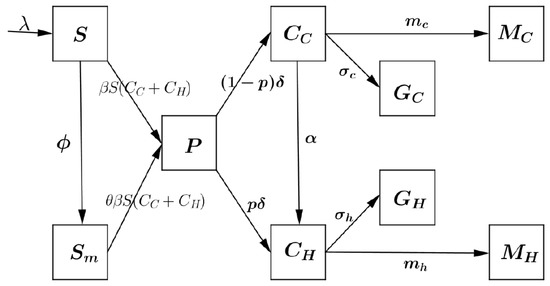
Figure 2.
Scheme of the compartmental model.

Table 2.
Description of state variables and parameters of model (1).
In order to assess the successive governmental response strategies, we will focus on the part of model concerning the confirmed cases and the deaths declared at hospital. The Global model (1) is then reduced to the following system of nonlinear Equation (2); this last model (2) has the same basics properties as the model, where global stability analysis and has been performed on [24].
4. Disease-Free Equilibrium and Basic Reproduction Number
It is easy to check that model (2) always has a disease-free equilibrium (DFE):
which is obtained by setting the right-hand side of system (2) to zero.
A key quantity in classic epidemiological models is the basic reproduction number, denoted by . It is a useful threshold in the study of a disease for predicting a disease outbreak and for evaluating control strategies. Following [1], the next-generation approach is used to calculate .
Let us consider just the equations describing the dynamic of infected subpopulation compartments.
The Jacobian matrix of system (6) at the DFE is
where F and V are, respectively, the Jacobian matrix of transmission (next-generation infected) and the Jacobian matrix of migration. The Jacobian matrix of and at the DFE are
and
From the conclusion by [1], the associated basic reproduction number of (2) is the spectral radius of the next-generation matrix . That is,
5. Model Calibration
5.1. Calibration
For the results of a prediction model to be reliable, it is essential that they be calibrated against data from the real world [26]. This requires comparing model results with data gathered in the field to identify points of divergence between the two. The reasons for any discrepancies must be determined, and the necessary adjustments made to calibrate the model properly. In the present study, we collected day-by-day the numbers of laboratory-confirmed cases, confirmed deaths due to COVID-19, and recoveries from 6 March to 27 May 2020, as provided by the Centre National des Operations Durgences Sanitaires (see Appendix A). The calibration of the model using total case data is shown in Figure 3.
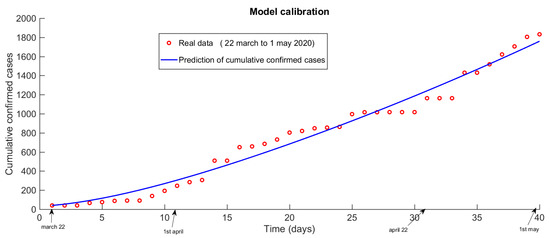
Figure 3.
Calibration of the COVID-19 propagation model in Cameroon.
5.2. Total Cases Predicted Two Weeks Earlier
Cameroon recorded its first case of COVID-19 on 6 March 2020. In the early morning hours of 15 May 2020, there were 3000 cumulative cases reported. This is in line with Figure 4, predicted by the model, and the trend of the spread of COVID-19 in Cameroon’s simulation was performed on 1 May 2020. The proposed model is therefore reliable and reproducible.
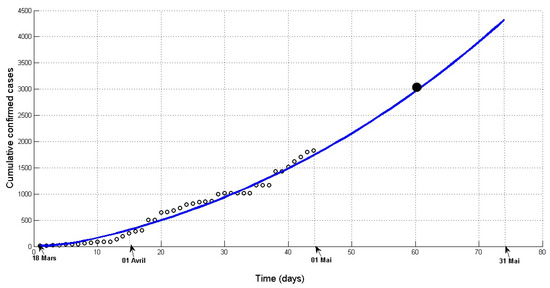
Figure 4.
Prediction of cumulative cases since 1 may. Solid curve—model; Dots—observations.
6. The Three Key Periods of Outbreak in Cameroon (Phase 1, Phase 2, and Phase 3)
In this work, we are focused on the spread of COVID-19 in Cameroon during six months (March, April, May, June, July, and September). We have observed three key periods:
- Phase 1: From 18 March 2020 to the first week of May.Phase 1 is defined here as the period when the 13 barrier measures (closure of borders, schools and universities, churches, bars, etc.) see Appendix A, decrees by the Cameroonian government were in full effect. Phase 1 took place between 18 March and early May.
- Phase 2: First week of May to first week of June 2020. Phase 2 is the period when the original measures were being eased by the gradual reopening of borders, drinking establishments, churches, mosques, etc. On 30 April 2020, the government of Cameroon established 19 other measures to relax the first 13 measures and support the national economy; measures were applied from 1 May 2020. The influence zone of its new measures began after the first week of May 2020. Phase 2 runs from the second week of May to early June.
- Phase 3: Third week of June to September. In Cameroon, on 1 June 2020 rang with the reopening of schools and universities that had closed in March.
In the following section, we assess the impact of each response level in the spread of COVID-19 in Cameroon.
7. Evaluation of Different Response Strategies (Level) on the Spread of Infection
All the measures taken have resulted in different levels of response.
- Application of the 13 barrier measures = response level 1;
- Relaxation of the 13 measures = response level 2;
- Reopening of schools and universities = response level 3.
To evaluate the different strategies, we compare the curves of the real data and the predictive curves obtained from the calibrated model. If, at a given time, the observational data rise above the projection curve, then the level of response has dropped; if they fall below the curve, it has been reinforced. Every two weeks, the parameters must be re-estimated to make good predictions and evaluate the response strategy.
7.1. Potential Impact of Original Measures and Effective Impact of Relaxing Measures in the Behaviour of Outbreak during the Month of May
Impact on Total Cases
Solid line shows predictions, dots are observations. Zone 1 = zone of influence of the 13 barrier measures (phase 1). Zone 2 = zone of influence of the relaxation measures (phase 2).
Figure 5 and Figure 6 show how the easing measures implemented on 1 May 2020 have affected the epidemic. Figure 5 clearly demonstrates that, as of mid-May, the easing of restraints has had the effect of accelerating the epidemic. Figure 6 shows that, without the relaxation of the measures, there would have been fewer than 120 deaths at the end of May, but with the arrival of the relaxation measures, there were nearly 160. We have accordingly revised our projections to account for this acceleration. The result seems to be quite accurate. On 25 May, the new, steeper curve predicted nearly 206 deaths by 6 June 2020; the actual data as of 5 June shows 205 deaths (Figure 6).
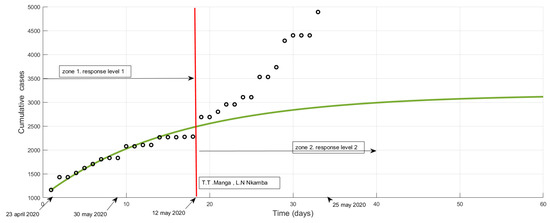
Figure 5.
Potential impact of response level 1 and effective impact of response level 2 on cumulative cases after 12 May 2020. Solid line shows predictions, dots are observations. Zone 1 = zone of influence of the 13 barrier measures (phase 1). Zone 2 = zone of influence of the relaxation measures (phase 2). from 12 May, the observation curve goes above the prediction curve, which denotes a deterioration in response level.
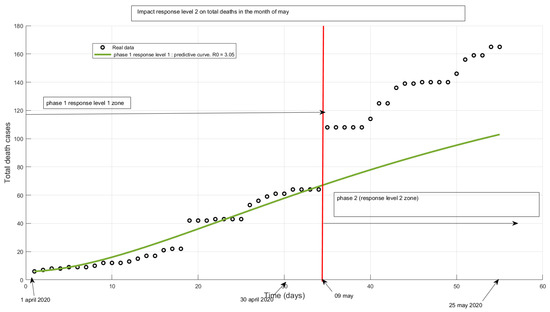
Figure 6.
Potential impact of response level 1 and effective impact of response level 2 on total deaths in May 2020. From 9 May, the observation curve goes above the prediction curve, this shows the decline in government response.
We have accordingly revised our projections to account for this acceleration. The result seems to be quite accurate. On 25 May, the new, steeper curve predicted nearly 206 deaths by 6 June 2020; the actual data of 5 June show 205 deaths (see [19] or the Synoptic table of Daily cumulative death cases from March to September 2020, Appendix A.3). Revised predictive curve of the evolution of confirmed deaths from COVID-19. Dots are observations through 25 May (Figure 7).
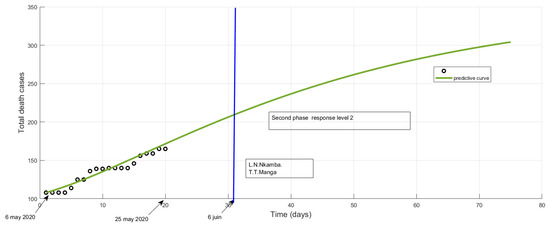
Figure 7.
Potential impact of response level 2 on total deaths in June 2020. By the end of the first week of June, if the level of response remains the same, we will have slightly over 200 declared deaths.
7.2. Potential Impact of Relaxing Measures and Effective Impact of Reopening Schools and Universities in the Behaviour of Outbreak during the Month of June
7.2.1. Potential Impact of Relaxing Measures
The official total number of cases at the end of May will probably be more than 6000. By 10 June, it will rise to 7000 if there is no new accelerator of the epidemic (Figure 8). There will be nearly 4000 active cases in the official counts in the first week of June (active cases = total cases—total death cases—total recovered cases). If schools and universities open, there will be an acceleration, and more than 5000 active cases will have been reported by around 10 June.
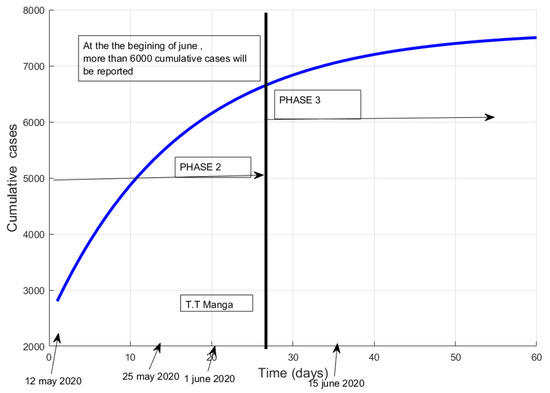
Figure 8.
Potential impact of response level 2 on total cases in the month of June 2020. Relaxation of the 13 measures = response level 2. The official total number of cases at the end of May will probably be more than 6000. By 10 June, it will rise to 7000 if there is no new accelerator of the epidemic.
7.2.2. Effective Impact of the Reopening of Schools, Universities and Mass Screening on the Spread of Infection in the Month of June
Phase 3 runs from the first week of June to July. It is characterised by mass screening and the reopening of schools and universities. The government of the Republic decided to reopen schools and universities, effective from 1 June 2020, and also to conduct a mass screening campaign.
By the end of the first two weeks of June, there was an epidemic boom, with an average of 200 new confirmed cases per day. This is illustrated by a shift in the actual data above the prediction curve at the beginning of June (Figure 9).
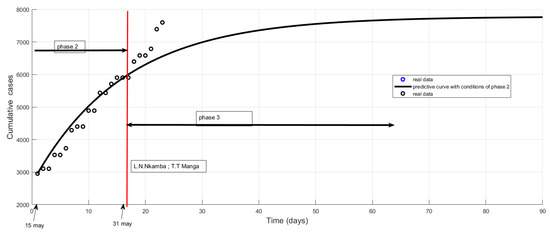
Figure 9.
Effective impact of response level 3 on total cases in the month of June 2020. Reopening of schools and universities = response level 3. By the end of the first two weeks of June, there was an epidemic boom, with an average of 200 new confirmed cases per day. This is illustrated by a shift in the actual data above the prediction curve at the beginning of June.
7.2.3. The End Prediction of the First Epidemic Season
The new predictive curve from simulations based on June data indicates probable extinction of the epidemic in August, see Figure 10.
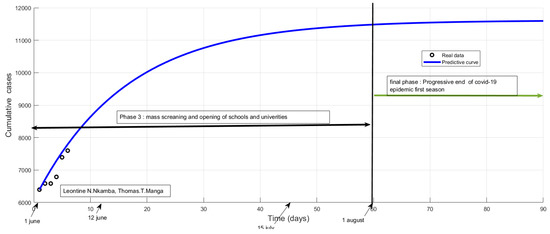
Figure 10.
Prediction of total cases based on earlier data of June. The new predictive curve from simulations based on June data indicates probable extinction of the epidemic in August, at which point a plateau will have been reached with almost 12,000 total confirmed cases.
7.3. Impact of the Traditional Pharmacopoeia on the Evolution of Active Cases
The response against COVID-19 has brought to the surface the importance of traditional pharmacopoeia. On the evening of 29 May, more than 1000 people were declared cured by Mgr Kleda Bishop. Samuel Kleda is a Cameroonian phytotherapist, who has set up two products constituting a treatment against COVID-19 (Elixir COVID and ADSAK COVID). These inventions are registered with the African Intellectual Property Organization (OAPI). The products are available in different Catholic hospitals across Cameroon (e.g., Notre Dame de Logpom, St Albert le Grand de Bonaberi) We observed that some patients healed by traditional pharmacopoeia were not reported progressively but the total was added officially only on 29 May. This made the number of active cases fall dramatically from 3265 to 1933. From then on, the data on active cases deviate from the predictive curve, as shown in Figure 11. This indicates a higher level of response. This does not have a great impact on the evolution of total confirmed cases.
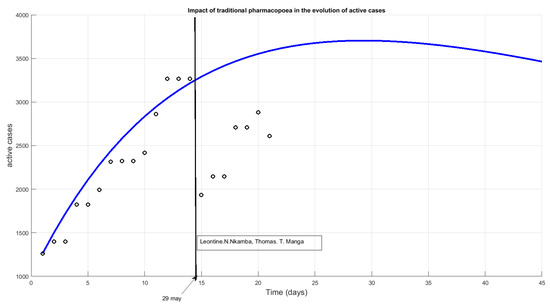
Figure 11.
Impact of the traditional pharmacopoeia on the evolution of active cases from 29 May 2020 onward.
8. General Spread of Infection and Prediction of Peaks
The simulations started on 3 April indicated that active cases would peak around 20 May. Those launched on 6 May confirmed a peak around 24 May. With the easing of restrictions, the beginning of the peak has been postponed by one week, until the end of May. Finally, based on conditions of response level 2, the peak will probably be reached in the middle of June and the epidemic will be in full swing around 15 June. The peak will last at least two weeks (Figure 12) and the epidemic will begin to decline by the end of June or the beginning of July. With the current level of response, if there is no bifurcation or acceleration of the epidemic at the beginning of June, the curves indicate an end of the epidemic towards the end of July and August. Whatever the dates on which the simulations were carried out, all converge towards an extinction of the first wave of epidemic at the beginning of August, see Figure 13.
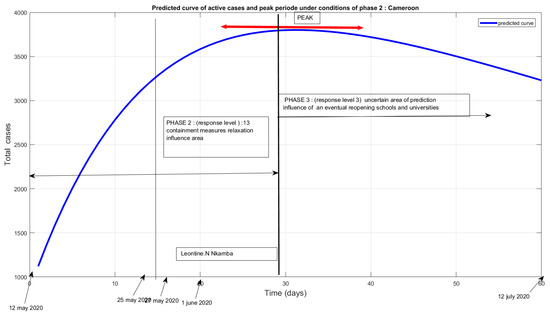
Figure 12.
Predicted curve of active cases and peak period under the conditions of phase 2: Cameroon.
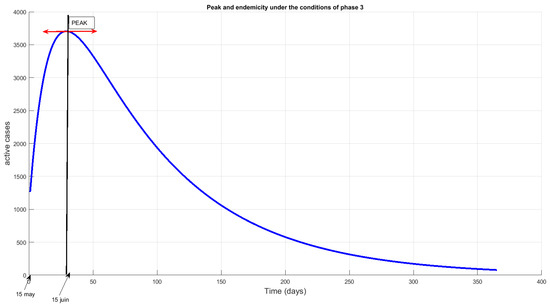
Figure 13.
Predicted curve of active cases and peak period under the conditions of phase 3: Cameroon.
Under the conditions of phase 3, we found out that the disease will remain at least one year, see Figure 13.
Predicted Peak in June Confirmed
Data reported during March, April, and May had allowed us to predict a peak in the month of June see Figure 13, those reported during July, August, and September (see Table 3) allowed us to confirm it (see Figure 14); Synoptic table of Daily cumulative confirmed cases and death cases from march to September 2020 and Appendix A, Figure A1 and Figure A2). From the month of September, the real data confirm a trend towards the endemicity of the epidemic (Figure 14) as predicted since the month of May.

Table 3.
New confirmed cases reported by month from March to September.
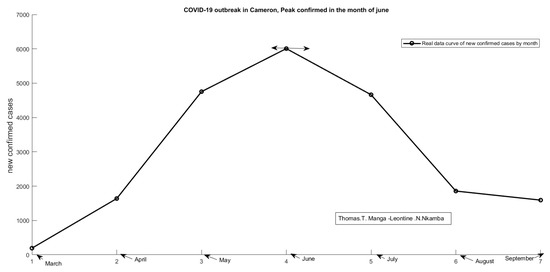
Figure 14.
COVID-19 outbreak in Cameron. Peak confirmed cases in the month of June.
9. Evolution of from March to September
We compute the value of Ro for four periods.
- Period 1: 15 March to 30 April 2020 (15 March to 30 March; 1 April to 30 April).
- Period 2: 1 May to 31 May 2020 (1 May to 15 May; 16 May to 30 May).
- Period 3: 1 June to 30 June 2020.
- Period 4: 1 July to 30 September (July, August, September).
To compute , some parameters have been estimated, as shown i Table 4.

Table 4.
Table of parameters.
To compute the numerical average value of for each chosen period, we feed. first the predictive curve with real data curve corresponding; then we obtain the estimated parameters. Bellow, we have a simulation of the first two weeks of April. Here, , see Figure 15. The same exercise should be performed for each period. Table 5 provides the successive average value of from March to September (see Figure 16). The basic reproduction number varies from to in Cameroon.
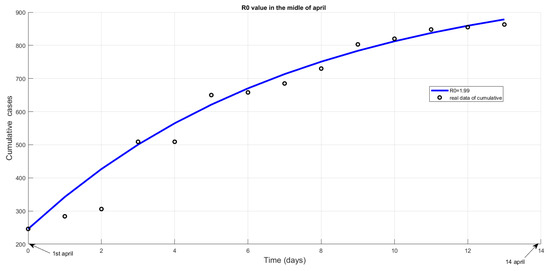
Figure 15.
R0 Value estimated in the middle of April 2020.

Table 5.
Evolution of R0 value from March to September.
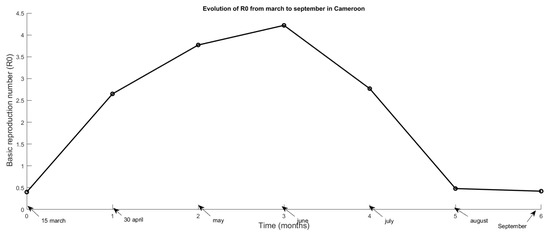
Figure 16.
Curve of evolution of Ro from March to September.
10. Discussion and Conclusions
10.1. Discussion
10.1.1. Impact of Management and Application of Barrier Measures on the Spread of Infection
The level of care has a significant impact on the future of the epidemic. Here, care is measured in terms of the recovery rate. If the recovery rate is at least , the peak arrives earlier and has a lower amplitude. According to our simulations, the rate of implementation of barrier measures does not sufficiently influence the rate of the epidemic, even if the measures are implemented by more than of the population. On the other hand, the effectiveness of these measures has a strong impact on the spread of the infection. When the effectiveness is more than , even if the measures are applied by only of the population, the magnitude of the epidemic is reduced.
10.1.2. Projections of COVID-19 Outbreak under the Conditions of Phase 2 and Recommendations
On the assumption of phase 2 response-level conditions, we used our model to predict the course of the disease in the first two weeks of June 2020. It was expected that the official cumulative number of cases around 1 June would be more than 6000, and by 8 June, around 7000, if there were no new accelerators of the epidemic at the beginning of June (Note that the number of cases in the community is approximately triple the number given officially.). We anticipated that there would be nearly 4000 active cases in the official counts in the first week of June and that if schools and universities opened, there would be an acceleration: we would be at more than 5000 active cases around 10 June. Before the easing measures, the start of the peak was expected in the third week of May, but the new measures pushed this back by one week. The peak would now extend over two weeks, the first two weeks of June, assuming the level of response remained the same and there was no new accelerator. The peak amplitudes would be higher. The epidemic could begin to regress after the third week of June. In this scenario, support resources need to be made ready immediately. By the end of the first week of June, hospital capacity should be brought up to at least 4000 beds. Moreover, at least 50,000 tests need to be available, as in the community there are about 25,000 cases not officially counted. Decentralisation of care could be achieved by allocating beds and all other logistical necessities according to the incidence rate by Region, Departments, and Districts.
10.1.3. Projections of COVID-19 Outbreak under the Conditions of Phase 3
When the level of response changed at the beginning of June, simulations were carried out on 6 June, and the above picture changed somewhat. At the end of the first week of June, there was an epidemic boom with an average of 200 new confirmed cases per day. This is illustrated by a shift in the actual data above the prediction curve at the beginning of June, visible in Figure 9. With the introduction of the traditional pharmacopoeia at the end of May (Figure 11), an increase in the number of recoveries was observed; this would reduce the number of active cases to less than 4000 during the peak. However, the position of the peak itself had not shifted. The epidemic woulds be at its worst (in terms of recorded cases) from the second week of June because widespread testing would elevate the peak to about 120,000 cumulative cases. The disease would start to decline from the end of June but remain endemic for at least one year, see Figure 13.
10.2. Conclusions
At the end of September, 7 months after the COVID-19 outbreak, Cameroon reported around 20,000 confirmed cases, with less than 500 deaths and a cure rate of over 80%. The peak was reached in June with around 6000 new cases. The epidemic curve observes a symmetry around the month of June, from March to August only. The month of September suggests the endemicity of the disease (Figure 14), this means that the disease could remain in the population for a long period. We could fear the arrival of a second wave of the epidemic in October, due first to the 2020/2021 school reopening and second to the resurgence of the epidemic in Europe (12,845 new cases confirmed on September 30 in France); so, it would be prudent to strengthen the governmental response throughout the month of October to avoid a second boost of outbreak in Cameroon.
Author Contributions
The contribution of the T.T.M. can be found in the discussion and interpretation of results part, while the L.N.N. worked on the modeling and prediction the disease spread. All authors have read and agreed to the published version of the manuscript.
Funding
This research received no external funding.
Institutional Review Board Statement
Not applicable.
Informed Consent Statement
Not applicable.
Data Availability Statement
Not applicable.
Acknowledgments
The first author thanks the Cameroon Health Emergency Operations Center, Yaounde, Cameroon. We wish to thank the entire team of the Ecole Nationale Suprieure des Postes Tlcoms et Technologique de lInformation et de la Communication for their availability and all the efforts they made to refine the calibration of the model; the whole team of the Operational Research Unit of the Emergency Medical Operations Centre, headed by Emilienne Epe; the COVID-19 response team in Cameroon; Martin Luther Mann Mayombe for his decisive contribution during the simulations; and Abah Abah Aristide for offering his views as a public health physician.
Conflicts of Interest
The authors declare no conflict of interest.
Appendix A
Appendix A.1. 13 Barrier Measures
(source: https://www.prc.cm/fr/actualites/4151-coronavirus-mesures-instruites-par-le-president-paul-biya (Accessed on 1 June 2021)).
As from Wednesday 18 March 2020, till further notice:
- 1
- Cameroon’s land, air, and sea borders will be closed; consequently, all passenger flights from abroad will be suspended, with the exception of cargo flights and vessels transporting consumer products and essential goods and materials, whose stopover times will be limited and supervised. Cameroonians who wish to come back home should contact our diplomatic representatives.
- 2
- The issuance of entry visas to Cameroon at the various airports shall be suspended.
- 3
- All public and private training establishments of the various levels of education, from nursery school to higher education, including vocational training centres and professional schools, will be closed.
- 4
- Gatherings of more than fifty (50) persons are prohibited throughout the national territory.
- 5
- School and university competitions, such as the FENASSCO and University games, are postponed.
- 6
- Under the supervision of administrative authorities, bars, restaurants, and entertainment spots will be systematically closed from 6 p.m.
- 7
- A system for regulating consumer flows will be set up in markets and shopping centres.
- 8
- Urban and interurban travel should only be undertaken in cases of extreme necessity.
- 9
- Drivers of buses, taxis, and motorbikes are urged to avoid overloading—law enforcement officers will ensure they comply.
- 10
- Private health facilities, hotels, and other lodging facilities; vehicles; and specific equipment necessary for the implementation of the COVID-19 pandemic response plan in Cameroon may be requisitioned as required by competent authorities.
- 11
- Public administrations shall give preference to electronic communications and digital tools for meetings likely to bring together more than ten (10) people.
- 12
- Missions abroad of members of Government and public and para-public sector employees are hereby suspended.
- 13
- The public is urged to strictly observe the hygiene measures recommended by the World Health Organization, including regular hand washing with soap, avoiding close contact such as shaking hands or hugging, and covering the mouth when sneezing.
Appendix A.2. Synoptic Table of Daily Cumulative Confirmed Cases from March to September 2020
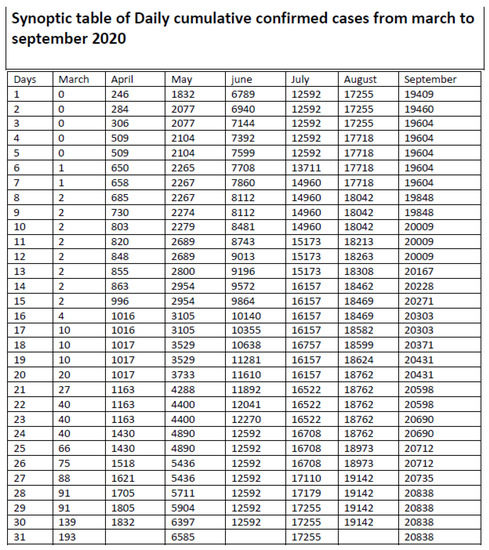
Figure A1.
Synoptic table of daily cumulative confirmed cases from March to September 2020.
Appendix A.3. Synoptic Table of Daily Cumulative Death Cases from March to September 2020
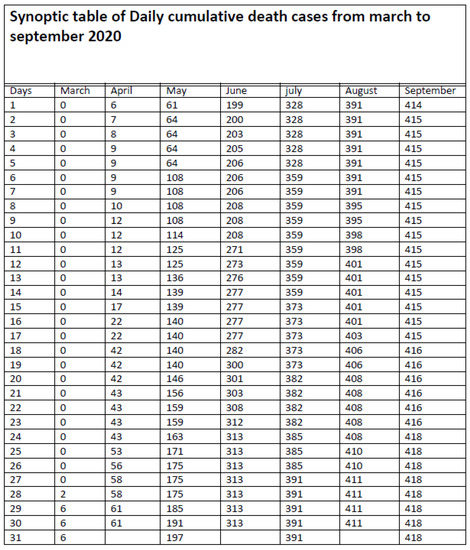
Figure A2.
Synoptic table of daily cumulative death from March to September 2020.
References
- Diekmann, O.; Heesterbeek, J.A.P. Mathematical Epidemiology of Infectious Diseases: Model Building, Analysis and Interpretation; John Wiley & Sons: Hoboken, NJ, USA, 2000; Volume 5. [Google Scholar]
- Kirschner, D.; Lenhart, S.; Serbin, S. Optimal control of the chemotherapy of hiv. J. Math. Biol. 1997, 35, 775–792. [Google Scholar] [CrossRef] [PubMed] [Green Version]
- World Health Organization. Coronavirus Disease 2019 (COVID-19): Situation Report; World Health Organization: Geneva, Switzerland, 2020; Volume 72. [Google Scholar]
- Remuzzi, A.; Remuzzi, G. COVID-19 and italy: What next? Lancet 2020, 395, 1225–1228. [Google Scholar] [CrossRef]
- Shereen, M.A.; Khan, S.; Kazmi, A.; Bashir, N.; Siddique, R. COVID-19 infection: Origin, transmission, and characteristics of human coronaviruses. J. Adv. Res. 2020, 24, 91. [Google Scholar] [CrossRef] [PubMed]
- Liu, Y.; Gayle, A.A.; Wilder-Smith, A.; Rocklöv, J. The reproductive number of COVID-19 is higher compared to sars coronavirus. J. Travel Med. 2020, 20. [Google Scholar] [CrossRef] [PubMed] [Green Version]
- Zhang, S.; Diao, M.; Yu, W.; Pei, L.; Lin, Z.; Chen, D. Estimation of the reproductive number of novel coronavirus (COVID-19) and the probable outbreak size on the diamond princess cruise ship: A data-driven analysis. Int. J. Infect. Dis. 2020, 93, 201–204. [Google Scholar] [CrossRef] [PubMed]
- Biswas, K.; Khaleque, A.; Sen, P. COVID-19 spread: Reproduction of data and prediction using a sir model on euclidean network. arXiv 2020, arXiv:2003.07063. [Google Scholar]
- Dashraath, P.; Jeslyn, W.J.L.; Karen, L.M.X.; Min, L.L.; Sarah, L.; Biswas, A.; Choolani, M.A.; Mattar, C.; Lin, S.L. Coronavirus disease 2019 (COVID-19) pandemic and pregnancy. Am. J. Obstet. Gynecol. 2020, 222, 521–531. [Google Scholar] [CrossRef] [PubMed]
- Solym MANOU-ABI and Julien BALICCHI. Analysis of the COVID-19 Epidemic in French Overseas Department Mayotte Based on a Modified Deterministic and Stochastic Seir Model. medRxiv. 2020. Available online: https://www.medrxiv.org/content/10.1101/2020.04.15.20062752v2 (accessed on 1 June 2021).
- Weber, T.P.; Stilianakis, N.I. Inactivation of influenza a viruses in the environment and modes of transmission: A critical review. J. Infect. 2008, 57, 361–373. [Google Scholar] [CrossRef] [PubMed]
- Yang, C.; Wang, J. A mathematical model for the novel coronavirus epidemic in wuhan, china. Math. Biosci. Eng. 2020, 17, 2708–2724. [Google Scholar] [CrossRef] [PubMed]
- Singhal, T. A review of coronavirus disease-2019 (COVID-19). Indian J. Pediatr. 2020, 4, 1–6. [Google Scholar] [CrossRef] [PubMed] [Green Version]
- Wang, J.; Tang, K.; Feng, K.; Lv, W. High Temperature and High Humidity Reduce the Transmission of COVID-19. Available at SSRN 3551767,. 2020. Available online: https://www.cebm.net/study/covid-19-high-temperature-and-high-humidity-reduce-the-transmission-of-covid-19/ (accessed on 1 June 2021).
- Luo, W.; Majumder, M.; Liu, D.; Poirier, C.; Mandl, K.; Lipsitch, M.; Santillana, M. The Role of Absolute Humidity on Transmission Rates of the COVID-19 Outbreak. 2020. Available online: https://www.medrxiv.org/content/10.1101/2020.02.12.20022467v1 (accessed on 1 June 2021).
- Baud, D.; Qi, X.; Nielsen-Saines, K.; Musso, D.; Pomar, L.; Favre, G. Real estimates of mortality following COVID-19 infection. Lancet Infect. Dis. 2020, 50, 448–456. [Google Scholar] [CrossRef] [Green Version]
- Den Driessche, P.V.; Watmough, J. Reproduction numbers and sub-threshold endemic equilibria for compartmental models of disease transmission. Math. Biosci. 2002, 180, 29–48. [Google Scholar] [CrossRef]
- Nkamba, L.N.; Manyombe, M.M.; Manga, T.T.; Mbang, J. Modeling Analysis of a Seiqr Epidemic Model to Assess the Impact of Undetected Cases, and Predict the Early Peack of the COVID-19 Outbreak in Cameroon. 2002. Available online: https://www.researchsquare.com/article/rs-64201/v1 (accessed on 1 June 2021).
- Coronavirus dans le Monde et par Pays. Available online: http://coronavirus.politologue.com/coronavirus-Cameroun.cm (accessed on 1 May 2020).
- Chang, S.L.; Harding, N.; Zachreson, C.; Cliff, O.M.; Prokopenko, M. Modelling transmission and control of the COVID-19 pandemic in australia. arXiv 2020, arXiv:2003.10218. [Google Scholar] [CrossRef] [PubMed]
- Hellewell, J.; Abbott, S.; Gimma, A.; Bosse, N.I.; Jarvis, C.I.; Russell, T.W.; Munday, J.D.; Kucharski, A.J.; Edmunds, W.J.; Sun, F.; et al. Feasibility of controlling COVID-19 outbreaks by isolation of cases and contacts. Lancet Glob. Health 2020, 8, e488–e496. [Google Scholar] [CrossRef] [Green Version]
- Kim, H. Outbreak of Novel Coronavirus (COVID-19): What Is the Role of Radiologists? Eur. Radiol. 2020, 18, 1–2. [Google Scholar] [CrossRef] [PubMed] [Green Version]
- Kermack, W.O.; McKendrick, A.G. A contribution to the mathematical theory of epidemics. Proc. R. Soc. Lond. Ser. A Contain. Pap. Math. Phys. Characte 1927, 115, 700–721. [Google Scholar]
- Nkamba, L.N.; Ntaganda, J.M.; Abboubakar, H.; Kamgang, J.C.; Castelli, L. Global stability of a sveir epidemic model: Application to poliomyelitis transmission dynamics. Open J. Model. Simul. 2017. [Google Scholar] [CrossRef] [Green Version]
- Pasco, R.; Wang, X.; Petty, M.; Du, Z.; Fox, S.J.; Pignone, M.; Johnston, C.; Meyers, L.A. COVID-19 Healthcare Demand Projections: Austin. PLoS ONE 2020, 15, e0242588. [Google Scholar] [CrossRef]
- Gohin, A.; Chantreuil, F. La programmation mathématique positive dans les modèles d’exploitation agricole: Principes et importance du calibrage. Cah. D’Economie et de Sociol. Rural. (CESR) 1999, 52, 59–78. [Google Scholar]
Publisher’s Note: MDPI stays neutral with regard to jurisdictional claims in published maps and institutional affiliations. |
© 2021 by the authors. Licensee MDPI, Basel, Switzerland. This article is an open access article distributed under the terms and conditions of the Creative Commons Attribution (CC BY) license (https://creativecommons.org/licenses/by/4.0/).