1. Introduction
The SARS-CoV-2 virus can transmit in the form of small respirable particles with <10 µm aerodynamic size diameter [
1,
2,
3,
4,
5,
6]. Particles of these sizes can remain suspended in air for a long period of time, which poses both a short range and long range transmission risk [
7,
8,
9]. In contrast, significantly larger particles settle more readily under gravity and can also be blocked by solid barriers. Talking is a particularly notable and important activity in a university setting where verbal communication during instruction, especially small group conversations with peers, is a key component of learning. Talking is of particular concern for transmission of respiratory diseases as the output of viral particles from an infected person can be an order of magnitude or more greater compared to only breathing [
10]. The size spectrum of aerosols emitted during talking is in the 1–10 µm range [
11].
In a university setting, close contact face-to-face meetings between two or more people is desired in many contexts, including group studying, teaching sessions and office hours. Some COVID-19 risk mitigation guidelines indicate that many of these activities must be either online or carried out with people wearing face masks and maintaining a 6 ft (1.8 m) separation at all times, the so-called
“6 foot masked” criterion [
12]. Anecdotal evidence from students suggests that COVID-19 restrictions greatly degrade their educational and personal development. These restrictions also have various negative psychological effects on university students according to recent studies [
13,
14]. The aim of the device described and studied here is to achieve at least the same level of aerosol suppression between individuals as the
“6 foot masked” criterion, while allowing clear visual and aural communication, without masks.
2. Materials and Methods
The construction of the device is described briefly here. Three pieces of 1/4 inch () thick laser-cut acrylic panels are mounted together by 120 degree brackets and metal fasteners to form the shield main body. The main body is bolted down to a round wood table with 90 degree plastic anchors. Large slotted holes are cut on the shield panels and covered by 2 mil () thick PET film as sound ports. These sound ports allow natural voice transmission through the panel while keeping the barrier function of panels. The PET films are very strong and can resist moderate impacts as well as daily cleaning without tearing.
The shield panels function to directly block large particles and droplets when users sneeze or cough. Small aerosol particles with relatively long suspension times, in contrast, have the potential to follow air flow lines around panels and into the room, eventually reaching another user of the device. A commercially available HEPA FFU is installed on top of the shield to provide a net air flow from edge of table to the top center. Aerosols generated by a user are pulled up and into the HEPA FFU, efficiently filtered by the filter unit and then the filtered air is exhausted back to the room.
Choice of the HEPA FFU is important for an effective shield design. The unit must provide a high enough air flow rate to create a face velocity flow at the user position that dominates the local air movement. This is in order to effectively draw aerosols into the HEPA FFU. Additionally, the exhaust port of the unit must direct air away from the sitting area at low velocity. This ensures the exhaust flow does not create a low-pressure region where unfiltered air flow from a user can bypass the filtration unit. We observed this phenomenon both in CFD simulation and experimental tests during development. Finally, to enhance the user experience, the unit must be adequately quiet.
It is hard to find a commercially available unit that meets all criteria. In our test device, a Honeywell HPA300 air filter is chosen. The Honeywell unit, mounted on top of the shield, requires a 90 degree air deflector on the exhaust vent to redirect the air flow vertically. This HEPA FFU provides 300 CFM () of air flow on the “Turbo” setting and 220 CFM () of air flow on the “Allergen” setting. We measure at the location of a user’s head a noise level of 58 dBA for the “Allergen” setting and 63 dBA for the “Turbo” setting. Acceptable sound level is subjective. Some test users found “Turbo” acceptable, while others greatly preferred “Allergen”. All of the aerosol mitigation evaluations below are carried out with filters on the “Allergen” setting.
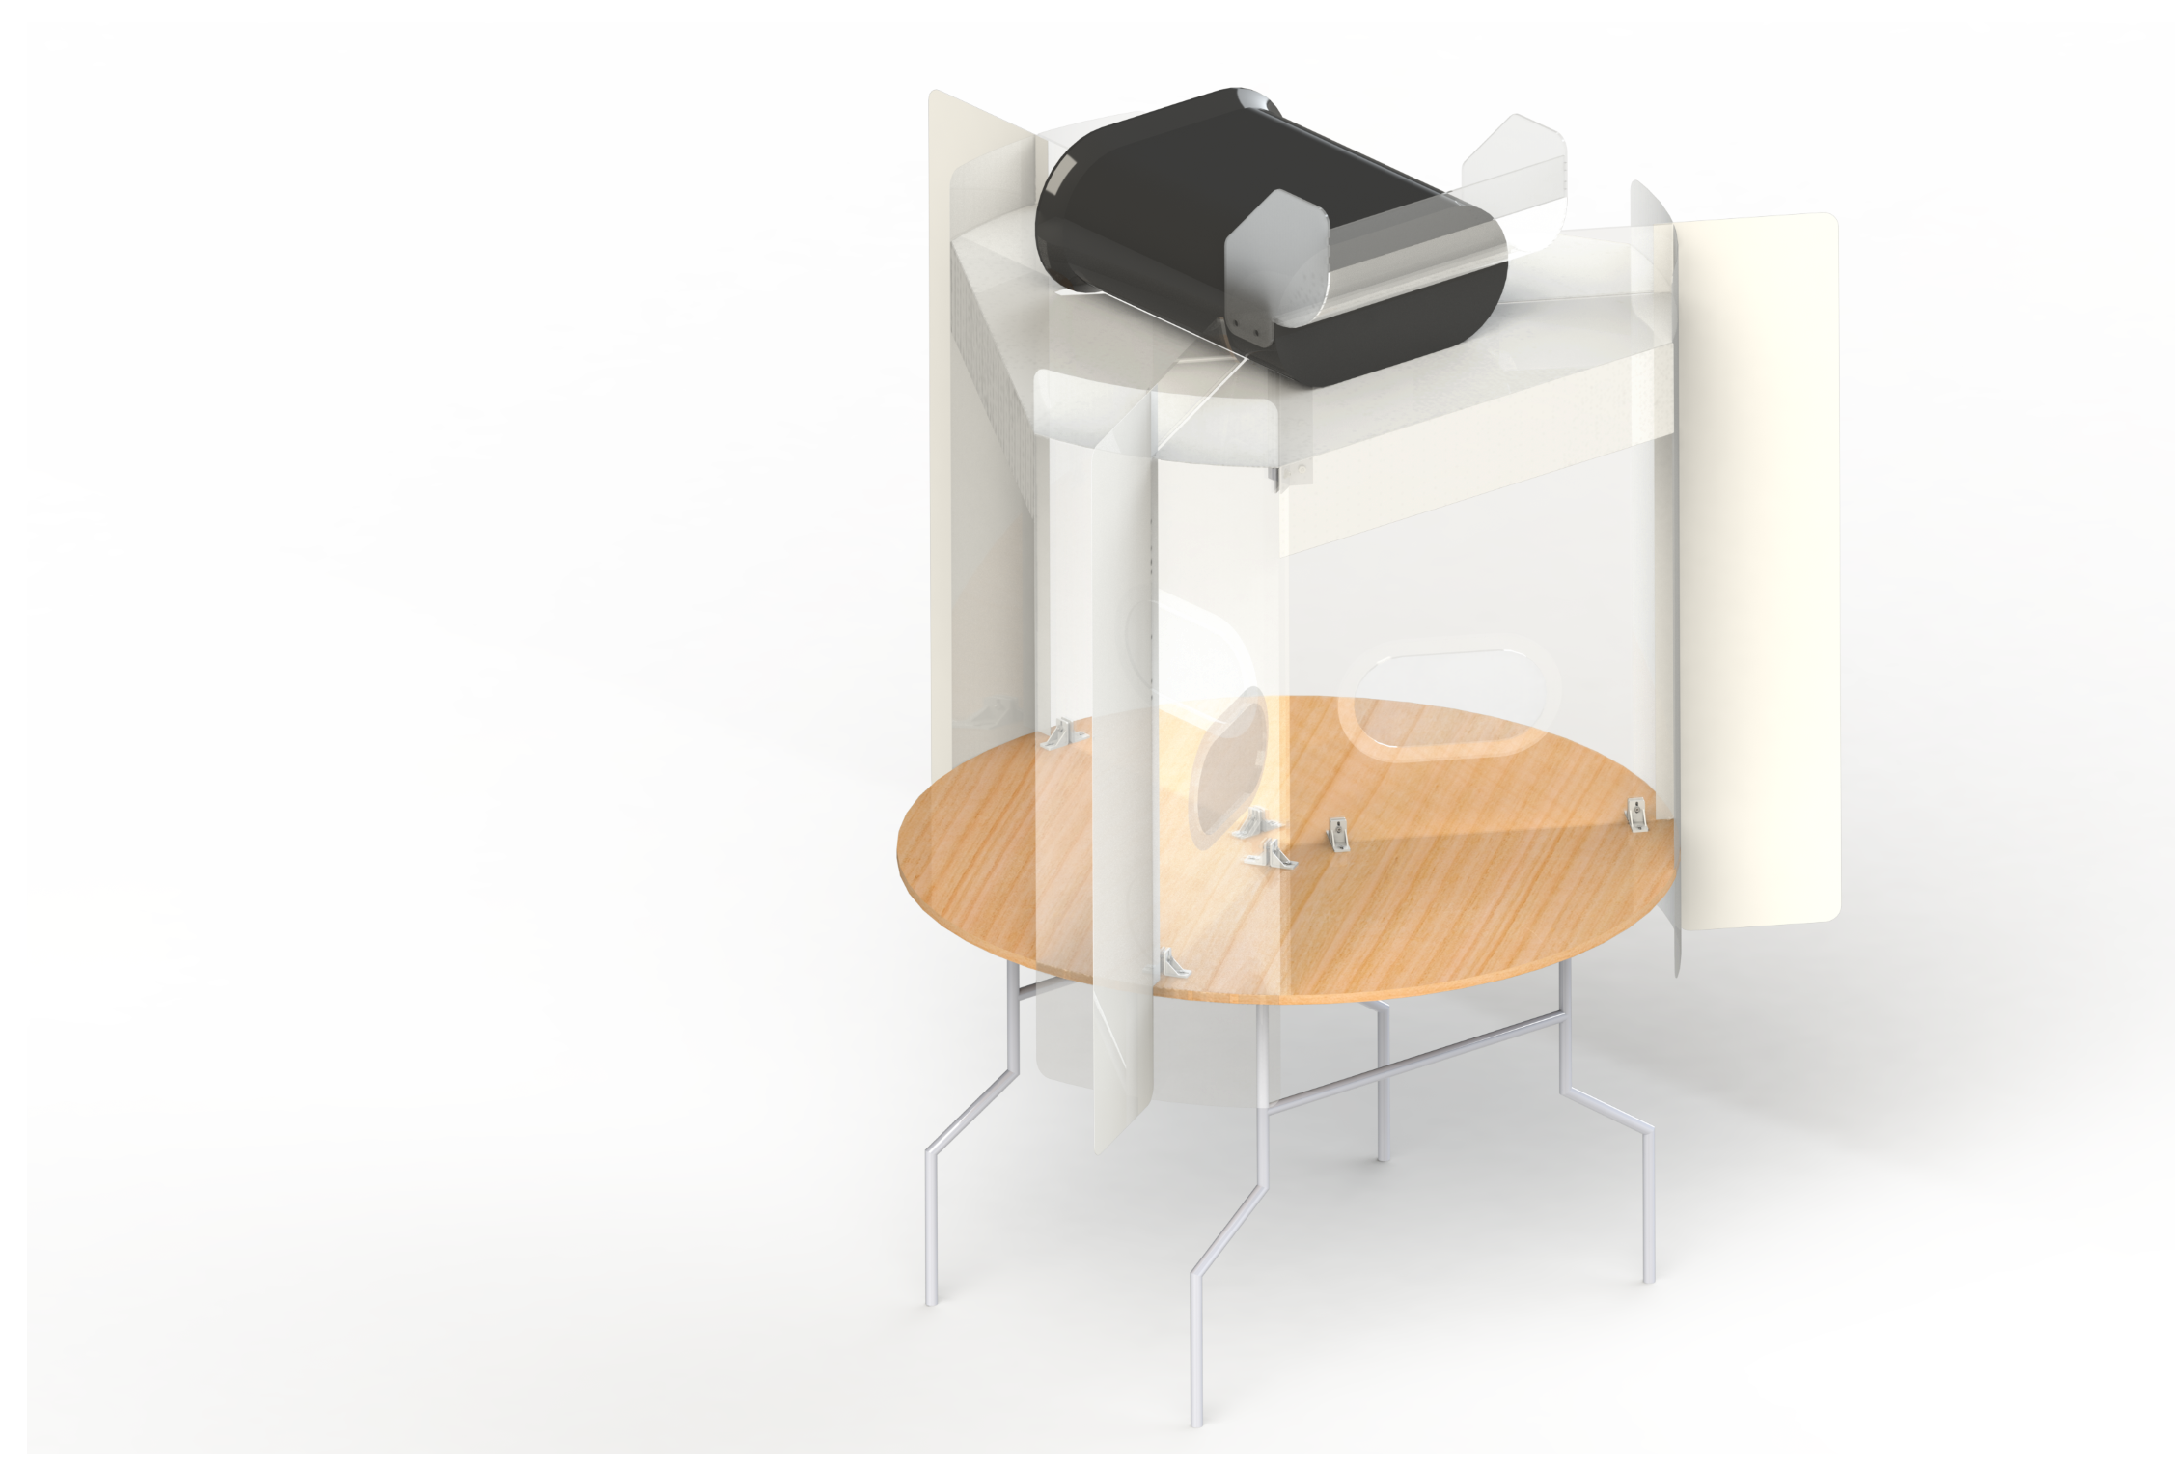
The device is designed with visual barriers (“flaps”) on the outside perimeter of the table to encourage users to stay within the effective area. These flaps extend outside the table from each acrylic panel and are made from off-white color nylon (see
Figure 1). The flaps are installed to block the user’s view when users might lean back from the table, which might reduce the shield effectiveness due to lower face velocity away from the table. Additional “tangent flaps” are installed to redirect the breathing flow along the edge of the table back into HEPA filter inlet area. This also reduces the effective opening area, increasing the face velocity. There are also “roofs” made of clear acrylic on top of each section which further reduce the leakage of aerosol into the room.
The reference device described here is designed for a three person setup, but it is possible to extend this to a larger group of people where larger table space and additional filtration units are available.
3. Results
3.1. Aerosol Production, Measurement, and Calibrations
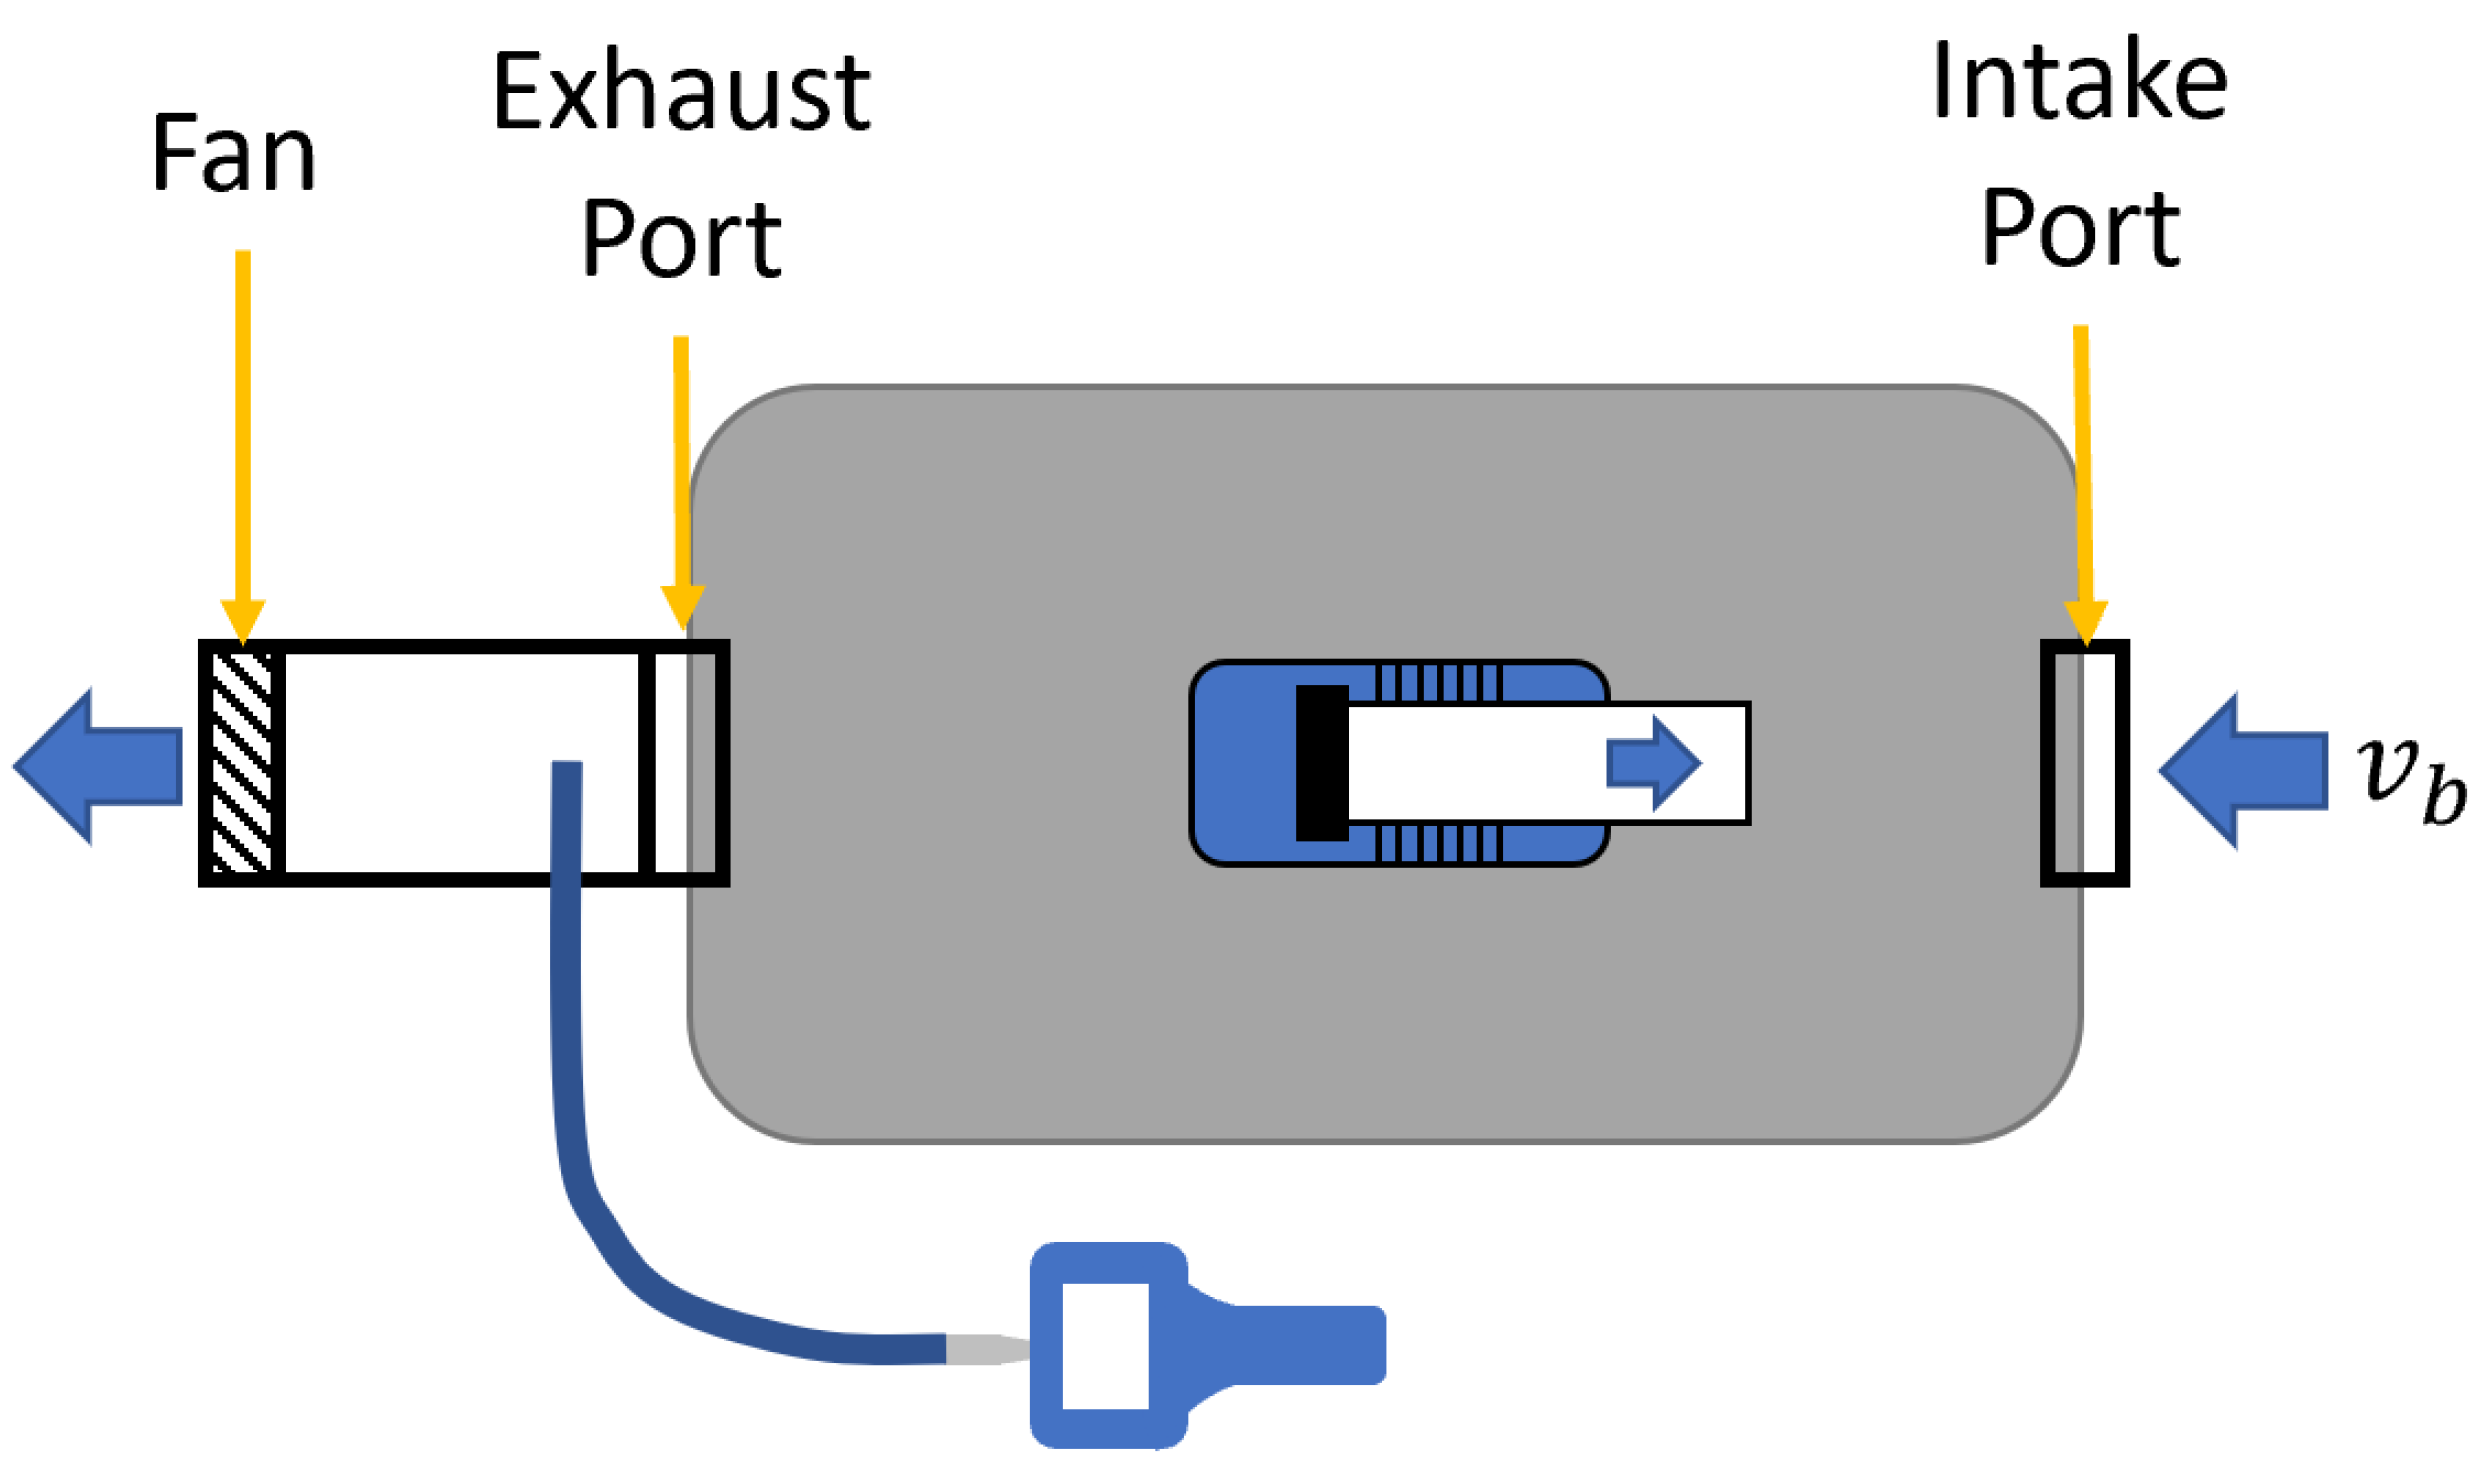
The essential measurement approach is to generate small particles with an aerosol generator (AG) and determine at various locations the number density of small particles (aerosol number concentration) using a particle counter. We use a TSI 8026 AG to simulate aerosol emission from a user in a seating position at the table. A small duct with a fan attached is connected to the AG to eject the aerosol laden air with a flow rate of 5 CFM (
) at velocity
, so as to approximate a person’s air flow during talking [
15]. TSI AeroTrak 9303 particle counters are used to measure the aerosol number concentration. The particle counter used in this paper has multiple channels for various particle size and only data from the “0.3 µm channel” is used in this paper to selectively investigate the particle size of interest. The “0.3 µm channel” of this particle counter counts particle size from 0.3 µm up to 25 µm. There is also a “5 µm channel” which counts from 5 µm to 25 µm. This “5 µm channel” reads <0.1% of the reading from “0.3 µm channel” in all of our measurement results. This indicates that >99.9% of the particles registered by the “0.3 µm channel” is within 0.3 µm to 5 µm range.
We aim to compare the device performance to the common COVID-19 risk mitigation guideline for face to face interactions, the
“6 foot masked” criterion. To do this, we experimentally measure particle number concentration on a circle with a radius of 6 ft (
) with the AG in the center of the circle and then apply a mask correction factor. This is described in detail in
Section 3.2.1. As our experimental measurements rely on stable production of aerosols, we calibrate the AG and find no more than 10% variation over a timescale of 20 min, longer than the time to complete a set of measurements. This is described in
Appendix A.
We measure the effectiveness of the device in two rooms with distinctly different local indoor environments: a “large space” and a “small space”. The large space is characterized by high ceilings and a HVAC system that moves air with a low velocity and steady large scale circulation in the room. The dominant effect of air circulation in the large space is transport of aerosols away from a local source by the air currents and then exhausted or filtered, without filling the volume with a nearly uniform concentration of aerosols. We quantify aerosol concentrations around a 6 ft (
) radius from a local emission source, which provides the reference level to which we compare to the shield device (see
Section 3.2).
The small space is a room with minimal HVAC air flow (e.g., typical building code value of 10 CFM (
) per person), low ceiling height and floor area such that the table and shields sit on the order of 6 ft (
) away from the walls on all sides. In this situation local air currents, lacking a defining global flow direction, spread the aerosols in the room without significant removal of suspended aerosols on a timescale relevant to the use of such rooms in a university setting. The result is that the room fills with aerosols, producing a nearly uniform full-room scale “background”. The steady-state background level in the room is used as the comparison for the shield performance in this environment (see
Section 3.3).
3.2. Large Space
The typical large space considered here, and where tests were performed, is a university library main reading room. Other examples of large indoor spaces include dining halls and public gathering areas typically with areas greater than 2000 sq ft () and ceiling heights greater than 12 ft ().
3.2.1. “6 Foot Masked” Measurements
We aim to compare the aerosol received by a user of the device to the amount that would, on average, be received by two people wearing face masks and maintaining a 6 ft (
) separation. The attenuation of aerosol between source and receiver due to mask wearing is given by a number designated as the “mask factor =
M”. Based on extensive literature, we use a value of
, which is an average of values from several sources [
16,
17,
18,
19]. The amount of aerosol exchanged between people with 6 ft (
) of separation is dependent on the air flow conditions. The case considered here is for large indoor spaces that have a large volume and typical airflows due to modern HVAC systems. The transmission of aerosol from one person to another depends on the specific direction of airflow and its relation to the position of the people. For example, if one person is directly downstream from the other person, then the transmission of aerosol is significantly higher. We seek to find the spatially averaged value,
A, of the aerosol number concentration.
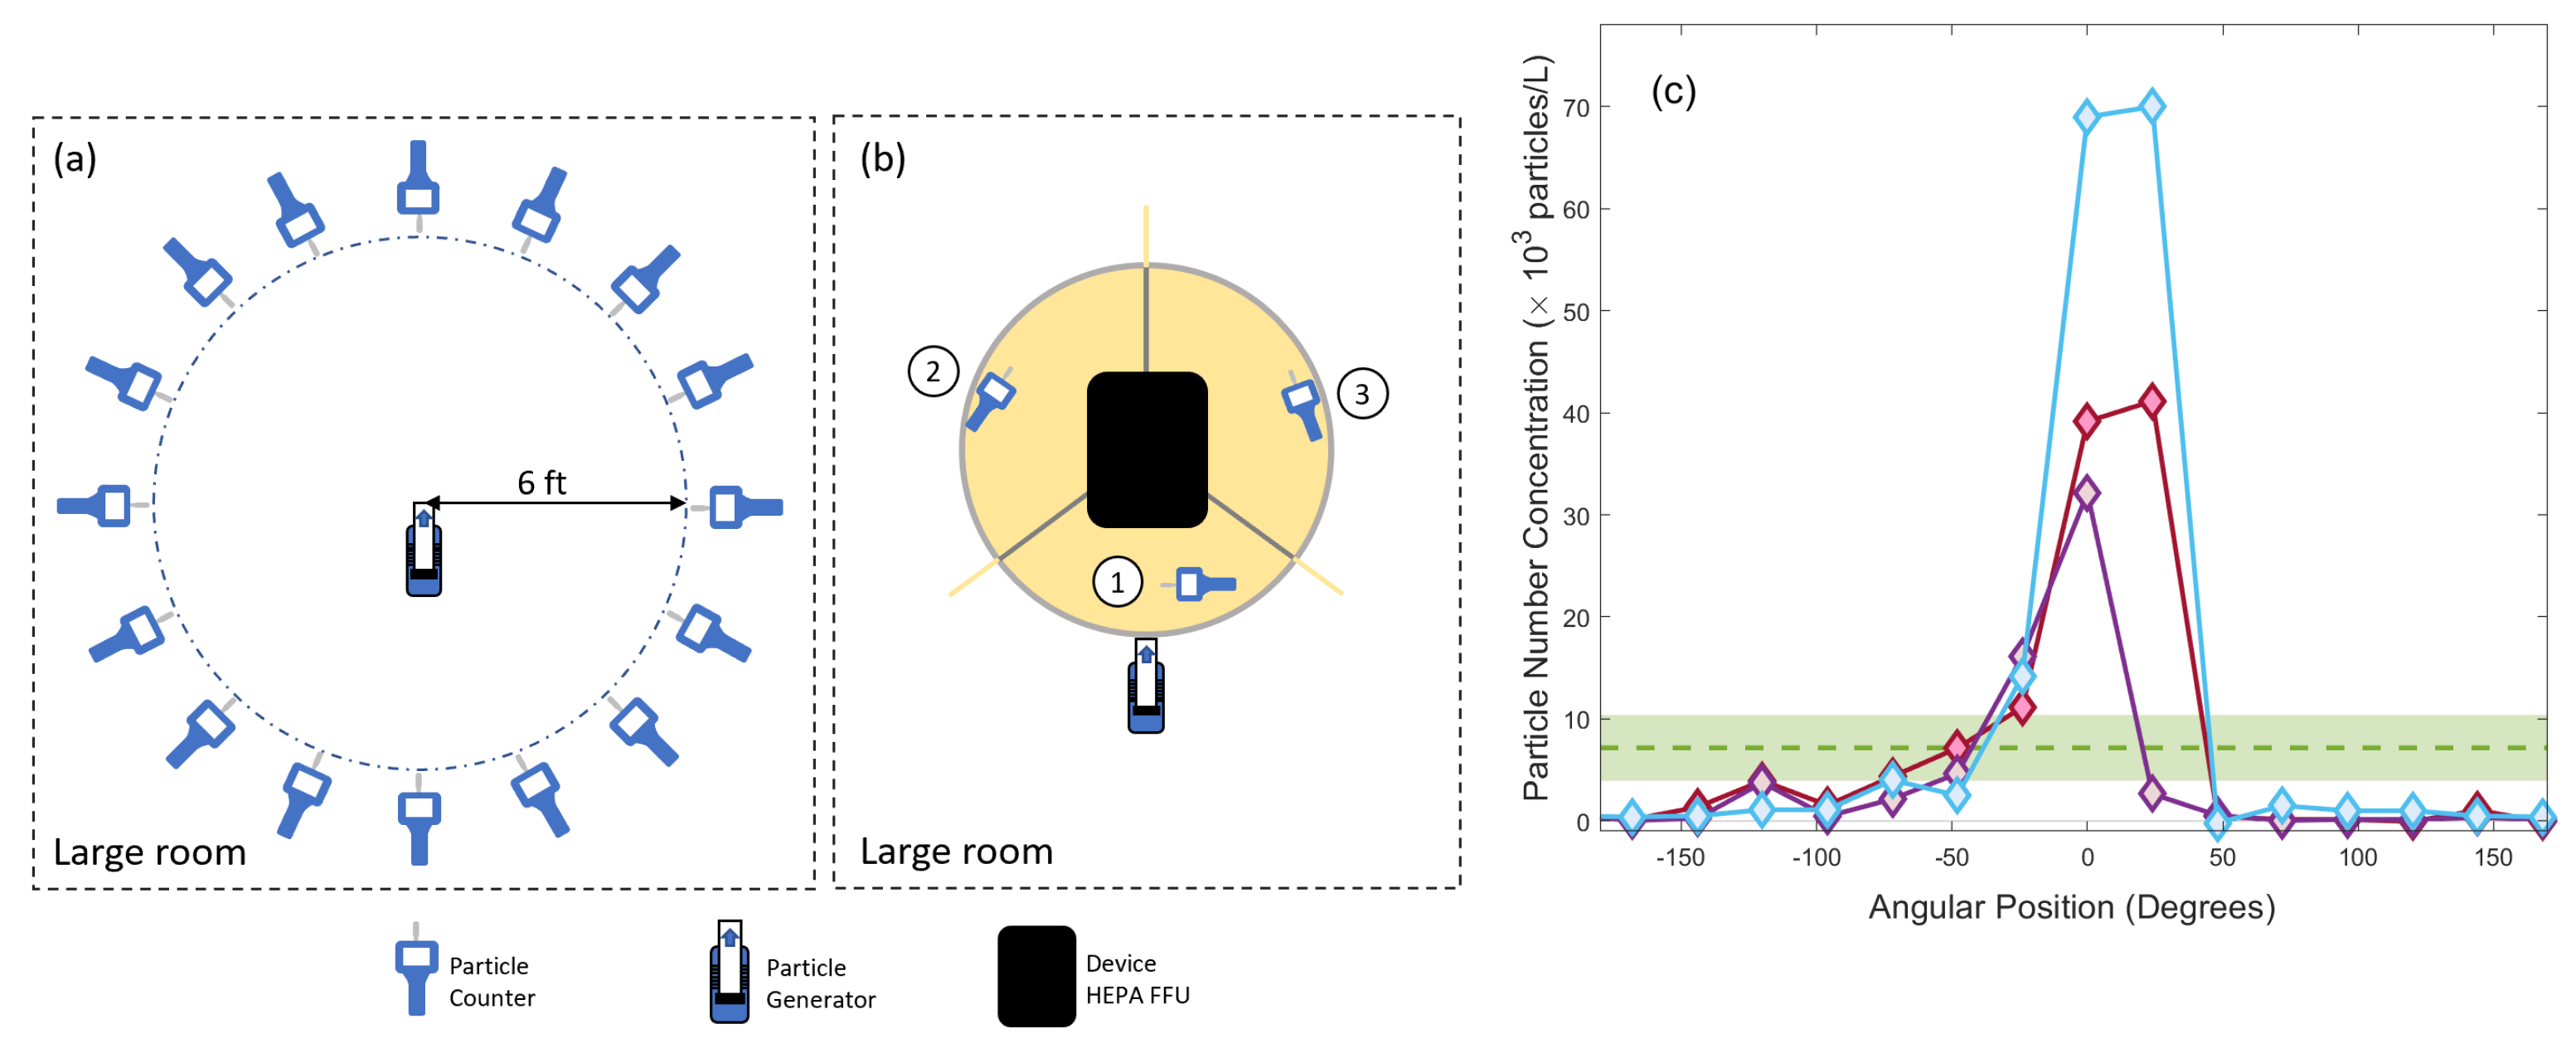
Measurements of aerosol number concentration are taken on a 16 point angular grid arranged in a circle of radius 6 ft () around the AG in the main room of an academic library Two levels in university library. In this test, the AG produces a constant supply of aerosols carried forward at . The measured values of aerosol number concentration are averaged over this grid to produce the “6 foot masked” comparison value . The 16 point grid is sampled twice over the course of approximately 15 min, sufficiently long to allow the aerosols to travel with the room airflow. The data show a strong dependence of aerosol number concentration on the room air flow direction for this large indoor space. The background value is , measured 20 ft () away from the AG. We measure an average concentration of above background, around the 6 ft () radius circle. This value is an average of measurements made in two different locations that satisfy our “large space” criteria and should be representative of other large rooms with modern HVAC systems.
3.2.2. Device Effectiveness
We then test the device in the large room environment. The aerosol number concentration,
S, is measured by two particle counters, each one in a separate user location (location 2 and 3 in
Figure 2b), with the AG approximately positioned to simulate the mouth of a person seated at the table in the user location 1. The background values are determined by measuring particle number concentration at a distance of 15–20 ft (4.6–6 m) from the device. The measured aerosol number concentration is found to be
above background in user location 2 and 3. The aerosol number concentration in the user location 1, where AG is placed, is about
above background. There is no significant difference between the measurement in two rooms. Although the latter value does not come into our determination of the performance of the device, it gives a sense of the very high suppression (>1000) of particle number concentration between three user locations of the device. The measurements of the aerosol number concentration (
S) are used in combination with
C to define the improvement factor,
, which is the figure of merit used to quantify the effectiveness of the device. The target of the device performance is
, indicating that the device outperforms the
“6 foot masked” benchmark. From the measurements in the large space environment, we determine the improvement factor to be
.
3.3. Small Space
The typical small space considered here, and where tests were performed, is an enclosed group study room. Another common example of small spaces is offices, typically with areas of less than 500 sq ft () and ceiling heights above 10 ft () but less than 15 ft ().
In the case of small spaces, the goal of achieving an improvement factor remains the same as with large spaces. A functional difference is that in the small space case, the room acts as an enclosed system. For comparison, in the large space, the effect of aerosol generation on the ambient particle number concentration is small. In particular, in the small space, the “6 foot masked” situation is characterized by the particle number concentration throughout the room because the small room acts as an effective mixing box. With this distinction in mind, the essential procedure used for this measurement, and calculation of improvement factor, is the same as for the large space.
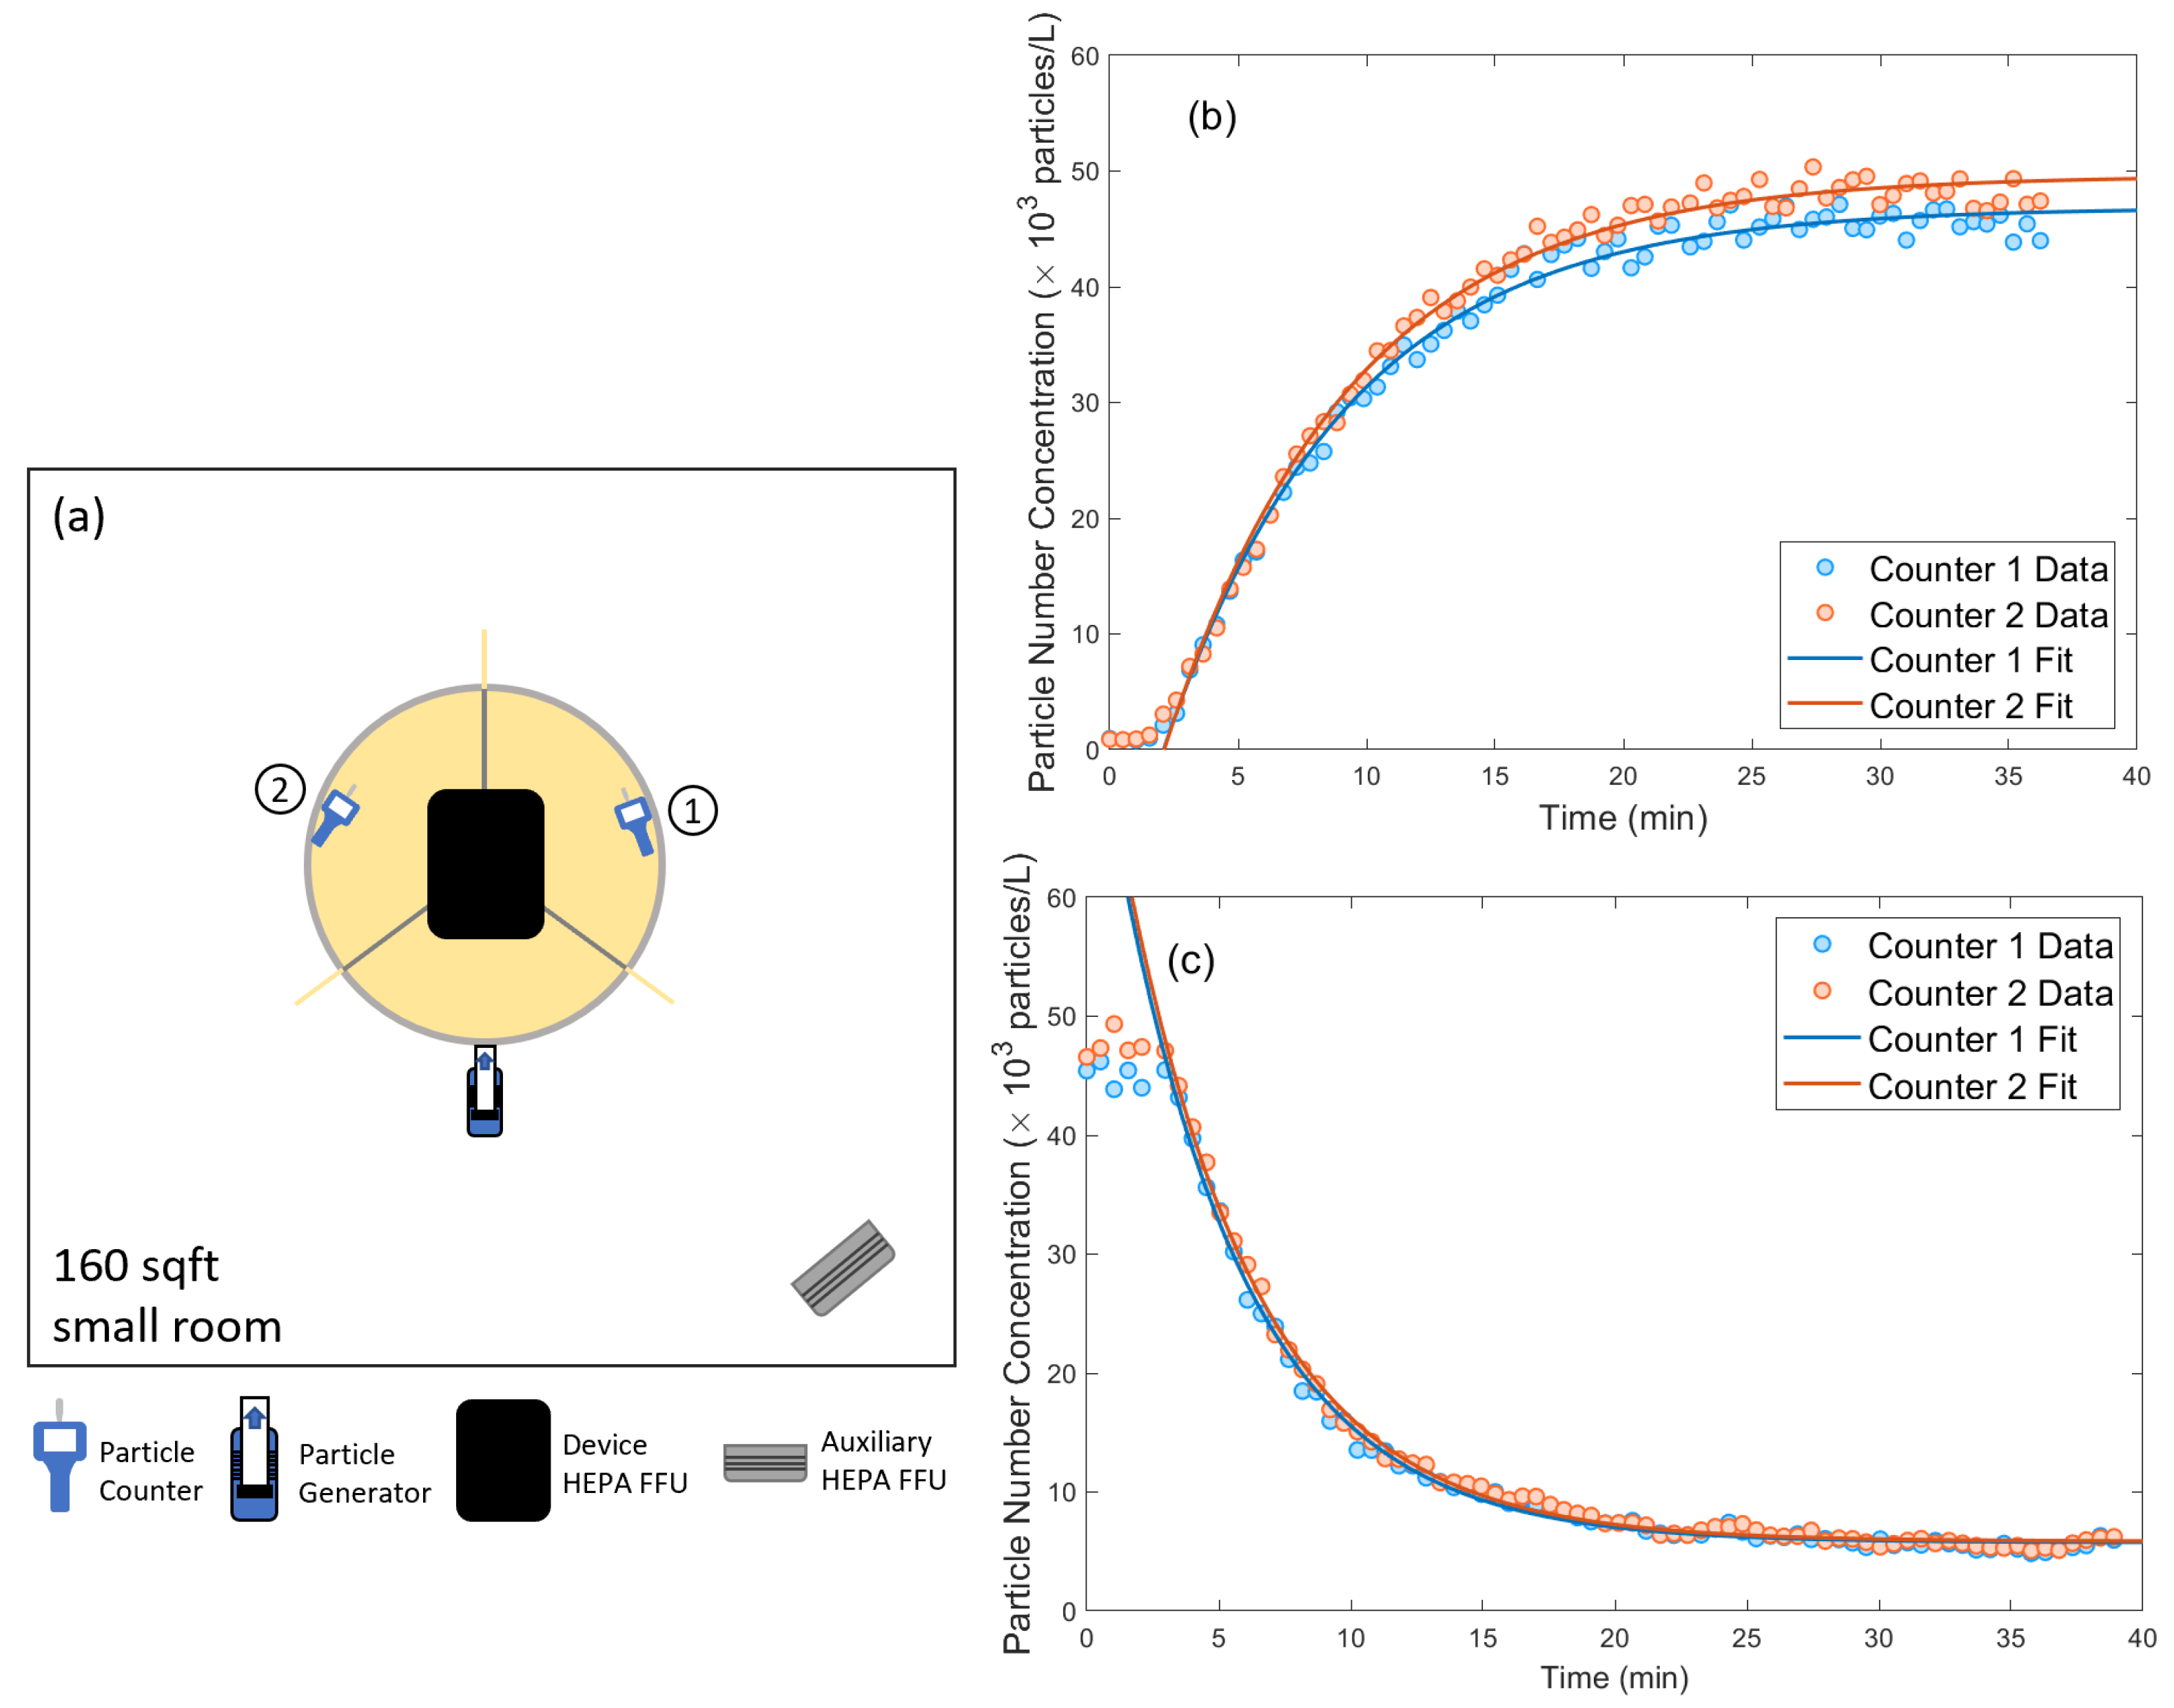
The small space has an area of 160 sq ft (
) and is measured to have low (<50 CFM (
) ) fresh or highly filtered air ventilation. In order to mimic the condition given by a common COVID-19 mitigation guideline for the minimum flow rate per person of fresh air or highly filtered air (MERV 13 or better) provided by the HVAC system, we simulate as the baseline aerosol removal by turning on an auxiliary HEPA FFU (simply referred to as “room HEPA”) with 300 CFM (
) flow rate placed at the corners of the room, approximately 2 feet from the wall. This is well above the typical modern building code requirements for indoor spaces(about 10 CFM (
) per person). Thus, our final determination of
A is conservative, as is our measured improvement factor,
I. The device is placed at the center of the room with the AG output positioned at the edge of the table at the other user locations (see
Figure 3). The particle counter sampling intake is placed at the edge of the table in the other two sectors. We measure the particle concentration versus time after the AG is turned on. The data collected is fitted to an exponential model
which gives a determination of the equilibrium particle concentration
V. The measured equilibrium aerosol number concentration in this baseline setup is
(
extracted from the exponential model).
We then turn on the HEPA FFU (which is mounted to the top of the device). The data fitted by the exponential model shows an equilibrium aerosol number concentration of . The improvement factor is . This also indicates that the device captures of the aerosols generated by the users.
3.4. Noise
The noise sound level at user locations of the device is measured with the device HEPA filter running on the “Allergen” setting. The sound level meter is positioned at head height at the three locations. Sound level is the mean value measured using the A frequency-weighting. The result is summarized in
Table 1.
4. Discussion
For a small space with typical building HVAC system, it is clear that a simple passive shield (without HEPA FFU installed) is not enough to achieve aerosol transmission suppression comparable to “6 foot masked” guideline. A passive shield can stop most large droplets but not aerosols. Once aerosol contaminated air mixed with room air, a HEPA FFU with much larger air flow is required to clean it up and keep equlibrium aerosol number concentration low. The device presented in this work solves this problem by adding an HEPA FFU close to the users which actively drags the air in and filters the aerosols before it mixes with room air.
For a large space, the HEPA FFU on the device can achieve enough face velocity to dominate the air flow over the room HVAC, suppressing the leakage of aerosol into room air. The air flow generated by the device HEPA FFU also lowers the sensitivity of orientation and arrangement of the devices in the room. A passive shield could be effective for suppressing one direction aerosol transmission if positioned correctly, but it would be less effective suppressing the transmission in the other direction and cannot prevent aerosol dispersing into clean room air.
5. Conclusions
In conclusion, we present a device design that allows for natural face to face interactions between multiple maskless users while effectively mitigating the risk of transfer of aerosols. The aerosol transmission attenuation of the device is evaluated in two environments, typical of a university setting. We compare measurements of aerosol transmission between users of the device to a reference setup simulating two individuals separated by 6 ft and wearing surgical face masks. The result shows an improvement factor of for the “large space” and for the “small space”. This provides a promising way of recovering some normal activities in a university setting while maintaining low risk of aerosol transmission of SARS-CoV-2 and other respiratory diseases.


