Article

Observation of the Transition Phenomenon of High-Density Cell Distribution in a Two-Dimensional Microspace of the Unicellular Green Alga Chlamydomonas reinhardtii

Department of Physics, Faculty of Science, Tokyo University of Science, 1-3 Kagurazaka, Shinjuku-ku, Tokyo 162-8601, Japan
*
Author to whom correspondence should be addressed.
These authors contributed equally to this paper.
Micro 2024, 4(3), 412-425; https://doi.org/10.3390/micro4030026
Submission received: 14 April 2024 / Revised: 24 June 2024 / Accepted: 26 June 2024 / Published: 28 June 2024
(This article belongs to the Section Microscale Biology and Medicines)

Abstract

:
Understanding the spatial distribution (SD) of unicellular organisms is crucial for comprehending population dynamics and adaptive strategies at the microbial scale. These behaviors include the formation of ordered structures through intercellular interactions and the broader implications for ecosystem interactions. In this study, the spatial distribution of the motile unicellular alga Chlamydomonas reinhardtii was investigated, with a focus on high-density conditions approximated by an area fraction of φ = 10%. Cell counting was carried out by image analysis, which applies the quasi-two-dimensional observation technique developed in our previous studies to analyze cell interactions in microspaces with thicknesses of 80 µm and 200 µm using both variance-to-mean ratio (VMR) and Eberhardt statistics (ES). The study reveals that experimental results, when evaluated using both VMR and ES, confirmed a similar trend and a density-dependent transition in cellular interaction. This transition ranges from swarming at lower densities to dispersal at higher densities, with a critical boundary observed at approximately φ = 8%. The findings suggest that cell behavior in dense populations shifts due to limited space and resources, offering a new perspective on the adaptive strategies of cells. These insights could enhance understanding of the mechanisms governing cell behavior in crowded environments.

1. Introduction

The investigation of spatial distribution (SD) within ecological contexts occupies an important position in research, aiming to elucidate the intricate dynamics of competition among organisms and their interaction with the surrounding environment, which are crucial for their survival. By drawing a parallel, the spatial arrangement of photons within a propagating light beam in the domain of quantum optics [1] presents analogous distribution patterns. This comparison is instrumental in highlighting the underlying principles that govern the quantum optical properties of photon populations, essential for the advancement of technologies such as entangled photon pairs. It is universally recognized that in instances devoid of correlation among individual organisms or photons, resulting in an entirely random distribution, the statistical model aligns with a Poisson distribution (PD) [2], wherein the variance is congruent with the mean. On the other hand, if interactions exist between individuals, for instance, swarming (attractive) interactions lead to a variance greater than the mean (bunching, super-Poisson), whereas avoidance (dispersive) interactions result in a variance less than the mean (anti-bunching, sub-Poisson) [3]. These analogies serve as a foundation for comparative analysis, employing the variance-to-mean ratio as a critical metric for investigating the nuances of inter-individual or inter-particulate interactions within these distributions, thereby facilitating a comprehensive understanding of the underlying mechanisms in both ecological and quantum optical studies.
Even at the scale of microbes, namely cells, the emergent behaviors such as ordered structures of cell populations created by intercellular interactions are a major field of research from the perspective of the origins of multicellularity in biology and interest in biodiversity [4], relating to statistical phase transition phenomena in physics. This also falls within the realm of active matter. Although there is an abundance of theoretical studies on the formation of collective structures through hydrodynamic interactions of unicellular microorganisms with flagella (referred to as self-propelled particles or microswimmers in the field of active matter), experimental validation is less prevalent than theoretical work.
The SD and pattern formation of individual organisms have been extensively studied in ecology. It is widely recognized that schools of fish and flocks of birds form specific spatial patterns [5,6,7], which are argued to be hydrodynamically stable (energy-efficient) arrangements [8] and offer survival advantages by minimizing predation risks [9,10,11]. Conversely, it has been observed that trees in forests space themselves apart to evenly access sunlight and soil nutrients [12]. From a distributional perspective, the former scenario exemplifies a concentrated (clumped) distribution, while the latter represents a uniform distribution, contrasting with a random distribution that indicates no interaction (either direct or indirect) among individuals.
In the exploration of microscale ecosystems, the dynamics of single-cell organisms provide invaluable insights into the mechanisms of life at the smallest scales [13,14,15]. Among these organisms, the unicellular green algae Chlamydomonas reinhardtii stands out due to its unique locomotion and phototactic behaviors. Characterized by a size of approximately 10 µm and the ability to move at speeds up to ten times its body length per second with the aid of two flagella, C. reinhardtii exhibits remarkable adaptability in response to light, leveraging photoreception for optimized photosynthesis.
In the study of unicellular organisms with flagellate locomotion, such as Chlamydomonas and Euglena, the interplay between phototaxis and convection precipitates the swarming of these cells, resulting in the emergence of spatially non-uniform patterns termed bioconvection [16,17]. It is posited by some researchers that bioconvection may confer advantages to the cells, potentially through enhanced oxygen availability for non-photosynthetic cells, improved nutrient acquisition for all cells, or equitable distribution of light for photosynthetic cells. However, empirical evidence from several studies challenges the assertion of bioconvection’s significant beneficial effects [18].
Besides bioconvection, the collective behavior resulting from hydrodynamic interactions among flagellated microorganisms is well documented [4]. There exists a substantial body of theoretical and experimental research on the transition of motile cell populations into clustered or phase-separated states within three-dimensional or quasi-2D spaces. This transition is influenced by cell number density or volume fraction, given that swimmer–swimmer interactions are complex functions of their relative displacement and orientation [19]. Such transitions occur in dense populations, notably above an area fraction of φ = 10% [4,20].
In contrast, our previous work delved into the sparseness region of φ ≪ 10%, characterized by the absence of obvious cell clusters or ordered states within the cell population [21]. The results suggest that in quasi-two-dimensional space, sparse C. reinhardtii with φ ≈ 1% do not interact except in collisions, suggesting that φ = 1% is the natural density limit for non-interfering cell coexistence. As a point of reference, it is noteworthy that the maximum density attained by cells in a standard culture setting is 1.0 × 10 7 cells/mL (stationary phase) [22], corresponding to an area fraction of φ = 0.5%.
Building on prior research that experimentally elucidated the SD of C. reinhardtii in a quasi-2D environment, this study delves deeper into the essence of intercellular interactions among C. reinhardtii under high-density conditions, specifically at an area fraction of approximately φ = 0.1.
To achieve this aim, the present study improved upon the quasi-2D observation method developed in our prior work [21], conducting cell counting through image analysis techniques. The obtained data were analyzed using both the variance-to-mean ratio and Eberhardt statistics (ES) as analytical tools (see Appendix A for more information). From this analysis, it became evident that the nature of cellular interactions, whether swarming or dispersive, shifts at a boundary value of φ ≈ 8%. Insights gleaned from these results are expected to substantially deepen our understanding of cell population dynamics, offering new perspectives on the adaptive strategies cells employ in densely populated environments.

2. Materials and Methods

2.1. Sample Preparation

The wild-type C. reinhardtii CC-125 mt+ (also referred to as 137c mt+ or IAM C-541) was utilized as the experimental sample. Cells were aerobically cultured under stationary conditions in TAP (Tris-Acetate-Phosphate) medium [23], with continuous illumination provided by white fluorescent light at an intensity of 10 μmol photons/m2/s, and maintained at a temperature of 23 °C. For the experiments, cell suspensions from the logarithmic growth phase to the early stationary phase were employed as samples.

2.2. Quasi-2D Spatial Device

In the study of microorganisms within quasi-2D spaces, various microdevices have been developed [24,25,26,27,28]. In our previous research, we utilized commercially available SUS304 shim rings (20 µm thickness) placed between two slide glasses to create a space serving as a quasi-2D environment for microbial studies [21]. The size of this quasi-2D space is defined by the inner diameter and thickness of the shim ring, which we presented as a cost-effective and straightforward approach. This method facilitates the examination of microorganisms within a constrained plane, aiming to simulate a 2D space.
Increasing the cell density to a high density (φ ≈ 10%) results in a higher proportion of stationary cells compared to a lower density (φ ≈ 1%). When the proportion of stationary cells in the total cell count within a two-dimensional microspace exceeds φ = 1%, employing a generalized distribution function becomes challenging.
In this study, we employed thicker shim rings, specifically those with thicknesses of 80 µm or 200 µm, thereby defining the observable area within the focal range of the microscope (2.7 µm) as a quasi-2D space (Figure 1). This adjustment served to exclude stationary cells adhering to the upper and lower glass surfaces and those that temporarily cease movement due to the shock of encapsulation from the observation area. By increasing the thickness of the spacers used to create the quasi-2D environment, we minimized the potential interference from cells that are not actively participating in the dynamics of the observed population, thus refining our analysis of cell behavior in quasi-2D conditions. This updated method enhances the precision of our observations, allowing for a more accurate assessment of cell–cell interactions and SD in a controlled quasi-2D environment.
Cellular SD patterns can be broadly categorized into three types. The first is known as random or Poisson distribution, where cells are uncorrelated and exist with equal probability in any location. The second type is a discrete distribution, where cells are more or less equidistant from each other. In this distribution pattern, dispersive interactions are at play among the cells. The third type is a clustered distribution, where cells form clusters and swarm in certain areas, indicating attractive forces between cells, in contrast to the second distribution type.
In this study, we employed partitioning methods [29] and nearest-neighbor distance analysis [30,31] as statistical approaches to categorizing these three SD patterns, believing that using both statistical methods would provide more credible judgments compared to previous studies.

2.3. Experimental Apparatus

A digital biological microscope (GR-D8T2, Shodensha, Inc., Osaka, Japan) equipped with a red LED (OSR5XNE3C1S, Xeon 3 Power Red Star LED, OptSupply Limited, Hong Kong, China) was utilized for observations. An objective lens of 40× magnification (NA 0.55, OLYMPUS, Tokyo, Japan) was employed. Red light, with a central wavelength of 660 nm, was chosen for observation [32] to minimize cell adherence to the glass surfaces. Experiments were performed in darkness, with all light sources other than the observation light-shielded. The beam’s diameter at the sample location was Φ 5 mm, and the photon flux density reached 11.8 μmol photons/m2/s. Furthermore, a microscope camera (MC500W-G1-D, Tama Pack Co., Ltd., Osaka, Japan) coupled with a 10× magnification eyepiece (CHU30-C-RS, Shodensha, Inc., Osaka, Japan) was affixed to the microscope, capturing video images at a frame rate of 30 fps and a resolution of 2592 × 1944 pixels.

2.4. Image Analysis

The recent literature has reviewed methods for counting microorganisms in microscopic images [20]. In this study, cell counting was performed using ImageJ software (Version 1.53t) on still images extracted from video footage, employing one of the counting methods outlined in that review.

2.4.1. Frame Interval

Due to limitations in PC memory, analyzing every frame within the video was not feasible. Consequently, still images output at 30 fps were thinned to 1 fps, selected at every 30th frame, and then loaded into the image analysis software for processing. As cell density increases, leading to a higher number of cells within micro-wells, the processing speed of the PC slows, extending the time required for analysis. In our previous study [21], a total of 900 frames were analyzed due to low cell density; in the present study, 600 frames were analyzed due to high cell density.

2.4.2. Binarization and Particle Tracking

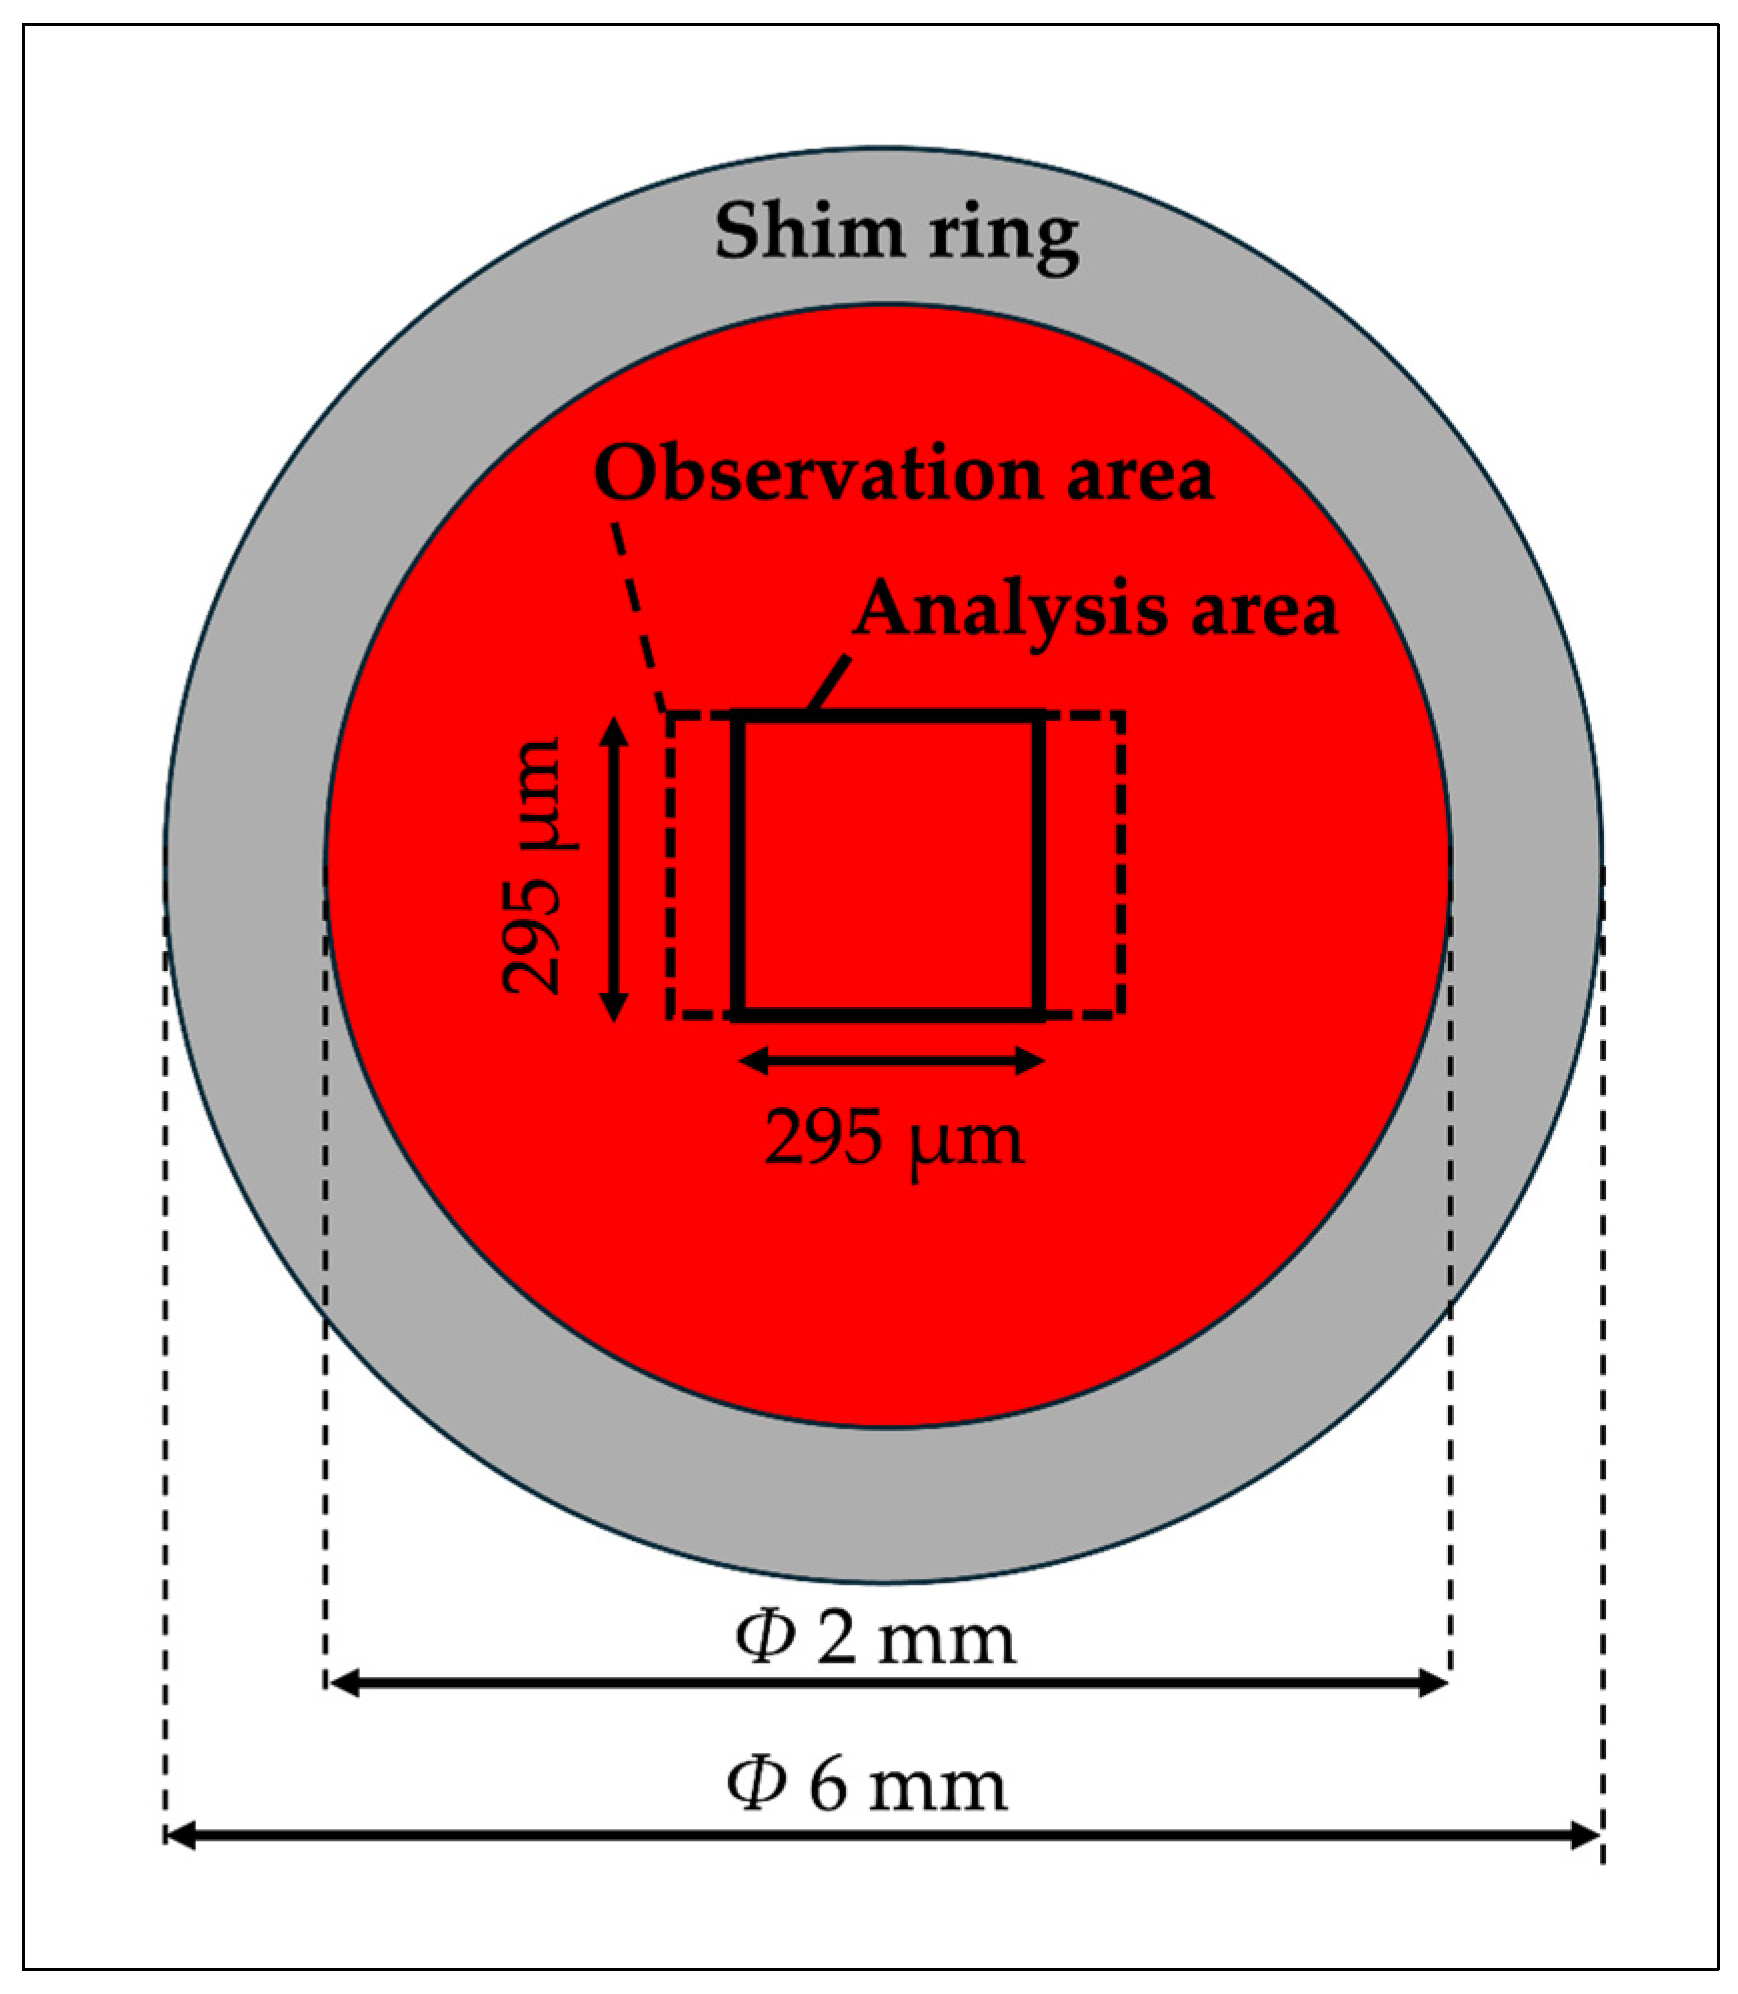
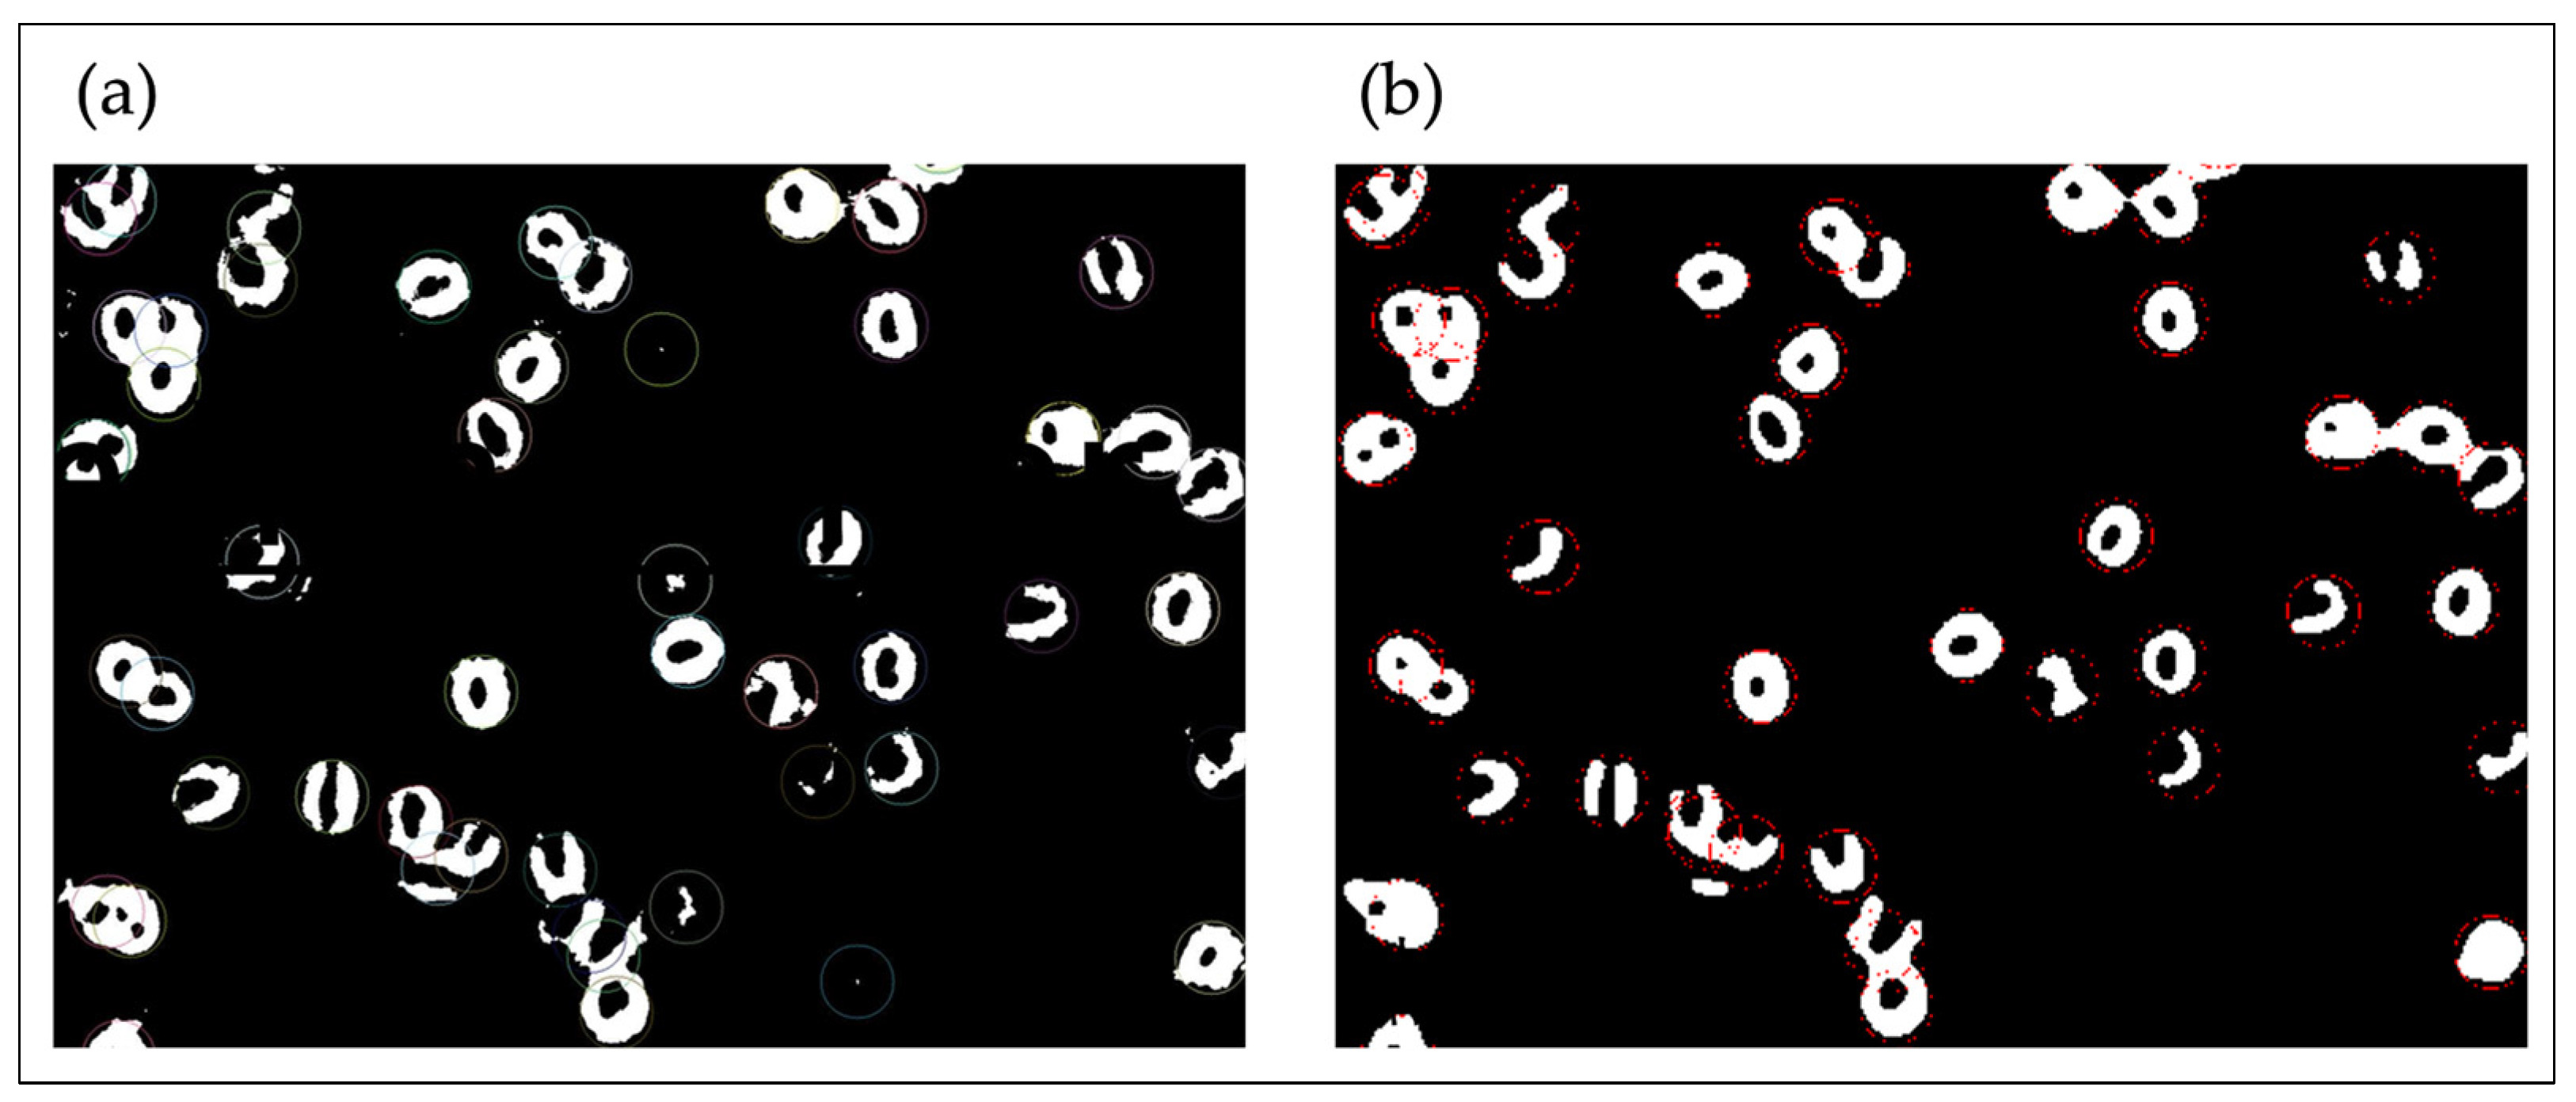
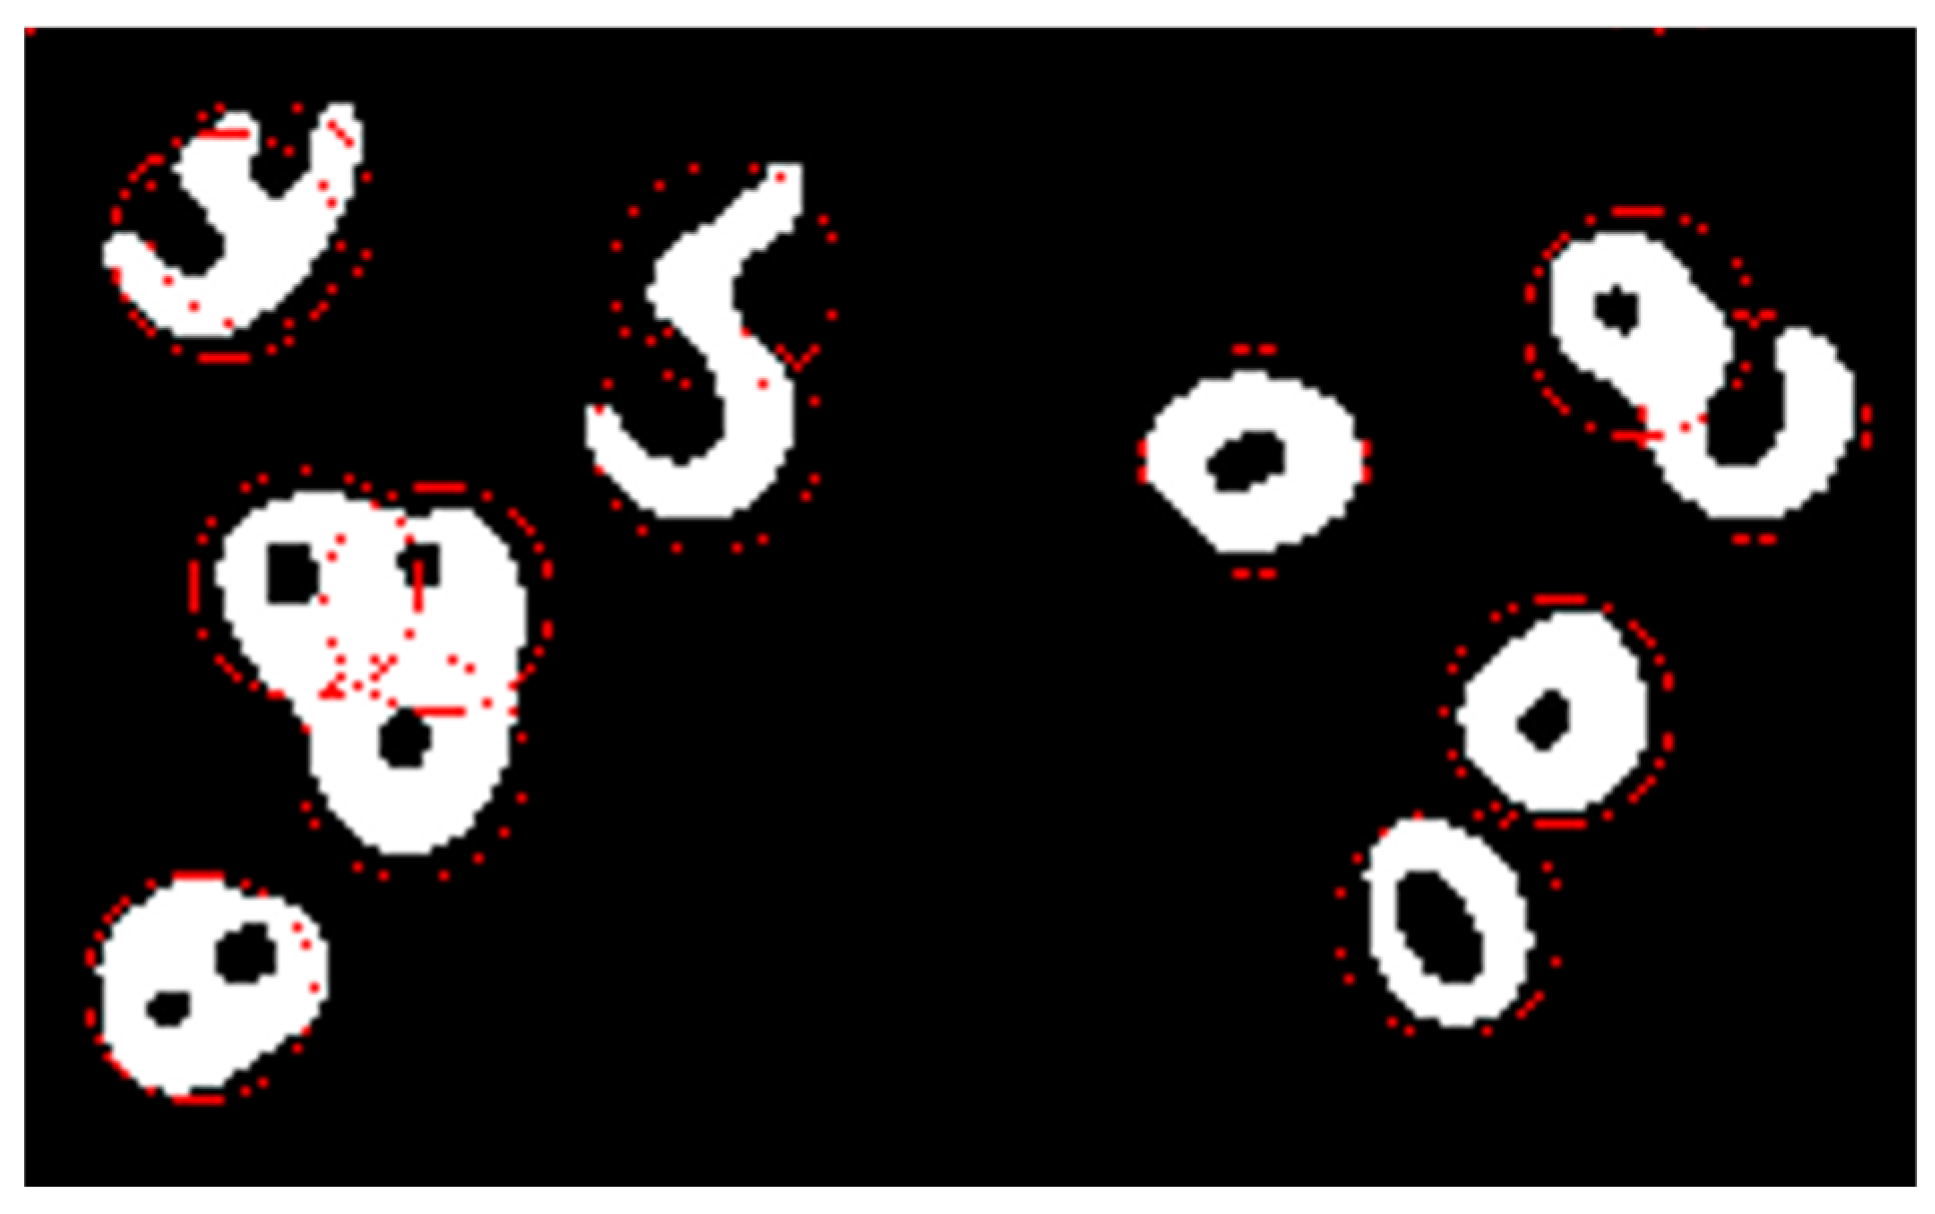
To mitigate the effects of the micro-well boundaries (inner walls of the shim ring), a central square region of 1944 × 1944 pixels was selected for analysis from the output video of size 2592 × 1944 pixels. A schematic diagram of the analysis area is shown in Figure 2. The image processing for analysis with ImageJ was conducted as follows: initially, salt and pepper noise was removed using a 5 µm × 5 µm median filter. Subsequently, background luminance was subtracted using the “Subtract Background” feature. After binarization, a second median filter was applied to exclude stationary cells that appear as shadows in the video due to their position slightly away from the focal depth (Figure 3 and Figure 4). For this step, a larger value than the initial filter for salt and pepper noise removal was used. Finally, particle tracking was performed using the “particle tracker” plugin in ImageJ, with the results output as CSV files containing the center coordinates of cells in each frame.

2.4.3. Cell Counting

A Python script counted cells based on the coordinates in the CSV file, dividing the observation area into N(=m × m) sections. Cells located on boundary lines were classified into the right or upper sections. A histogram was created from the counts, from which mean and variance were calculated. In this study, the observation area was divided into a total of 25 sections (5 × 5) (Figure 5).
The observation area was divided into (5 × 5) sections, corresponding to the “Analysis area” in Figure 2.

2.4.4. Simulation

For this analysis, averages were taken over 600 iterations, mirroring the concept of frame count in experimental settings. Central coordinates for all cells were generated via random number generation, ensuring an equitable comparison with the compartmentalization used in the analysis of experimental data.
Cells of the same number as in the experiment (circles with a diameter of 10 µm) were randomly placed within an area identical to the analysis region. If the distance between the centers of the cells was less than 5 µm, they were repositioned.
Simulation values were determined by averaging the results of five simulations for each area fraction. Details of these are given in Table S1. To align simulation values closely with experimental data, area fractions from experimental findings were rounded to the nearest whole number before comparison (e.g., φ = 2.8% was rounded to φ = 3%, φ = 3.2% to φ = 3%).
Two primary methods were employed to determine the nature of cell–cell interactions:
The experimental variance-to-mean ratio (VMR) and the VMR values derived from simulations were compared. An experimental VMR greater than its simulation counterpart suggested swarming, whereas a lesser value indicated dispersal.
A comparison between the experimental ES value l and the theoretical l = 1.27. Values of l > 1.27 were indicative of swarming, while l < 1.27 suggested dispersion.
Distinct from our previous work [21], this study simulated all cells as motile entities, whereas prior simulations included stationary cells. This adjustment was facilitated by employing shim rings of increased thickness, thereby excluding stationary cells from the observational area—a setup reflecting a more accurate depiction of cell dynamics in quasi-2D spaces. Additionally, unlike in the previous studies where stationary cell center coordinates were added to randomly placed motile cell-equivalent coordinates [21], this study placed all cell coordinates randomly without prior knowledge of stationary cell locations.

3. Results

Table 1 and Table 2 illustrate the VMR simulation values (up to 5 µm overlap between cells was allowed) and ES value l for cells under different area fractions in quasi-2D environments created by 80 µm and 200 µm shim rings. Results highlight a transition from swarming to dispersive behaviors as an area fraction exceeds 8%. The table categorizes cellular interactions into swarming and dispersal based on VMR and l values, delineating a critical boundary at φ = 8%. See Table S1 and the Section 4 for more information.
Simulated VMR: average and standard deviation of five VMR values obtained from simulations. The simulations were conducted for each target area fraction (φ* = 1 to 12%, in integer increments). However, due to constraints in the simulations, the actual area fractions used (φ′) were nearly integer values. Therefore, in these comparisons, the area fractions (φ) obtained from experiments and those used in the simulations are rounded to the nearest integer and compared. For more details, refer to Table S1.

4. Discussion

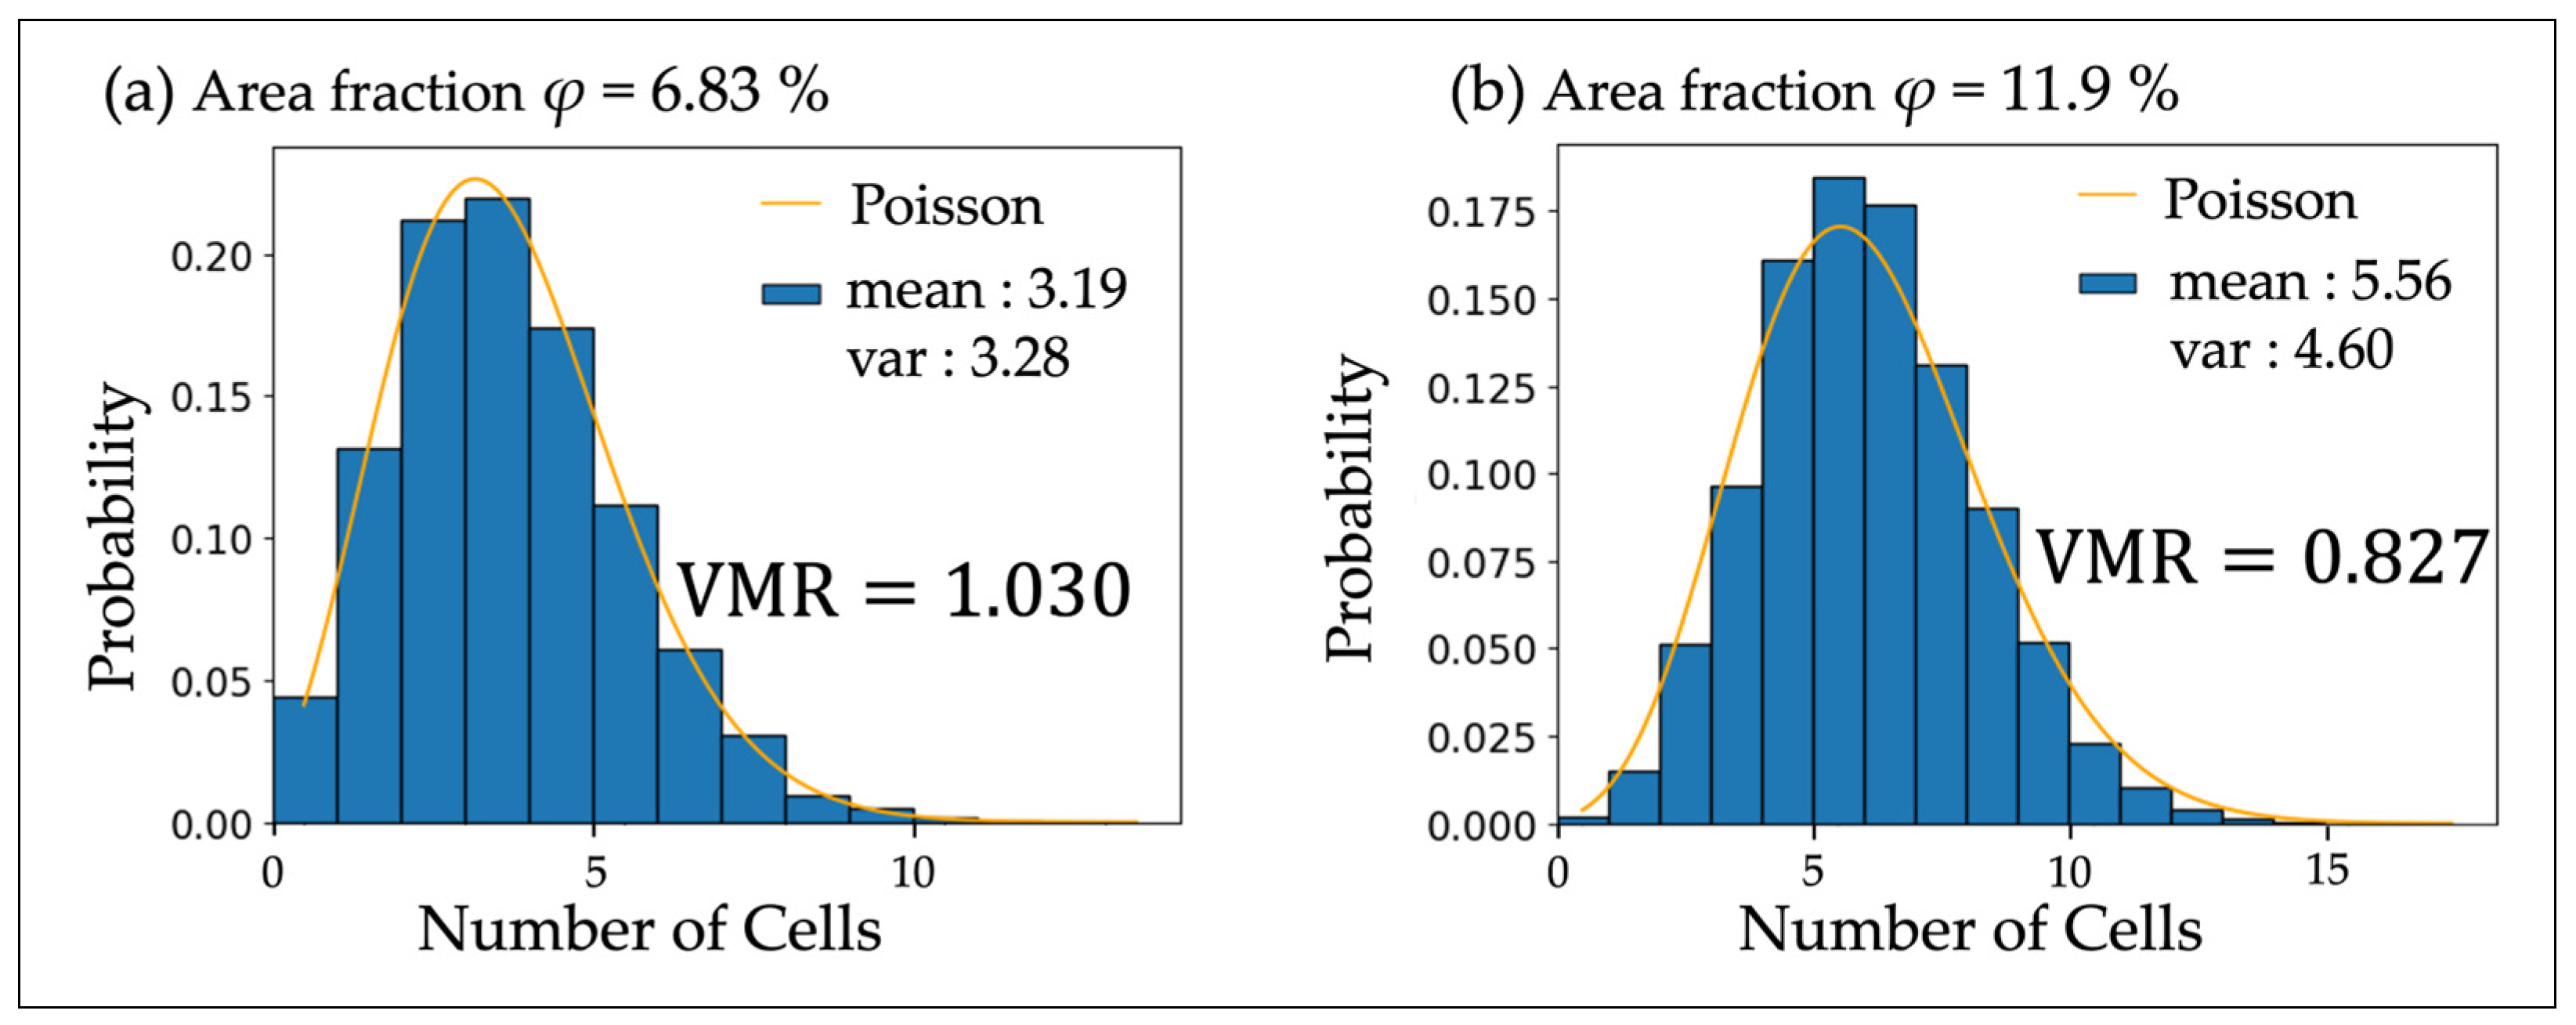
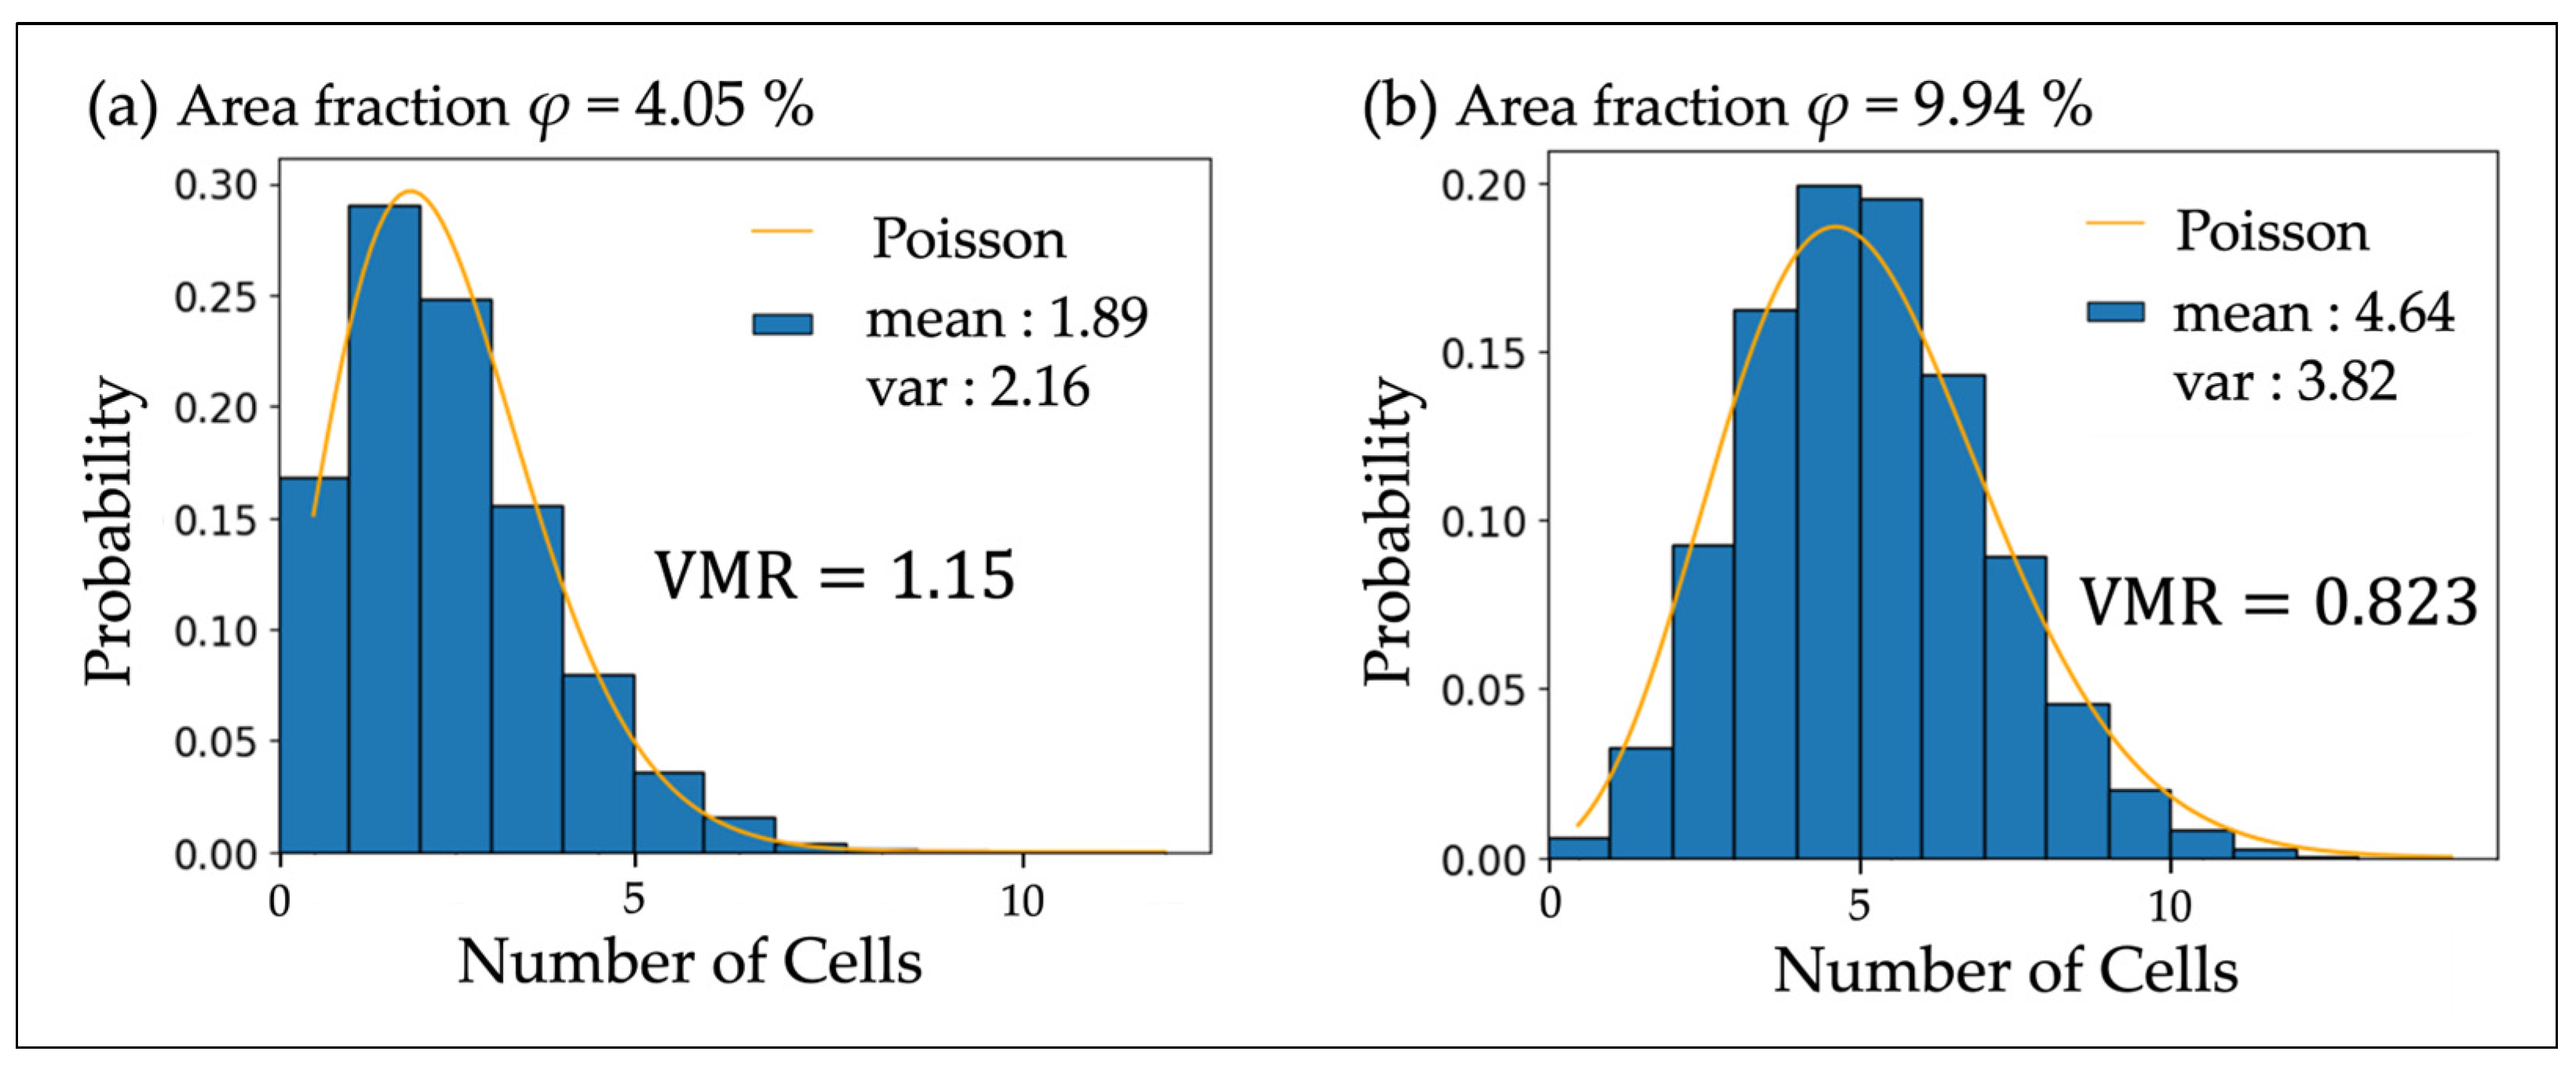
Figure 6 shows a density-dependent shift in the SD of C. reinhardtii cells within a quasi-2D space defined by an 80 µm thick shim ring. The comparison with theoretical Poisson distributions, highlighted by orange curves, further illustrates the deviation from random SD expected under no interaction scenarios.
At relatively lower densities, cells exhibit a tendency towards swarming, as indicated by a VMR greater than 1 [33], reflecting a super-Poisson distribution (Figure 6a). This swarming behavior suggests an attraction among cells or a propensity for cells to cluster within specific regions, possibly as a strategy for optimizing local environmental conditions or enhancing collective survival [34,35].
In contrast, at higher densities around φ = 10%, cells demonstrate dispersive interactions, with a VMR less than 1, indicative of a sub-Poisson distribution. This transition from swarming to dispersal with increasing cell density might be attributed to limited space and resources [36], leading to competitive behaviors among cells. The presence of dispersive interactions at higher densities suggests the cells’ adaptive strategies to avoid overcrowding, which could compromise access to essential resources or lead to detrimental cellular interactions (Figure 6b). In particular, for photosynthetic microalgae, a high cell density results in a decrease in light utilization efficiency, leading to a reduction in growth rate [37].
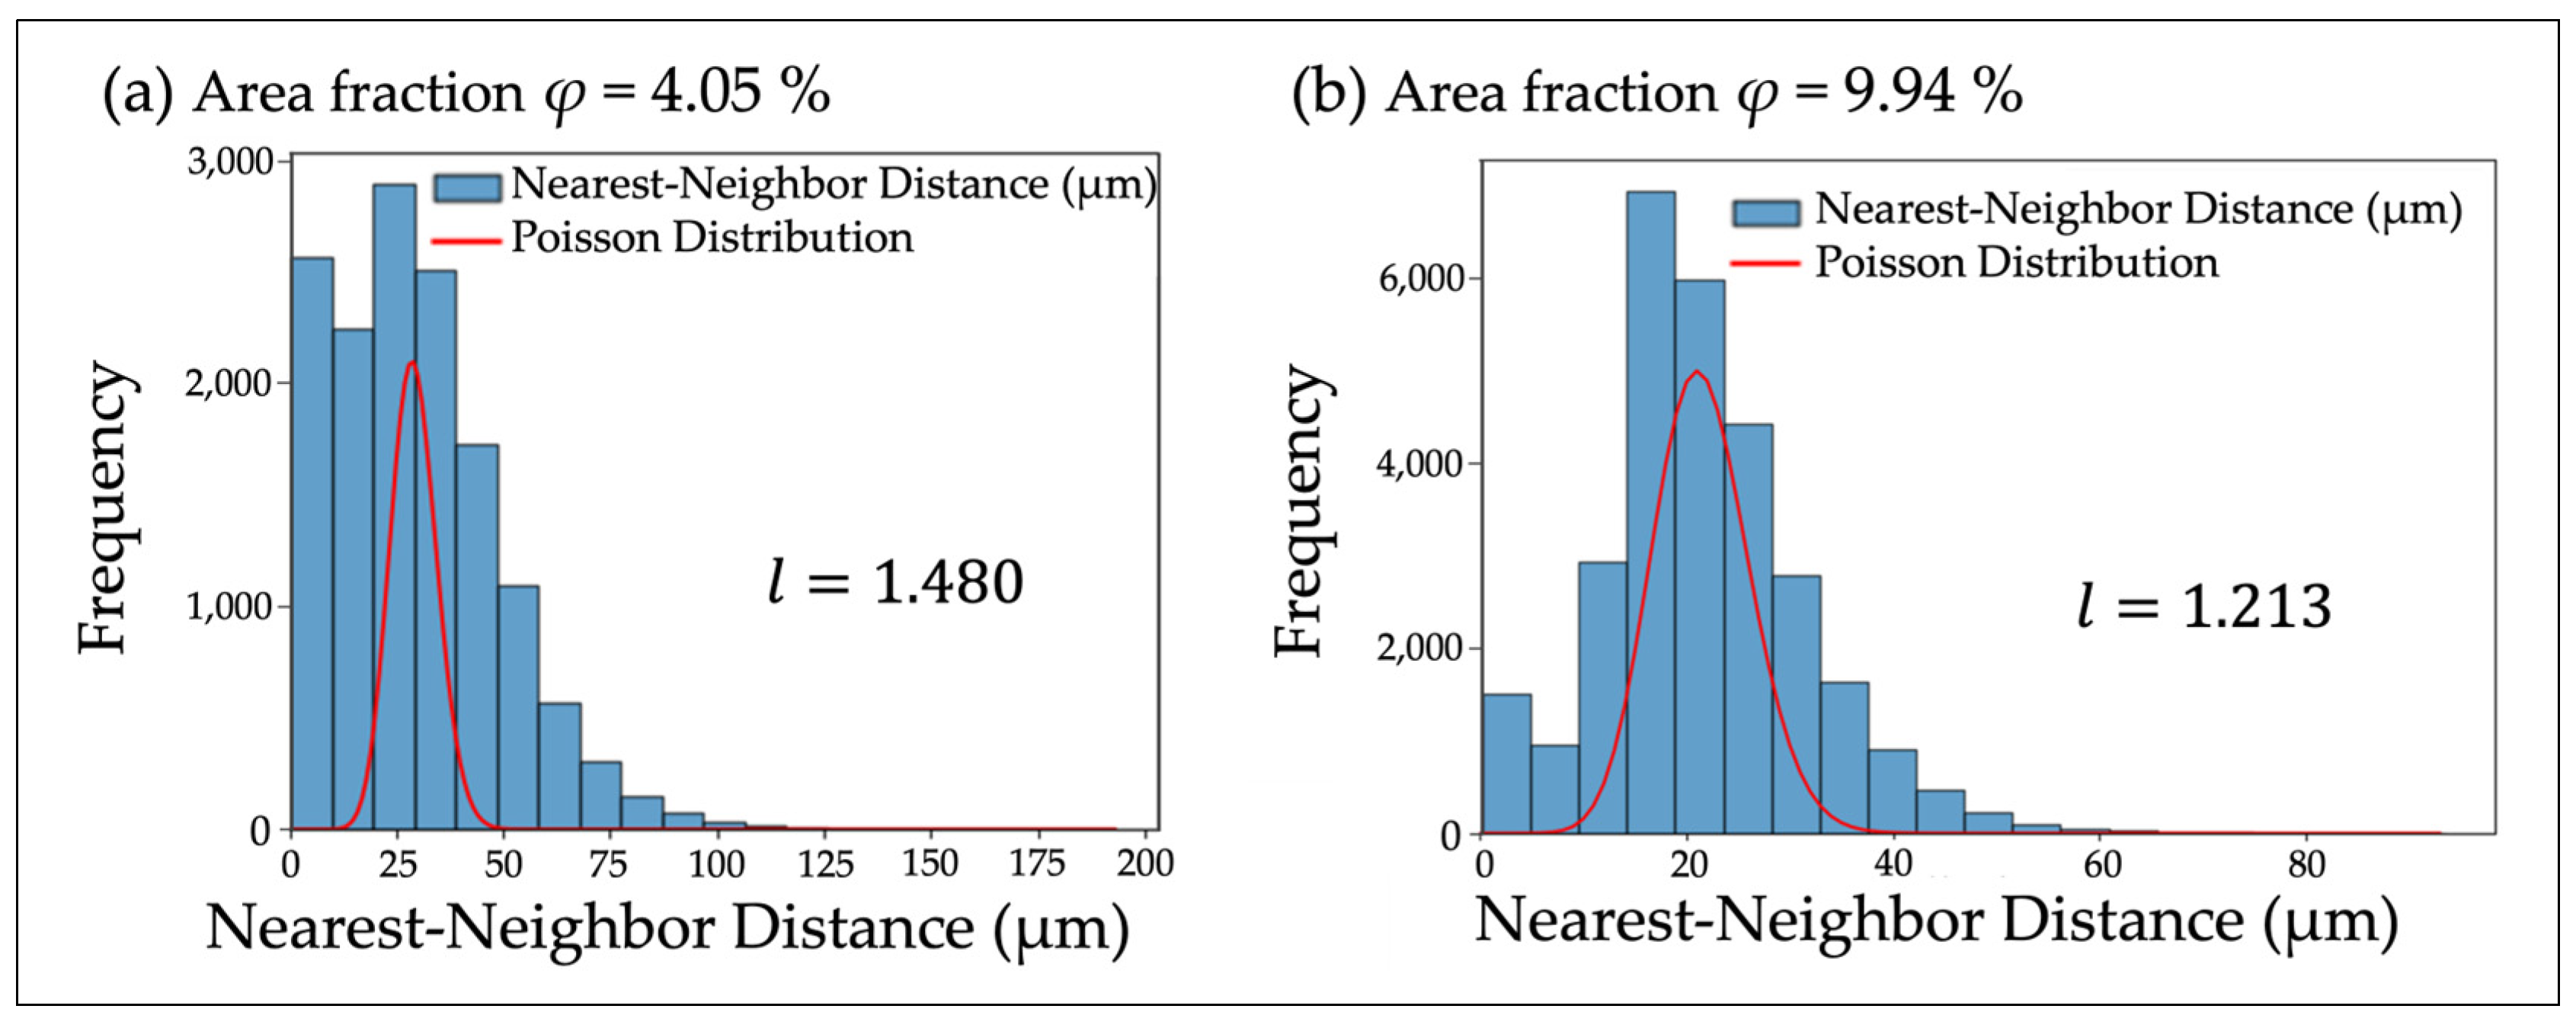
Supplementary to the findings from Figure 6, the ES in Figure 7, utilizing the same 80 µm shim ring, corroborates these observations. This highlights a similar shift from swarming to dispersal with increasing cell density, as reflected in the ES analysis. The quantification of nearest-neighbor distances through ES analysis provides a detailed view of this transition.
Specifically, at lower densities, the observed ES value l exceeding the theoretical threshold of 1.27 suggests a strong tendency for cells to swarm [30], indicative of mutual attractions or environmental conditions favoring such behavior (Figure 7a). Conversely, at higher densities, the reduction of the l value below 1.27 indicates a clear shift towards dispersive interactions among cells (Figure 7b). The concurrence of the VMR and ES results further bolsters the credibility of these observations, offering a comprehensive view of the subtle behavior of cells in varying densities.
The results from both the VMR and ES value l analysis have demonstrated a similar trend in the SD of cells within the quasi-2D space defined by a 200 µm shim ring (Figure 8 and Figure 9). This suggests that this behavior is not significantly affected by the thickness of the quasi-2D space within these ranges (80 µm and 200 µm). From both Table 1 and Table 2, in high-density areas with an area fraction φ > 8%, the VMR is less than 1, and the ES value l was also lower than the theoretical value for a Poisson distribution (l = 1.27), indicating that the cells exhibit dispersive interactions.
In Table S1, φ* is defined as the area fraction (in integer %) set for simulations. At φ* greater than 8%, all five simulated VMR values for each φ* are denoted in red, indicating that the simulated VMR exceeds the measured VMR, suggestive of dispersal behavior. Conversely, at φ* less than 8%, the simulated VMR values, consistently marked in blue, fall below the measured VMR, indicating a propensity for swarming. At the φ* = 8% juncture, a mixture of outcomes is observed with two simulated VMR values in red and three in blue. Despite the minimal variability among the five simulated VMR values for each φ*, this mixed pattern at φ* = 8% does not present a definitive relationship when comparing the measured and simulated VMR values, indicating an instability or transition in behavioral patterns. The presence of both red and blue coded values at this critical point suggests that approximately φ* = 8% represents a boundary or tipping point between swarming and dispersal behaviors.
Therefore, a critical boundary has been identified at approximately φ = 8%, indicating the transition in cell behavior from swarming to dispersal. Below this threshold, cells tend to cluster, likely due to attraction forces or behaviors minimizing energy consumption. Beyond this threshold, cells exhibit dispersive interactions, possibly as a response to limited resources or space. This boundary signifies a change in interaction dynamics dependent on density, which is crucial for understanding the mechanisms of cell behavior in crowded environments.
Previous research [21] has shown that no intercellular interactions occur up to an area fraction of φ = 1%, and subsequent interest has been in the density at which intercellular interactions begin to appear and in behaviors at higher densities. Discrete hypergeometric distributions were introduced to estimate the theoretical VMR considering the full excluded volume effect [38,39]. However, it was decided that models incorporating continuous spatial configurations through simulation could estimate a more accurate VMR, and these simulation results were adopted. Nevertheless, the analysis was complicated by a significant proportion of non-motile cells.
The experimental setup in this study provides a simplified model focusing on the spatial distribution and interactions of specific cell types within a given space. In actual natural environments, multiple types of cells and their communities consist of various taxa with diverse morphology, cell sizes, and taxonomic affiliations. Understanding how these factors influence cell aggregation and dispersion remains a challenge for future research.

5. Conclusions

In this study, by observing cells within the focal depth as cells in a two-dimensional microspace, we successfully reduced the number of non-motile cells dramatically at a high density of about 10% area fraction. By employing image analysis techniques and leveraging the VMR and ES, we have identified a critical boundary at an area fraction of approximately φ = 8%. Below this threshold, cells exhibit swarming behavior, characterized by clustering likely driven by attractive forces or energy-efficient behaviors. In contrast, above this threshold, cells demonstrate dispersive interactions, suggesting adaptive strategies in response to limited space and resources.
However, the challenge of overlapping cells within the focal depth remains, and analyses were conducted using simulations that allowed overlaps up to 5 μm from the observed images. As a future improvement, it is desirable to realize experimental conditions of the complete excluded volume. Furthermore, it is interesting to examine the effect of these microspace sizes on cell distribution. In addition, to gain a deeper understanding of cell motility, modeling of attraction and repulsion forces is necessary.

Supplementary Materials

The following supporting information can be downloaded at https://www.mdpi.com/article/10.3390/micro4030026/s1, Table S1: Comparison of simulated VMR (raw) and measured VMR.

Author Contributions

Conceptualization, Y.G. and E.T.; methodology, Y.G., T.A., K.Y. and M.H.; software, Y.G. and K.A.; validation, Y.G.; formal analysis, Y.G.; investigation, Y.G. and E.T.; resources, E.T.; data curation, Y.G. and K.Y.; writing—original draft preparation, K.Y.; writing—review and editing, Y.G. and E.T.; visualization, Y.G. and K.Y.; supervision, E.T.; project administration, E.T.; funding acquisition, E.T. All authors have read and agreed to the published version of the manuscript.

Funding

This research received no external funding.

Institutional Review Board Statement

Not applicable.

Informed Consent Statement

Not applicable.

Data Availability Statement

The original contributions presented in the study are included in the article/supplementary material, further inquiries can be directed to the corresponding authors.

Conflicts of Interest

The authors declare no conflicts of interest.

Appendix A

The ES offers a rigorous methodology for evaluating the spatial randomness of cell distributions by computing their nearest-neighbor distances. For a distribution conforming to the Poisson model, l has a theoretical value of 1.27. Values of l below this threshold indicate a dispersive interaction, while values above 1.27 indicate a tendency toward agglomeration. This metric is instrumental in discerning whether the spatial arrangement of cells within a specified domain adheres to randomness, as typified by a Poisson distribution, or is influenced by underlying cellular interactions manifesting as either dispersal or swarming.
Figure A1 shows an example characterized by dispersive interactions among cells, where they are posited to be equidistantly spaced. In this model, each cell, designated ‘a’ through ‘d’, identifies its closest neighbor: ‘a’ regards ‘b’ as nearest, ‘b’ selects ‘d’, ‘c’ selects ‘a’, and ‘d’ selects ‘c’, under the assumption that each cell is limited to a single nearest-neighbor.
Figure A1. Conceptual diagram showing an example of dispersive interactions between cells.
Micro 04 00026 g0a1
This figure presents a conceptual example where four cells exhibit dispersive interactions, arranged at equidistant intervals within a 20 µm by 20 µm area, serving as an extreme case of dispersal. Cell ‘a’ identifies cell ‘b’ as its nearest-neighbor. Similarly, ‘b’ identifies ‘d’, ‘c’ selects ‘a’, and ‘d’ selects ‘c’, under the assumption that each cell has only one nearest-neighbor.
The ES value under this condition is calculated as follows:
l = n x i 2 x i 2 = 4 ( 20 2 + 20 2 + 20 2 + 20 2 ) 20 + 20 + 20 + 20 2 = 1 < 1.27
Values of l less than 1.27 suggest that the SD of cells deviates from randomness due to dispersive forces among them, further corroborating the presence of dispersive interactions within the cellular assembly depicted in this schematic.
Figure A2 provides a clear example of swarming interactions among cells, as characterized through the ES analysis. This behavior is illustrated by cells ‘a’, ‘b’, ‘c’, and ‘d’, where the distance between the centers of each pair of adjacent cells is precisely 1 µm, showcasing an extremely close proximity that typifies swarming.
Figure A2. Conceptual diagram showing an example of swarming interactions between cells.
Micro 04 00026 g0a2
This figure presents a simplified example of swarming interactions among cells, characterized by the center-to-center distance of 1 µm between each cell pair (‘a’ to ‘b’ and ‘c’ to ‘d’). For example, cell ‘a’ regards ‘b’ as its nearest-neighbor, while ‘c’ regards ‘d’ as its nearest, highlighting a pattern of swarming that is distinct from a random distribution.
The ES value under this condition is calculated as follows:
l = n x i 2 x i 2 = 4 ( 1 2 + 1 2 ) 1 + 1 2 = 2 > 1.27
In this situation, the l value, indicative of the nearest-neighbor distances, surpasses the theoretical threshold of 1.27, showing a swarming condition. Such tightly packed arrangements are indicative of swarming interactions, where cells get together closely, far beyond what would be expected in a random or dispersed state.

References

  1. Fox, M.; Anthony, M. Quantum Optics: An Introduction; Oxford University Press: New York, NY, USA, 2006. [Google Scholar]
  2. Koyama, K.; Hokunan, H.; Hasegawa, M.; Kawamura, S.; Koseki, S. Do Bacterial Cell Numbers Follow a Theoretical Poisson Distribution? Comparison of Experimentally Obtained Numbers of Single Cells with Random Number Generation via Computer Simulation. Food Microbiol. 2016, 60, 49–53. [Google Scholar] [CrossRef] [PubMed]
  3. Lee, C.T. Higher-Order Criteria for Nonclassical Effects in Photon Statistics. Phys. Rev. A 1990, 41, 1721–1723. [Google Scholar] [CrossRef] [PubMed]
  4. Bechinger, C.; Di Leonardo, R.; Löwen, H.; Reichhardt, C.; Volpe, G.; Volpe, G. Active Particles in Complex and Crowded Environments. Available online: https://arxiv.org/abs/1602.00081v2 (accessed on 10 February 2023).
  5. Reynolds, C.W. Flocks, Herds and Schools: A Distributed Behavioral Model. ACM SIGGRAPH Comput. Graph. 1987, 21, 25–34. [Google Scholar] [CrossRef]
  6. Couzin, I.D.; Krause, J.; James, R.; Ruxton, G.D.; Franks, N.R. Collective Memory and Spatial Sorting in Animal Groups. J. Theor. Biol. 2002, 218, 1–11. [Google Scholar] [CrossRef] [PubMed]
  7. Hemelrijk, C.K.; Hildenbrandt, H. Schools of Fish and Flocks of Birds: Their Shape and Internal Structure by Self-Organization. Interface Focus 2012, 2, 726–737. [Google Scholar] [CrossRef] [PubMed]
  8. Reid, D.A.P.; Hildenbrandt, H.; Padding, J.T.; Hemelrijk, C.K. Fluid Dynamics of Moving Fish in a Two-Dimensional Multiparticle Collision Dynamics Model. Phys. Rev. E 2012, 85, 021901. [Google Scholar] [CrossRef] [PubMed]
  9. Cresswell, W. Flocking Is an Effective Anti-Predation Strategy in Redshanks, Tringa Totanus. Anim. Behav. 1994, 47, 433–442. [Google Scholar] [CrossRef]
  10. Krause, J.; Ruxton, G.D. Living in Groups; Oxford University Press: New York, NY, USA, 2002. [Google Scholar]
  11. Cresswell, W.; Quinn, J.L. Predicting the Optimal Prey Group Size from Predator Hunting Behaviour. J. Anim. Ecol. 2011, 80, 310–319. [Google Scholar] [CrossRef] [PubMed]
  12. Moeur, M. Characterizing Spatial Patterns of Trees Using Stem-Mapped Data. For. Sci. 1993, 39, 756–775. [Google Scholar] [CrossRef]
  13. Darnton, N.C.; Turner, L.; Rojevsky, S.; Berg, H.C. Dynamics of Bacterial Swarming. Biophys. J. 2010, 98, 2082–2090. [Google Scholar] [CrossRef]
  14. Be’er, A.; Ariel, G. A Statistical Physics View of Swarming Bacteria. Mov. Ecol. 2019, 7, 9. [Google Scholar] [CrossRef] [PubMed]
  15. Zuo, W.; Wu, Y. Dynamic Motility Selection Drives Population Segregation in a Bacterial Swarm. Proc. Natl. Acad. Sci. USA 2020, 117, 4693–4700. [Google Scholar] [CrossRef] [PubMed]
  16. Bees, M.A. Advances in Bioconvection. Annu. Rev. Fluid Mech. 2020, 52, 449–476. [Google Scholar] [CrossRef]
  17. Nonaka, Y.; Kikuchi, K.; Numayama-Tsuruta, K.; Kage, A.; Ueno, H.; Ishikawa, T. Inhomogeneous Distribution of Chlamydomonas in a Cylindrical Container with a Bubble Plume. Biol. Open 2016, 5, 154–160. [Google Scholar] [CrossRef] [PubMed]
  18. Jánosi, I.M.; Czirók, A.; Silhavy, D.; Holczinger, A. Is Bioconvection Enhancing Bacterial Growth in Quiescent Environments? Environ. Microbiol. 2002, 4, 525–531. [Google Scholar] [CrossRef] [PubMed]
  19. Pooley, C.M.; Alexander, G.P.; Yeomans, J.M. Hydrodynamic Interaction between Two Swimmers at Low Reynolds Number. Phys. Rev. Lett. 2007, 99, 228103. [Google Scholar] [CrossRef] [PubMed]
  20. Knežević, M.; Welker, T.; Stark, H. Collective Motion of Active Particles Exhibiting Non-Reciprocal Orientational Interactions. Sci. Rep. 2022, 12, 19437. [Google Scholar] [CrossRef] [PubMed]
  21. Aono, T.; Yamashita, K.; Hashimoto, M.; Ishikawa, Y.; Aizawa, K.; Tokunaga, E. Spatial Distribution of Flagellated Microalgae Chlamydomonas reinhardtii in a Quasi-Two-Dimensional Space. Micromachines 2023, 14, 813. [Google Scholar] [CrossRef]
  22. Xiang, C.; Liu, J.; Ma, L.; Yang, M. Overexpressing Codon-Adapted Fusion Proteins of 4-Coumaroyl-CoA Ligase (4CL) and Stilbene Synthase (STS) for Resveratrol Production in Chlamydomonas reinhardtii. J. Appl. Phycol. 2020, 32, 1669–1676. [Google Scholar] [CrossRef]
  23. Saifuddin, N.; Ong, M.Y.; Priatharsini, P. Optimization of Photosynthetic Hydrogen Gas Production by Green Alga in Sulfur Deprived Condition. Indian J. Sci. Technol. 2016, 9, 1–13. [Google Scholar] [CrossRef]
  24. Fragkopoulos, A.A.; Vachier, J.; Frey, J.; Le Menn, F.-M.; Mazza, M.G.; Wilczek, M.; Zwicker, D.; Bäumchen, O. Self-Generated Oxygen Gradients Control Collective Aggregation of Photosynthetic Microbes. J. R. Soc. Interface 2021, 18, 20210553. [Google Scholar] [CrossRef]
  25. Bentley, S.A.; Laeverenz-Schlogelhofer, H.; Anagnostidis, V.; Cammann, J.; Mazza, M.G.; Gielen, F.; Wan, K.Y. Phenotyping Single-Cell Motility in Microfluidic Confinement. eLife 2022, 11, e76519. [Google Scholar] [CrossRef] [PubMed]
  26. Ostapenko, T.; Schwarzendahl, F.J.; Böddeker, T.J.; Kreis, C.T.; Cammann, J.; Mazza, M.G.; Bäumchen, O. Curvature-Guided Motility of Microalgae in Geometric Confinement. Phys. Rev. Lett. 2018, 120, 068002. [Google Scholar] [CrossRef]
  27. Cammann, J.; Schwarzendahl, F.J.; Ostapenko, T.; Lavrentovich, D.; Bäumchen, O.; Mazza, M.G. Emergent Probability Fluxes in Confined Microbial Navigation. Proc. Natl. Acad. Sci. USA 2021, 118, e2024752118. [Google Scholar] [CrossRef] [PubMed]
  28. Markov, D.; Grigorov, E.; Kirov, B.; Denev, J.A.; Galabov, V.; Marinov, M.B. Low-Cost Three-Dimensionally Printed Inverted Plug and Play Optical Instrument for Microfluidic Imaging. Micro 2023, 3, 537–548. [Google Scholar] [CrossRef]
  29. Morisita, M. Measuring of Interspecific Association and Similarity between Communities. Mem. Fac. Sci. Kyushu Univ. Ser. E Biol. 1959, 3, 65–80. [Google Scholar]
  30. Eberhardt, L.L. Some Developments in “Distance Sampling”. Biometrics 1967, 23, 207–216. [Google Scholar] [CrossRef]
  31. Hines, W.G.S.; Hines, R.J.O. The Eberhardt Statistic and the Detection of Nonrandomness of Spatial Point Distributions. Biometrika 1979, 66, 73–79. [Google Scholar] [CrossRef]
  32. Kreis, C.T.; Le Blay, M.; Linne, C.; Makowski, M.M.; Bäumchen, O. Adhesion of Chlamydomonas Microalgae to Surfaces Is Switchable by Light. Nat. Phys. 2018, 14, 45–49. [Google Scholar] [CrossRef]
  33. Benefer, C.M.; D’Ahmed, K.S.; Blackshaw, R.P.; Sint, H.M.; Murray, P.J. The Distribution of Soil Insects across Three Spatial Scales in Agricultural Grassland. Front. Ecol. Evol. 2016, 4, 41. [Google Scholar] [CrossRef]
  34. Chen, G.; Zhu, N.; Hu, Z.; Liu, L.; Wang, G.-Q.; Wang, G. Motility Changes Rather than EPS Production Shape Aggregation of Chlamydomonas microsphaera in Aquatic Environment. Environ. Technol. 2021, 42, 2916–2924. [Google Scholar] [CrossRef]
  35. Zhao, R.; Chen, G.; Liu, L.; Zhang, W.; Sun, Y.; Li, B.; Wang, G. Bacterial Foraging Facilitates Aggregation of Chlamydomonas microsphaera in an Organic Carbon Source-Limited Aquatic Environment. Environ. Pollut. 2020, 259, 113924. [Google Scholar] [CrossRef] [PubMed]
  36. Pinto, E.; Van Nieuwerburgh, L.; Paes de Barros, M.; Pedersén, M.; Colepicolo, P.; Snoeijs, P. Density-Dependent Patterns of Thiamine and Pigment Production in the Diatom Nitzschia microcephala. Phytochemistry 2003, 63, 155–163. [Google Scholar] [CrossRef] [PubMed]
  37. Palanisamy, K.M.; Bhat, O.A.; Govindan, N.; Rahim, M.H.A.; Maniam, G.P. Impact of Biomass Density on Growth Rates of Spirulina platensis under Different Light Spectra. Maejo Int. J. Energy Environ. Commun. 2023, 5, 1–5. [Google Scholar] [CrossRef]
  38. Knight, W. A Method of Sequential Estimation Applicable to the Hypergeometric, Binomial, Poisson, and Exponential Distributions. Ann. Math. Stat. 1965, 36, 1494–1503. [Google Scholar] [CrossRef]
  39. Gnutt, D.; Gao, M.; Brylski, O.; Heyden, M.; Ebbinghaus, S. Excluded-Volume Effects in Living Cells. Angew. Chem. Int. Ed. 2015, 54, 2548–2551. [Google Scholar] [CrossRef] [PubMed]
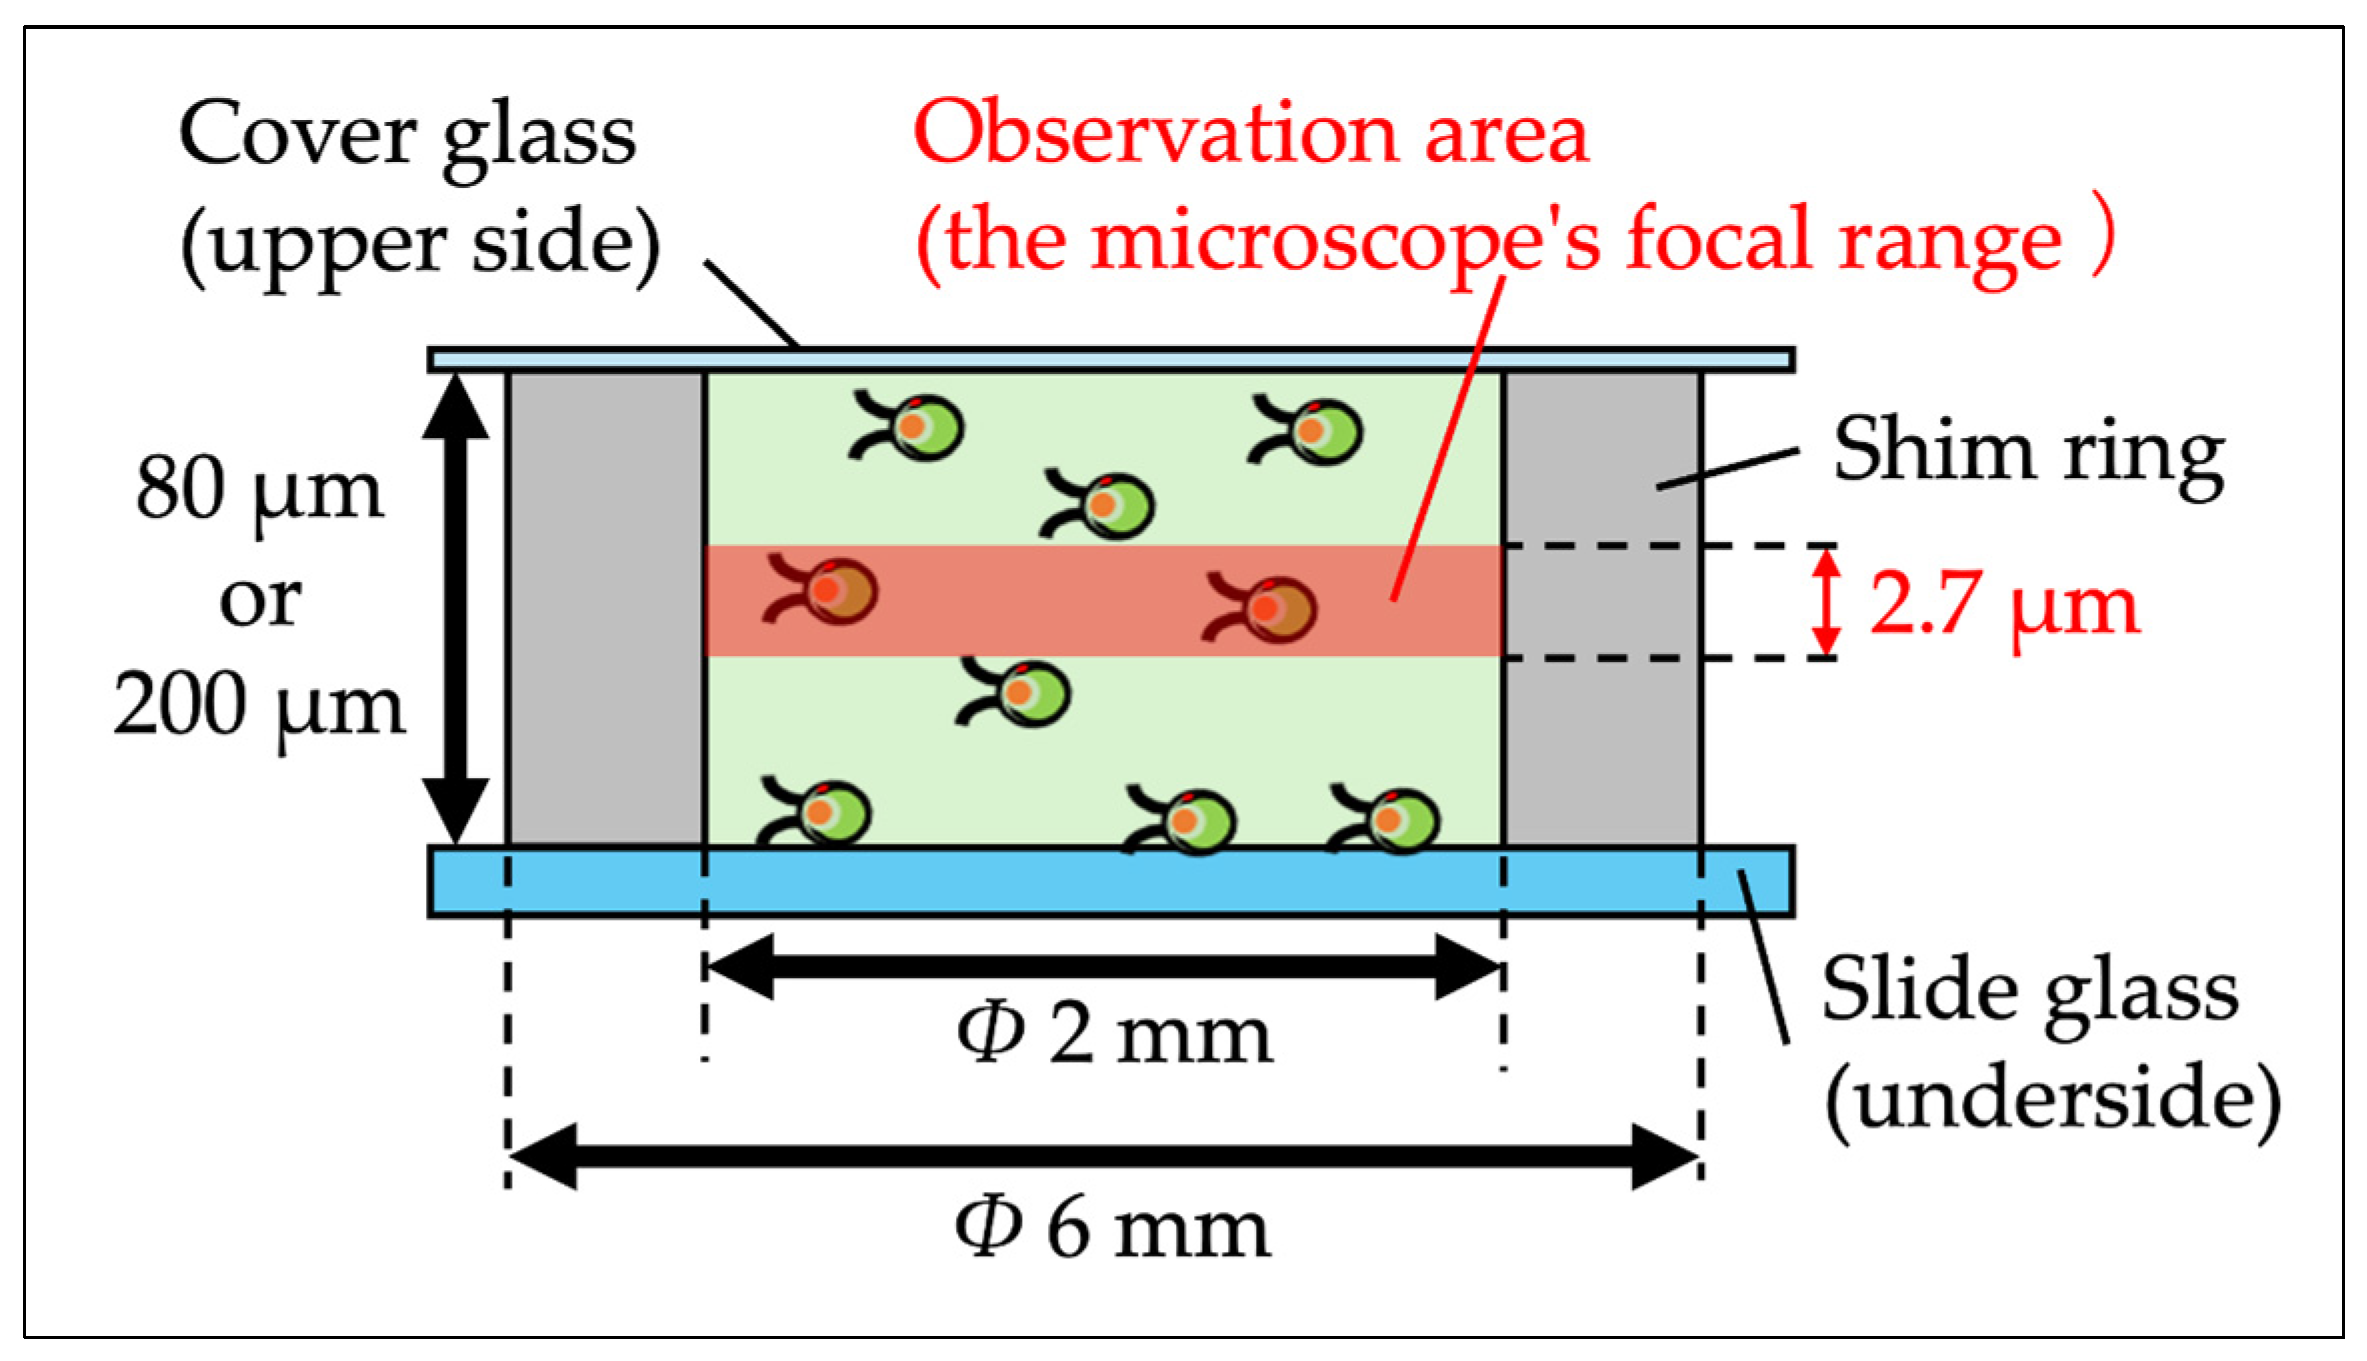
Figure 1. Schematic diagram of the quasi-2D space setup using shim rings. This figure illustrates the experimental setup employing shim rings with thicknesses of either 80 µm or 200 µm to establish a quasi-2D observational space within the microscope’s focal range (2.7 µm). The arrangement includes a lower slide glass, a centrally placed shim ring, and an upper cover glass, together creating a confined space within the inner walls of the shim ring for observing the cells.
Micro 04 00026 g001
Figure 2. Schematic of the quasi-2D space setup. This figure depicts the top view of the quasi-2D space used for observing cells, defined by a shim ring. The setup, with dimensions explicitly marked, includes the observation area within an inner diameter Φ 2 mm and a specified analysis area. A red LED with a central wavelength of 660 nm was used as the observation light source.
Micro 04 00026 g002
Figure 3. Image processing steps for cell analysis using ImageJ. (a) Image following binarization. (b) Image after applying a median filter to the binarized image. The circles outlined in red dashed lines represent the areas recognized as cells.
Micro 04 00026 g003
Figure 4. Binarized and median filter processed image for cell detection. This figure shows an image after undergoing binarization and median filter processing, where cells are allowed to overlap by up to 5 µm. The circles outlined in red dashed lines represent the areas recognized as cells.
Micro 04 00026 g004
Figure 5. Divided observation area (5 × 5).
Micro 04 00026 g005
Figure 6. Mean number of cells per compartment and their variance under two density conditions with 80 µm thick shim rings. (a) relatively low density; (b) high density (around φ = 10%). At low density, the variance-to-mean ratio (VMR) is 1.030, greater than 1, indicating a super-Poisson distribution and swarming interactions. Conversely, at high density, the VMR is 0.827, less than 1, signifying a sub-Poisson distribution and dispersive interactions. For comparison, Poisson distributions with the same mean values are represented by orange curves. The width of the histogram bars represents the range of number of cells, with each bar having a width of 1 in both (a,b). The range of the horizontal axis is shown up to the point where values exist on the vertical axis.
Micro 04 00026 g006
Figure 7. Eberhardt statistical analysis under two density conditions with 80 µm thick shim rings. (a) relatively low density; (b) high density (around φ = 10%). This figure illustrates the frequency of nearest-neighbor distances ( x i ) between cells under two density conditions. At low density, the ES value l = 1.412 is greater than the boundary value of 1.27, indicating swarming interactions, whereas at high density, l = 1.253 is less than 1.27, suggesting dispersive interactions. The red curve represents the frequency of nearest-neighbor distances for cell arrangements following a Poisson distribution with the same mean. The width of the histogram bars represents the range of nearest-neighbor distances, with each bar having a width of (a) 5.7 µm and (b) 4.5 µm, respectively. The range of the horizontal axis is shown up to the point where values exist on the vertical axis.
Micro 04 00026 g007
Figure 8. Mean number of cells per compartment and their variance under two density conditions with 200 µm thick shim rings. (a) relatively low density; (b) high density (around φ = 10%). At low density, the variance-to-mean ratio (VMR) is 1.15, greater than 1, indicating a super-Poisson distribution and swarming interactions. Conversely, at high density, the VMR is 0.823, less than 1, signifying a sub-Poisson distribution and dispersive interactions. For comparison, Poisson distributions with the same mean values are represented by orange curves. The width of the histogram bars represents the range of number of cells, with each bar having a width of 1 in both (a) and (b). The range of the horizontal axis is shown up to the point where values exist on the vertical axis.
Micro 04 00026 g008
Figure 9. Eberhardt Statistical Analysis under two density conditions with 200 µm thick shim rings. (a) relatively low density; (b) high density (around φ = 10%). This figure illustrates the frequency of nearest-neighbor distances (xi) between cells under two density conditions. At low density, the ES value l = 1.480 is greater than the boundary value of 1.27, indicating swarming interactions, whereas at high density, l = 1.213 is less than 1.27, suggesting dispersive interactions. The red curve represents the frequency of nearest-neighbor distances for cell arrangements following a Poisson distribution with the same mean. The width of the histogram bars represents the range of nearest-neighbor distances, with each bar having a width of (a) 9.8 µm and (b) 4.6 µm, respectively. The range of the horizontal axis is shown up to the point where values exist on the vertical axis.
Micro 04 00026 g009
Table 1. Relationships between area fraction, VMR, Eberhardt statistic, and cellular interaction in the 80 µm thick microspace.
Area
Fraction φ (%)
Measured
VMR
Simulated
VMR
Eberhardt
Analysis l
Cellular Interaction
5.391.0340.920 ± 0.0121.378Swarming
6.241.0080.908 ± 0.0111.344Swarming
6.831.0300.903 ± 0.0041.412Swarming
9.430.8550.881 ± 0.0051.254Dispersal
10.70.8340.865 ± 0.0101.255Dispersal
11.90.8270.865 ± 0.0051.253Dispersal
Measured VMR: obtained through experimental observation.
Table 2. Relationships between area fraction, VMR, Eberhardt statistic, and cellular interaction in the 200 µm thick microspace.
Area
Fraction φ (%)
Measured
VMR
Simulated
VMR
Eberhardt
Analysis l
Cellular Interaction
2.861.1310.940 ± 0.0071.500Swarming
3.251.0780.940 ± 0.0071.427Swarming
4.051.1460.928 ± 0.0071.480Swarming
7.800.8860.889 ±0.0091.249Swarming or Dispersal
9.940.8230.873 ± 0.0081.213Dispersal
Measured VMR: obtained through experimental observation.
Disclaimer/Publisher’s Note: The statements, opinions and data contained in all publications are solely those of the individual author(s) and contributor(s) and not of MDPI and/or the editor(s). MDPI and/or the editor(s) disclaim responsibility for any injury to people or property resulting from any ideas, methods, instructions or products referred to in the content.