Article

Visual Detection of Biomolecules Using Concentration Dependent Induced Aggregation of Plasmonic Gold Nanoparticles

1
Northrop Grumman, 2980 Fairview Park Drive, Falls Church, VA 22042, USA
2
Department of Physics, Hampton University, Hampton, VA 23668, USA
*
Author to whom correspondence should be addressed.
Micro 2022, 2(4), 649-662; https://doi.org/10.3390/micro2040043
Submission received: 20 October 2022 / Revised: 17 November 2022 / Accepted: 18 November 2022 / Published: 21 November 2022
(This article belongs to the Section Microscale Materials Science)

Abstract

:
Significant advancement has occurred in the detection methods of solution-based analytes. High-pressure liquid chromatography, gas chromatography, and other systems used for analyses are quite expensive. Therefore, there is a need for new methods and for the visible detection of analytes. Here, we demonstrate that 3-aminopropyl triethoxysilane (APTES) could impact the stability, optical, and morphology of gold nanoparticles (AuNps) in a colloidal solution. These impacts can be used to create a sensitive visual detection system. The strong impact of the APTES concentration on the ultraviolet–visible absorption spectra of the solutions is illustrated, which displays systematic and extensive red shifts. The presence of denatured proteins within a therapeutic drug product can induce a series of adverse effects. This report describes a fast, low cost, sensitive, and user-friendly platform where the plasmonic nanoparticles create visual biosensing of denatured proteins. Artificially heat stressed ferritin, glutathione, and insulin coupled to AuNps are exposed to ATES and upon denaturation of the protein or peptide, systematic blue or red shifts are observed in the absorbance spectra of the AuNps/biomolecules, and aminosilane solution. This serves as a proof-of-concept for a fast in-solution detection method for heat-stressed proteins or peptides.

Graphical Abstract

1. Introduction

The optical properties of gold nanoparticles (AuNps) are of particular interest in biological and biomedical applications and can be controlled by utilizing several different methods. By manipulating the properties of AuNps with respect to components such as inter-particle spacing, size, shape, dimension, and surface chemistry, a user can extensively influence the absorbance spectra [1]. There have been several reports that have discussed the various hues that can be derived by changing the particle growth parameters of AuNps and the resulting particle diameter. Previous reports have indicated large shifts in the absorbance spectra by over several tens of nm as the diameter of the AuNps are increased [2,3,4]. The observed shifts in absorbance mimic the visual changes of colors, ranging from red to blue and purple. The hues of AuNps are also heavily impacted by shape. Irregular shapes and other geometric formations will affect the localized surface plasmons and ultimately the perceived color of the gold nanostructures. In addition to gold nanospheres, the color of gold nanorods has also been extensively explored, and their dependence on size and dimension has been reported. According to a number of reports, the absorbance spectra of the gold nanorods can be fine-tuned to display colors of entire visible spectra [5,6,7]. Not only does size and shape affect the color, but aggregation of the AuNps can also induce color changes due to variations in inter-particle spacing. According to several reports regarding applications in the biomedical field, the aggregation of AuNps and their resulting color change can be used to detect biomolecules through fluctuations in the localized surface plasmon frequencies [8,9,10,11,12]. Hence, this colorimetric technique can be utilized to detect the size and shape of AuNps for the analyte detection of various proteins molecules.
Several significant advances have been made in the detection methods of analytes in solution within the areas of pharmaceuticals, biotechnology, and environmental science, especially for the detection of water contaminated by heavy metals. Several instruments such as high-pressure liquid chromatography, gas chromatography, sodium dodecyl sulfate–polyacrylamide gel electrophoresis (SDS-PAGE) gels, and other systems are expensive with respect to their capital costs, equipment upkeep, and the realty required to house and transport these instruments. Therefore, with these limitations in mind, a large effort has been directed to devising new methods and new devices allowing for the visible detection of analytes with low limits of detection. Specifically, recently, there has been a sharp increase in the use of nanomaterials targeting biological and environmental sensing applications. Metallic nanoparticles such as gold and silver have been of great interest for applications in biosensing, and particularly calorimetric sensing, due to their high local surface plasmonic behaviors [13,14,15,16]. The changes in the plasmonic oscillations of AuNps as a function of surface chemistry, surface energy, or aggregation can cause observable shifts in the transmittance of AuNps. These interactions with the surface plasmons of AuNps provide the mechanism and foundation for the visible detection of analytes.
The basis for these reports includes two components/phenomena that provide the foundation for the intended detection mechanisms. The first being that the addition of the aminnorsilane, 3-aminopropyl triethoxysilane (APTES), to colloidal AuNps can induce large observable plasmonic shifts due to nanoparticle aggregation. The second of which consists of several papers that describe the use of Bovine serum albumin (BSA) and various proteins to stabilize the AuNps after synthesis [17,18,19,20,21,22]. Using these two pieces of information, it is intended to develop a new method for the visual detection of BSA using an inverse mechanism, where a compound known to destabilize AuNps is added in the presence of a compound. With a target application in visual biosensing, the impact of APTES in the presence of AuNps conjugated BSA was characterized with respect to the stability, optical properties, and morphology.
The area of pharmaceutics, with drug products ranging from proteins and antibodies to hormones, is very important for public health. The denatured or aggregated structures of these pharmaceutical products can cause irritation, immunogenicity, anaphylaxis, or even instant death [23,24]. Hence proper detection of these biomolecules in their denatured state is extremely important. Size exclusion chromatography, dynamic light scattering, and SDS-PAGE gels techniques [25,26,27] are currently used to study the stability of these biological molecules. However, due to a lack of cost effectiveness and bulky instrumentations, it is impractical to use these techniques. Therefore, the design of a simple and effective method is necessary for the visual detection of these denatured biomolecules. The advancement in the plasmonic behavior of AuNps comes to the forefront for a unique and inexpensive method for the visual detection of denatured proteins. As AuNps possess a high biocompatibility and diverse optical properties, this noble metal serves as the working material of choice [28,29,30]. In addition, because of the highly active and sensitive local plasmonic effects, visual/optical detection is extremely possible in biological and environmental sensing [31]. The localized surface plasmons of AuNps are central to the particle itself, as opposed to the metallic/dielectric interface [32,33,34].
Proteins and peptides are the building blocks of biological functions and are essential for biochemical reactions for life [35,36,37]. The key components for these macromolecules consist of 20 amino acids linked together in various combinations through poly-peptide bonds. These structures then fold and combine to form three-fold and quaternary structures, ultimately enabling the activities of specific biological functions [38,39,40]. Peptides in particular have been found to have antimicrobial properties, providing assistance in biological functions such as immune response regulation and host defense [41]. Apart from immunity, these macromolecules also perform functions through cell signaling and transduction activities, such as blood pressure and blood volume regulation via the natriuretic peptide family [42,43]. In the case of denatured or significantly stressed biological macromolecules, the potential medicinal effects can become compromised. Specifically, the occurrence of peptide and protein aggregation in biological systems can cause serious diseases, and in pharmaceutical drug products, it induces adverse immunological responses [44,45,46]. Among several studies, one that has been extensively studied is amyloid-fibril aggregation, which causes a disease called amyloidosis [47,48]. This is a protein deposition disease that is characterized by the formation of fibrillar aggregate deposits [49]. These fibrillar aggregates are comprised of a peptide or protein, which are specific to a certain disease [50,51]. Some studies have concluded that mitigating the higher order aggregates and particulates decreased the immune responses in the rodents [52,53]. The aggregates trigger in vivo histamine release and the formation of isoantibodies [54].
The protein or peptide may undergo conditions impacting the long-term drug stability and product lifetime [55,56]. Among several factors, shaking, shearing, temperature, pH level, and protein concentration [57,58] are the main cause of aggregation. The denaturation of proteins and peptides is categorized into reversible and irreversible aggregation, where reversible aggregation is a state in which the proteins and or peptides have been aggregated. The dissociation reversion back to the native and monomeric forms occur [59,60,61] over time. Irreversible aggregates do not revert back to their monomeric forms and can be caused by the rearrangement of disulfide bonds or the formation of new structures due to hydrophobic association, with a direct impact on immunogenicity [62,63].
It has been reported that with the HGH aggregates present in both high- and low-level formulations of HGH, antibody responses were observed in both, but took either a persistent or transient form [64]. It is important to note that the HGH aggregates formed and administered to patients were related to inefficiencies during production purification processes, as opposed to external stresses such as heating or shaking. It has been shown that interferon beta (IFNbβ), used for the treatment of multiple sclerosis, also observed immunogenicity in their patients [65]. The cases with the lowest reports of immunogenicity were linked to the company with the smallest percentage of aggregates and particulate matter in their drug formulation [66,67]. This paper explores the visual detection of various peptides/proteins that have been denatured via an accelerated heat stressed environment, using the artificially induced aggregation of AuNps via APTES.

2. Procedure and Methodology

The gold chloride trihydrate (HAuCl4∙3H2O) had a purity of 49%. (Sigma-Aldrich, St. Louis, MO, USA). The second precursor reagent (trisdodium citrate) had an ACS purity of 99.0% (Alfa Aesar, Haverhill, MA, USA). APTES was obtained from Sigma-Aldrich with a purity greater than 98%. The sodium hydroxide had 97% purity (Sigma-Aldrich, St. Louis, MO, USA). All of the chemicals were dissolved in deionized water (DI H2O) and were used as received, without any further purification.
The AuNps were synthesized via the hot injection synthesis method [35]. In a reaction vial, 40 mg of gold chloride was dissolved in 100 mL of deionized (DI) H2O, producing an approximate 1 mM solution. A second precursor mixture was prepared by adding 115 mg of trisodium citrate to 10 mL of DI H2O. When the Au precursor solution reached roughly 100 °C, trisodium citrate was injected into the reaction vial. The reaction was allowed to continue for 10 min and was then subsequently removed and placed in an ice bath for 5 min while swirling. The solution was then diluted 1:2 in distilled water to increase the working sample volume. APTES with varying concentrations was added to AuNps, as discussed below in the subsequent sections.

3. Results and Discussion

3.1. Visual Detection of Denatured Glutathione Peptides: A Facile Method to Visibly Detect Heat Stressed Biomolecules

The body produces glutathione, which is a tripeptide protein that is essential to life. Among its many functions, glutathione contributes/regulates antioxidant defense, signal transduction, certain metabolic functions, immune responses, and several other biological functions [68]. The function of antioxidant defense is critical, because the oxidative stress has been linked to several diseases such as certain cancers, multiple sclerosis, premature aging, and other illnesses [69]. As glutathione is small in size and prevalence in nature, it serves as a model peptide for evaluation as a detection method for smaller biological analytes. Figure 1 displays the ultraviolet–visible absorbance spectra and images of the AuNps in the GSH and APTES solutions. The trials were performed by first mixing 0.1 mL of a no heat stress GSH sample with 0.8 mL of the AuNp colloidal solution. Subsequently, 0.1 mL of APTES solutions ranging from 0.1 to 0.2% in volume was added to the solution. The APTES and GSH concentrations were achieved via serial dilution in deionized water. In Figure 1A, a systematic red shift was observed in the absorbance spectra of the 3.07 mg/mL GSH trials, as a function of the APTES concentration. The resulting hues of the 3.07 mg/mL GSH trials containing 0.1% and 0.12% correspond to a red hue (shown in Figure 1B). However, as the concentration of APTES increased, a magenta and purple hue was observed at 0.14% and 0.16% APTES, respectively. A red shift was observed in the 0.18% and 0.2% APTES concentrations, in which the resulting solution hues exhibited a blue color (Figure 1B). A comparable trend was observed within the 30.7 pg/mL GSH trials displayed in Figure 1C, where the same procedure was employed. A systematic red shift was observed in the absorbance spectra of the solutions for both GSH concentrations (Figure 1B,D) as the concentration of APTES increased, corresponding to a clear progression of hues from red to purple to blue. The full width half maxima (FWHM) of the intensity of the absorbance spectra increased with the APTES concentration as well as time.

3.2. Visual Detection of Denatured Ferritin Protein from Horse Spleen

Here, we present a unified and simple method to detect denatured proteins visually through utilizing concentration dependent aggregated AuNps via APTES. The addition of APTES to AuNps creates an extensive shift in the absorbance spectra that can be viewed visually to detect the stable proteins. We devised a sensitive experiment to confirm viability and to visually detect ferritin for the current study. Ferritin concentrations ranging from 10−3 M to 10−6 M were prepared and combined with the AuNps solution. Each trial concentration was then exposed to 100 μL of APTES and the changes in the absorbance spectra as a function of the protein concentration were monitored. A systematic decrease in the red shift was observed, as shown in Figure 2A–D. A strong maximum peak dependence for the wavelength of the ferritin concentration was found, as shown in Figure 2. AuNps were able to aggregate more extensively with a decrease in the ferritin concentration upon APTES addition, causing a systematic shift. We demonstrated that the aggregation of AuNps is dependent on the concentration of ferritin in the solution when exposed to APTES. This confirms the sensitivity of this system to the presence of ferritin in a solution and suggests the viability of the visual detection of denatured ferritin using a similar mechanism.
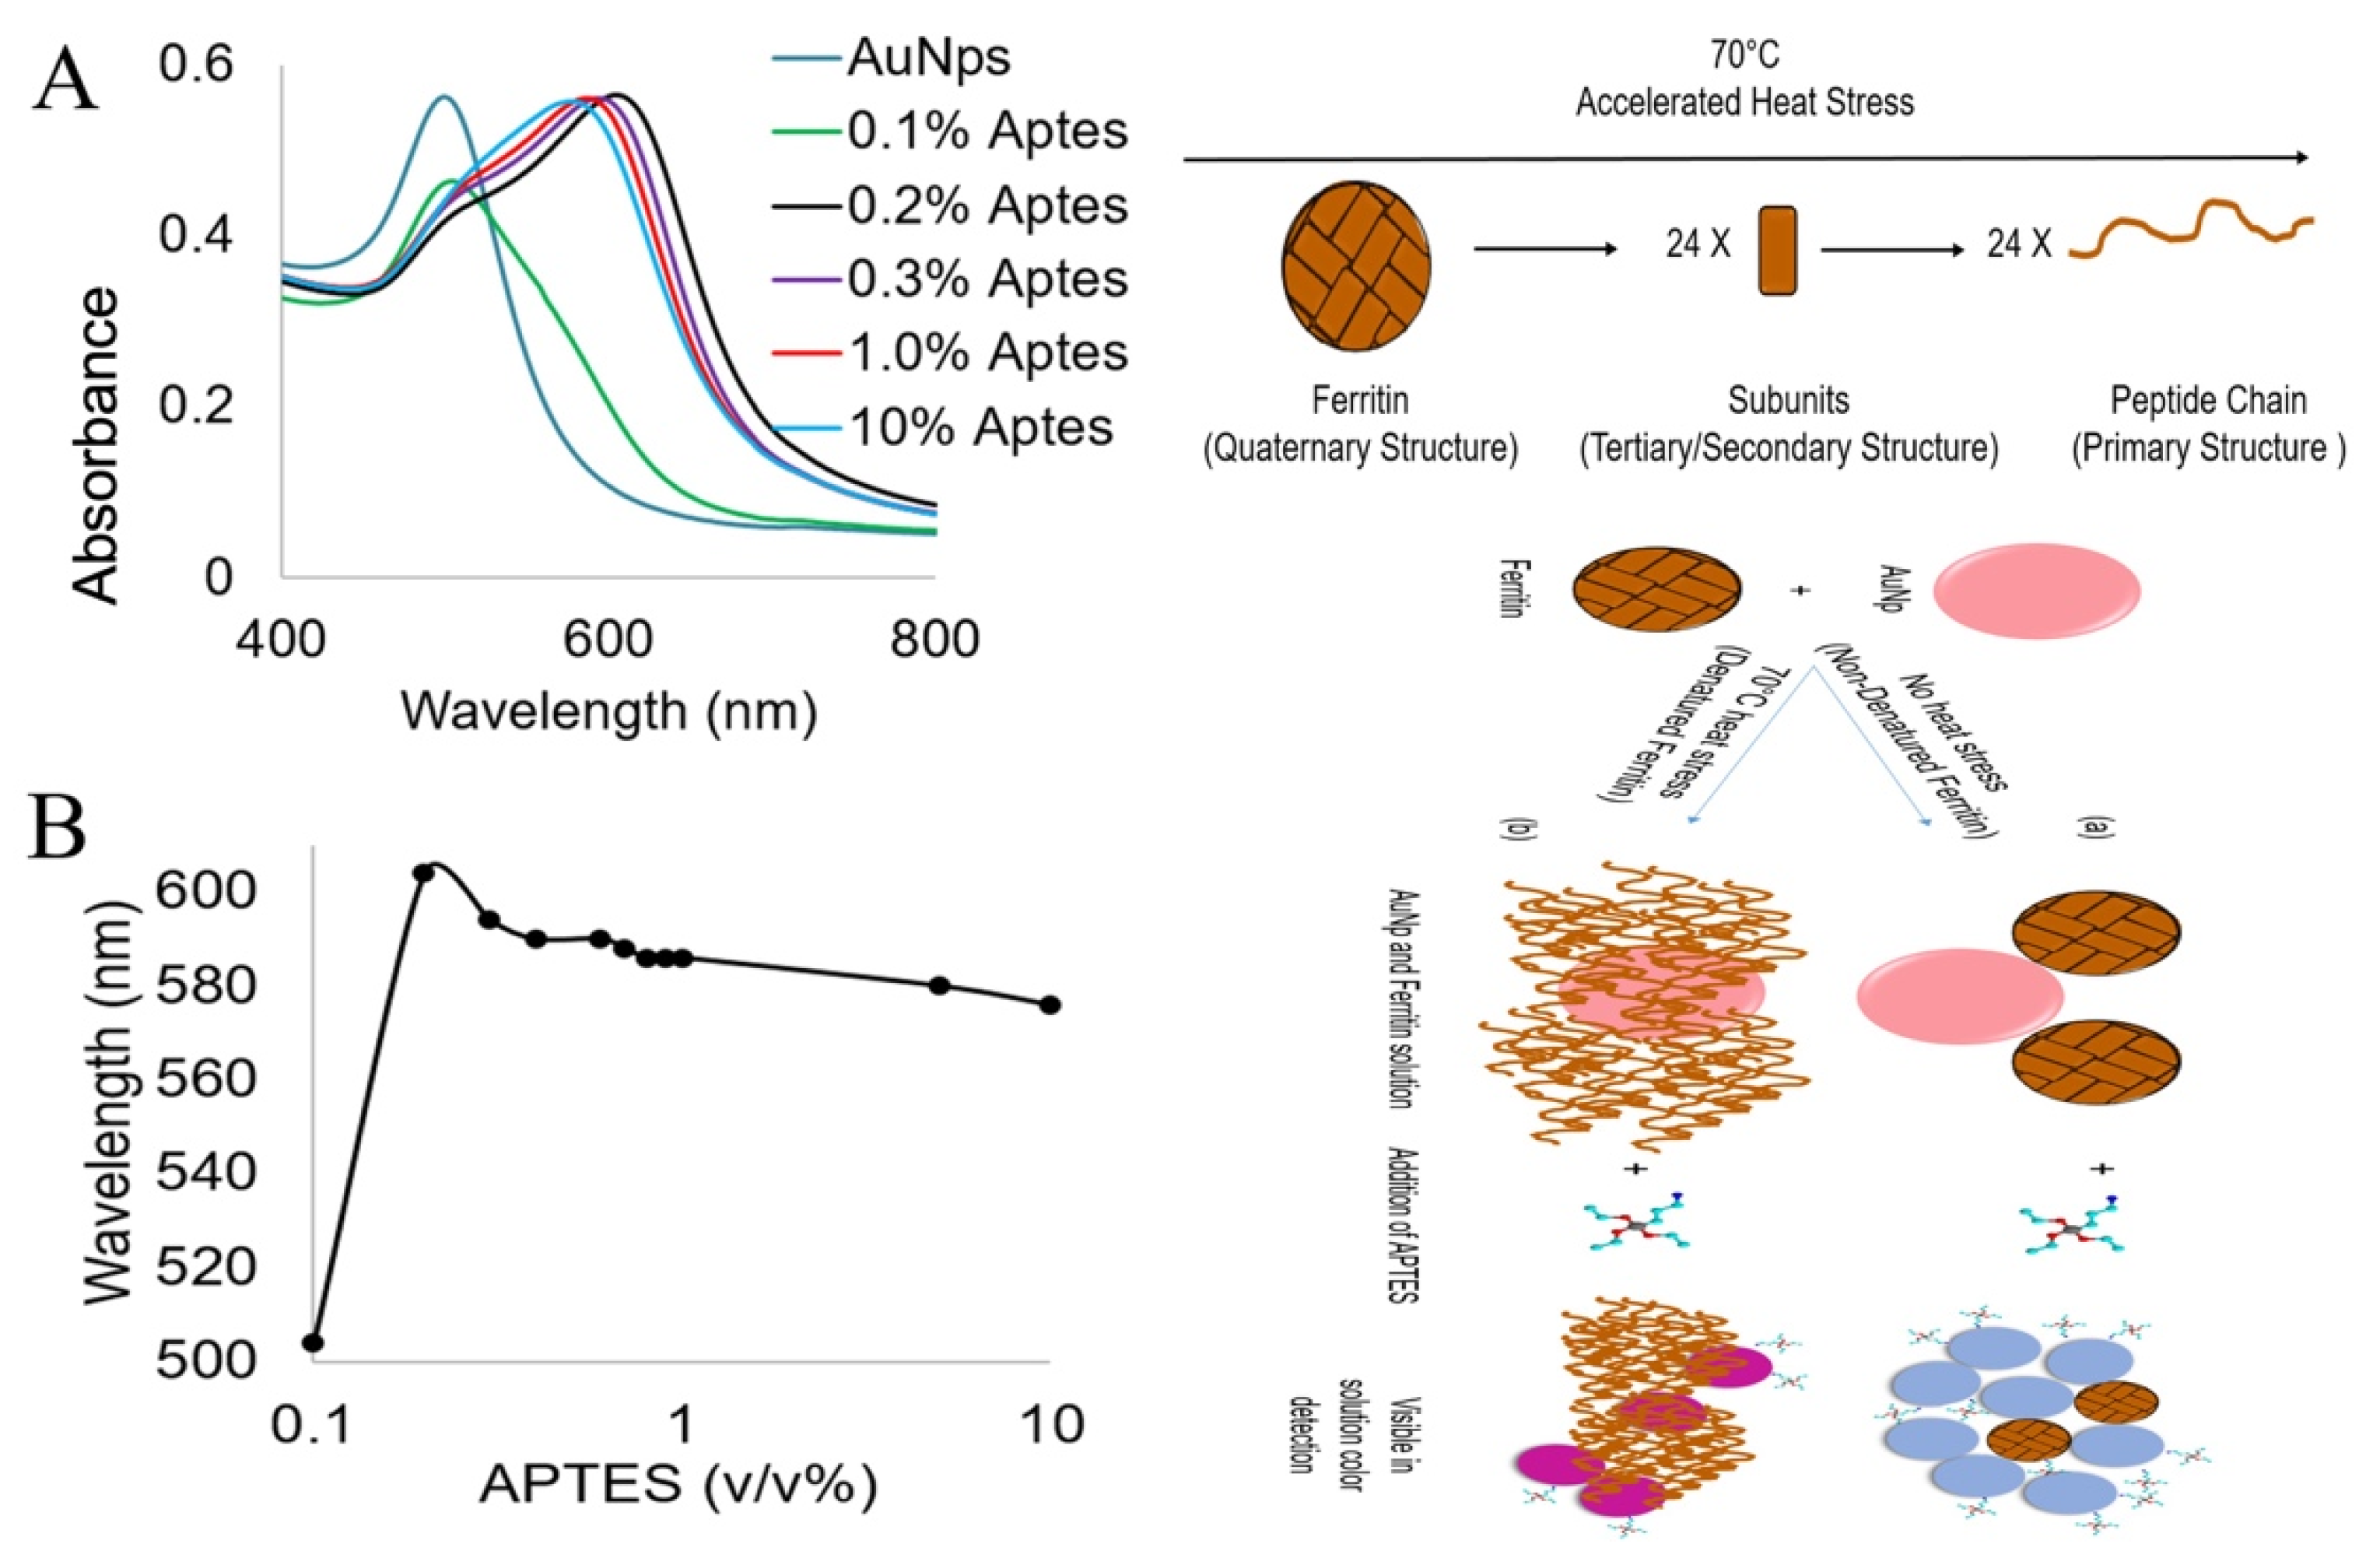
To support the visual detection method for denatured proteins, a systematic study was developed to understand how different concentrations of APTES would affect a stable AuNps and ferritin complex. Figure 3A,B displays the absorbance spectra of AuNps and ferritin exposed to varying concentrations of APTES, ranging from 0.1% to 10%. As the concentration of APTES increased beyond 0.2%, a systematic red shift was observed followed by a strong blue shift. The red shift and subsequent blue shift are clearly visible in Figure 3B, in which a 100 nm increase in the wavelength from 0.1 to 0.2% was observed. A negative trend was noticed due to the 30 nm decrease in wavelength as the concentration of APTES increased from 0.2% to 10% (Figure 3B). This information is critical when designing the visual detection parameters, especially when the optimal concentration of APTES was determined to induce a color change at specific degrees of degradation. If a protein degrades easily, or the threshold for degradation is small, then the optimal concentration would fall sharply. For example, the APTES concentrations were evaluated first for optimization between 0.1% and 0.2%.
Proposed Mechanism: Without the addition of APTES, the AuNps solution is relatively monodisperse, maintaining an optical absorbance of about 500 nm at a size of 10–15 nm. These values were found to be comparable to other previously reported sizes and corresponding wavelengths [70,71]. We detected a higher order aggregate formation at the 200 nm scale after adding 0.1% APTES to the AuNps solution. The observed dimers were induced because of dipoles that formed due to the presence of APTES. This caused the AuNps to aggregate [72], as the amine group present in APTES was electrostatically attracted to the negatively charged surface of the AuNps [73,74]. The resulting coulombic attraction caused a dipole in AuNps, increasing the overall energy state of the particle. To decrease this energy state, the AuNps aggregate, stimulating a color change in the solution. Based on the ferritin aggregation, we proposed the following detection mechanism. Without the presence of ferritin in the solution, the addition of 100 μL of APTES (ranging from 0.2–5.0%) induced a visual color change from a red color to a blue hue. With the addition of 100 μL of a 1.14 × 10⁻⁷ M ferritin concentration, exposure to this range of APTES concentrations will also produce a blue color. As the protein begins to denature, the ferritin agglomerates form barriers that prevent the aggregation of the AuNps as a function of the extent of ferritin degradation, as shown in Figure 3 (Schematics). We propose that as the ferritin is denatured, it blocks the AuNps from more aggregation, closing the inter-particulate space and the degree of aggregation, forming a systemic blue shift as the heat stress is applied to the protein.

3.3. Visual in Solution Detection of Denatured Insulin Coupled to Gold Nanoparticles

The pharmaceutical industry produces many active pharmaceutical ingredients that are applied in order to increase human health and quality of life, at various costs [75]. The formulations of drugs are very important as they maintain the native structure of the drug product to prevent undesired biological interactions with the host upon application to patients. This section of our work describes insulin protein from recombinant DNA, which was utilized as the model protein for the study, as it is a very common hormone produced and secreted by the pancreas. A number of clustered cells containing beta cell, which is responsible for producing insulin and releasing it into the blood stream [75], exist within the pancreas. Insulin is composed of 51 amino acids separated into two peptide chains connected by two disulfide bonds [41,76,77]. Insulin is a small protein with a molecular weight of approximately 5800 g/mol and a molecular radius of 1.34 nm [78,79,80]. This small protein plays a major role in the control of hyperglycemia for patients with type 1 diabetes and in selected patients with type II diabetes by regulating blood glucose levels [81,82]. The National Center for Chronic Disease Prevention and Health Promotion predicts that 9.3% of the population in the United State has some form of diabetes [83], and this rate is increasing. It affects a staggering 350 million individuals [84] worldwide. Insulin produced pharmaceutically and biologically can exist as a hexamer and is stabilized by disulphide bridges [69,85]. As insulin may exist as a hexamer or in 6-monomer aggregate forms, further aggregation within the system can occur based on changes in the optimal environment conditions [69]. Studies have shown evidence that insulin can aggregate at very low pH values, high temperatures, and excessive agitation [71].
AuNps possess a high biocompatibility and optical properties suitable for the applications for the visual detection [71,72,86], as discussed before. It is understood that BSA could be detected visually using AuNps in the presence of APTES [73,87]. The addition of a protein to the solution before the addition of APTES determines the extent of aggregation upon exposure of the protein/AuNps solution to APTES. The current study takes a step further for the detection of changes in the protein structure as opposed to the protein concentration. To visually detect insulin proteins that have been heat stressed, the concentration dependent induced aggregation of AuNps is utilized as a function of the protein denaturation time and APTES exposure.
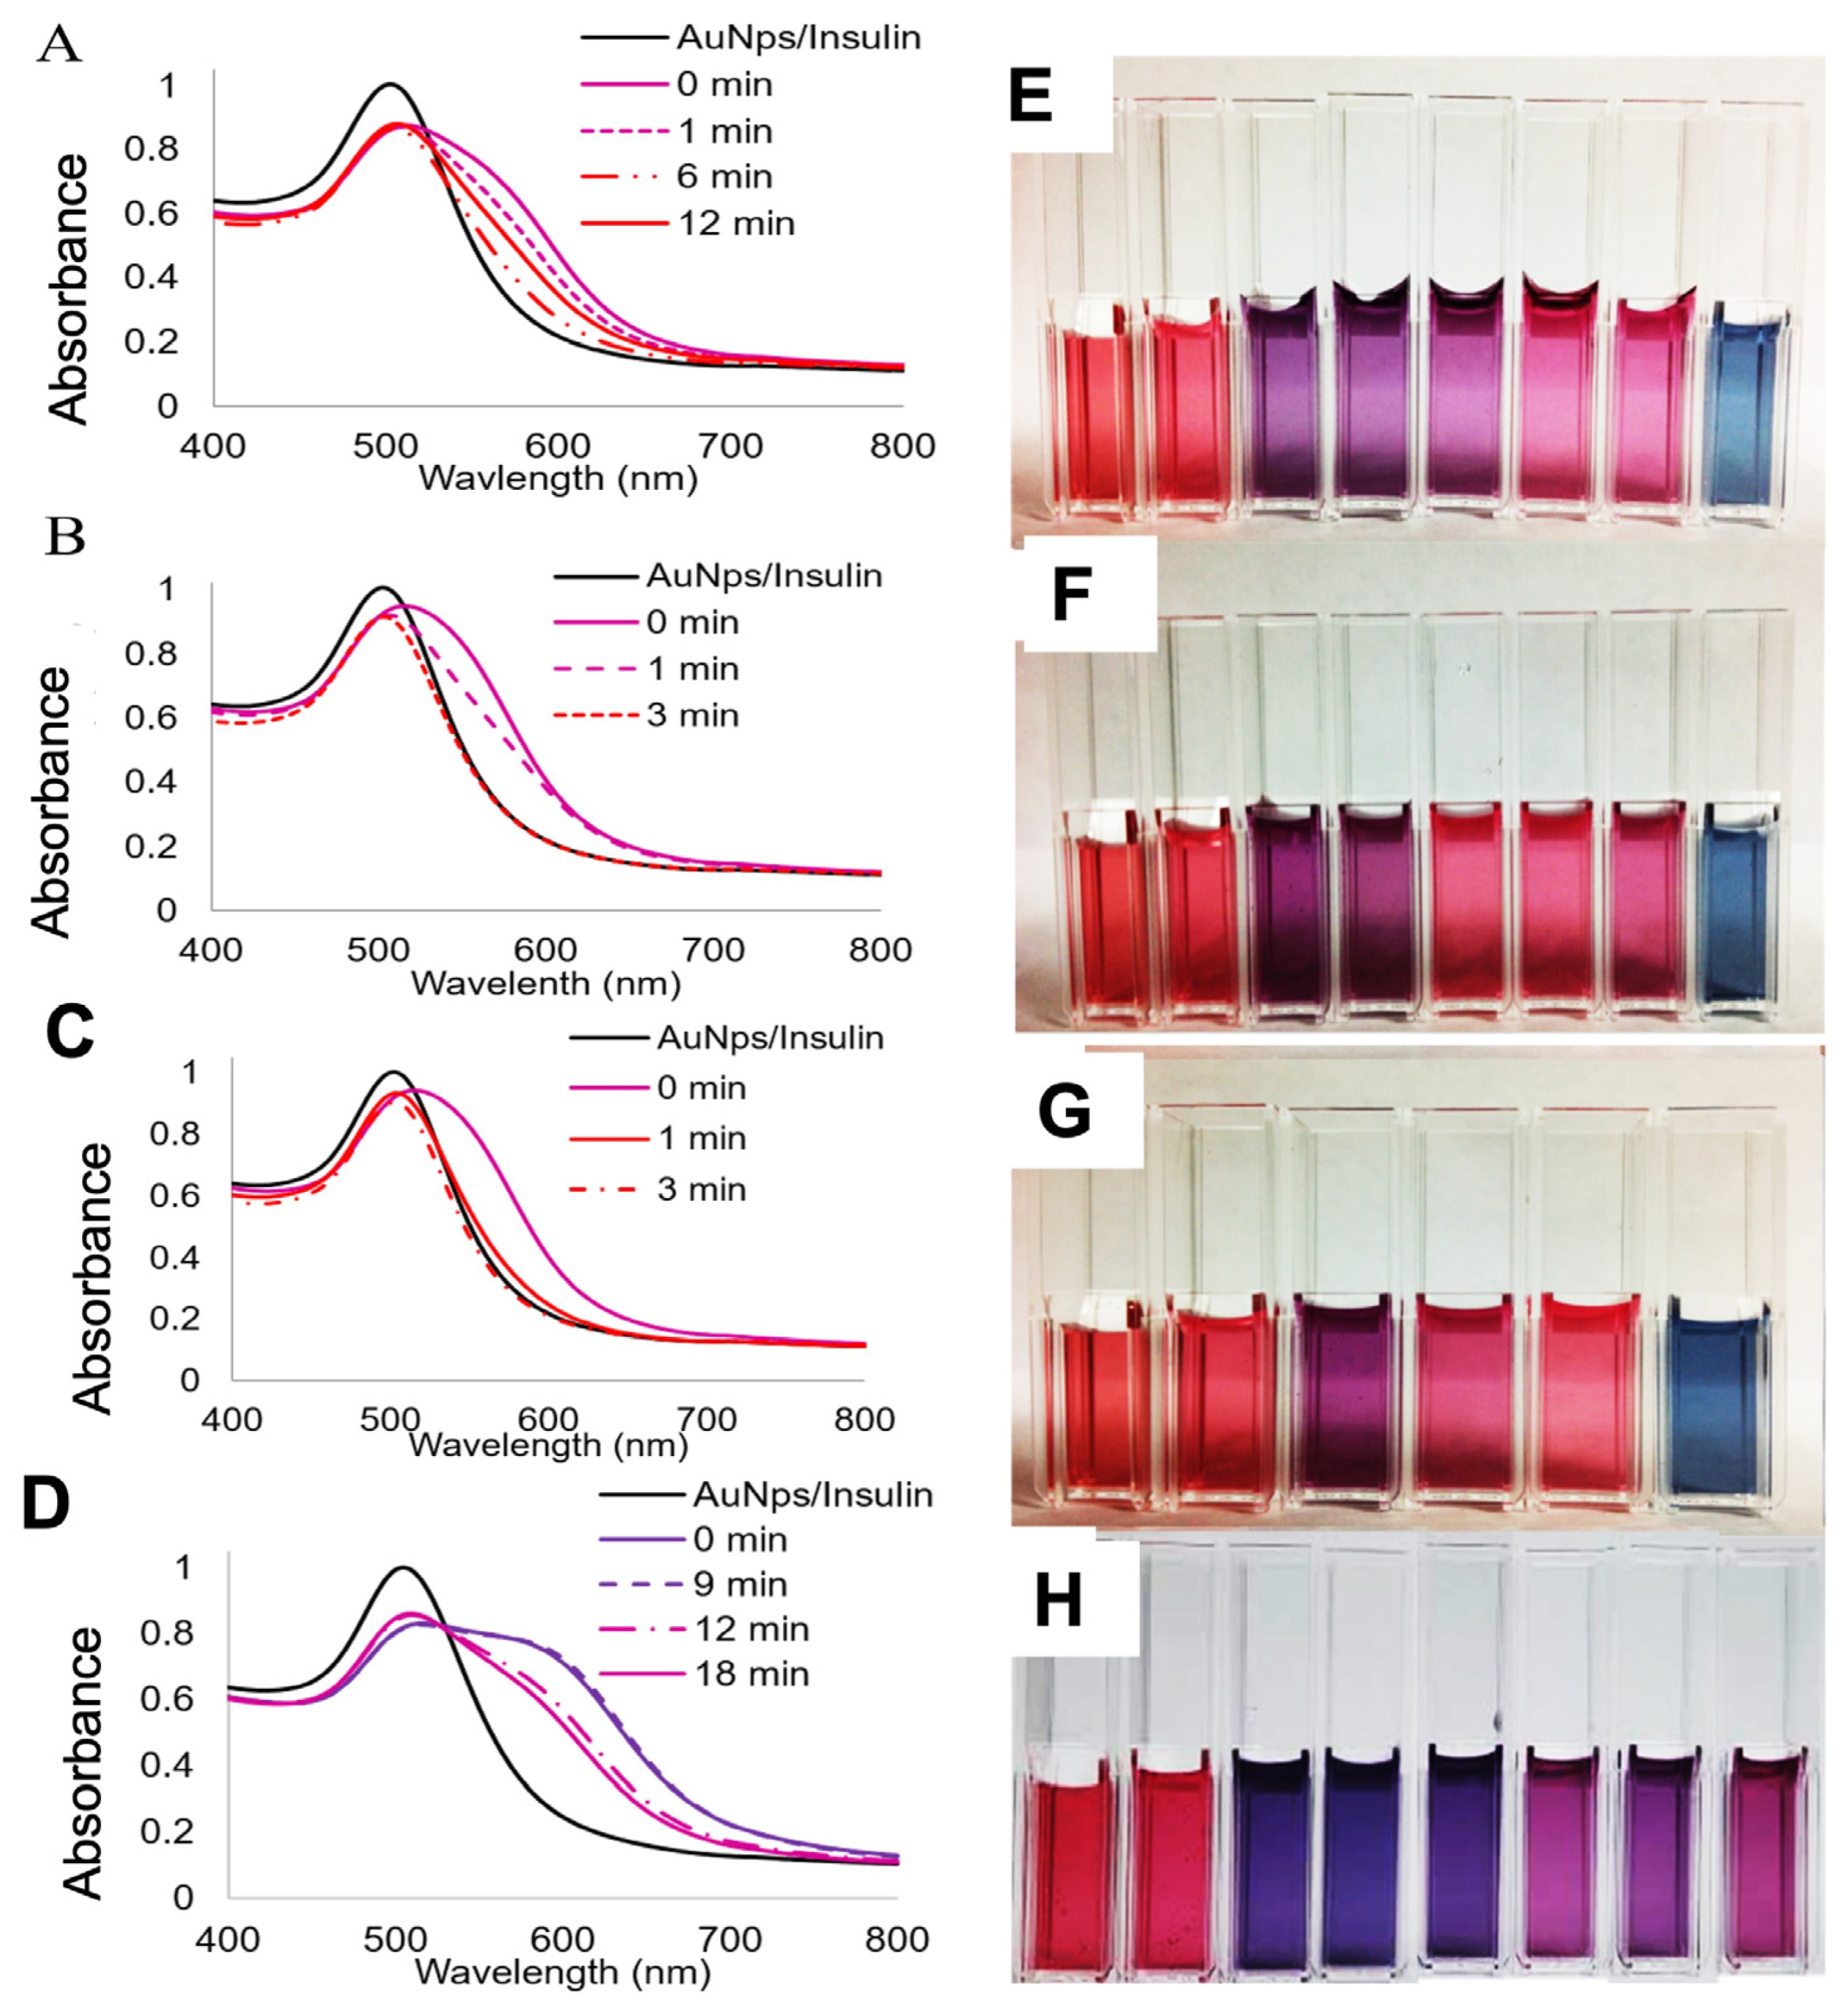
We performed the following experiment to quantify the optical changes in the solutions containing denatured vs. non-denatured insulin. After 0.8 mL, the AuNps solution was mixed with 0.1 mL of the heat stressed insulin, 0.1 mL of either 0.3% or 0.2% APTES was added to the solution to complete the trials, and subsequently UV–VIS measurements were carried out. A systematic blue shift in the max peak wavelength and a decrease in the peak broadening was observed as the heat stress time was increased for all trials, as shown in Figure 4A–D. Figure 4A shows that the insulin was heat stressed at 80°C using 0.3% and 0.2% APTES, respectively, resulting in a significant decrease in the peak broadening after only 1 min of heat stress. The absorbance spectra of the 1 min trial (shown in Figure 1C) are almost indistinguishable from the control AuNps, as well as native insulin without APTES. However, on the other hand, it took 6 min to produce an appreciable decrease in peak width for the trial containing 0.3% APTES. In contrast, we observed the temperature dependence of the absorbance spectra when the heat stress temperature was decreased to 70 °C. It took almost 3 min for the accelerated heat stress to induce regression of the max peak wavelength back to approximately 500 nm, and this is shown in Figure 4B. The subsequent blue shifts were observed as a function of accelerated heat stress, while a higher APTES concentration of 0.4% was utilized.
Visual Detection: The visual solution color detection of the denatured insulin utilizing AuNps and APTES corresponded to the changes in the absorbance spectra of the samples. Figure 4E–H displays the solution hues of the insulin, AuNps, and APTES trials. The resulting solution hues for the 80 °C heat stress and 0.3% APTES trials were detected and are shown in Figure 4E. The insulin was heat stressed and the solution transitioned from a purple hue back to a pink/red hue, indicating visual detection at 6 min of heat stress. Figure 4F demonstrates the 70 °C heat stress and 0.2% APTES trial that produced a 3 min detection. It shows a similar trend of a purple to red color transition. Figure 4G shows the faster visual detection just after 1 min of accelerated heat stress at 80 °C and 0.2% APTES, maintaining the purple to red hue. However, in contrast, the 0 min solution hue turned to a deep purple at a higher APTES concentration of 0.4%, and the visual indicator occurred after 12 min to a lavender purple (Figure 4H). It is projected that there would be a defined level of insulin denaturation that would produce a red hue and give a second detection marker for a 0.4% APTES concentration trial if the heat stress of the insulin was continued.
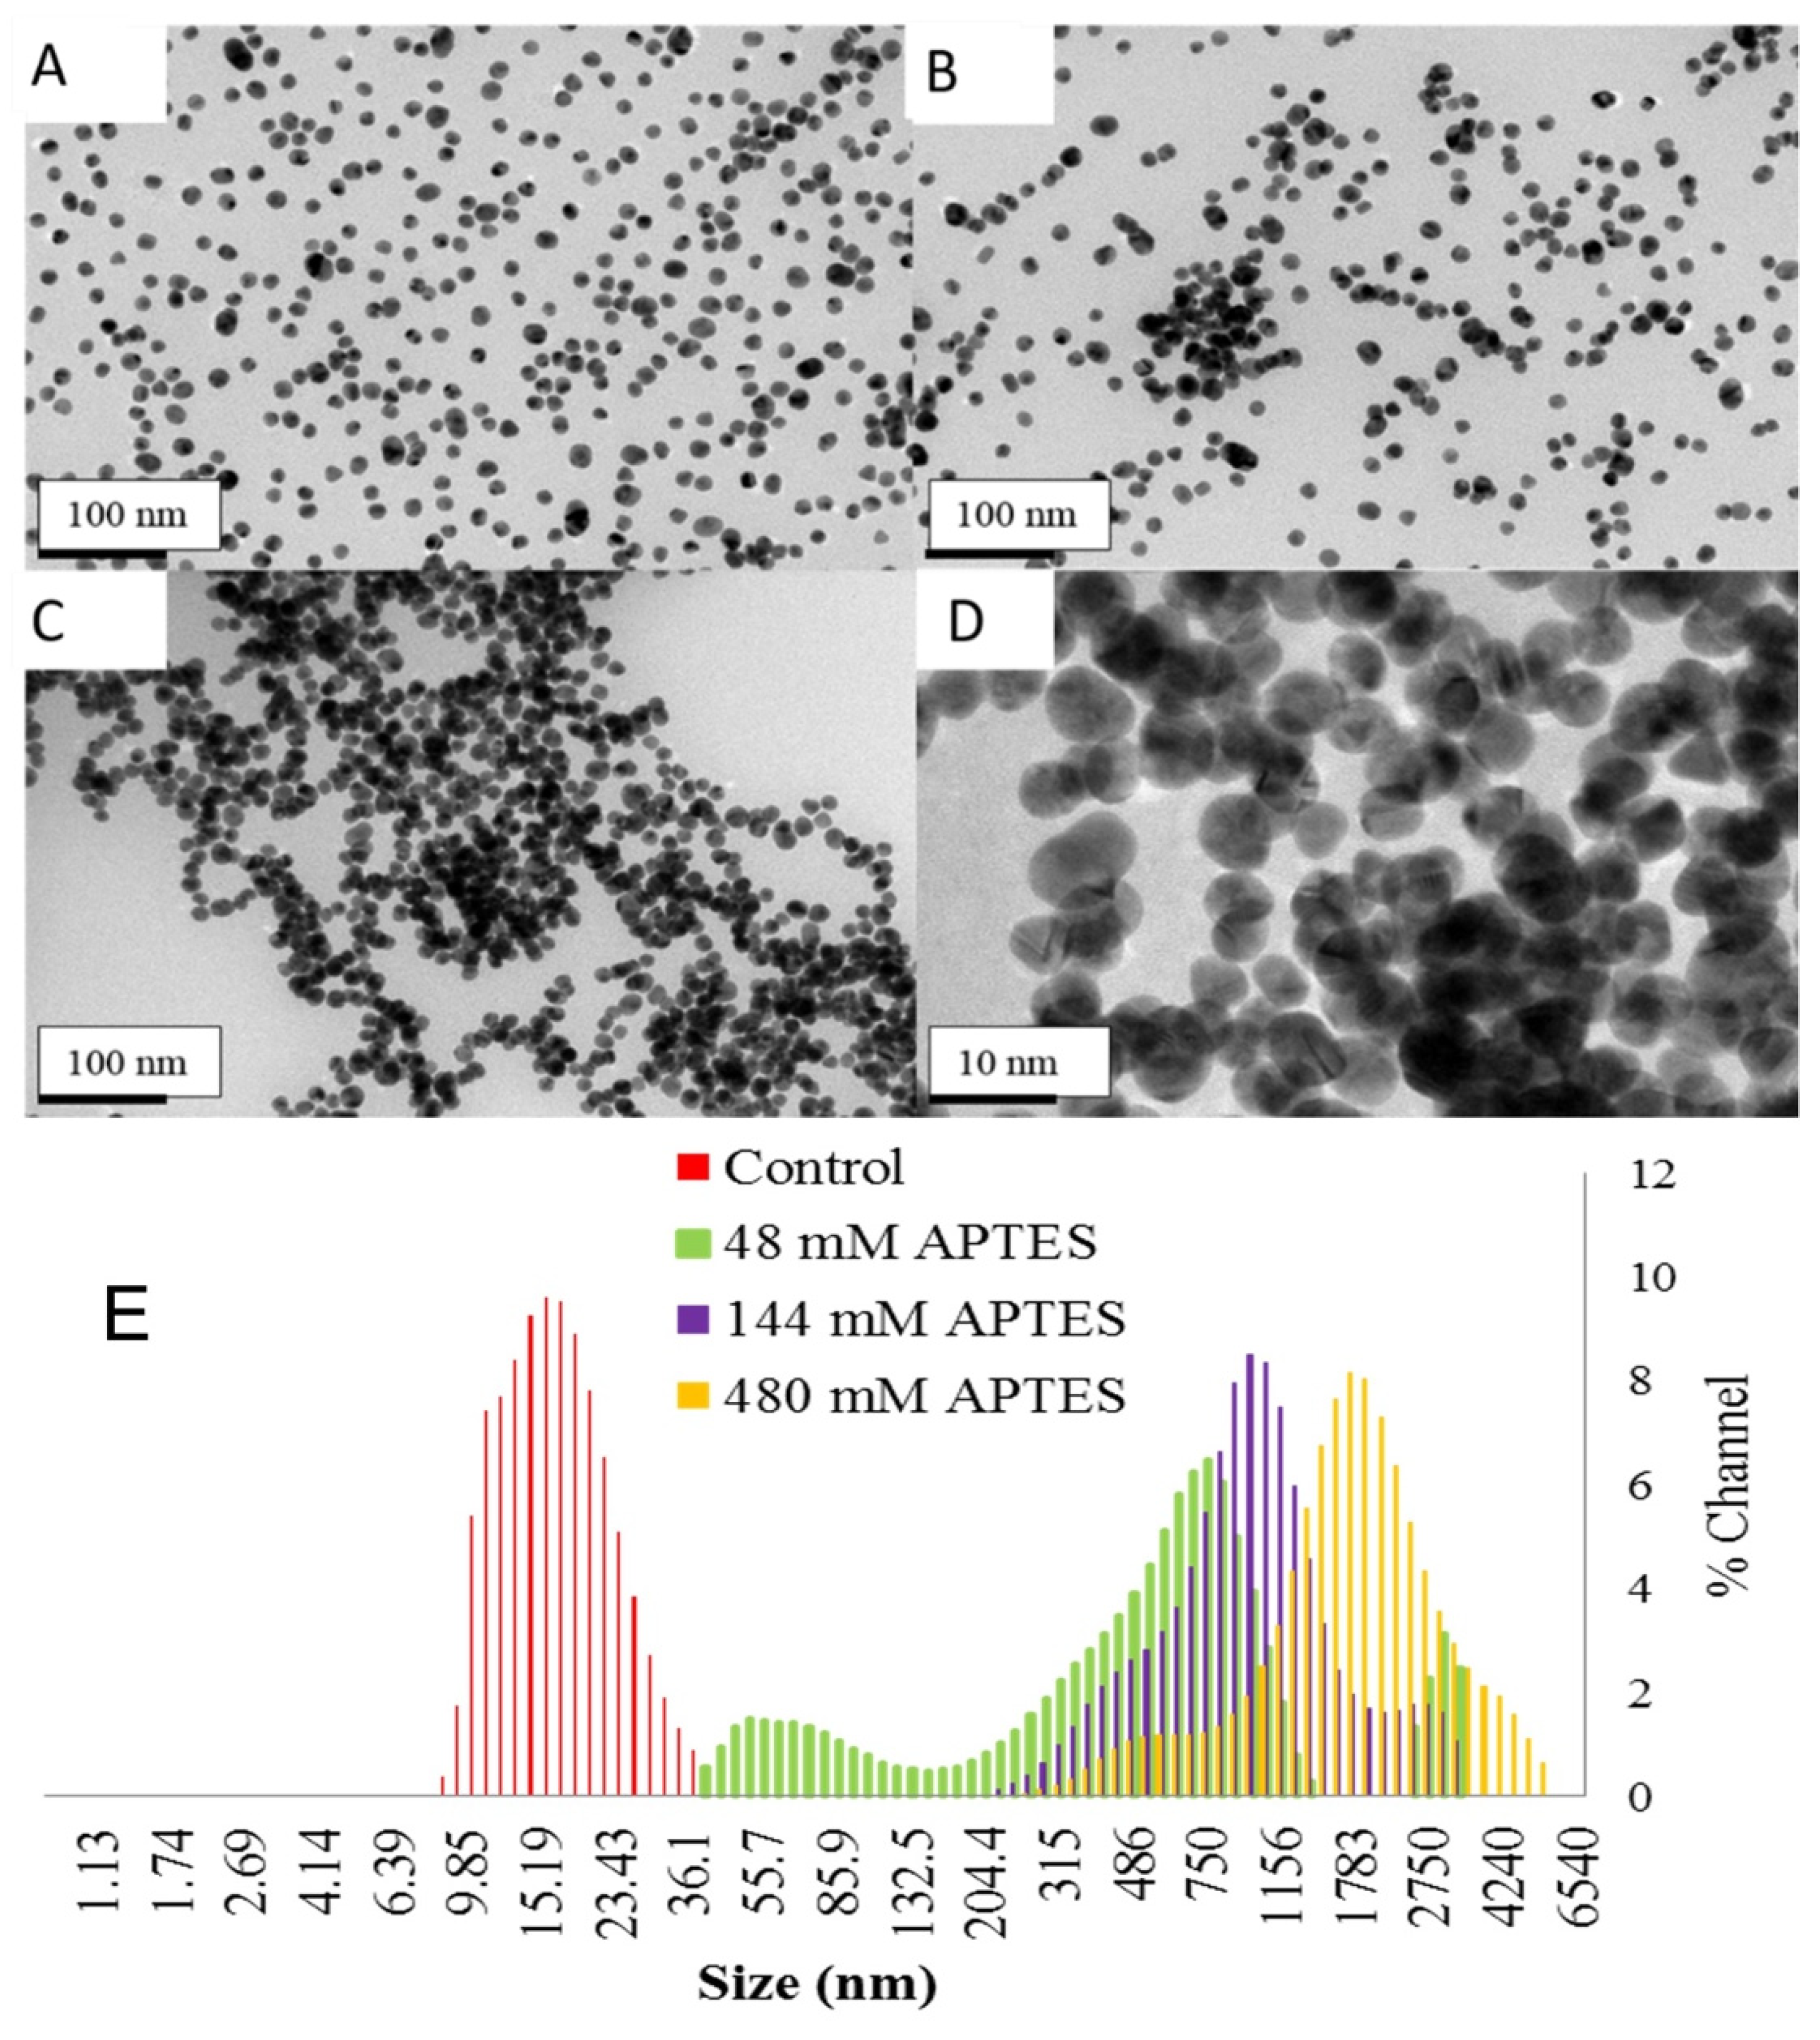
APTES Induced Aggregation: To evaluate the changes in the optical properties of gold colloidal solutions produced by the addition of APTES, several concentrations ranging from 48 to 475 mM were tested [71,72,88]. This trend was also observed within the TEM images obtained of the AuNp solutions exposed to increasing concentrations of APTES. In Figure 5A–C, there is a clear progression of the degree of aggregation within a sample, as the concentration of APTES increased from 47 mM to 144 mM. Most of the control sample was monodispersed; however, with increased concentrations of APTES, the AuNps began to aggregate linearly via dipole–dipole interactions and then non-directionally to form large micron scale clusters. Marginal aggregation was observed in the control, consisting mainly of dimers, trimers, and tetramers, with larger aggregation sites being more sporadic. This was a stark difference to the extensive globular formations experienced within the high concentration APTES trial. It is important to note that only negligible changes in particle size were observed, and the extreme shift in absorbance could not be attributed to such a slight change, but was instead a strong function of the APTES induced aggregation. It is noted that the entire absorbance spectrum of the gold nanoparticle solution was altered by the addition of APTES and that it was not just its maximum that shifted. This was further clarified using a dynamic light scattering technique, as described below, where the aggregation was observed upon the addition of APTES to AuNps.
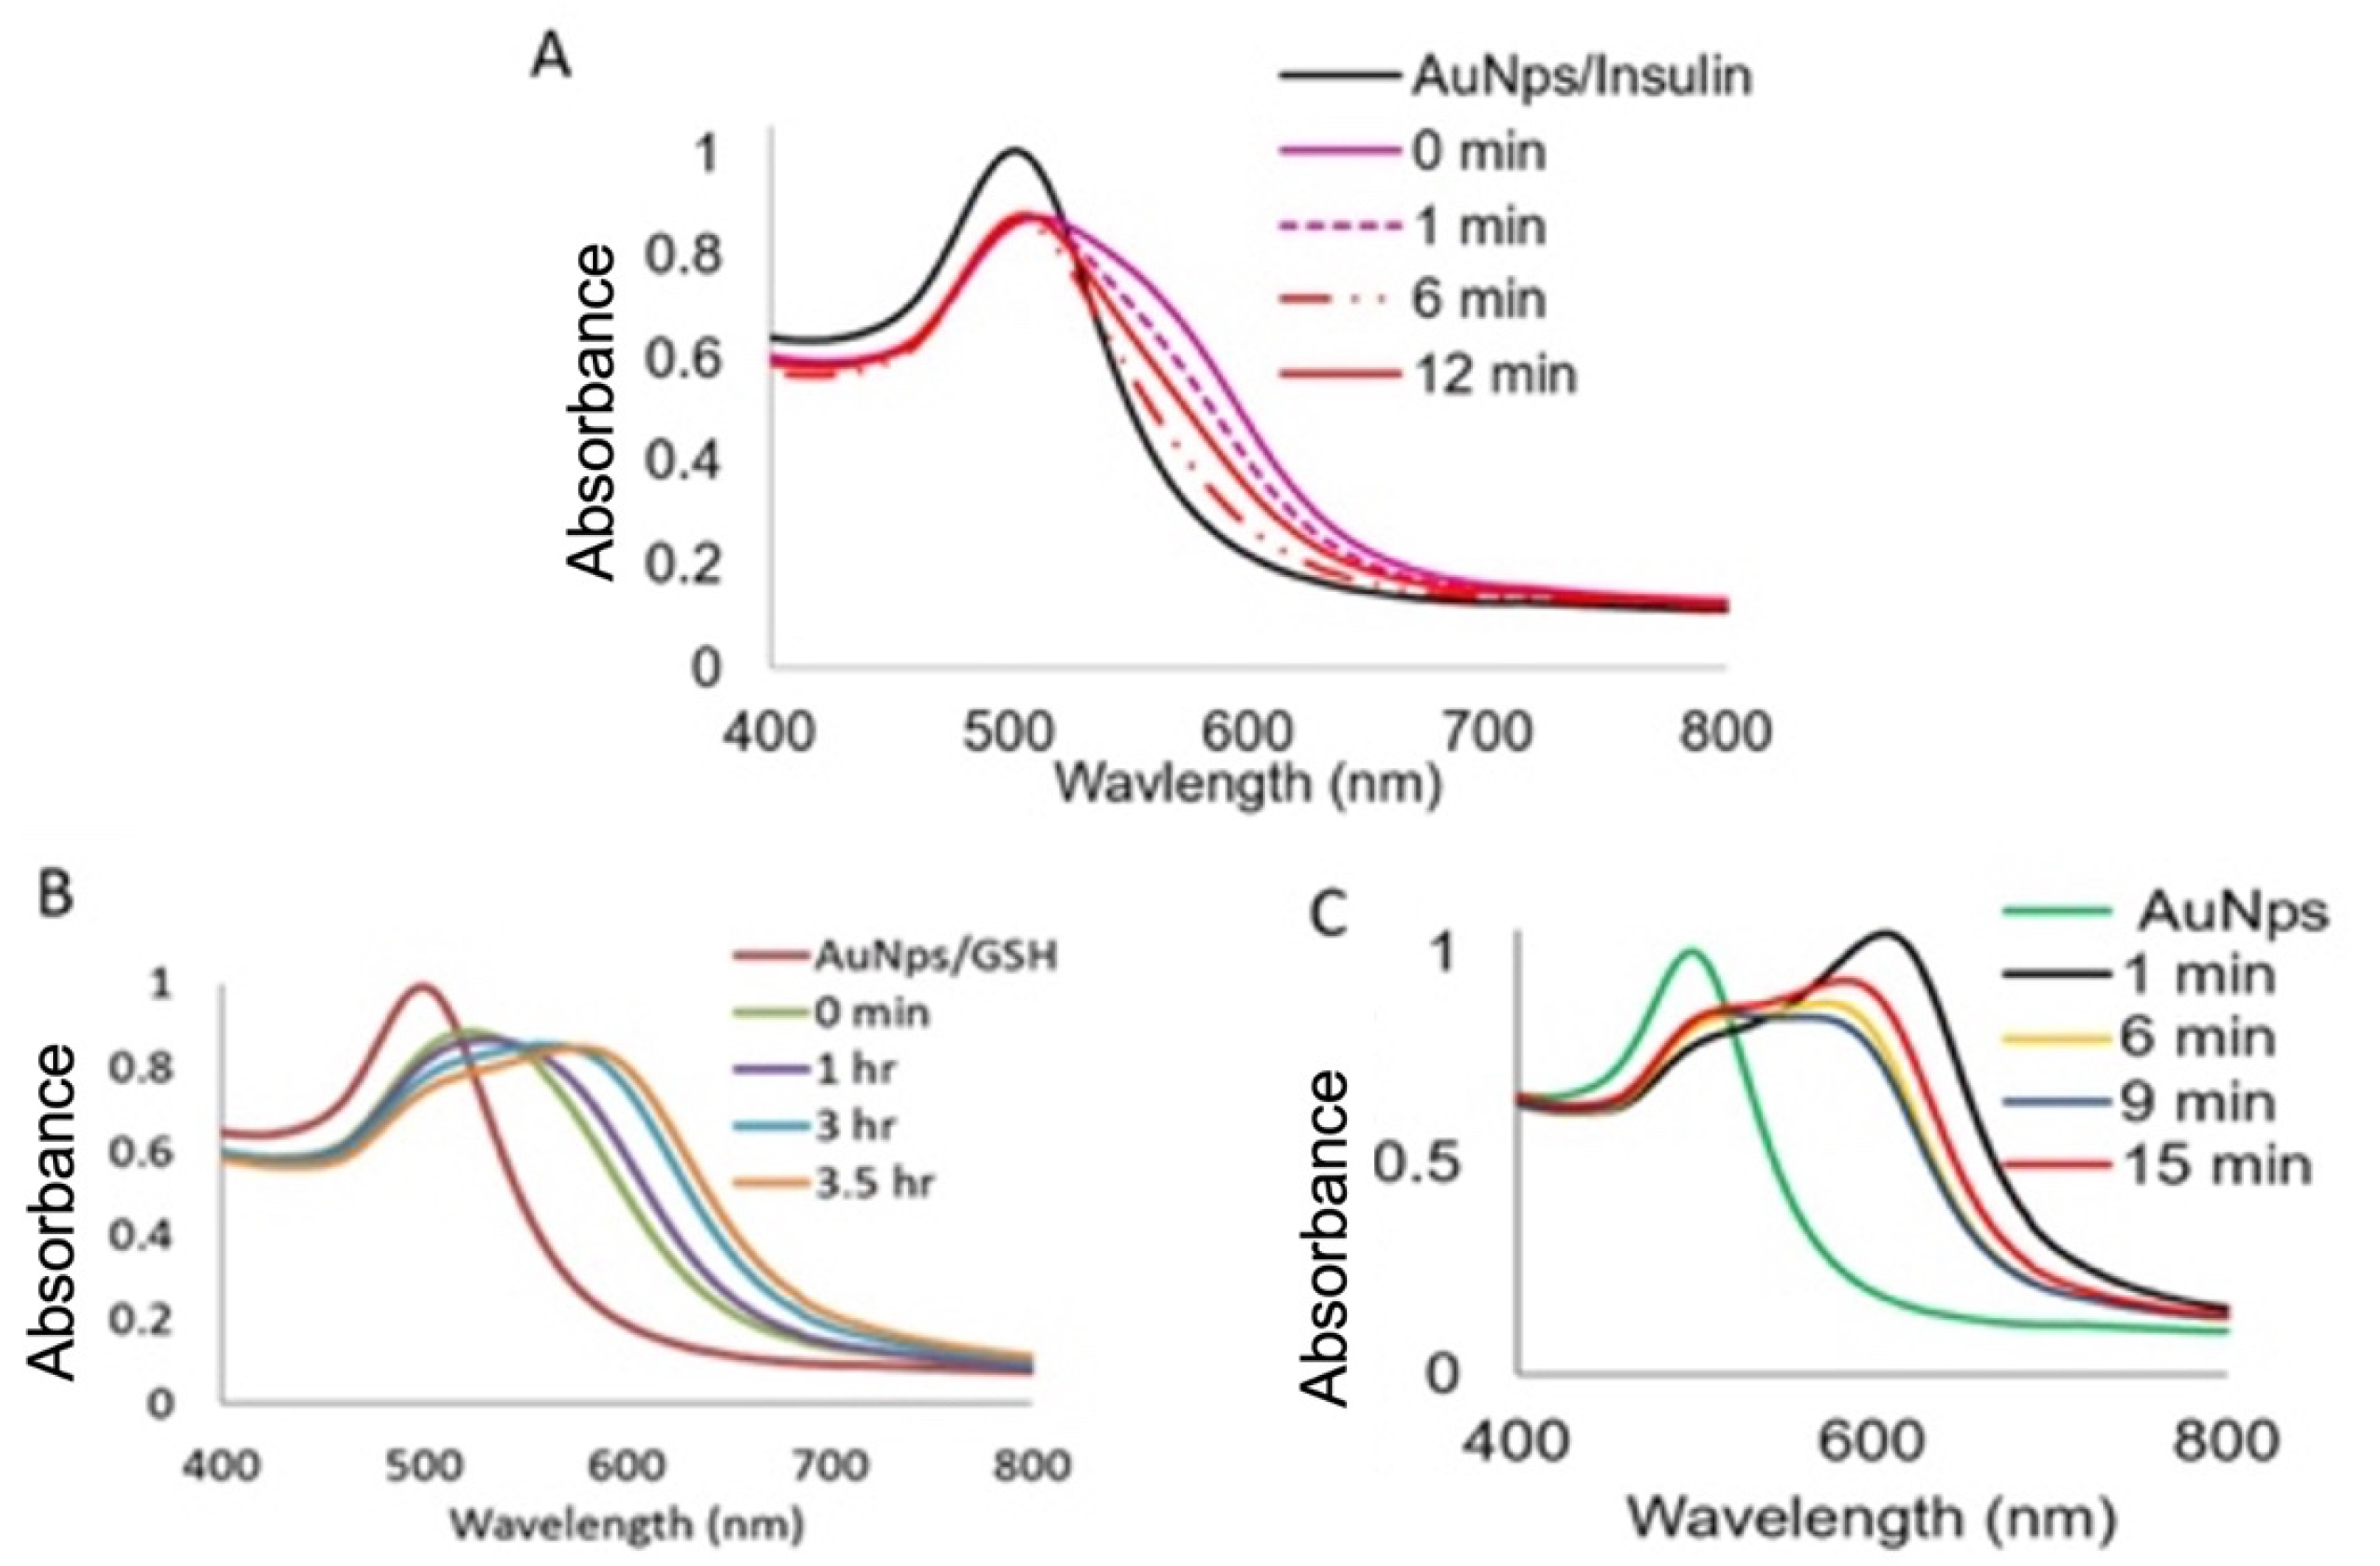
To further characterize and quantify the extent of aggregation that was observed after the addition of APTES to AuNps, a dynamic light scattering techniques was applied. In Figure 5E, it is shown that the aggregate size distributions increased with the addition of APTES, which supports the results observed in the TEM images. APTES caused the AuNps to aggregate as a function of the concentration present in the solution. These results also support the mass red shifting in the absorbance measurements seen within the UV–VIS spectra, as shown in Figure 6A–C, in which a systematic red shift is observed as the aggregation increased with either the time or the environment for three different proteins [69,70]. This paper shows that there were observable and significant changes in the ultraviolet visible spectra as the biological molecule was heat stressed and thereby aggregated. This can be again viewed in the absorbance spectra of the insulin, ferritin, and glutathione accelerated heat stressed studies, as displayed in Figure 6A–C. In addition, for nanomaterials bought or made with target applications in sensing, it is essential to determine if the conditions of the testing environment will conserve the original characteristics of the nanoparticles. This work is applicable to all individuals working with aminosilanes and other chemicals utilized in the substrate coupling processes. Although several sensitive surface plasmon polariton-based sensors with a simple structure have been proposed [87,88], the current method serves as a powerful proof-of-concept for fast in-solution detection for heat-stressed or denatured proteins or peptides.

4. Conclusions

When administering proteins to a patient, the presence of denatured proteins within a therapeutic drug product can induce a series of adverse effects, ranging from mild irritation, immunogenicity, anaphylaxis, to instant death. The current research is further focused on using plasmonic nanoparticles to create a potential platform for visual biosensing of denatured proteins that is fast, low cost, sensitive, and user friendly. In this study, artificially heat stressed ferritin, glutathione, and insulin coupled to AuNps are exposed to APTES. The proteins or peptides exhibit a systematic blue or red shift upon denaturation in the ultraviolet–visible absorbance spectra of the AuNps /biomolecule and aminosilane solution. These shifts in absorbance translate visually into a detectable transition. This paper serves as a proof of concept for fast in-solution detection methods for proteins or peptides that have experienced heat stress. In addition, instrumentation that is cheap and readily available, such as the ultraviolet visible spectrophotometer, is not currently able to distinguish between native and non-native proteins that have been aggregated.

Author Contributions

Funding acquisition by A.P.; M.F. conceived and conducted the experiments. A.P. supervised and guided the research. All authors have read and agreed to the published version of the manuscript.

Funding

This work was supported by the National Science Foundation Centers of Research Excellence in Science and Technology (NSF-CREST), Grant Number HRD 1036494 and 1547771. All of the funded projects were managed by the Project Director, A.P.

Acknowledgments

We thank Gugu Rutherford, Erin A. Jenrette, and Jasmin A. Flowers for their experimental help.

Conflicts of Interest

The authors declare no conflict of interest.

References

  1. Zhao, J.; Zhang, X.; Yonzon, C.R.; Haes, A.J.; Van Duyne, R.P. Localized surface plasmon resonance biosensors. Nanomedicine 2006, 1, 219–228. [Google Scholar] [CrossRef]
  2. Link, S.; El-Sayed, M.A. Size and Temperature Dependence of the Plasmon Absorption of Colloidal Gold Nanoparticles. J. Phys. Chem. B 1999, 103, 4212. [Google Scholar] [CrossRef]
  3. Kim, Y.; Johnson, R.C.; Hupp, J.T. Gold Nanoparticle-Based Sensing of ‘Spectroscopically Silent’ Heavy Metal Ions. Nano Lett. 2001, 1, 165. [Google Scholar] [CrossRef]
  4. Huanga, X.; El-Sayeda, M.A. Gold nanoparticles: Optical properties and implementations in cancer diagnosis and photothermal therapy. J. Adv. Res. 2010, 1, 13. [Google Scholar] [CrossRef] [Green Version]
  5. Nik, B.; El Sayed, A. Preparation and Growth Mechanism of Gold Nanorods (NRs) Using Seed—Mediated Growth Method. Chem. Mater. 2003, 16, 1957. [Google Scholar]
  6. Kozek, K.; Kozek, K.M.; Wu, W.-C.; Mishra, S.R.; Tracy, J.B. Large-Scale Synthesis of Gold Nanorods through Continuous Secondary Growth. Chem. Mater. 2013, 25, 4537. [Google Scholar] [CrossRef] [Green Version]
  7. Vigderman, L.; Khanal, B.P.; Zubarev, E.R. Functional Gold Nanorods: Synthesis, Self-Assembly, and Sensing Applications. Adv. Mater. 2012, 24, 4811. [Google Scholar] [CrossRef]
  8. Sato, K.; Hosokawa, K.; Maeda, M. Rapid aggregation of gold nanoparticles induced by non-cross-linking DNA hybridization. J. Am. Chem. Soc. 2003, 125, 8102. [Google Scholar] [CrossRef]
  9. Elghanian, R.; Storhoff, J.J.; Mucic, R.C.; Letsinger, R.L.; Mirkin, C.A. Selective Colorimetric Detection of Polynucleotides Based on the Distance-Dependent Optical Properties of Gold Nanoparticles. Science 1997, 277, 1078. [Google Scholar] [CrossRef] [Green Version]
  10. Ai, K.; Liu, Y.; Lu, L. Hydrogen-Bonding Recognition-Induced Color Change of Gold Nanoparticles for Visual Detection of Melamine in Raw Milk and Infant Formula. J. Am. Chem. Soc. 2009, 131, 9496. [Google Scholar]
  11. Liu, J.; Lu, Y. Accelerated color change of gold nanoparticles assembled by DNAzymes for simple and fast colorimetric Pb2+ detection. J. Am. Chem. Soc. 2004, 126, 12298. [Google Scholar] [CrossRef]
  12. Kim, N.; Rosenzweig, Z. Development of an Aggregation-Based Immunoassay for Anti-Protein a Using Gold Nanoparticles. Anal. Chem. 2002, 74, 1624–1628. [Google Scholar]
  13. Kumar, C. (Ed.) UV-VIS and Photoluminescence Spectroscopy for Nanomaterials Characterization; Springer: Amsterdam, The Netherlands, 2013. [Google Scholar]
  14. Gorog, S. Ultraviolet-Visible Spectrophotometry in Pharmaceutical Analysis; Taylor & Francis: Abingdon, UK, 1995. [Google Scholar]
  15. Clark, B.J.; Frost, T. UV Spectroscopy: Techniques, Instrumentation and Data Handling; Springer Science & Business Media: Berlin/Heidelberg, Germany, 1993. [Google Scholar]
  16. Goldstein, A.; Soroka, Y.; Frušić-Zlotkin, M.; Popov, I.; Kohen, R. High resolution SEM imaging of gold nanoparticles in cells and tissues. J. Microsc. 2014, 256, 237. [Google Scholar] [CrossRef]
  17. Peckys, D.B.; de Jonge, N. Gold Nanoparticle Uptake in Whole Cells in Liquid Examined by Environmental Scanning Electron Microscopy. Microsc. Microanal. 2014, 20, 189. [Google Scholar] [CrossRef]
  18. Lashkova, N.A.; Permiakov, N.V.; Maximov, A.I.; Spivak, Y.M.; Moshnikov, V.A. Local analysis of semiconductor nanoobjects by scanning tunneling atomic force microscopy. J. Phys. Math. 2015, 1, 15. [Google Scholar] [CrossRef] [Green Version]
  19. Hatch, J.E. Aluminum: Properties and Physical Metallurgy; ASM International: Almere, The Netherlands, 1984. [Google Scholar]
  20. Goodhew, P.J.; Humphreys, J.; Beanland, R. Electron Microscopy and Analysis, 2nd ed.; CRC Press: Boca Raton, FL, USA, 2000. [Google Scholar]
  21. Podzimek, S. Light Scattering, Size Exclusion Chromatography and Asymmetric Flow Field Flow Fractionation: Powerful Tools for the Characterization of Polymers, Proteins and Nanoparticles; John Wiley & Sons: Hoboken, NJ, USA, 2011. [Google Scholar]
  22. Gardiner, D.J. Practical Raman Spectroscopy; Springer: Berlin/Heidelberg, Germany, 1989; ISBN 978-0-387-50254-0. [Google Scholar]
  23. Available online: https://www.hamamatsu.com/jp/en/technology/lifephotonics/environment/SuperiorDetectionOfDiverseChemicals/index.html (accessed on 19 October 2022).
  24. Borini, S.; White, R.; Wei, D.; Astley, M.; Haque, S.; Spigone, E.; Harris, N.; Kivioja, J.; Ryhänen, T. Ultrafast Graphene Oxide Humidity Sensors. ACS Nano 2013, 7, 11166. [Google Scholar] [CrossRef]
  25. Segev-Bar, M.; Haick, H. Flexible Sensors Based on Nanoparticles. ACS Nano 2013, 7, 8366. [Google Scholar] [CrossRef]
  26. Gruber, K.; Horlacher, T.; Castelli, R.; Mader, A.; Seeberger, P.H.; Hermann, B.A. Cantilever array sensors detect specific carbohydrate-protein interactions with picomolar sensitivity. ACS Nano 2011, 5, 3670. [Google Scholar] [CrossRef]
  27. Hongliang, T.; Liu, B.; Chen, Y. Lanthanide Coordination Polymer Nanoparticles for Sensing of Mercury (II) by Photoinduced Electron Transfer. ACS Nano 2012, 6, 10505. [Google Scholar]
  28. Seed, B. Silanizing Glassware. In Current Protocols in Cell Biology; John Wiley and Sons, Inc.: Hoboken, NJ, USA, 2001. [Google Scholar]
  29. Liu, Y.; Li, Y.; Li, X.M.; He, T. Kinetics of (3-aminopropyl)triethoxylsilane (aptes) silanization of superparamagnetic iron oxide nanoparticles. Langmuir 2013, 29, 15275. [Google Scholar] [CrossRef]
  30. Opatkiewicz, J.P.; Lemieux, M.C.; Bao, Z. Influence of Electrostatic Interactions on Spin—Assembled Single—Walled Carbon Nanotube Networks on Amine-Functionalized Surfaces. ACS Nano 2010, 4, 1167. [Google Scholar] [CrossRef]
  31. Sun, X.; Wei, W. Electrostatic-assembly-driven formation of micrometer-scale supramolecular sheets of (3-aminopropyl)triethoxysilane(APTES)-HAuCl4 and their subsequent transformation into stable APTES bilayer-capped gold nanoparticles through a thermal process. Langmuir 2010, 26, 6133. [Google Scholar] [CrossRef]
  32. Klug, J.; Pérez, L.A.; Coronado, E.A.; Lacconi, G.I. Chemical and electrochemical oxidation of silicon surfaces functionalized with APTES: The role of surface roughness in the AuNPs anchoring kinetics. J. Phys. Chem. C 2013, 117, 11317. [Google Scholar] [CrossRef]
  33. Sedighi, A.; Li, P.; Pekcevik, I.C.; Gates, B.D. A Proposed Mechanism of the influence of Gold Nanoparticles on DNA Hybridization. ACS Nano 2014, 8, 6765. [Google Scholar] [CrossRef]
  34. Peretz-Soroka, H.; Pevzner, A.; Davidi, G.; Naddaka, V.; Tirosh, R.; Flaxer, E.; Patolsky, F. Optically-gated self-calibrating nanosensors: Monitoring pH and metabolic activity of living cells. Nano Lett. 2013, 13, 3157. [Google Scholar] [CrossRef]
  35. Grabar, K.C.; Freeman, R.G.; Hommer, M.B.; Natan, M.J. Preparation and Characterization of Au Colloid Monolayers. Anal. Chem. 1995, 67, 735. [Google Scholar] [CrossRef]
  36. Zhao, X.M.; Wilbur, J.L.; Whitesides, G.M. Using two-stage chemical amplification to determine the density of defects in self-assembled monolayers of alkanethiolates on gold. Langmuir 1996, 12, 3257. [Google Scholar] [CrossRef]
  37. Sam, F.L.M.; Razali, M.A.; Jayawardena, K.I.; Mills, C.A.; Rozanski, L.J.; Beliatis, M.J.; Silva, S.R.P. Silver grid transparent conducting electrodes for organic light emitting diodes. Org. Electron. 2014, 15, 3492. [Google Scholar] [CrossRef] [Green Version]
  38. Yong Yanga, B.; Matsubaraa, S.; Nogamia, M.; Shib, J. Controlling the aggregation behavior of gold nanoparticles. Mater. Sci. Eng. B 2006, 140, 172. [Google Scholar] [CrossRef]
  39. Du, S.; Kendall, K.; Toloueinia, P.; Mehrabadi, Y.; Gupta, G.; Newton, J. Aggregation and adhesion of gold nanoparticles in phosphate buffered saline. J. Nanoparticle Res. 2012, 14, 758. [Google Scholar] [CrossRef]
  40. Sarkar, A.; Daniels-Race, T. Electrophoretic Deposition of Carbon Nanotubes on 3-Amino-Propyl-Triethoxysilane (APTES) Surface Functionalized Silicon Substrates. Nanomaterials 2013, 3, 272. [Google Scholar] [CrossRef] [Green Version]
  41. Liao, J.; Zhang, Y.; Yu, W.; Xu, L.; Ge, C.; Liu, J.; Gu, N. Linear aggregation of gold nanoparticles in ethanol a National Laboratory of Molecular and Biomolecular Electronics. Colloids Surf. A Physicochem. 2003, 223, 177. [Google Scholar] [CrossRef]
  42. Hu, H.; Duan, H.; Yang, J.K.W.; Shen, Z.X. Plasmon-modulated photoluminescence of individual gold nanostructures. ACS Nano 2012, 6, 10147. [Google Scholar] [CrossRef] [PubMed]
  43. Wu, X.; Ming, T.; Wang, X.; Wang, P.; Wang, J.; Chen, J. High-photoluminescence-yield gold nanocubes: For cell imaging and photothermal therapy. ACS Nano 2010, 4, 113. [Google Scholar] [CrossRef] [PubMed]
  44. Bhanu, U.; Islam, M.R.; Tetard, L.; Khondaker, S.I. Photoluminescence quenching in gold—MoS2 hybrid nanoflakes. Sci. Rep. 2014, 4, 5575. [Google Scholar] [CrossRef] [PubMed] [Green Version]
  45. Lumdee, C.; Yun, B.; Kik, P.G. Gap-Plasmon Enhanced Gold Nanoparticle Photoluminescence. ACS Photonics 2014, 1, 1224. [Google Scholar] [CrossRef]
  46. Amran, T.S.T.; Hashim, R.; Al-Obaidi, N.K.A.; Yazid, H.; Adnan, R. Optical absorption and photoluminescence studies of gold nanoparticles deposited on porous silicon. Nanoscale Res. Lett. 2013, 8, 35. [Google Scholar] [CrossRef] [Green Version]
  47. Biagioni, P.; Brida, D.; Huang, J.-S.; Kern, J.; Duò, L.; Hecht, B.; Finazzi, M.; Cerullo, G. Dynamics of four-photon photoluminescence in gold nanoantennas. Nano Lett. 2012, 12, 2941. [Google Scholar] [CrossRef] [Green Version]
  48. Liao, H.; Wen, W.; Wong, G.K. Photoluminescence from Au nanoparticles embedded in Au:oxide composite films. J. Opt. Soc. Am. B 2006, 23, 2518. [Google Scholar] [CrossRef]
  49. Liu, J.; Lu, Y. Preparation of aptamer-linked gold nanoparticle purple aggregates for colorimetric sensing of analytes. Nat. Protoc. 2006, 1, 246. [Google Scholar] [CrossRef]
  50. Liu, X.; Wang, Y.; Chen, P.; Wang, Y.; Zhang, J.; Aili, D.; Liedberg, B. Biofunctionalized gold nanoparticles for colorimetric sensing of botulinum neurotoxin A light chain. Anal. Chem. 2014, 86, 2345. [Google Scholar] [CrossRef] [PubMed]
  51. Jongjinakool, S.; Palasak, K.; Bousod, N.; Teepoo, S. Gold Nanoparticles-based Colorimetric Sensor for Cysteine Detection. Energy Procedia 2014, 56, 10–18. [Google Scholar] [CrossRef] [Green Version]
  52. Ghosh, S.K.; Pal, T. Interparticle Coupling Effect on the Surface Plasmon Resonance of Gold Nanoparticles: From Theory to Applications. Chem. Rev. 2007, 107, 4797. [Google Scholar] [CrossRef] [PubMed]
  53. Dominguez-Medina, S.; McDonough, S.; Swanglap, P.; Landes, C.F.; Link, S. In situ measurement of bovine serum albumin interaction with gold nanospheres. Langmuir 2012, 28, 9131. [Google Scholar] [CrossRef] [PubMed]
  54. Dominguez-Medina, S.; Blankenburg, J.; Olson, J.; Landes, C.F.; Link, S. Adsorption of a protein monolayer via hydrophobic interactions prevents nanoparticle aggregation under harsh environmental conditions. ACS Sustain. Chem. Eng. 2013, 1, 833. [Google Scholar] [CrossRef] [PubMed] [Green Version]
  55. De Paoli Lacerda, S.H.; Park, J.J.; Meuse, C.; Pristinski, D.; Becker, M.L.; Karim, A.; Douglas, J.F. Interaction of gold nanoparticles with common human blood proteins. ACS Nano 2010, 4, 365. [Google Scholar] [CrossRef]
  56. Casals, E.; Pfaller, T.; Duschl, A.; Oostingh, G.J.; Puntes, V. Time evolution of the nanoparticle protein corona. ACS Nano 2010, 4, 3623. [Google Scholar] [CrossRef]
  57. Brewer, S.H.; Glomm, W.R.; Johnson, M.C.; Knag, M.K.; Franzen, S. Probing BSA binding to citrate-coated gold nanoparticles and surfaces. Langmuir 2005, 21, 9303. [Google Scholar] [CrossRef]
  58. Cañaveras, F.; Madueño, R.; Sevilla, J.M.; Blázquez, M.; Pineda, T. Role of the functionalization of the gold nanoparticle surface on the formation of bioconjugates with human serum albumin. J. Phys. Chem. C 2012, 116, 10430. [Google Scholar] [CrossRef]
  59. Jans, H.; Liu, X.; Austin, L.; Maes, G.; Huo, Q. Dynamic light scattering as a powerful tool for gold nanoparticle bioconjugation and biomolecular binding studies. Anal. Chem. 2009, 81, 9425. [Google Scholar] [CrossRef]
  60. Zhu, J.; Sun, Z.; Li, J.; Zhao, J. Bovine Serum Albumins (BSA) Induced Aggregation and Separation of Gold Colloid Nanoparticles. J. Nanosci. Nanotechnol. 2012, 12, 2206. [Google Scholar] [CrossRef] [PubMed]
  61. Prodan, E.; Radlodd, C.; Halas, N.; Nordlander, P. A Hybridization Model for the Plasmon Response of Complex Nanostructures. Science 2003, 302, 419. [Google Scholar] [CrossRef]
  62. Farrell, M.; Rutherford, G.; Pradhan, A. Characterization of the Effects of 3-Aminopropyl Triethoxysilane on Stability, Optical Properties and Morphology of Colloidal Gold Nanoparticles. Curr. Phys. Chem. 2016, 6, 145–151. [Google Scholar] [CrossRef]
  63. Farrell, M.; Hawley, W.; Reaume, R.; Gurrola, A.; Pradhan, A.K. Visual in Solution Detection of Denatured Insulin Coupled to Gold Nanoparticles in the Presence of an Aminosilane. J. Electrochem. Soc. 2016, 164, B3008–B3012. [Google Scholar] [CrossRef]
  64. Lumelsky, N.; Blondel, O.; Laeng, P.; Velasco, I.; Ravin, R.; McKay, R. Differentiation of embryonic stem cells to insulin-secreting structures similar to pancreatic islets. Science 2001, 292, 1389. [Google Scholar] [CrossRef] [PubMed] [Green Version]
  65. Tsai, A. The rising cost of insulin: Why the price of this lifesaving drug is reaching new heights. Diabetes Forecast. March 2016. Available online: http://www.diabetesforecast.org/2016/mar-apr/rising-costs-insulin.html (accessed on 10 May 2016).
  66. Rosas, P.C.; Nagaraja, G.M.; Kaur, P.; Panossian, A.; Wickman, G.; Garcia, L.R.; Al-Khamis, F.A.; Asea, A.A. Hsp72 (HSPA1A) prevents human islet amyloid polypeptide aggregation and toxicity: A new approach for type 2 diabetes treatment. PLoS ONE 2016, 11, e0149409. [Google Scholar]
  67. Hassiepen, U.; Federwisch, M.; Mülders, T.; Wollmer, A. The lifetime of insulin hexamers. Biophys. J. 1999, 77, 1638. [Google Scholar] [CrossRef] [Green Version]
  68. Blundell, T.L.; Cutfield, J.F.; Dodson, G.G.; Dodson, E.; Hodgkin, D.C.; Mercola, D. The structure and biology of insulin. Biochem. J. 1971, 125, 50. [Google Scholar] [CrossRef] [Green Version]
  69. Huus, K.; Havelund, S.; Olsen, H.B.; van de Weert, M.; Frokjaer, S. Thermal dissociation and unfolding of insulin. Biochemistry 2005, 44, 11171. [Google Scholar] [CrossRef]
  70. Giger, K.; Vanam, R.P.; Seyrek, E.; Dubin, P.L. Suppression of insulin aggregation by heparin. Biomacromolecules 2008, 9, 2338. [Google Scholar] [CrossRef] [Green Version]
  71. Shukla, R.; Bansal, V.; Chaudhary, M.; Basu, A.; Bhonde, R.; Sastry, M. Biocompatibility of Gold Nanoparticles and Their Endocytotic Fate Inside the Cellular Compartment: A Microscopic Overview. Langmuir 2005, 21, 10644–10654. [Google Scholar] [PubMed]
  72. Zhang, J.; Oyama, M. Gold Nanoparticle-Attached ITO as a Biocompatible Matrix for Myoglobin Immobilization: Direct Electrochemistry and Catalysis to Hydrogen Peroxide. J. Electroanal. Chem. 2005, 577, 273–279. [Google Scholar] [CrossRef]
  73. Gorin, D.; Portnov, S.; Inozemtseva, O.; Luklinska, Z.; Yashchenok, A.; Pavlov, A.; Skirtach, A.; Möhwald, H.; Sukhorukovc, G. Magnetic/Gold Nanoparticle Functionalized Biocompatible Microcapsules with Sensitivity to Laser Irradiation. Phys. Chem. Chem. Phys. 2008, 10, 6899–6905. [Google Scholar] [CrossRef] [PubMed] [Green Version]
  74. Farrell, M.; Reaume, R.; Pradhan, A.K. Visual Detection of Denatured Glutathione Peptides: A Facile Method to Visibly Detect Heat Stressed Biomolecules. Sci. Rep. 2017, 7, 2604–2611. [Google Scholar] [CrossRef] [Green Version]
  75. Connor, E.E.; Mwamuka, J.A.; Murphy, C.J.; Wyatt, M.D. Gold nanoparticles are taken up by human cells but do not cause acute cytotoxicity. Small 2005, 1, 325. [Google Scholar] [CrossRef]
  76. Zhang, X.; Servos, M.R.; Liu, J. Surface science of DNA adsorption onto citrate-capped gold nanoparticles. Langmuir 2012, 28, 3896. [Google Scholar] [CrossRef] [Green Version]
  77. Wang, S.; Chen, W.; Liu, A.L.; Hong, L.; Deng, H.H.; Lin, X.H. Comparison of the peroxidase-like activity of unmodified, amino-modified, and citrate-capped gold nanoparticles. ChemPhysChem 2012, 13, 1199. [Google Scholar] [CrossRef]
  78. Pham, T.; Jackson, J.B.; Halas, N.J.; Lee, T.R. Preparation and Characterization of Gold Nanoshells Coated withSelf-Assembled Monolayers. Langmuir 2002, 18, 4915–4920. [Google Scholar] [CrossRef]
  79. Farrokh Takin, E.; Ciofani, G.; Puleo, G.; Giuseppe, V.; Filippeschi, C.; Mazzolai, B.; Piazza, V.; Mattoli, V. BariumTitanate Core–Gold Shell Nanoparticles for Hyperthermia Treatments. Int. J. Nanomed. 2013, 8, 2319–2331. [Google Scholar]
  80. Chithrani, B.; Ghazani, A.; Chan, W. Determining the Size and Shape Dependence of Gold Nanoparticle Uptake into Mammalian Cells. ACS Nano 2010, 4, 3689–3696. [Google Scholar] [CrossRef]
  81. Eustisa, S.; El-Sayed, M. Why Gold Nanoparticles Are More Precious than Pretty Gold: Noble Metal Surface Plasmon Resonance and its Enhancement of the Radiative and Nonradiative Properties of Nanocrystals of Different Shapes. Chem. Soc. Rev. 2006, 35, 209–217. [Google Scholar] [CrossRef]
  82. Zhang, Y.; Orner, B.P. Self-Assembly in the Ferritin Nano-Cage Protein Superfamily. Int. J. Mol. Sci. 2011, 12, 5406–5421. [Google Scholar] [CrossRef] [PubMed] [Green Version]
  83. Hong, S.; Li, X. Optimal Size of Gold Nanoparticles for Surface-Enhanced Raman Spectroscopy under Different Conditions. J. Nanomater. 2013, 49, 1–8. [Google Scholar] [CrossRef]
  84. Liao, J.; Xu, L.; Ge, C. Self-assembly of length-tunable gold nanoparticle chains in organic solvents. Appl. Phys. A 2003, 76, 541. [Google Scholar] [CrossRef]
  85. Glick Bernard, R.; Pasternak Jack, J.; Patten Cheryl, L. Molecular Biotechnology: Principles and Applications of Recombinant DNA, 4th ed.; Wiley (USA), ASM Press American Society for Microbiology: Amsterdam, The Netherlands, 2010. [Google Scholar]
  86. Farrell, M.; Rutherford, G.; Pradhan, A. Visual Biosensing of Bovine Serum Albumin Using Induced Aggregation of Gold Nanoparticles via 3-Aminopropyl Triethoxysilane. J. Nanosci. Nanotechnol. 2016, 16, 7684–7688. [Google Scholar] [CrossRef]
  87. Hsieh, L.-Z.; Chau, Y.-F.C.; Lim, C.M.; Lin, M.-H.; Huang, H.J.; Lin, C.-T.; Syafi’Ie, I.M.N. Metal nano-particles sizing by thermal annealing for the enhancement of surface plasmon effects in thin-film solar cells application. Opt. Commun. 2016, 370, 85–90. [Google Scholar] [CrossRef]
  88. Chau, Y.F.C. Mid-infrared sensing properties of a plasmonic metal–insulator–metal waveguide with a single stub including defects. J. Phys. D Appl. Phys. 2020, 53, 115401. [Google Scholar] [CrossRef]
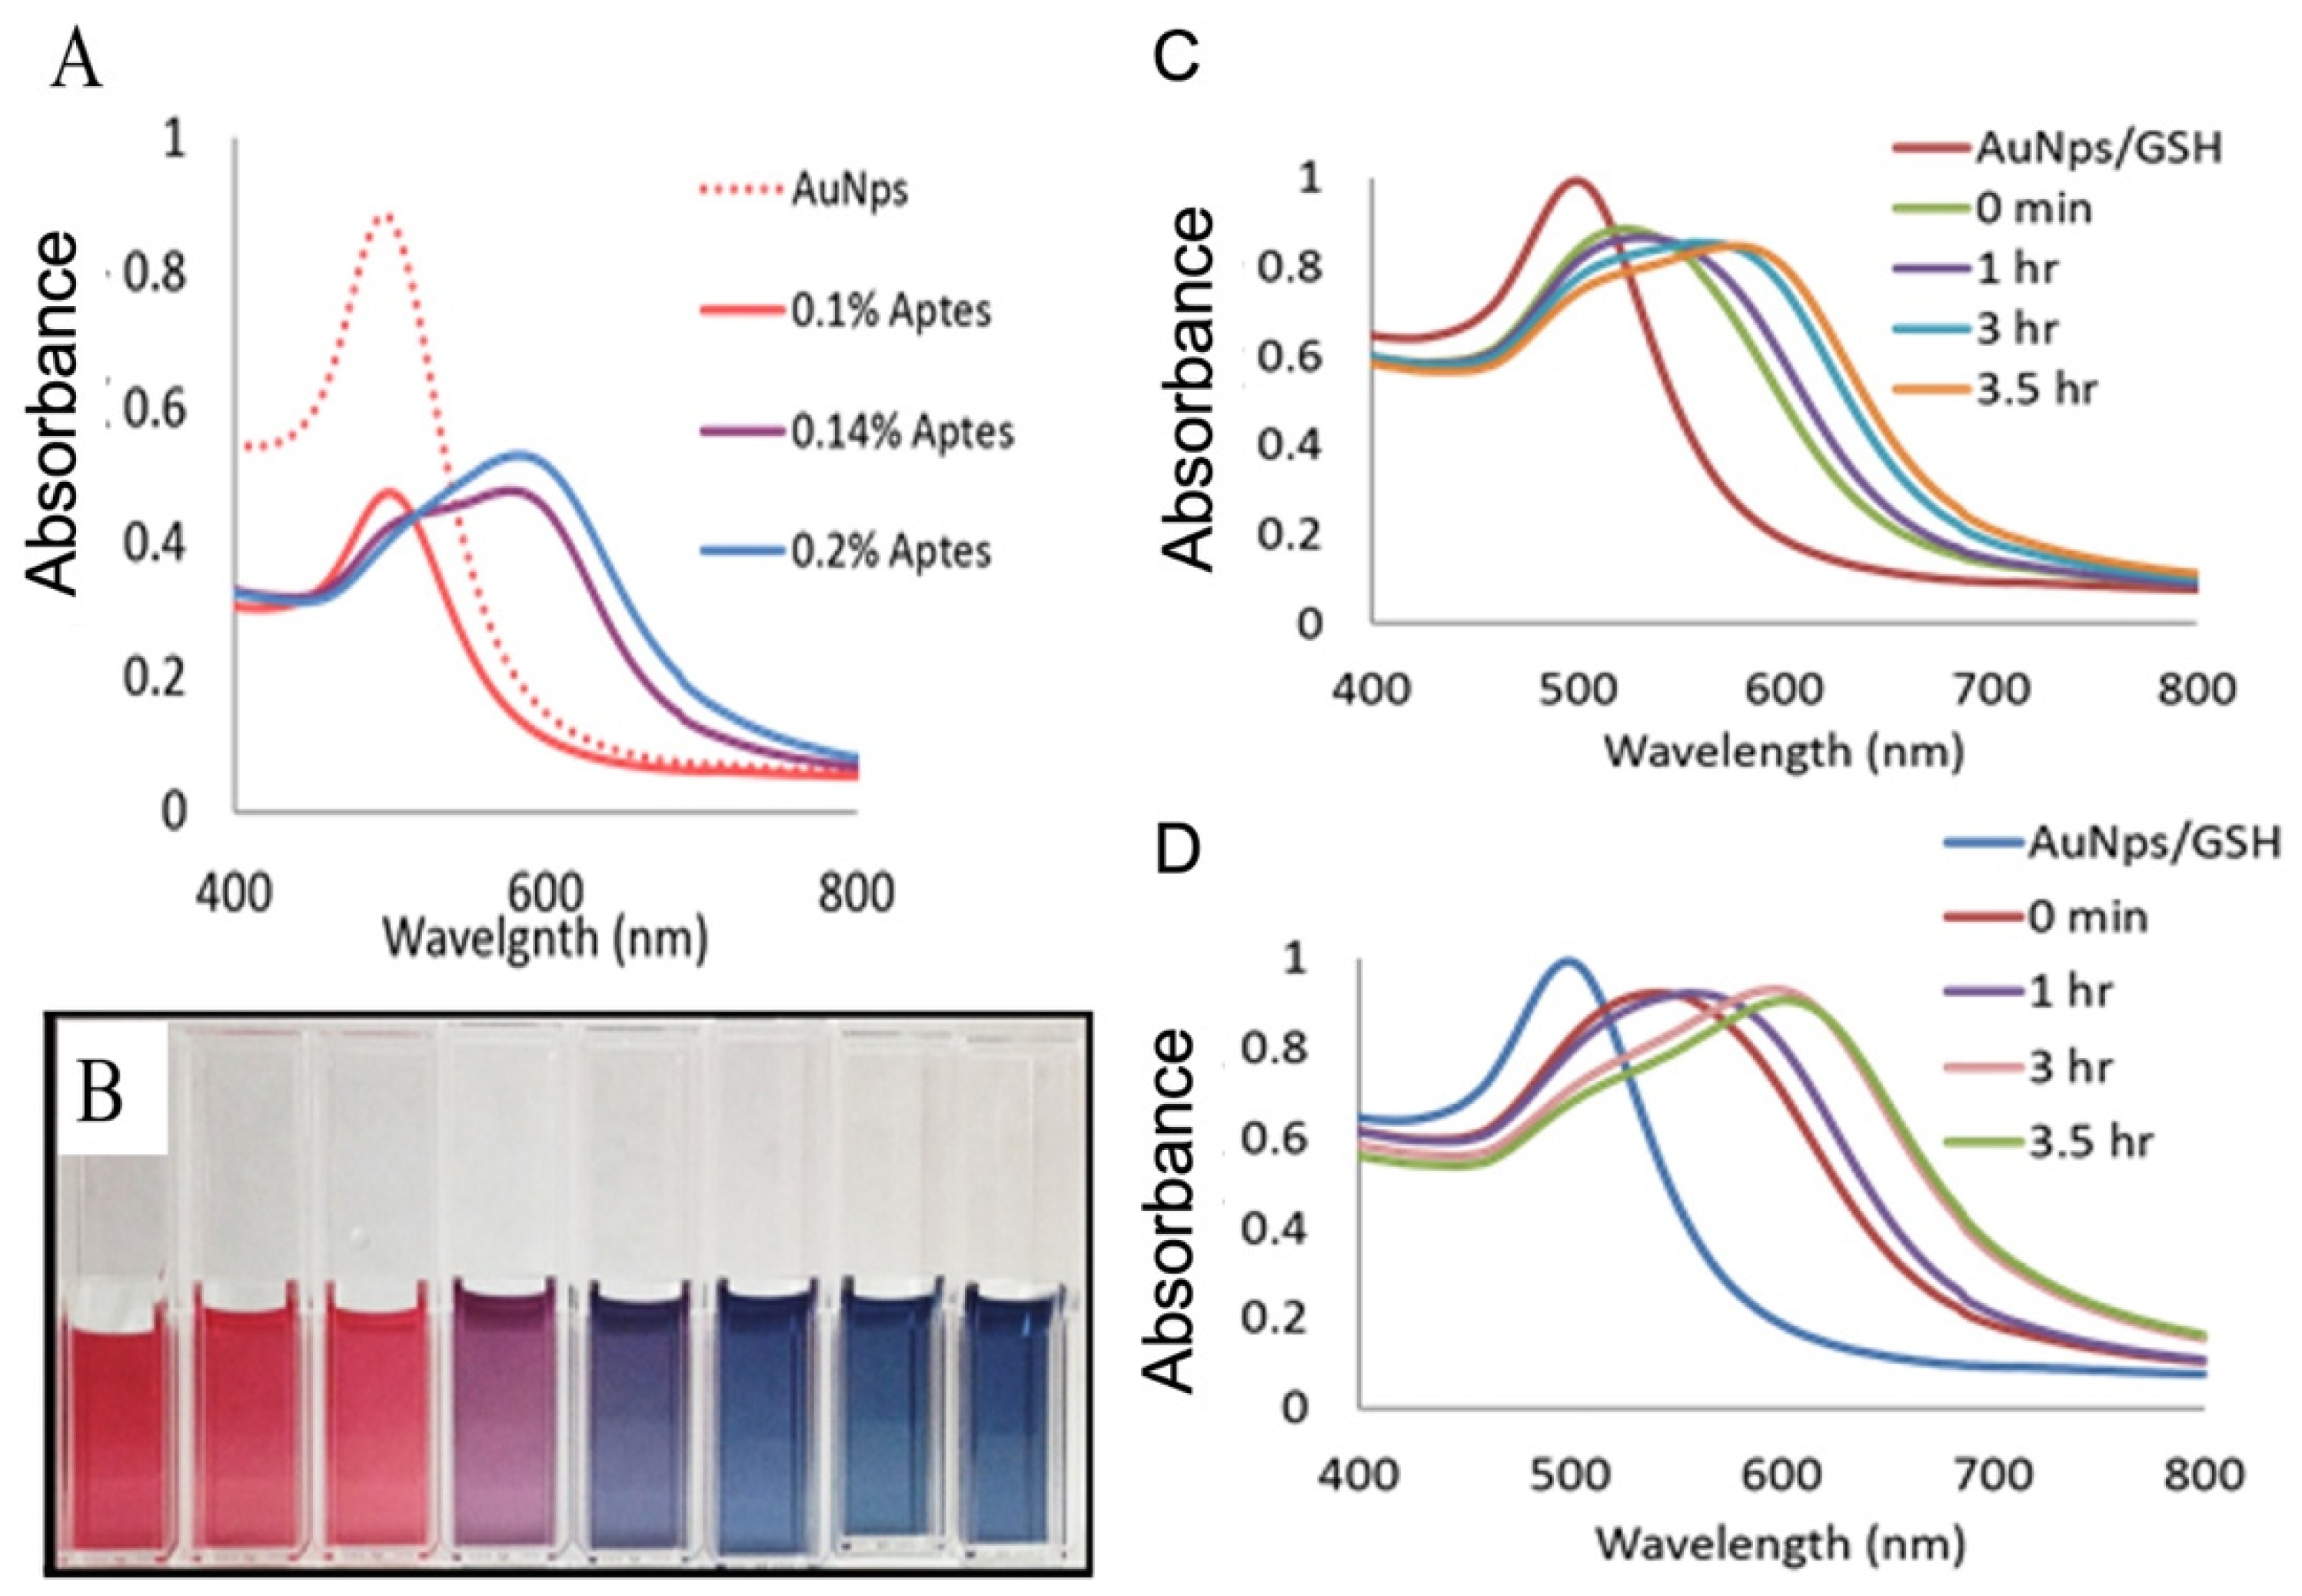
Figure 1. (A) The UV–VIS absorbance spectra for the AuNps and 3.07 mg/mL glutathione solutions in the presence of 0.1–0.2% APTES. (B) Resulting solution hues from left to right: AuNps, AuNps/GSH, 0.1%, 0.12%, 0.14%, 0.16%, 0.18%, and 0.2% (APTES). The resulting absorbance spectra of AuNps/GSH/APTES solutions over a 3.5-h GSH peptide denaturation, via a 70 °C accelerated heat stress study for (C) 0.14% APTES and (D) 0.16% APTES.
Micro 02 00043 g001
Figure 2. The UV–VIS absorbance spectra of AuNps and APTES systems in the presence of heat stressed ferritin ranging from 1 to 15-min exposure times (A) 5% APTES, (B) 1% APTES, (C) 0.5% APTES and (D) 0.2% APTES.
Micro 02 00043 g002
Figure 3. (A) The UV–VIS absorbance spectra of the ferritin and AuNp system exposed to APTES. (B) Plot of the changes in the absorbance max peak wavelength vs. APTES concentration (0.1–10% APTES). The changes in the ferritin structure during the accelerated heat stress study, progressing from the quaternary structure, to the secondary and ultimately primary structure. The proposed mechanism for the blue shift observed in the UV–VIS absorbance spectra of the ferritin, AuNps, and APTES solutions, as the ferritin is denatured.
Micro 02 00043 g003
Figure 4. The absorbance spectra of the AuNps, insulin, and APTES solutions: (A) 80 °C heat stress and 0.3% APTES, 6 min; (B) 70 °C heat stress and 0.2% APTES, 3 min; (C) 80 °C heat stress and 0.2% APTES, 1 min; and (D) 80 °C heat stress and 0.4% APTES, 12 min. (E,F) The solution hues of insulin, AuNps, and APTES. (E) Here, 80 °C and 0.3% APTES, 6 min, from left to right: AuNps, AuNps/Insulin, 0 min, 1 min, 3 min, 6 min, 12 min, and AuNps/APTES. (F) Here, 70 °C heat stress and 0.2% APTES, 3 min, from left to right: AuNps, AuNps/insulin, 0 min, 1 min, 3 min, 6 min, 9 min, and AuNps/APTES. (G,H) The solution hues of insulin, AuNps, and APTES. (G) Here, 80 °C heat stress and 0.2% APTES, 1 min, from left to right: AuNps, AuNps/insulin, 0 min, 1 min, 3 min, and negative control of AuNps/APTES. (H) Here, 80 °C heat stress and 0.4% APTES, 12 min detection, from left to right: AuNps, AuNps/Insulin, 0 min, 3 min, 9 min, 12 min, 15 min, and 18 min.
Micro 02 00043 g004
Figure 5. Transmission electron microscopy images of AuNps: (A) control 100 nm, (B) 47 mM APTES 100 nm, (C) 144 mM APTES 100 nm, and (D) 144 mM APTES 10 nm. (E) Size distributions of AuNps and aggregates within the control, 48 mM APTES, 144 mM APTES, and 480 mM APTES.
Micro 02 00043 g005
Figure 6. Ultraviolet–visible spectra of the gold nanoparticles and APTES solutions in the presence of a heat stressed biological molecules over the course of an accelerated heat stress study. (A) Insulin (B) glutathione, and (C) ferritin from horse spleen.
Micro 02 00043 g006
Publisher’s Note: MDPI stays neutral with regard to jurisdictional claims in published maps and institutional affiliations.