1. Introduction
Today, liquids are used to produce electricity from fresh water and sea water; this process is called osmo-energy, or pressure-retarded osmosis. A related temperature change is called thermo-osmose [
1,
2]. In solids, thermoelectric materials produce electrical energy when subjected to a temperature change; reciprocally, being the basis of numerous refrigeration devices, electricity produces a change in temperature (Seebeck effect). These examples highlight that energy conversion concerns both liquid and solid condensed matter and can be diverse.
In the same vein, we propose to explore and exploit the recently identified elastic properties of confined liquids. On this basis, we use a correlated property which is the capacity of elastic materials to convert mechanical energy in non-equilibrium thermal states under stress (thermo-elastic effect).
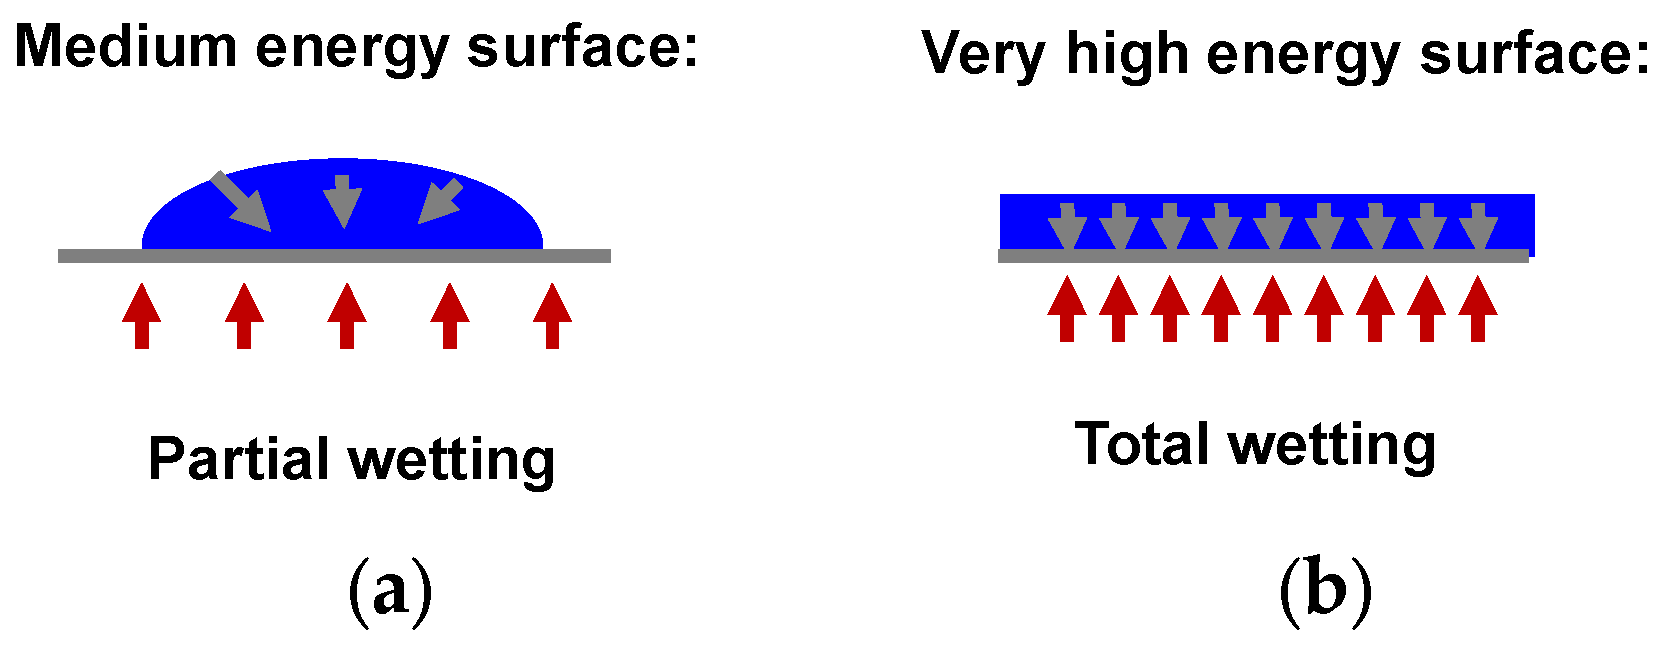
Long considered as a specific solid character, it is now known that mesoscopic fluids are endowed with shear elasticity. Experimentally, the measurement chain can be optimized using an excellent wetting of the fluid on the substrate (see
Section 2). This protocol produces an enhanced stress energy transfer to the fluid, highlighting an elastic response at the submillimeter scale in various liquids and fluids. At the mesoscopic scale, liquids are not viscous but exhibit a weak and finite static shear elasticity to a stress. The shear elastic property is identified by different authors, also using different techniques, from nanoscale to sub-millimeter scale [
3,
4,
5,
6,
7,
8,
9,
10,
11,
12,
13,
14,
15,
16,
17]. The nanoscale solid-like behavior is in particular identified over several orders of magnitude in frequency from THz to Hz frequencies, thus probing shear waves of different wavelengths [
3,
4,
6]. The decrease in the shear modulus by increasing the size of the probed liquid has been modeled as an
L−3 scaling law, where
L is the gap thickness [
18]. The scale dependence of the shear elasticity (and thus low-energy elasticity) is interpreted as a reminiscence of the high-energy THz shear waves. The mesoscopic liquid elasticity is explained by moving away from the Frenkel–Maxwell viscoelastic model, proposing instead a finite shear wave propagation (k-gap model), considering non-equilibrium steady states [
17,
18,
19], using wave packet propagation (dual model of the liquid) [
20], or considering non-extensive (scale-dependent) viscoelastic properties where “any finite volume of a liquid at rest is a solid with a small but finite static shear elasticity” [
21,
22]. Although the models adopt different views, there is a converging conclusion to act that small scale liquid shear elasticity exists over a wide frequency range. Citing the introduction of [
19] from K. Trachenko, the demonstration of the existence of low-scale liquid shear elasticity is the promise that we can start to understand liquids. Understanding liquids well allows us to foresee new effects like unexpected non-equilibrium thermal behaviors induced by a mechanical stress.
This manuscript introduces how the liquid’s solid-like properties can be identified at the mesoscale and how the shear elasticity evolves at a large strain amplitude. Then, it is shown that these inherent solid-like properties are not lost (“shear-melted”) upon shearing or under flow, but that a part of the mechanical energy is converted in non-equilibrium temperatures. Two configurations are examined:
The thermal response of the confined liquids to a large strain oscillatory shear stress, which is interpreted as a non-equilibrium thermal signature associated with non-linear elastic deformations;
The thermal response during liquid transport in a microchannel geometry, confirming the origin of the oscillatory thermal response and the obtaining of a continuous cooling or heating in microchannel flow.
Finally, the paper focusses on the emergence of non-equilibrium temperatures related to non-linear elastic mechanisms that occur in confined water or glycerol at large shear strain amplitude or in continuous microflows (microfluidic conditions). The present paper does not provide information on dissipative processes.
2. Experimental
The viscoelastic measurements were carried out following a “total” wetting protocol [
9,
10,
11,
12], where the liquid is set between two α-alumina surfaces (plate-plate disks of 40 mm of diameter). Due to surface charges, α-alumina increases the interaction energy at the fluid/surface boundary [
23] and therefore reinforces the shear stress transmission. Conventional metallic fixtures made generally of aluminum or stainless steel do not fulfill total wetting boundary conditions (
Scheme 1).
The α-alumina surfaces are regenerated by heating at 400 °C prior each measurement.
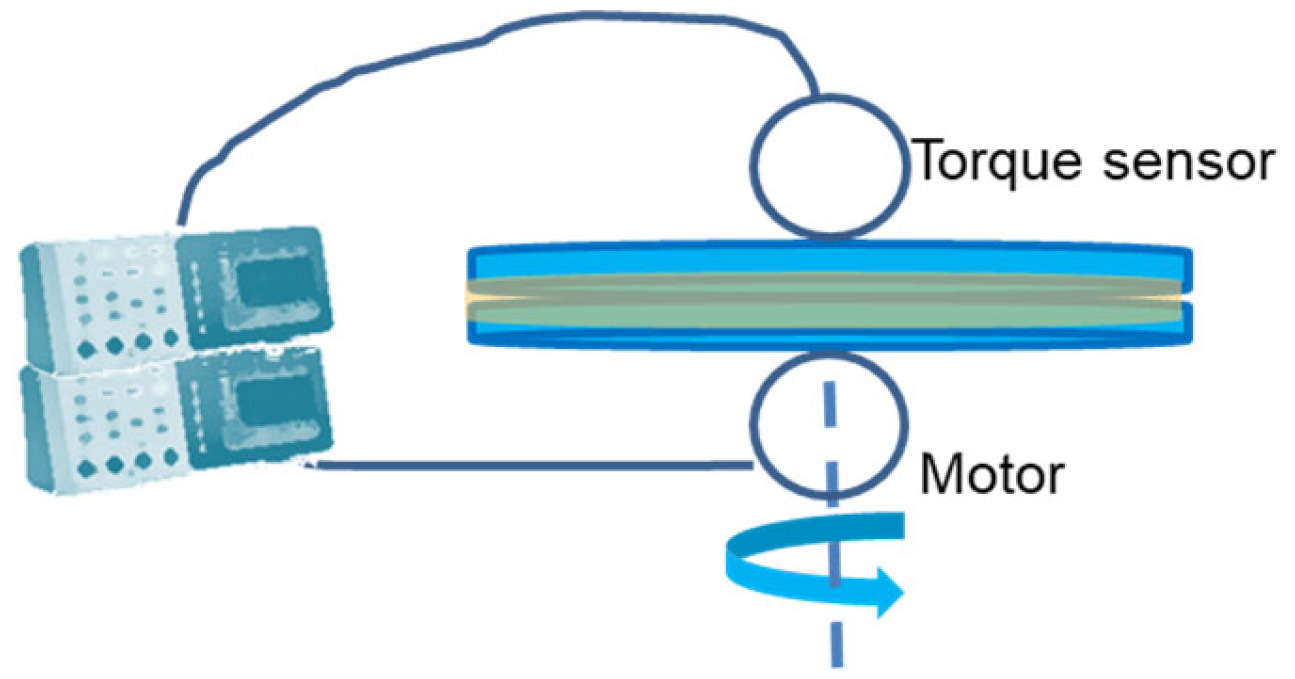
The liquid is placed in the gap of a rheometer (ARES2—TA-Instrument, New Castle, DE, USA). The shear stress is obtained by the axial sinusoidal oscillation of the bottom plate (connected to the motor) with respect to the upper immobile plate (connected to the stress sensor).
A 7-digit voltmeter (Keithley, Cleveland, OH, USA; rate: 300 data/s) measures the voltage of the motor imposing the oscillation (input wave associated with the strain amplitude), while another 7-digit voltmeter measures the voltage associated with the sensor (output wave associated with the torque). This setup (
Scheme 2) enables the simultaneous measurement of shear-strain and shear-stress waves in addition to the conventional treatment in terms of viscoelastic moduli:
σ(
ω) =
G0 ·
γ0 ·
sin(
ω.t + Δ
ϕ), where
σ(
ω) is the shear stress;
G0 is the shear modulus;
γ0 is the strain amplitude, defined as
γ =
δl/
e, where
δl is the displacement and e the gap thickness; and Δ
ϕ is the phase shift between the input and the output waves. This equation is expressed in terms of shear-elastic
G′ and viscous
G″ moduli:
σ(
ω) =
γ0 · (
G′(
ω) ·
sin(
ω.t) +
G″(
ω) ·
cos(
ω.t)), with
G′ being the in-phase component with the strain and
G″ being the out-of-phase component. The viscoelastic formalism is valid as long as the resulting stress wave reproduces the shape of the imposed deformation wave (sinusoidal). The analysis of the stress wave is therefore very instructive.
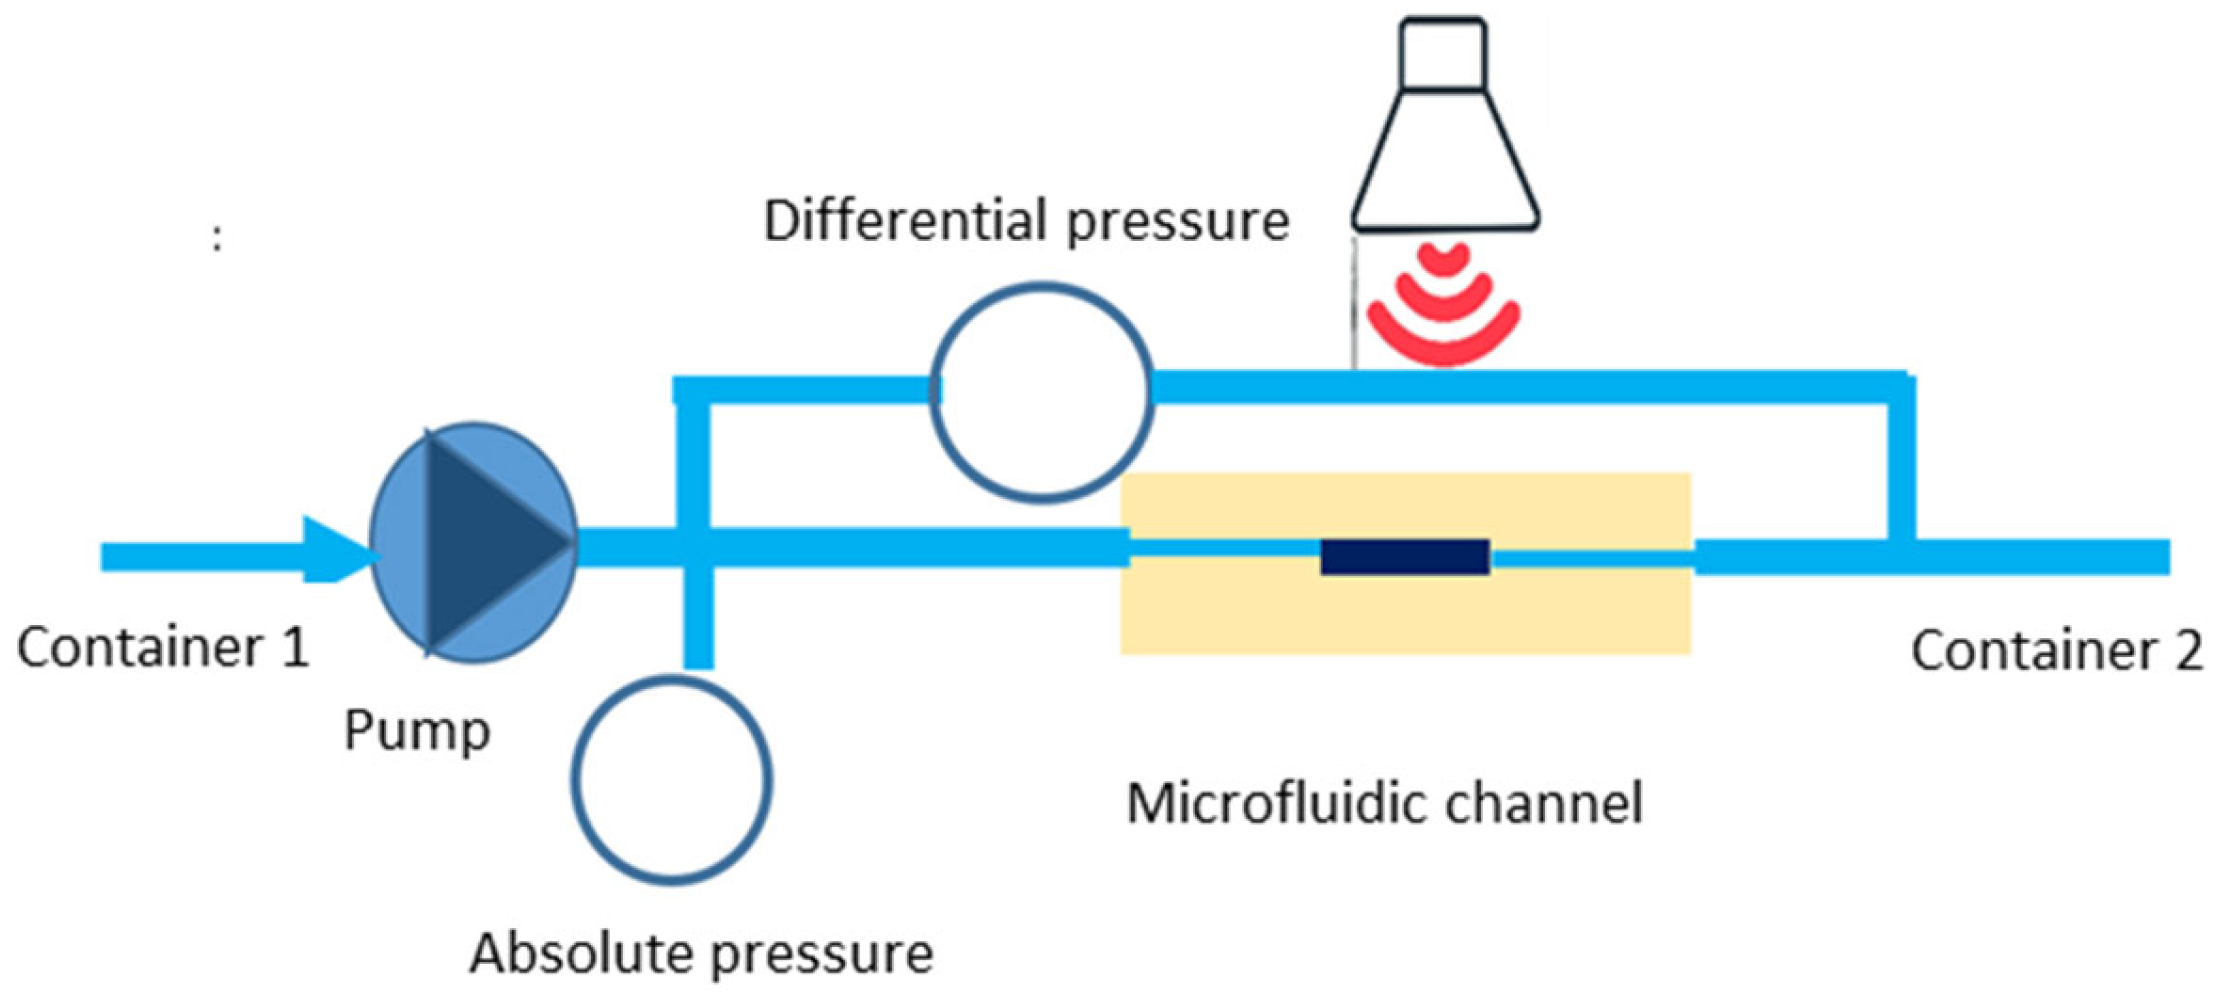
For the microchannel geometry, the liquid is pushed using a peristaltic micropump in an alumina cylinder of 0.5 mm inner diameter. The pressure is measured using Honeywell pressure sensors (an absolute gauge and a differential pressure sensor) (
Scheme 3). The pressure value is corrected from the cross-section differences between the channel carrying the liquid and the microchannel. The container is maintained by its extremities without contact with a support. In both cases, the measurements are carried out at room temperature, without an external heat source.
Microthermal imaging enables the capture of high spatial resolution thermal pictures in a wavelength range of 7–14 µm with an excellent temperature accuracy. The thermal emissivity is measured by radiation transfer using the Stefan–Boltzmann law: E = εm · σ · A · (T4 − T4c), where E is the radiated energy, εm is the emissivity coefficient, A is the radiating area, T is the temperature of the sample, Tc is the environment temperature, and σ is the Stefan constant. The emissivity measurements are carried out at room temperature.
This technique is used here at room temperature to record the emissivity during the transport of confined fluids with a microbolometer array of 382 × 288 pixels working at 27 Hz in the range of long-wave infrared bands (LWIR). LWIR bands are out of the range of visible light, which falls into the range of ~0.380 µm–0.740 µm. A microbolometric detector is embedded in a camera using a relay lens with a focal length of 7.5 mm and a numerical aperture F/1. The shear flow images were recorded using a homemade combination of 12 Germanium lenses [
24] and the microchannel images were recorded with a commercial wide-angle lens with a focal length of 10.5 mm and a thermal sensitivity of +/− 0.04 °C. The pixel pitch is 17 µm.
The infrared focal plane array is set on the liquid surface with the lenses placed away from the liquid gap in the shear geometry or from the liquid container for microchannel measurements ensuring non-contact measurements. The IR emissivity of liquid water is close to 1 (0.96) within a wavelength range of 7–14 µm. Therefore, the temperature variation is given without emissivity correction. The contribution of the microchannel wall is removed by subtraction of the image recorded while at rest, enabling the variation in the temperature to be seen with respect to the equilibrium situation. Images are treated using the software FIJI 2.17.0.
We use ultrapure water (from Milli-Q (Millipore, Burlington, MA, USA) and anhydrous glycerol (C3H8O3) from Acros Organics, Geel, Belgium (99.8% purity). All the measurements are carried at room temperature (24 °C). Glycerol and water are H-bond liquids. Glycerol presents the advantage of a low evaporation rate with respect to liquid water.
3. Results
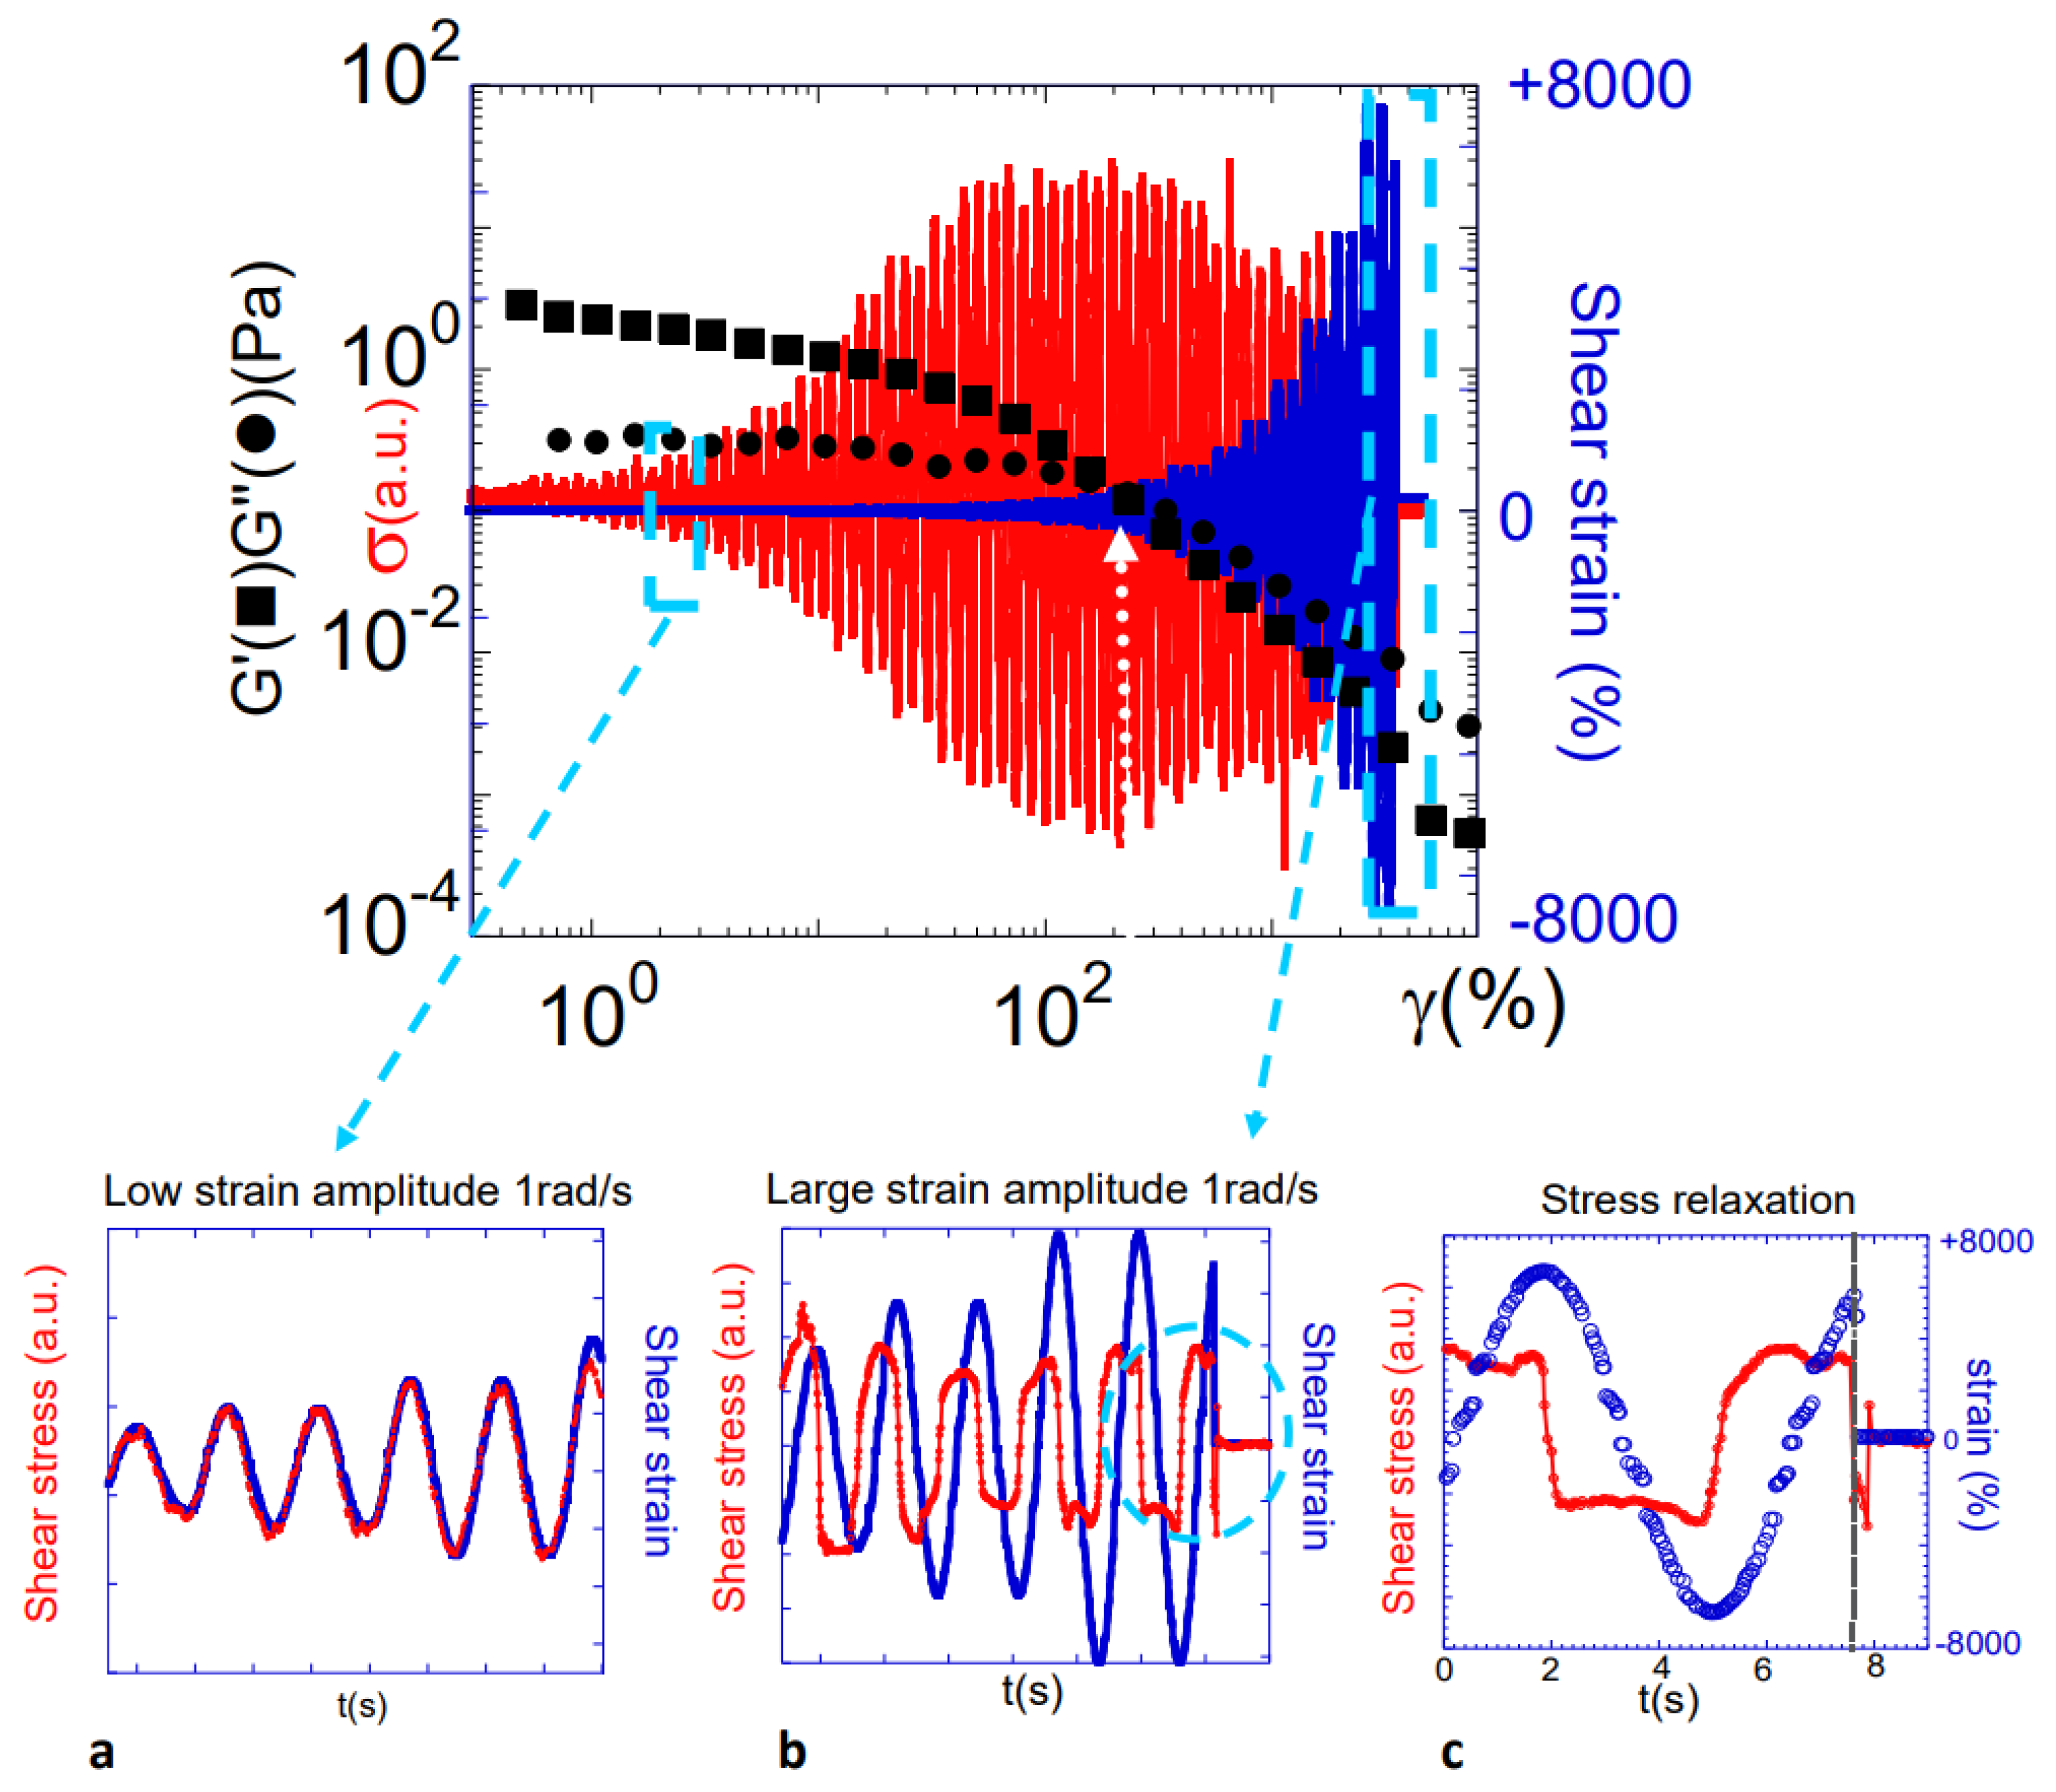
Figure 1 summarizes the shear stress behavior of the water layer from low to high shear strain amplitudes. It is illustrated by a conventional interpretation in terms of sinus waves (
G′ and
G″) and in terms of signal analysis. At low strain amplitudes and low gap thickness (and high wetting conditions), the shear stress wave (represented by the torque
Γ(
γ) =
κ ·
σ(
γ) =
where
κ is a constant dependent on the instruments and the geometry) superposes the strain wave, indicating an instantaneous response without dissipation
) (insert a of
Figure 1), i.e., the water layer resists to shear stress. At low shear strain, the stress signal is proportional to the applied strain; it is an elastic-like response.
The increase in the strain amplitude (
γ > 50%) produces a complex wave while the classical analysis in terms of viscoelastic parameters indicates the entry into a viscous regime (
G″ >
G′). The torque
Γ(
γ), and thus the shear stress wave, saturates at a nearly constant value above
γ > 50%, while the strain continues to increase (
Figure 1).
The mechanical (strain) energy is no longer transmitted to the sample. In other words, other mechanisms take place that are not integrated in the shear stress measurement. Inserts b and c show that the mechanism cannot be purely dissipative as would be expected for a viscous behavior. Indeed, the entry in the non-linear regime is associated with a distorted stress wave and not a harmonic one with respect to the input strain wave (insert b of
Figure 1), indicating the degradation of the initial elastic-like signal. At the instant the shear stress stops, the stress wave relaxes in less than 0.2 s (insert c of
Figure 1). This fast relaxation of the stress is also characteristic of the elastic nature of the mechanism. Possible mechanisms of stress losses can be slippage at the surface or within the sample, thermal changes, etc. We focus on this non-linear regime and describe how an initially elastic response is deformed under an external shear stress field.
To examine how mechanical energy is used by the confined liquid in the non-harmonic regime, we propose a microthermal approach. The thermal study of the high strain regime is particularly interesting since no evolution of the torque (
σ(
γ) = Cst) is observed in this regime, which is supposed to be “viscous” on the basis of the viscoelastic parameters
G′ and
G″ (
Figure 1a).
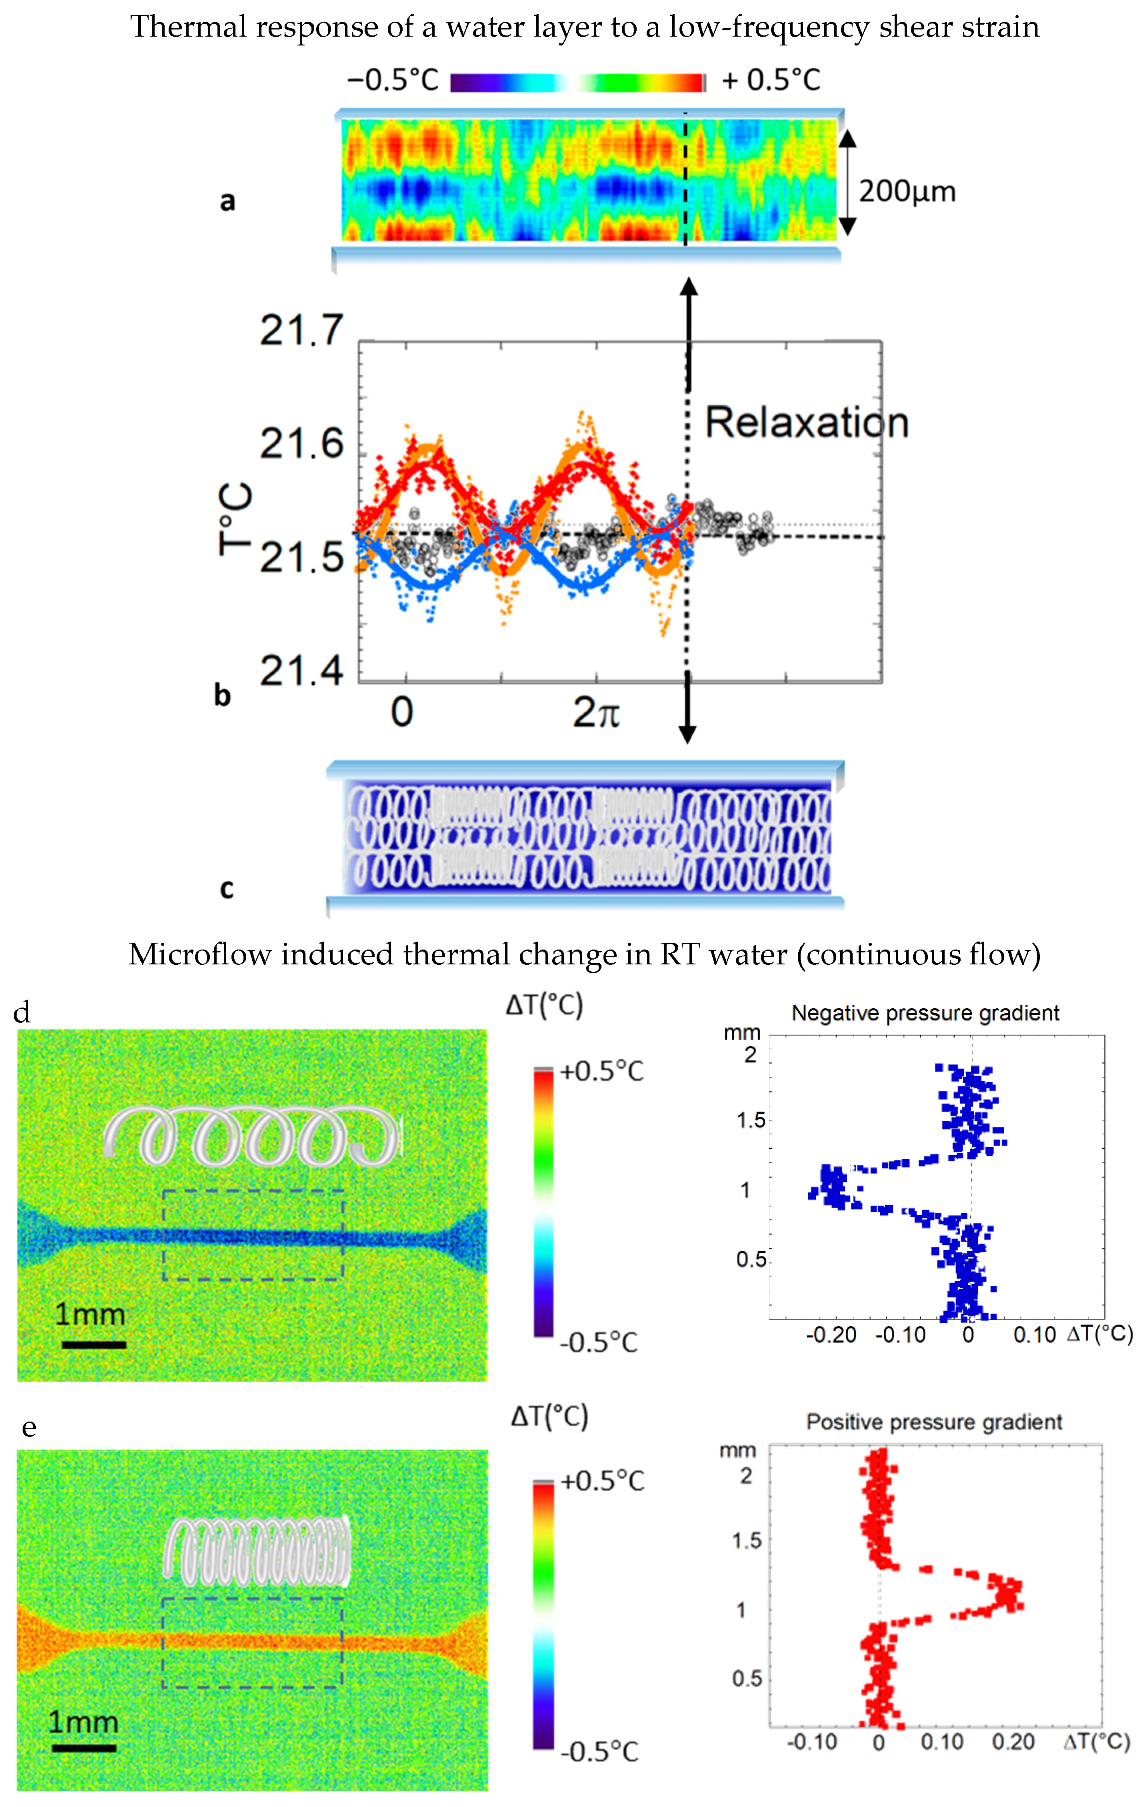
Figure 2 shows a two-dimensional microthermal kinetic mapping obtained by observing a 200 µm water layer submitted to a low-frequency shear stress (1 rad/s) at high strain amplitude (4000%). This picture is typically recorded in the so-called viscous regime of the viscoelastic response (second regime of
G′ and
G″ illustrated in
Figure 1a). The thermal analysis reveals complex periodic response characterized by the periodic and localized emergence of hot and cold thermal waves with time (
Figure 2a).
The microthermal mapping shows three zones of interest (bottom, medium, and upper horizontal zones). The modeling of the thermal oscillations (
Figure 2a) shows that a single sine wave of the same frequency as the imposed strain wave is satisfying the three zones oscillates harmonically with the imposed shear strain:
where
T0 is the equilibrium temperature and
ω is the frequency, with
,
,
,
.
The temperature of the central zone oscillates in the opposite phase with respect to the bottom and the upper zones, highlighting a compensation process. The central gap zone is also less impacted (with an amplitude of thermal variation of about ΔT < 0.05 °C versus 0.2 °C for the bottom wave (
Figure 2b) and thus less stressed, in agreement with a larger distance to the walls at the origin of the stress propagation.
At the instant the shear stress stops, the three thermal zones relax simultaneously and nearly immediately (<0.1 s) to the equilibrium temperature. This feature is similar to the rapid stress relaxation (inserts b and c of
Figure 1) as the shear strain stops.
At high shear strain amplitudes, the emergence of local hot and cold thermal waves that nearly balance is the signature of a collective water response alternating between “compressed” and “stretched” states.
To test the possible impact of flow on the compressibility in mesoscopic liquids as a mechanism to produce non-equilibrium temperatures, the ideal geometry is the microchannel geometry. In this geometry, a pressure gradient between the entrance and the exit of the channel ensures the liquid transport.
Figure 2d reveals non-equilibrium temperatures produced in a microchannel flow using a pressure difference. The non-equilibrium temperatures indicate that a part of the pressure gradient is used to change the liquid compressibility; microfluidics is not a purely viscous dissipative transfer. Compared to the oscillatory shear stress applied, the induced temperature is homogeneous along the microtube, in agreement with the application of a constant pressure difference. The hot and cold temperature variations are similar in amplitude, reaching about |Δ
T| ≈ 0.30 ± 0.01 °C (full amplitude ≈ 0.60 ± 0.02 °C). The generated non-equilibrium temperature is nearly constant in the volume in the direction transverse to the flow (cross-section), indicating that the liquid moves as a block, i.e., is submitted to a homogeneous stress (thermal profiles shown in
Figure 2d,e).
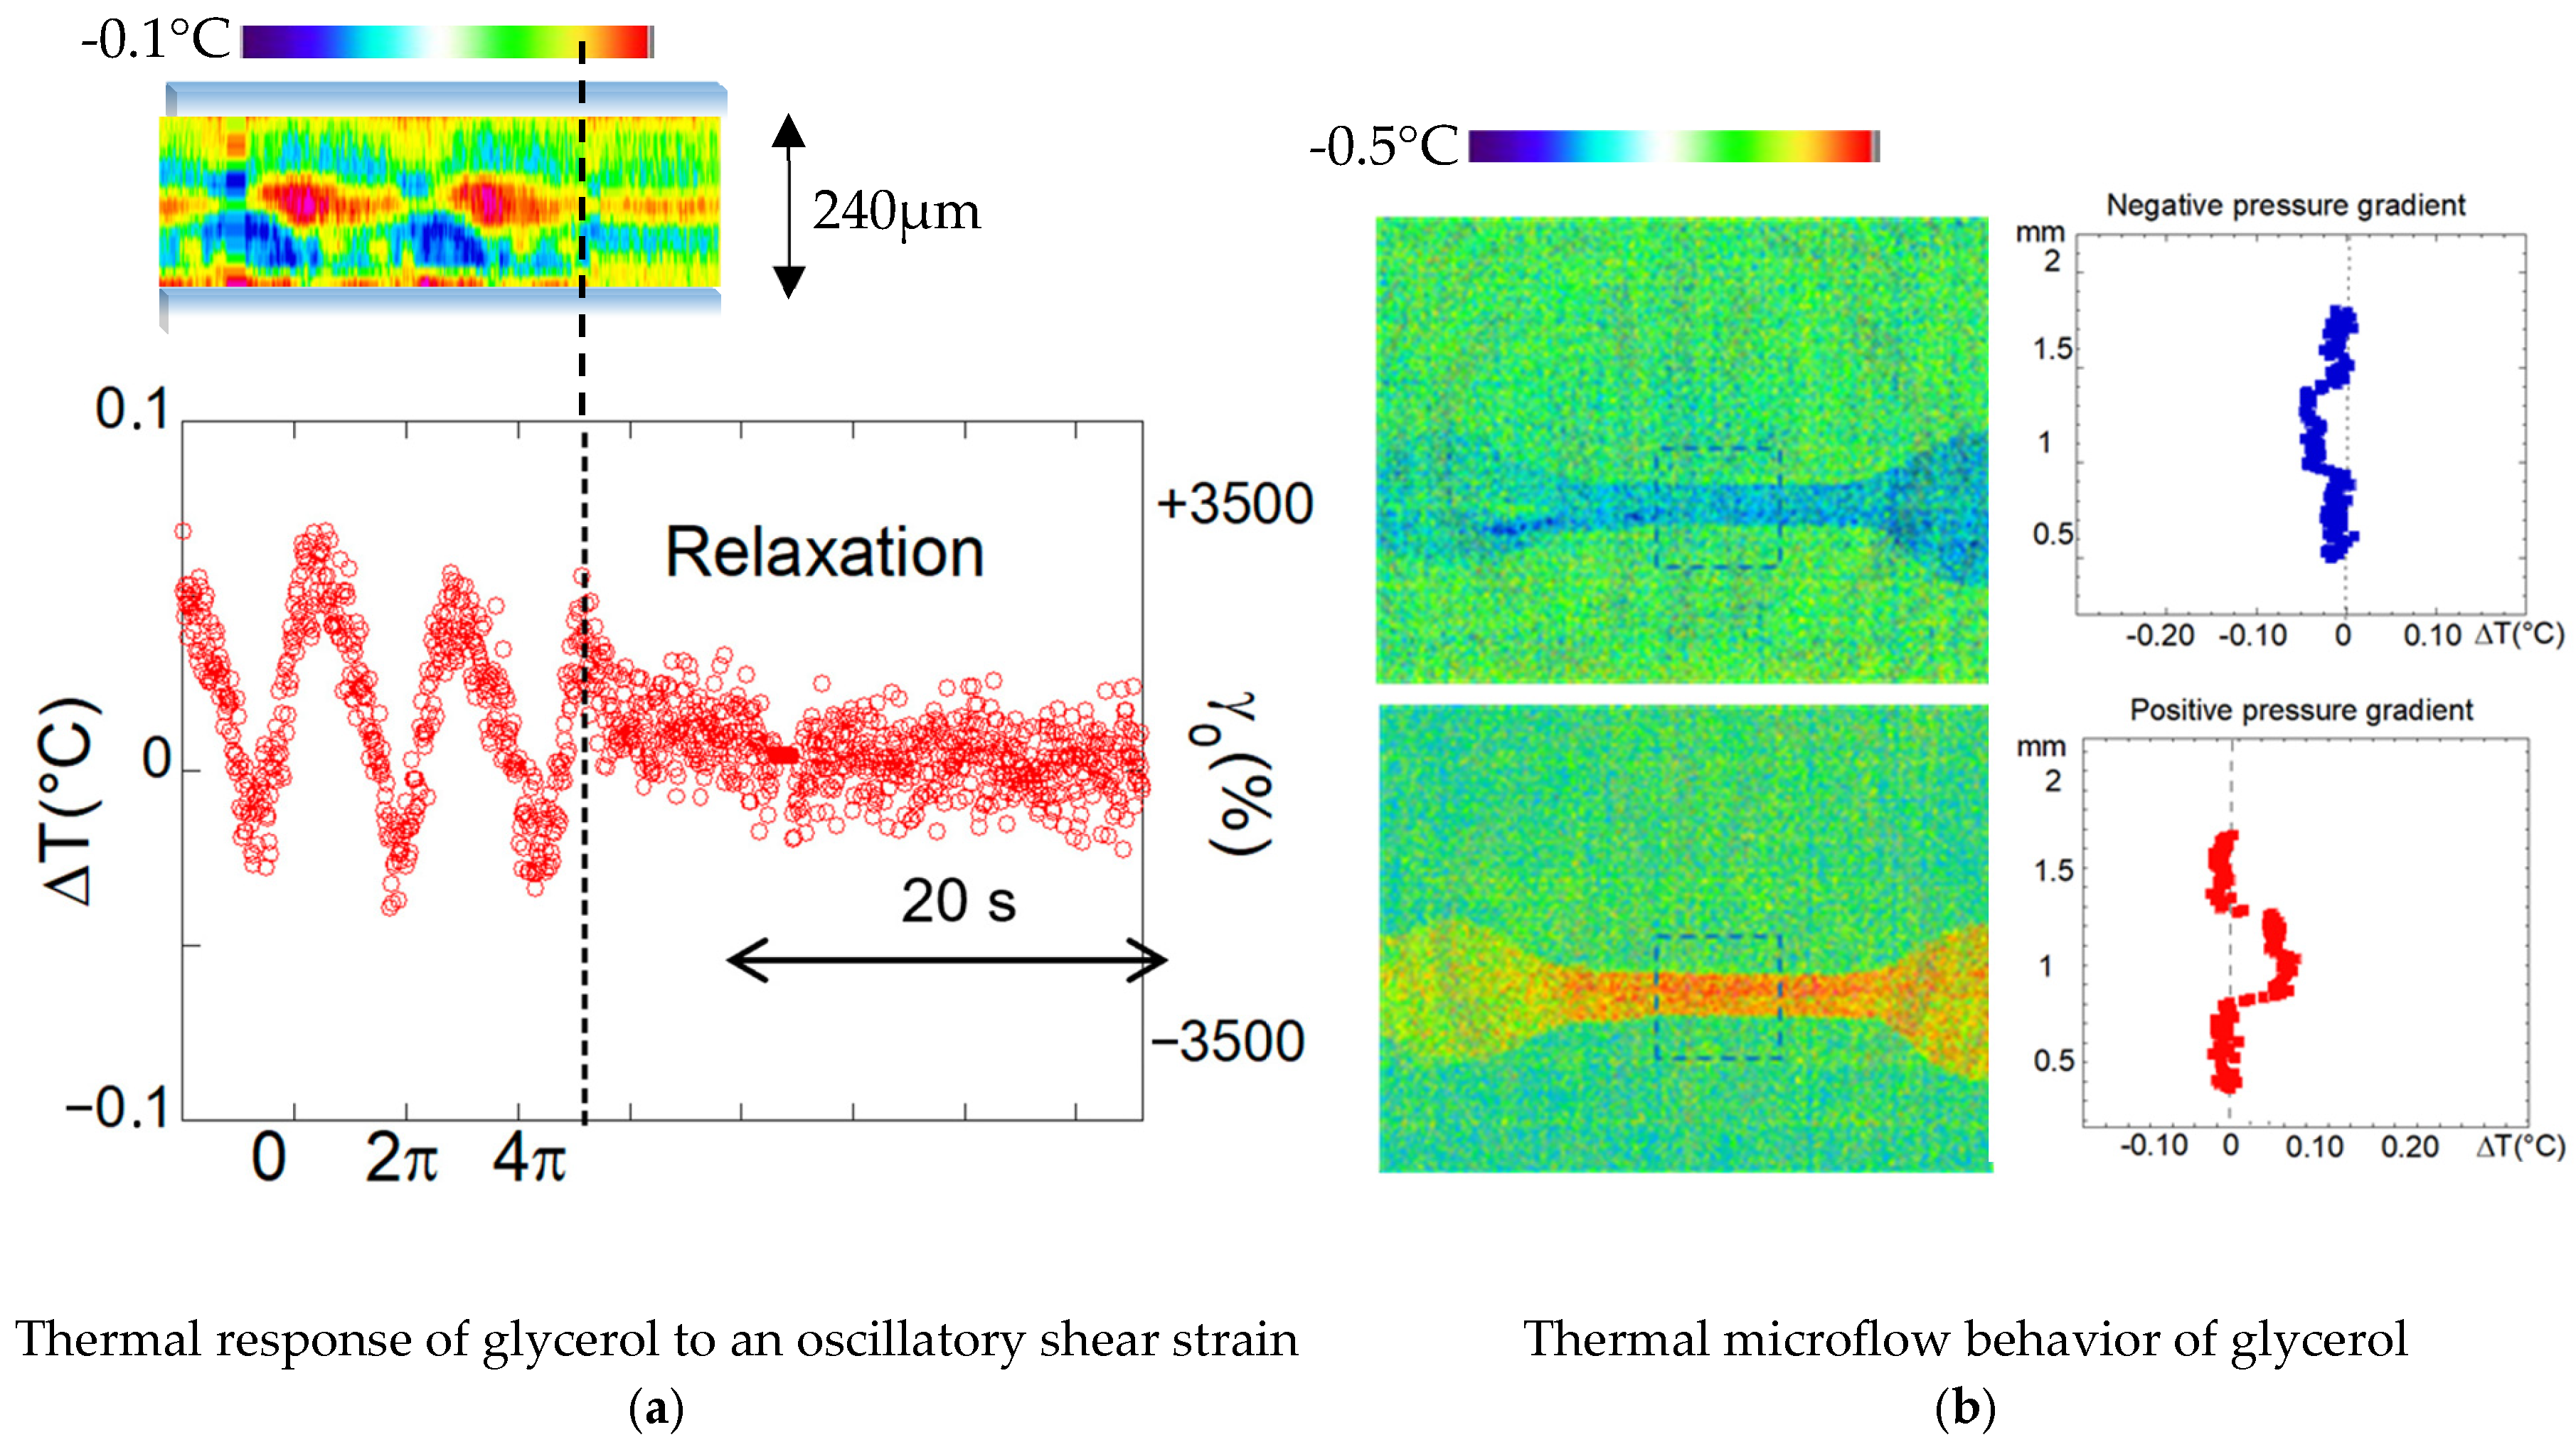
Figure 3 shows the qualitatively similar thermo-mechanical features of a confined layer of glycerol.
Figure 3a shows thermal variation, with alternating hot and cold waves, with respect to the equilibrium temperature and a relaxation as the imposed shear strain stops at low-frequency oscillatory shear strain and large strain amplitude. These non-equilibrium temperatures are generated by the deformation of the shear elasticity (alternating stretched and compressed states).
In microflow geometry (
Figure 3b), a slight change in temperature is observed in glycerol. The thermal variation is about 3–6 times weaker positive or negative temperature variations compared to water microfluidics for similar applied positive or negative pressure gradients, respectively. The bulk compressibility coefficient of glycerol is more than twice lower than for water (K
glycerol = 0.21 · 10
9 Pa
−1 against K
water = 0.45 · 10
9 Pa
−1).
4. Discussion—Conclusions
The careful examination of shear stress waves produced by usual liquids in response to an oscillatory shear strain has allowed us to consider that the large strain amplitude regime (LAOS) of mesoscopic liquids is not dissipative but exhibits a typical distortion of the stress response in harmonics compatible with the deformation of a long-range elastically correlated medium.
We have also highlighted that in the LAOS, the mechanical anharmonic stress response is accompanied by thermal variations, indicating that mesoscale liquids convert a part of the mechanical energy in cold and hot non-equilibrium temperatures (without thermal source). The observed thermal variations are weak but the implication is important; the induction of hot and cold thermal waves that are harmonic with the oscillatory strain wave and that nearly balance indicates a collective response compatible with a modulation of a compression wave.
Furthermore, the nearly instantaneous relaxation of the shear stress and of the thermal effect as the shear stress stops rules out an interpretation in terms of external heat source, conduction, or convection but points out another origin. Both the large-amplitude oscillatory thermal stress responses and fast relaxation as the strain stops suggest a typical thermo-elastic response of an elastic medium, i.e., a transient change in the liquid density, leading to non-equilibrium temperatures as the mesoscopic volume decreases or increases.
On this basis, we have examined the thermal behavior when the liquid transport is generated by means of a pressure gradient. The microfluidic conditions are the ideal geometry since the liquid transfer in the channel is uniquely actioned by a pressure gradient. We have highlighted that an increase or a decrease in temperatures following the pressure gradient is either positive or negative, confirming the propagation of compression waves as the possible origin of the non-equilibrium temperatures. This hypothesis is also supported by the observation of a lower temperature variation in glycerol under a similar pressure gradient, glycerol being less compressible compared to water (
Figure 3).
The properties mentioned above associate non-equilibrium thermal variations with a thermo-elastic mechanism, which is in agreement with the solicitation of the mesoscale liquid elasticity. The thermo-elastic mechanism is fundamentally different from the flow assumption where liquid layers are supposed to move on each other (a viscous liquid flows without storing energy, thus without thermal changes, without density changes, and without propagating compression waves). In analogy with solids, mechanically induced thermal changes can be interpreted as the signature of the stresses contained in the liquid under motion. It means that the strain action transiently affects the initial distribution of elastic intermolecular interactions to lower the energy. This interpretation presents strong similarities with the recent analysis of the mechanical behavior of transient polymer networks (vitrimers) [
25]. In molecular liquids like water or glycerol, hydrogen-bonded interactions are responsible for dynamic network formation [
26].
The non-equilibrium temperatures imply a modification of the network density (compressibility). An interpretation in terms of the transient deformation of an elastic network is confirmed by the emergence of temperature variations in both shear and (bulk) pressure stresses. Shear and bulk elasticities are indeed directly related to the compressibility B following a relationship between bulk modulus K (which is the inverse of the compressibility 1/B), the Young modulus E and the shear elasticity G via the Poisson equation: , B (in solids), where ν is the Poisson ratio.
As a consequence, liquid compressibility has to be taken into account in the analysis of viscoelastic waves. The impact of compressibility is particularly visible in microfluidic conditions where flows are supposed to be laminar (athermal). Laminar flows typically describe the prevalence of viscous effects compared to inertia (low Reynolds number), where the Navier–Stokes equation is used in its simple form, linking , where ΔP is the pressure gradient between the entrance and the exit of the microchannel, Q is the flow-rate (flux), and R is the resistance of the fluid to the displacement (linked to viscosity). R is supposed to stay constant, implying an athermal flow description. The present results show that R cannot be considered as a constant but that R consumes a part of the mechanical energy and depends on the applied shear stress or on the applied pressure gradient. As a consequence, microflows cannot be treated following (Poiseuille) athermal models. The experimental reality is thus more complex and requires new models that integrate long-range correlations that do not vanish by applying external stresses but produce non-equilibrium states emerging at low-frequency excitations (here 1 rad/s) and for a low Reynolds number, i.e., as soon as the confined liquid moves.
The complexity also lies in the integration of non-extensive parameters. Boundary conditions are important at the mesoscale, as the liquid experiences different interfacial potentials [
27] which are rarely taken into account [
28]. Low-frequency oscillatory shear strain experiments were carried out using interfacial conditions that maximize the transmission of the mechanical energy to stress at maximum liquid elastic shear forces and lower the wall slippage. In contrast, weak interfacial forces would favor sliding conditions, a source of instabilities assisted by the existence of mesoscopic elasticity, abrasion, and the wear of supports exerted by the fluid through its dynamic friction.
More generally, the small-scale thermal response of the liquid (to a low-frequency deformation or to a pressure gradient) shows that liquids propagate compressive waves and thus collective excitations, which suggests a mechanism of propagation of phonons, carriers of thermal energy. The molecular vibrational cage can, in its simplest assumption of a Harmonic oscillator, be associated with a volume and a vibrational temperature:
, where
kB is the Boltzmann constant,
հ is the Planck constant, and
is the vibrational frequency. The small volume change
is formulated via the Grüneisen parameter, relating the vibrational frequency
via
, and thus to the emergence of associated non-equilibrium temperatures. The vibrational cages are collectively impacted due to the interconnectivity provided by the mesoscopic liquid elasticity revealed under shear strain [
3,
4,
5,
6,
7,
8,
9,
10,
11,
12,
13,
14,
15,
16,
17,
18,
19,
20,
21,
22,
24,
26,
27,
28,
29,
30,
31]. The analogy with a picture of correlated vibrating atoms in a soft solid lattice (phonons) seems relevant. This hypothesis is also reinforced by the fact that the difference between liquids and solids fades at high frequencies exhibiting GPa shear moduli [
32] and thus, intermolecular forces at small distances are not so different from those in a solid [
19]. Recent inelastic experiments have further shown that possible high-frequency coupling exists between the solid and the liquid, the phonon dynamics of the substrate being deeply modified by water wetting [
33].
By challenging our naïve view of a homogeneous and incompressible flow at the submillimeter scale, these pioneering experimental results echo, at a very different scale, the first laws revealing water’s compressibility properties. Hydrostatic pressure and temperature data were extracted at the scale of deep seas, allowing P. G. Tait to establish static relationships between these quantities [
34]. Here, our results seem to show that small-scale flows also reveal non-zero compressibility. However, the low-scale compressibility is not (hydro)static but dynamically (flow)-induced, producing non-equilibrium (non-Fourier) temperatures. The current results also depend on scaling parameters and non-extensive parameters that need to be characterized. They also illustrate how fundamental research about mesoscopic liquid elasticity can lead to the exploration of new fluid properties and possibly new technologies in relation to non-equilibrium thermal properties [
35].
