Article

Hydroxyl Radical Formation and Its Mechanism in Cavitation Bubble Plasma-Treated Water: A Chemical Probe Study

Graduate School of Engineering, University of Hyogo, 2167 Shosha, Himeji, Hyogo 671-2280, Japan
*
Author to whom correspondence should be addressed.
Liquids 2025, 5(4), 26; https://doi.org/10.3390/liquids5040026
Submission received: 18 July 2025 / Revised: 9 September 2025 / Accepted: 25 September 2025 / Published: 1 October 2025
(This article belongs to the Section Molecular Liquids)

Abstract

This study investigates the formation of hydroxyl radicals (OH radicals) in cavitation bubble plasma-treated water (CBPTW) using a chemical probe method. CBPTW samples were prepared with different electrode materials (W, Fe, Cu, and Ag), and the chemical scavenger was added two minutes after the completion of cavitation and plasma treatments. The concentrations of metal ions and hydrogen peroxide (H2O2) generated in the CBPTW were also measured over time. This study reveals a novel mechanism whereby metal nanoparticles and ions released from electrodes catalyze the continuous generation of hydroxyl radicals in CBPTW, which has not been fully addressed in previous studies. The results suggest a continuous generation of OH radicals in CBPTW prepared with W, Fe, and Cu electrodes, with the amount of OH radicals produced in the order Cu > Fe > W. The study reveals a correlation between OH radical production and electrode wear, suggesting that the continuous generation of OH radicals in CBPTW results from the catalytic decomposition of H2O2 by metal nanoparticles or ions released from the electrodes. It should be noted that cavitation bubble plasma (CBP) is fundamentally different from sonochemistry. While sonochemistry utilizes ultrasound-induced cavitation to generate radicals, CBP relies on plasma discharge generated inside cavitation bubbles. No ultrasound was applied in this study; therefore, all observed radical formation is attributable exclusively to plasma processes rather than sonochemical effects. However, the precise mechanism of continuous OH radical formation in CBPTW remains unclear and requires further investigation. These findings provide new insights into the role of electrode materials in continuous OH radical generation in cavitation bubble plasma treated water, offering potential applications in water purification and sterilization technologies.

1. Introduction

In recent years, low-temperature plasma has been utilized in various fields and has attracted significant attention as a novel technology for industrial applications. Applications include thin-film formation, etching, growth promotion, and sterilization [1,2,3,4], and these effects are believed to result from reactive species such as free radicals generated in low-temperature plasma. Low-temperature plasma has shown promise in the decomposition of organic pollutants, and its effectiveness in water has been demonstrated using organic dyes such as methylene blue [5,6,7]. This organic degradation effect is attributed to OH radicals produced by the plasma, and the number of reactive species produced is considered a key factor influencing degradation efficiency.
Cavitation bubble plasma (CBP) [8] is a type of low-temperature plasma that generates a significant amount of reactive oxygen species (ROS). This plasma is produced within microbubbles formed by cavitation in water. The exceptionally high processing efficiency of CBP is attributed to the large reaction area provided by the small bubble diameter, and the abundant production of ROS (e.g., H2O2 and OH radicals) results from using H2O as the solvent. CBP has been shown to decompose methylene blue, and this effect persists in CBPTW, indicating the continuous generation of OH radicals. The formation of OH radicals may result from reactions between H2O2 in CBPTW and metal components originating from electrode wear. However, it remains unclear whether OH radicals are continuously generated in CBPTW after treatment, and to what extent. Similar study has also been reported that suggest sterilization by radicals in PAW after plasma treatment [9]. However, this study differs from the emphasizes technology presented in this paper in that they use tap water containing components other than H2O (such as chlorine), which means that multiple types of radicals may be at work. This study aims to clarify the continuous generation mechanism of OH radicals in CBPTW, particularly the catalytic role of metal nanoparticles and ions released by electrode wear, which has not been fully addressed in the previous literature.
In this study, we aim to quantify the formation of OH radicals in CBPTW using a chemical probe method and to clarify the influence of different electrode materials on this process. While both CBP and sonochemistry involve cavitation phenomena in liquids, their radical generation mechanisms differ significantly. Traditional sonochemistry depends on ultrasonic irradiation and acoustic cavitation. By contrast, CBP produces radicals exclusively through plasma discharge inside cavitation bubbles, without any ultrasound, offering a unique low-temperature plasma process with distinct reactive oxygen species generation dynamics. Sonochemistry produces radicals through ultrasonic irradiation and acoustic cavitation, whereas in CBP, radicals are produced by electrical plasma discharge inside cavitation bubbles, without the use of ultrasound. This study strictly uses plasma-generated cavitation without any ultrasonic energy input, thus excluding sonochemical effects from consideration. In this study, ‘metal nanoparticles’ refers to solid particles produced from electrode wear, whereas ‘metal ions’ denotes dissolved ionic species in CBPTW. Both forms may catalyze reactions leading to continuous OH radical generation.

2. Materials and Methods

2.1. Preparation of CBPTW

CBPTW was prepared using the CBP method as previously reported [8]. A schematic diagram of the CBP device is shown in Figure 1. The apparatus was filled with 260 g of ion-exchanged water (initial pH 6, conductivity 1 μS/cm, temperature 30 °C). A rotor was used to generate cavitation by rotation at 7200 rpm, and water with cavitation bubbles was circulated in the apparatus. W, Fe, Cu, and Ag electrodes with a diameter of 2.0 mm were used for the electrodes, which were placed perpendicular to the water flow and facing each other with a gap length of 1.0 mm. A bipolar pulse voltage of 10 kV, 1.0 μs pulse width, and a 200 kHz repetition rate was applied between the electrodes to generate CBP. The CBP processing time was uniformly 5 min for all electrode materials. The electrodes used were commercial-grade W, Fe, Cu, and Ag with purities above 99.5%. Details about the electrode source and any observed compositional variations are provided here.

2.2. Measurement of Metal Ion and H2O2 Concentrations in CBPTW

The metal concentration in CBPTW was estimated based on the amount of electrode wear; the mass of each electrode was measured before and after CBP treatment using an electronic balance (GR-202, A&D Company, Tokyo, Japan). The mass loss was divided by the 260 g water volume to calculate the resultant metal concentration in CBPTW.
The concentrations of Fe2+, Fe3+, Cu ions (Cu+, Cu2+) and H2O2 in CBPTW were measured using DIGITALPACKTEST·MULTI SP (DPM-MTSP, KYORITSU CHEMICAL-CHECK Lab., Corp., Yokohama, Kanagawa, Japan) and PACKTEST Iron (Divalent) (WAK-Fe2+, KYORITSU CHEMICAL-CHECK Lab., Corp., Yokohama, Kanagawa, Japan), Iron (Trivalent) (WAK-Fe3+, KYORITSU CHEMICAL-CHECK Lab., Corp., Yokohama, Kanagawa, Japan), Copper (WAK-Cu, KYORITSU CHEMICAL-CHECK Lab., Corp., Yokohama, Kanagawa, Japan), Hydrogen Peroxide (High Range) (WAK-H2O2 (C), KYORITSU CHEMICAL-CHECK Lab., Corp., Yokohama, Kanagawa, Japan), Hydrogen Peroxide (WAK-H2O2, KYORITSU CHEMICAL-CHECK Lab., Corp., Yokohama, Kanagawa, Japan). Future work will explore more uniform and precise analytical methods such as ICP-OES/MS for all metal ions to improve accuracy. If the metal ion and H2O2 concentrations were above the detection limit, CBPTW was diluted in the cell with deionized water to a concentration within the measurement range before measurement. If the H2O2 concentration was below the lower detection limit of the high range packed test (WAK-H2O2 (C)), a low concentration packed test (WAK-H2O2) was used for the measurement. ts = 0 min was defined as the end of CBP treatment, and their concentrations were measured up to 24 h.

2.3. Investigation of OH Radical Generation

The generation of OH radicals in CBPTW was investigated using the chemical probe method. In this method, disodium terephthalate (NaTA) is used as a reagent to trap OH radicals, and the OH radicals are quantified from the concentration of 2-hydroxyterephthalic acid (HTA) produced by trapping them (Figure 2). Two minutes after the preparation of CBPTW, 20 g of a 5 mM NaTA (T1097, Tokyo Chemical Industry Co., Ltd., Tokyo, Japan) aqueous solution was mixed with 180 g of CBPTW to prepare a sample water with a NaTA concentration of 0.5 mM. The end of the sample water preparation was set as te = 0 min. The fluorescence spectrum of the sample water was measured at te = 3 min to 24 h. To mitigate potential pH effects on OH radical generation in CBPTW, a NaOH aqueous solution (191-11675, FUJIFILM Wako Pure Chemical Corporation, Osaka, Japan) was added to adjust the pH of the 20 g sample water in a small bottle 2 min before each measurement. Then, using a fluorescence spectrophotometer (RF-6000, Shimadzu Corporation, Kyoto, Japan), the fluorescence spectrum was obtained in the range of 350 to 600 nm with an excitation wavelength of 315 nm. The fluorescence spectrum of HTA has a single peak at a wavelength of 425 nm. Note that the concentration of OH radicals is inferred indirectly from the fluorescence intensity of 2-hydroxyterephthalic acid (HTA) using a calibration curve. Thus, this method provides a proxy rather than direct quantification of OH radical concentration. To investigate the effect of pH on the fluorescence spectrum, a 1 mM HTA (H1385, Tokyo Chemical Industry Co., Ltd., Tokyo, Japan) aqueous solution was used. The fluorescence was calibrated using HTA standards as described below (Section 3.2), and all measurements were performed in triplicate to ensure reproducibility.

3. Results and Discussion

3.1. Constituents of CBPTW

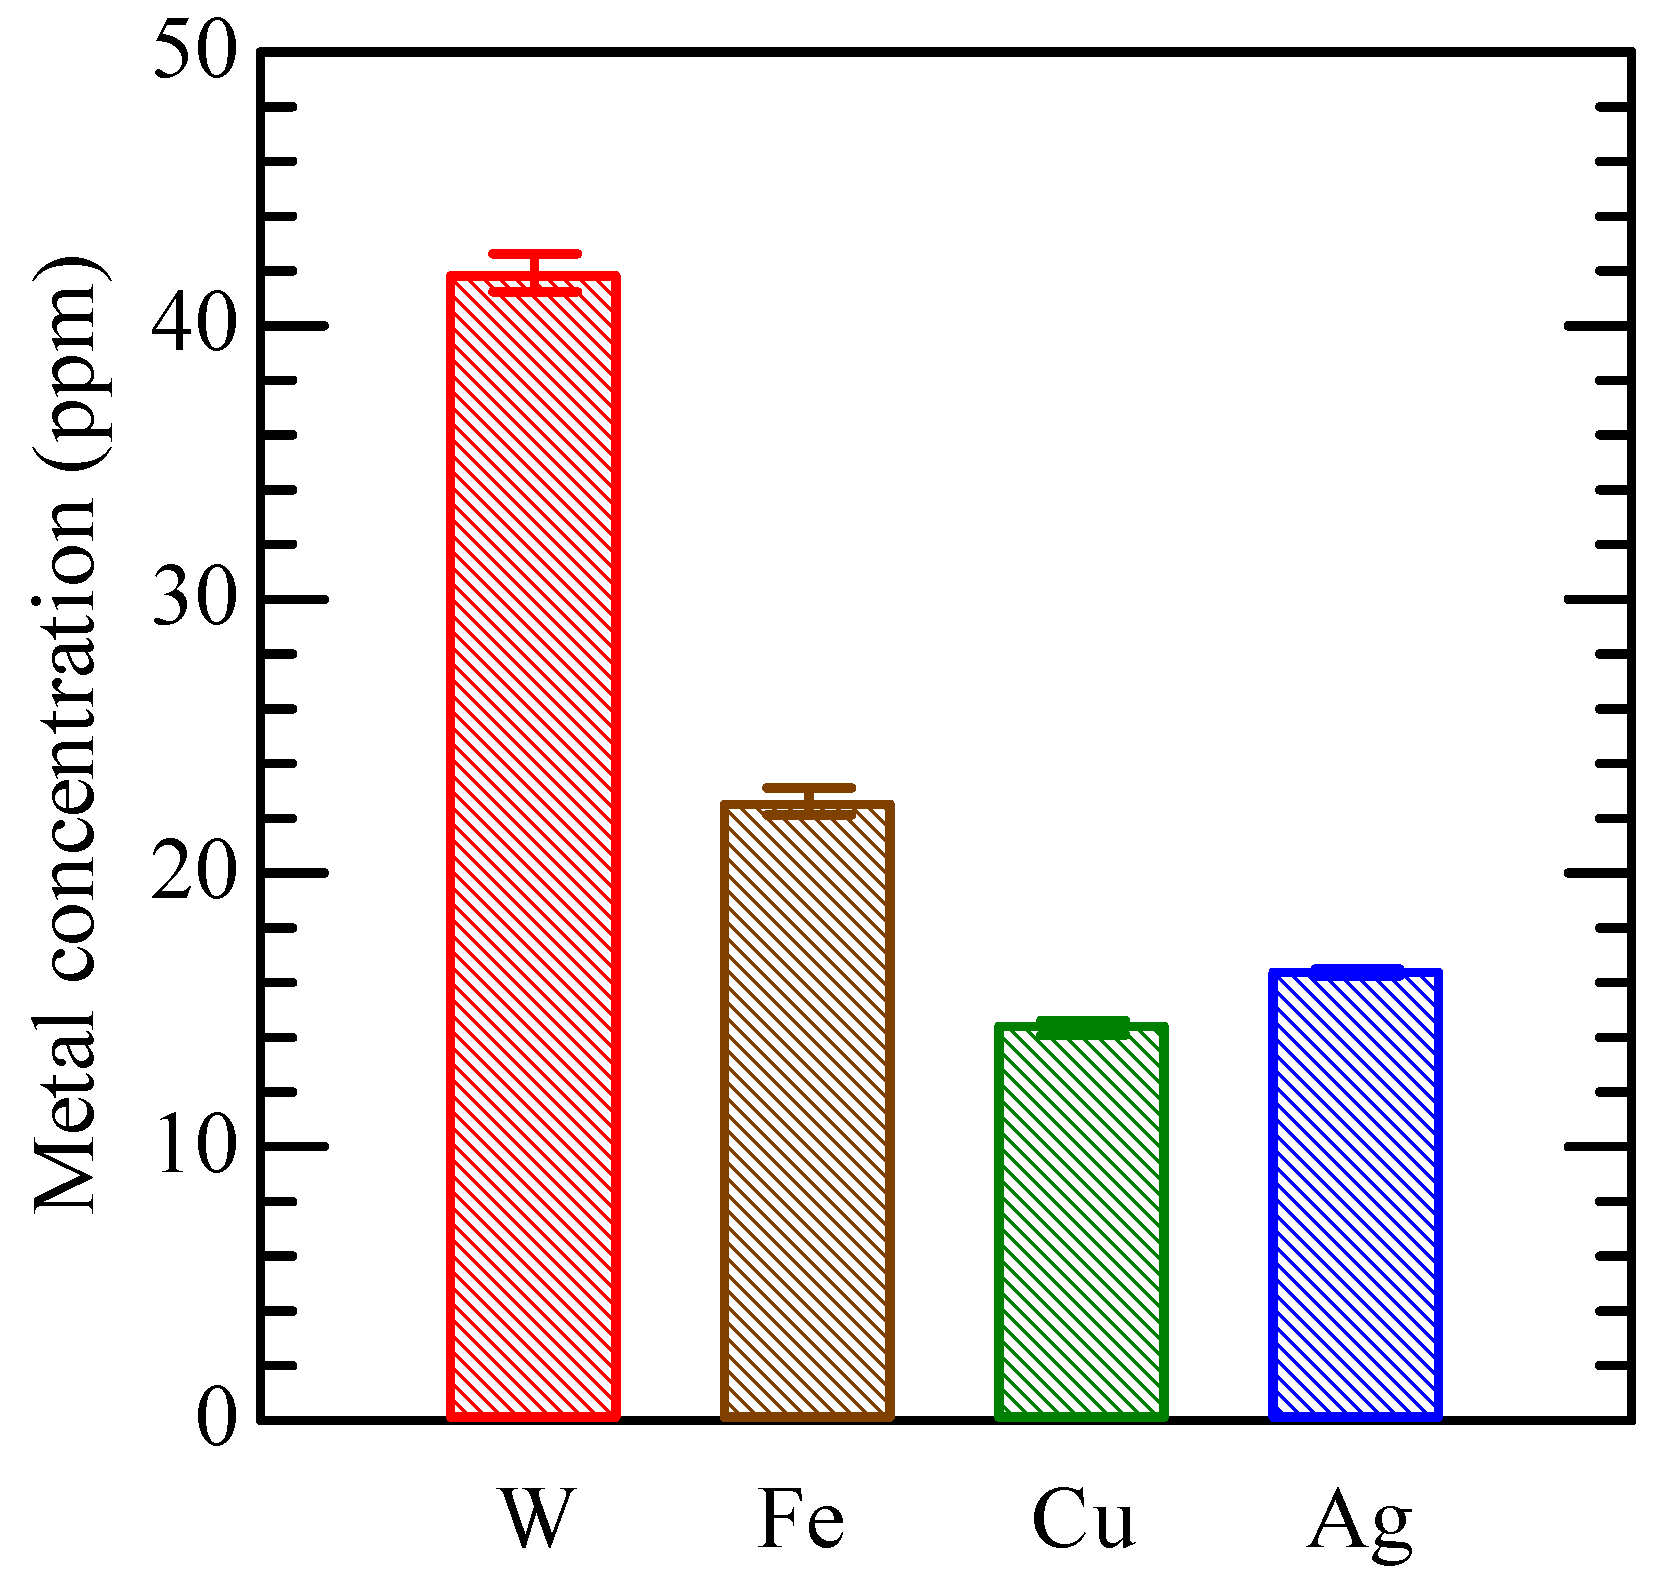
The metal electrodes are depleted by the CBP treatment and produce nanoparticles, some or all of which are dissolved and exist as ions. Figure 3 shows the metal concentrations in CBPTW calculated from the difference in electrode mass before and after CBP treatment. The metal concentrations in CBPTW prepared using W, Fe, Cu and Ag electrodes are 41.8, 22.5, 14.4 and 16.4 ppm, respectively. The primary objective of this study is to demonstrate how the choice of electrode materials directly influences the continuous generation of OH radicals in CBPTW. Accordingly, the following discussion focuses on interpreting the observed differences among W, Fe, Cu, and Ag electrodes in terms of their catalytic effects and metal ion release during plasma treatment. This figure shows that CBPTW contains metal components regardless of the electrode material, and it is thought that these metal components were generated by sputtering during CBP processing.
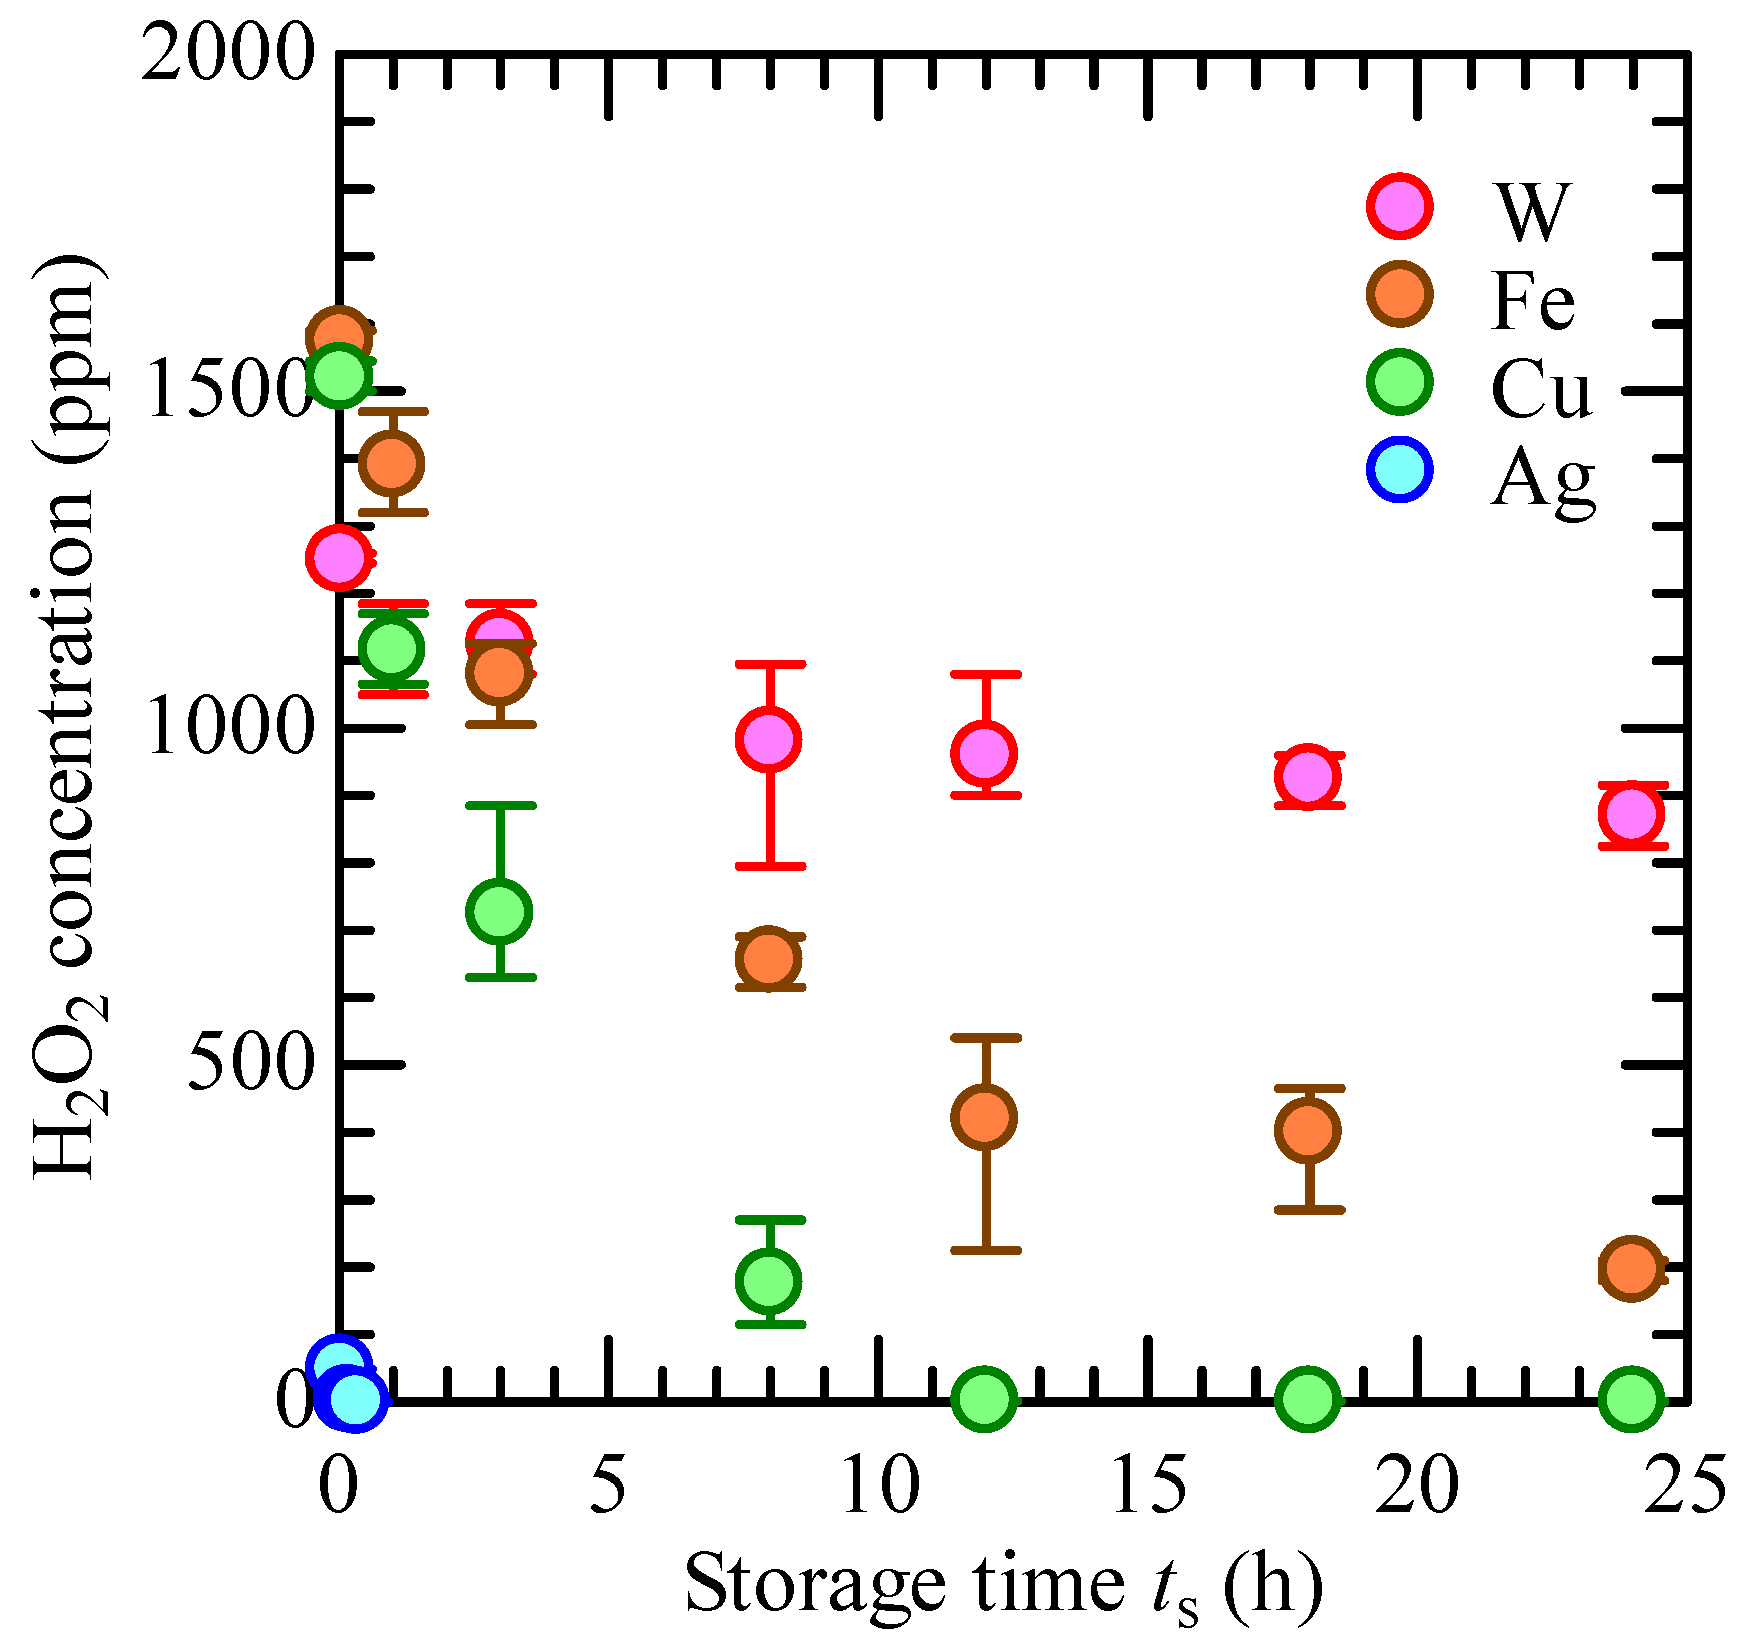
Figure 4 shows the H2O2 concentration in CBPTW as a function of storage time. H2O2 in CBPTW is likely formed through the recombination of OH radicals (Equation (1)) generated by the plasma [10], as shown in Equation (2).
H 2 O + e · H + · O H + e
· O H + · O H H 2 O 2
Figure 4 shows that the H2O2 concentration in CBPTW(W) is 1250 ppm at ts = 2 min and decreases slowly with increasing storage time to 870 ppm at ts = 24 h. The H2O2 concentrations in CBPTW(Fe) and CBPTW(Cu) are about 1500 ppm at ts = 2 min and decrease slowly with increasing storage time, reaching 420 and 1.1 ppm at ts = 12 h, respectively. Thereafter, they gradually decrease to 200 and 0.8 ppm at ts = 24 h, respectively. On the other hand, the H2O2 concentration in CBPTW (Ag) is 49 ppm at ts = 2 min and decreases rapidly with increasing storage time until it is below the detection limit (<0.1 ppm) at ts = 20 min. The H2O2 concentration in CBPTW decreased with increasing storage time regardless of the electrode material, and the decrease in H2O2 concentration from 2 min after CBP treatment was greater for CBPTW (Cu), CBPTW (Fe), CBPTW (W), and CBPTW (Ag), in that order. The observed decrease in H2O2 concentration may result from its catalytic decomposition by metal ions derived from W, Fe, and Cu electrodes, as described in Equations (3)–(5) [11,12,13]. In the case of Ag, nanoparticles promote decomposition according to reaction (6) [14]. These results indicate that metal ions and nanoparticles released from electrodes catalyze H2O2 breakdown, thereby sustaining hydroxyl radical production and maintaining oxidative species in CBPTW during storage.
W V + H 2 O 2 W V I + O H + · O H
F e 2 + + H 2 O 2 F e 3 + + O H + · O H
C u + + H 2 O 2 C u 2 + + O H + · O H
2 H 2 O 2 2 H 2 O + O 2
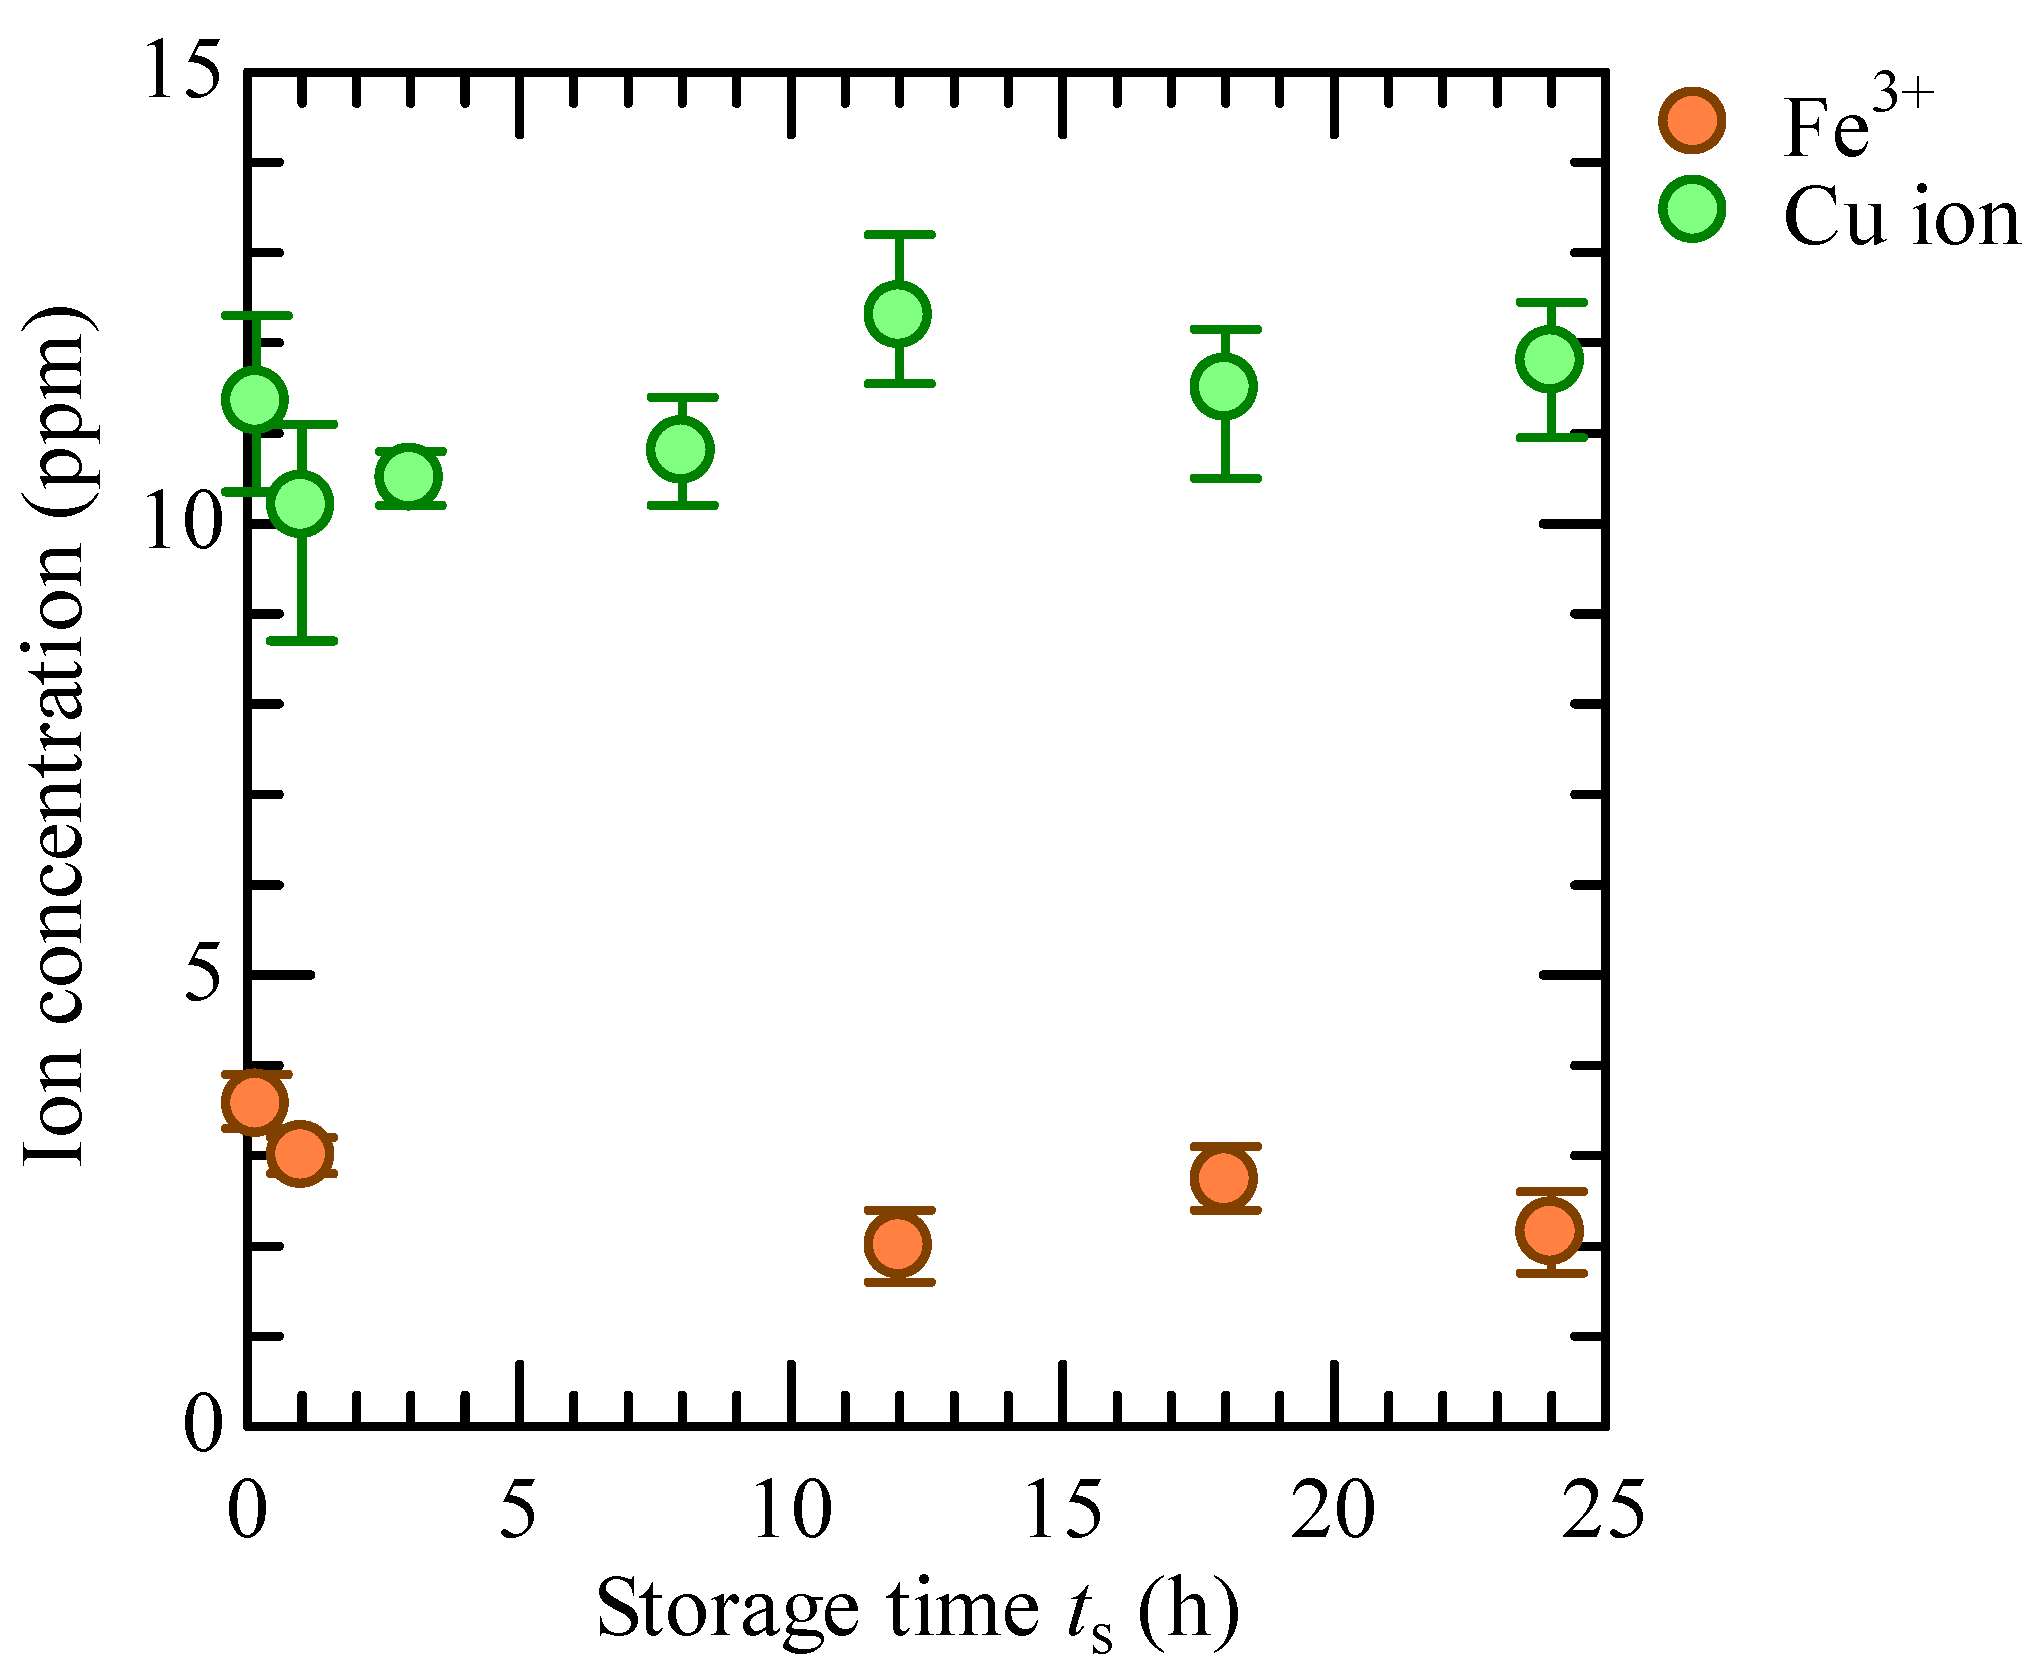
Figure 5 shows the concentration of metal ions in CBPTW (Fe) and CBPTW (Cu) as a function of storage time. These ion concentrations were measured by PACKTEST. The Fe2+ concentration was below the detection limit (<0.1 ppm) and is therefore not presented. The Fe3+ concentration was 3.6 ppm at ts = 10 min and decreased slowly with increasing storage time to 2.2 ppm at ts = 24 h. The Cu ion concentration is 11.4 ppm at ts = 10 min and slowly increases with increasing storage time to 11.8 ppm at ts = 24 h. Figure 5 shows that the concentration of metal ions in CBPTW is higher for Fe than for Cu. These metal ions are involved in Equations (4) and (5) and may have caused the decrease in H2O2 concentration in Figure 4. While the concentration of pentavalent W ions in CBPTW(W) is not known, the lower decrease in H2O2 concentration compared to CBPTW(Fe) and CBPTW(Cu) may be related to the ion concentration.

3.2. Preparing for HTA Concentration Measurement

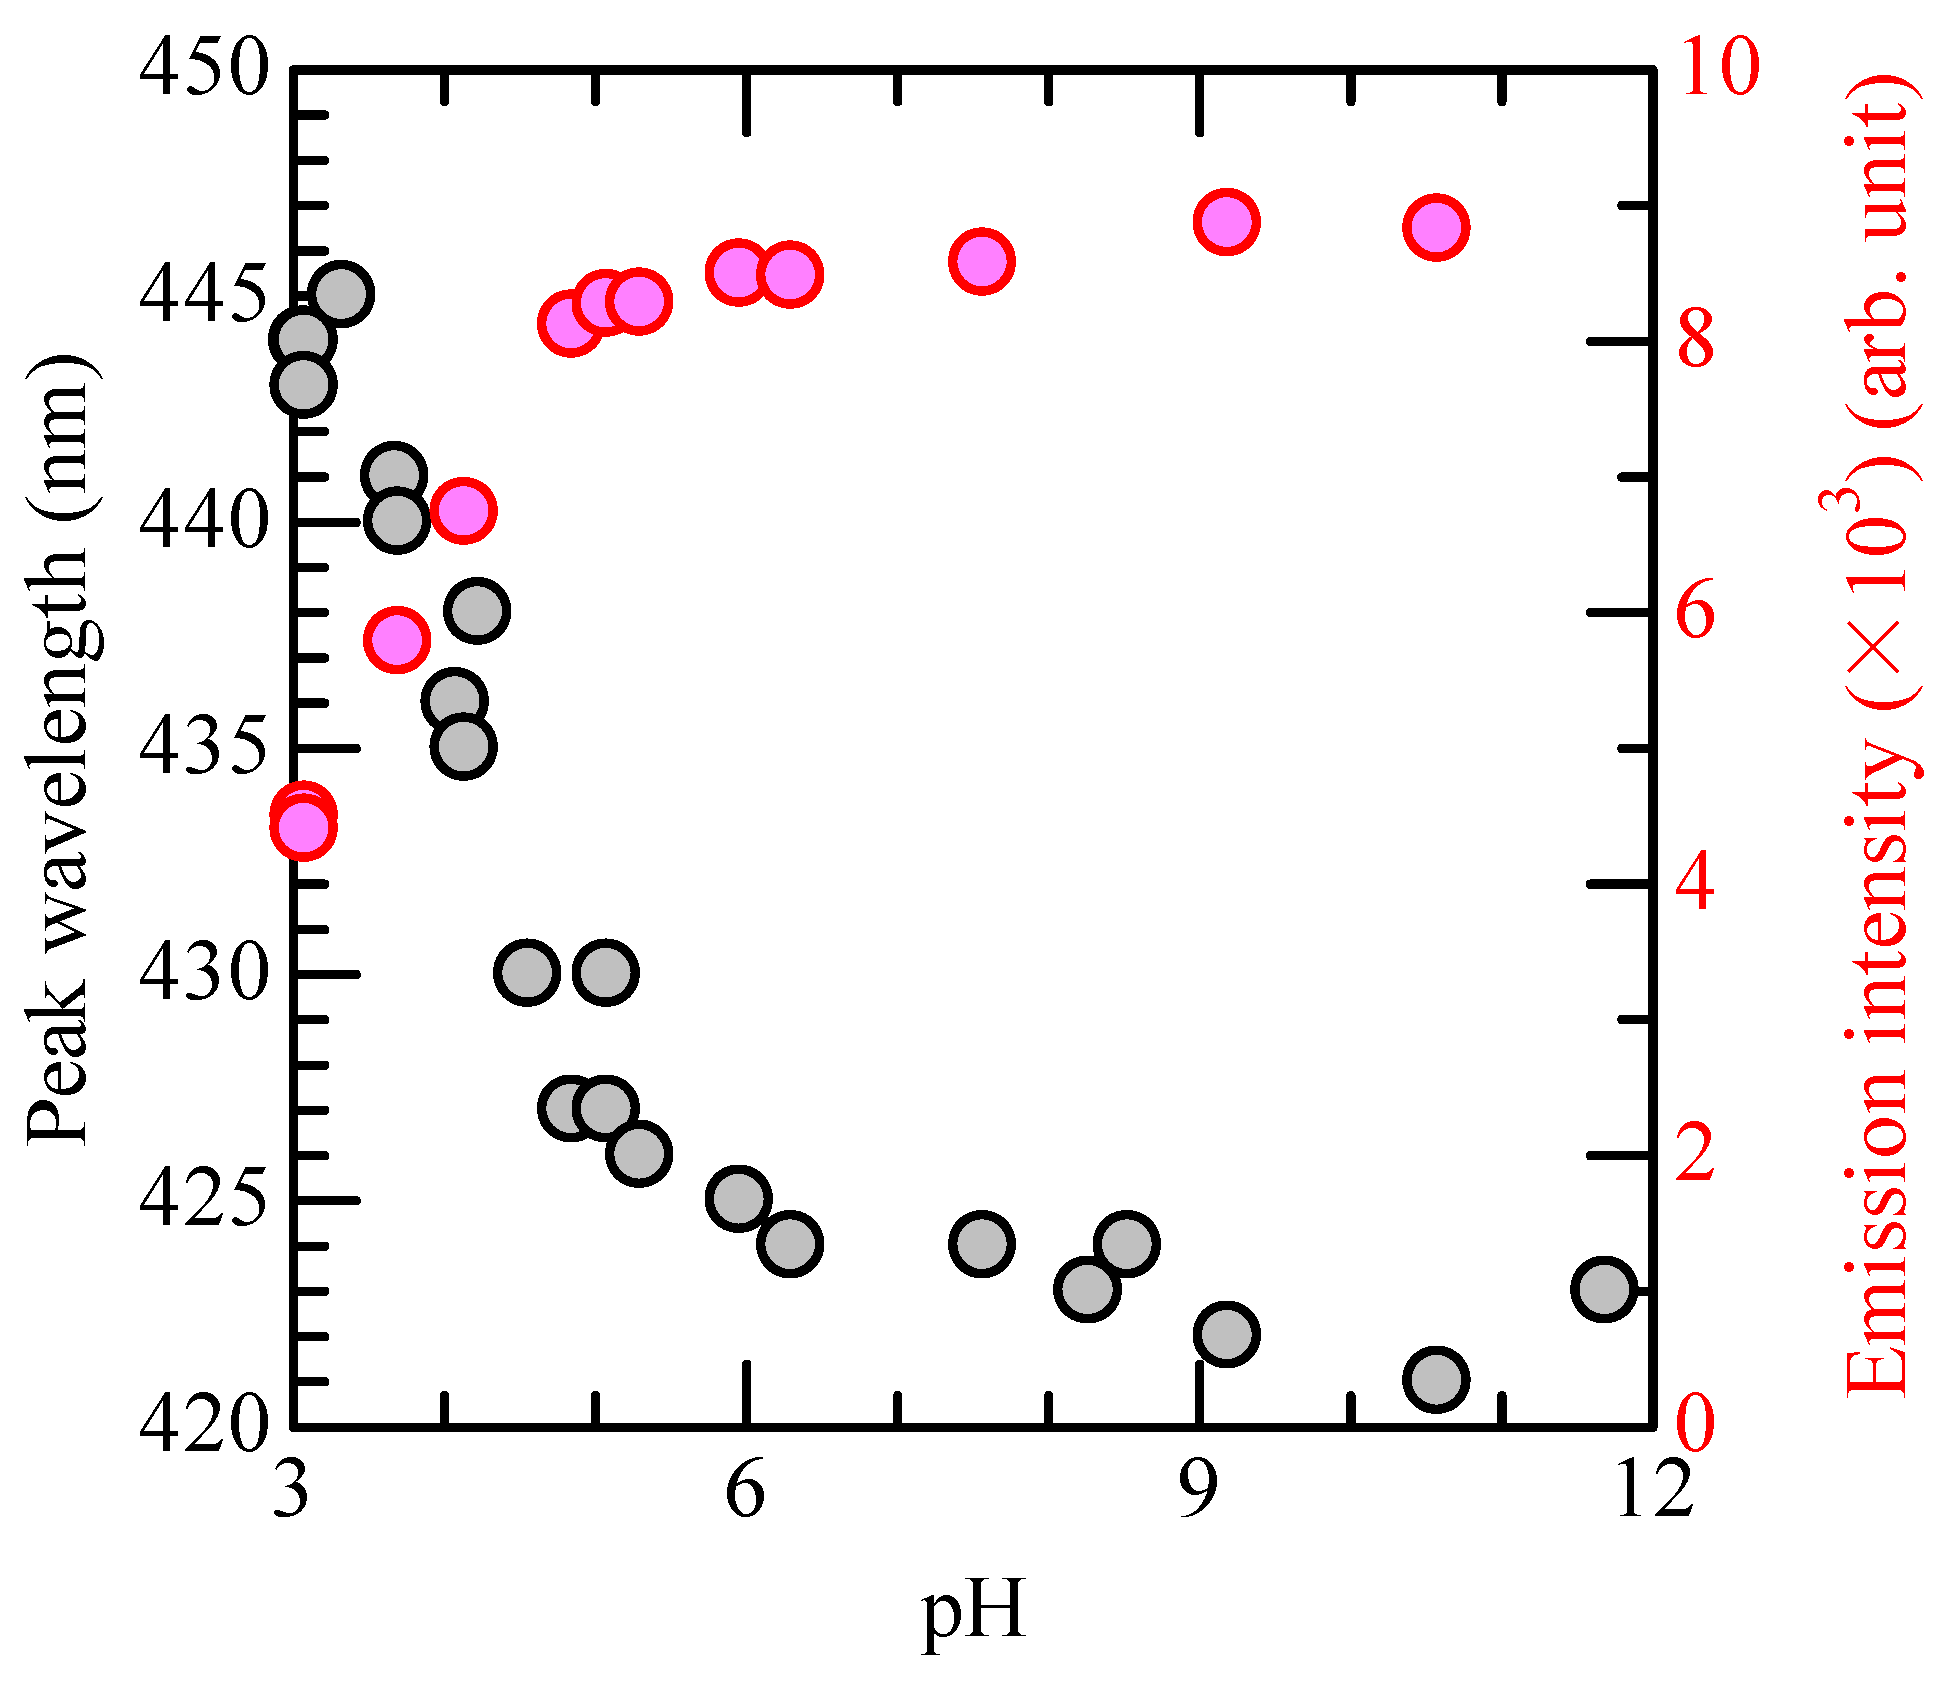
Figure 6 shows the fluorescence spectra of HTA solutions (1 mM) at various pH. The peak position of the spectrum at pH 4.1 is shifted to a higher wavelength and the fluorescence intensity is lower than that at pH 7.6 and 10.6. The peak wavelength and fluorescence intensity in HTA solutions as a function of pH are shown in Figure 7. The peak wavelength of HTA fluorescence is 444 nm at pH 3 and decreases rapidly with increasing pH to 427 nm at pH 5. Thereafter, it decreases slowly to 423 nm at pH 12. The fluorescence intensity of HTA is 4500 at pH 3 and rapidly increases with increasing pH to 8100 at pH 5. Thereafter, it increases slowly to 8900 at pH 12. In this experiment, the pH was adjusted to 6–8 by adding NaOH to eliminate the peak shift in the measurement of CBPTW, which is acidic.
Figure 8 shows a HTA calibration curve, linearly approximated in the range of 0–20 µM. This calibration curve was used to determine the amount of OH radicals formed in CBPTW.

3.3. OH Radical Generation in CBPTW

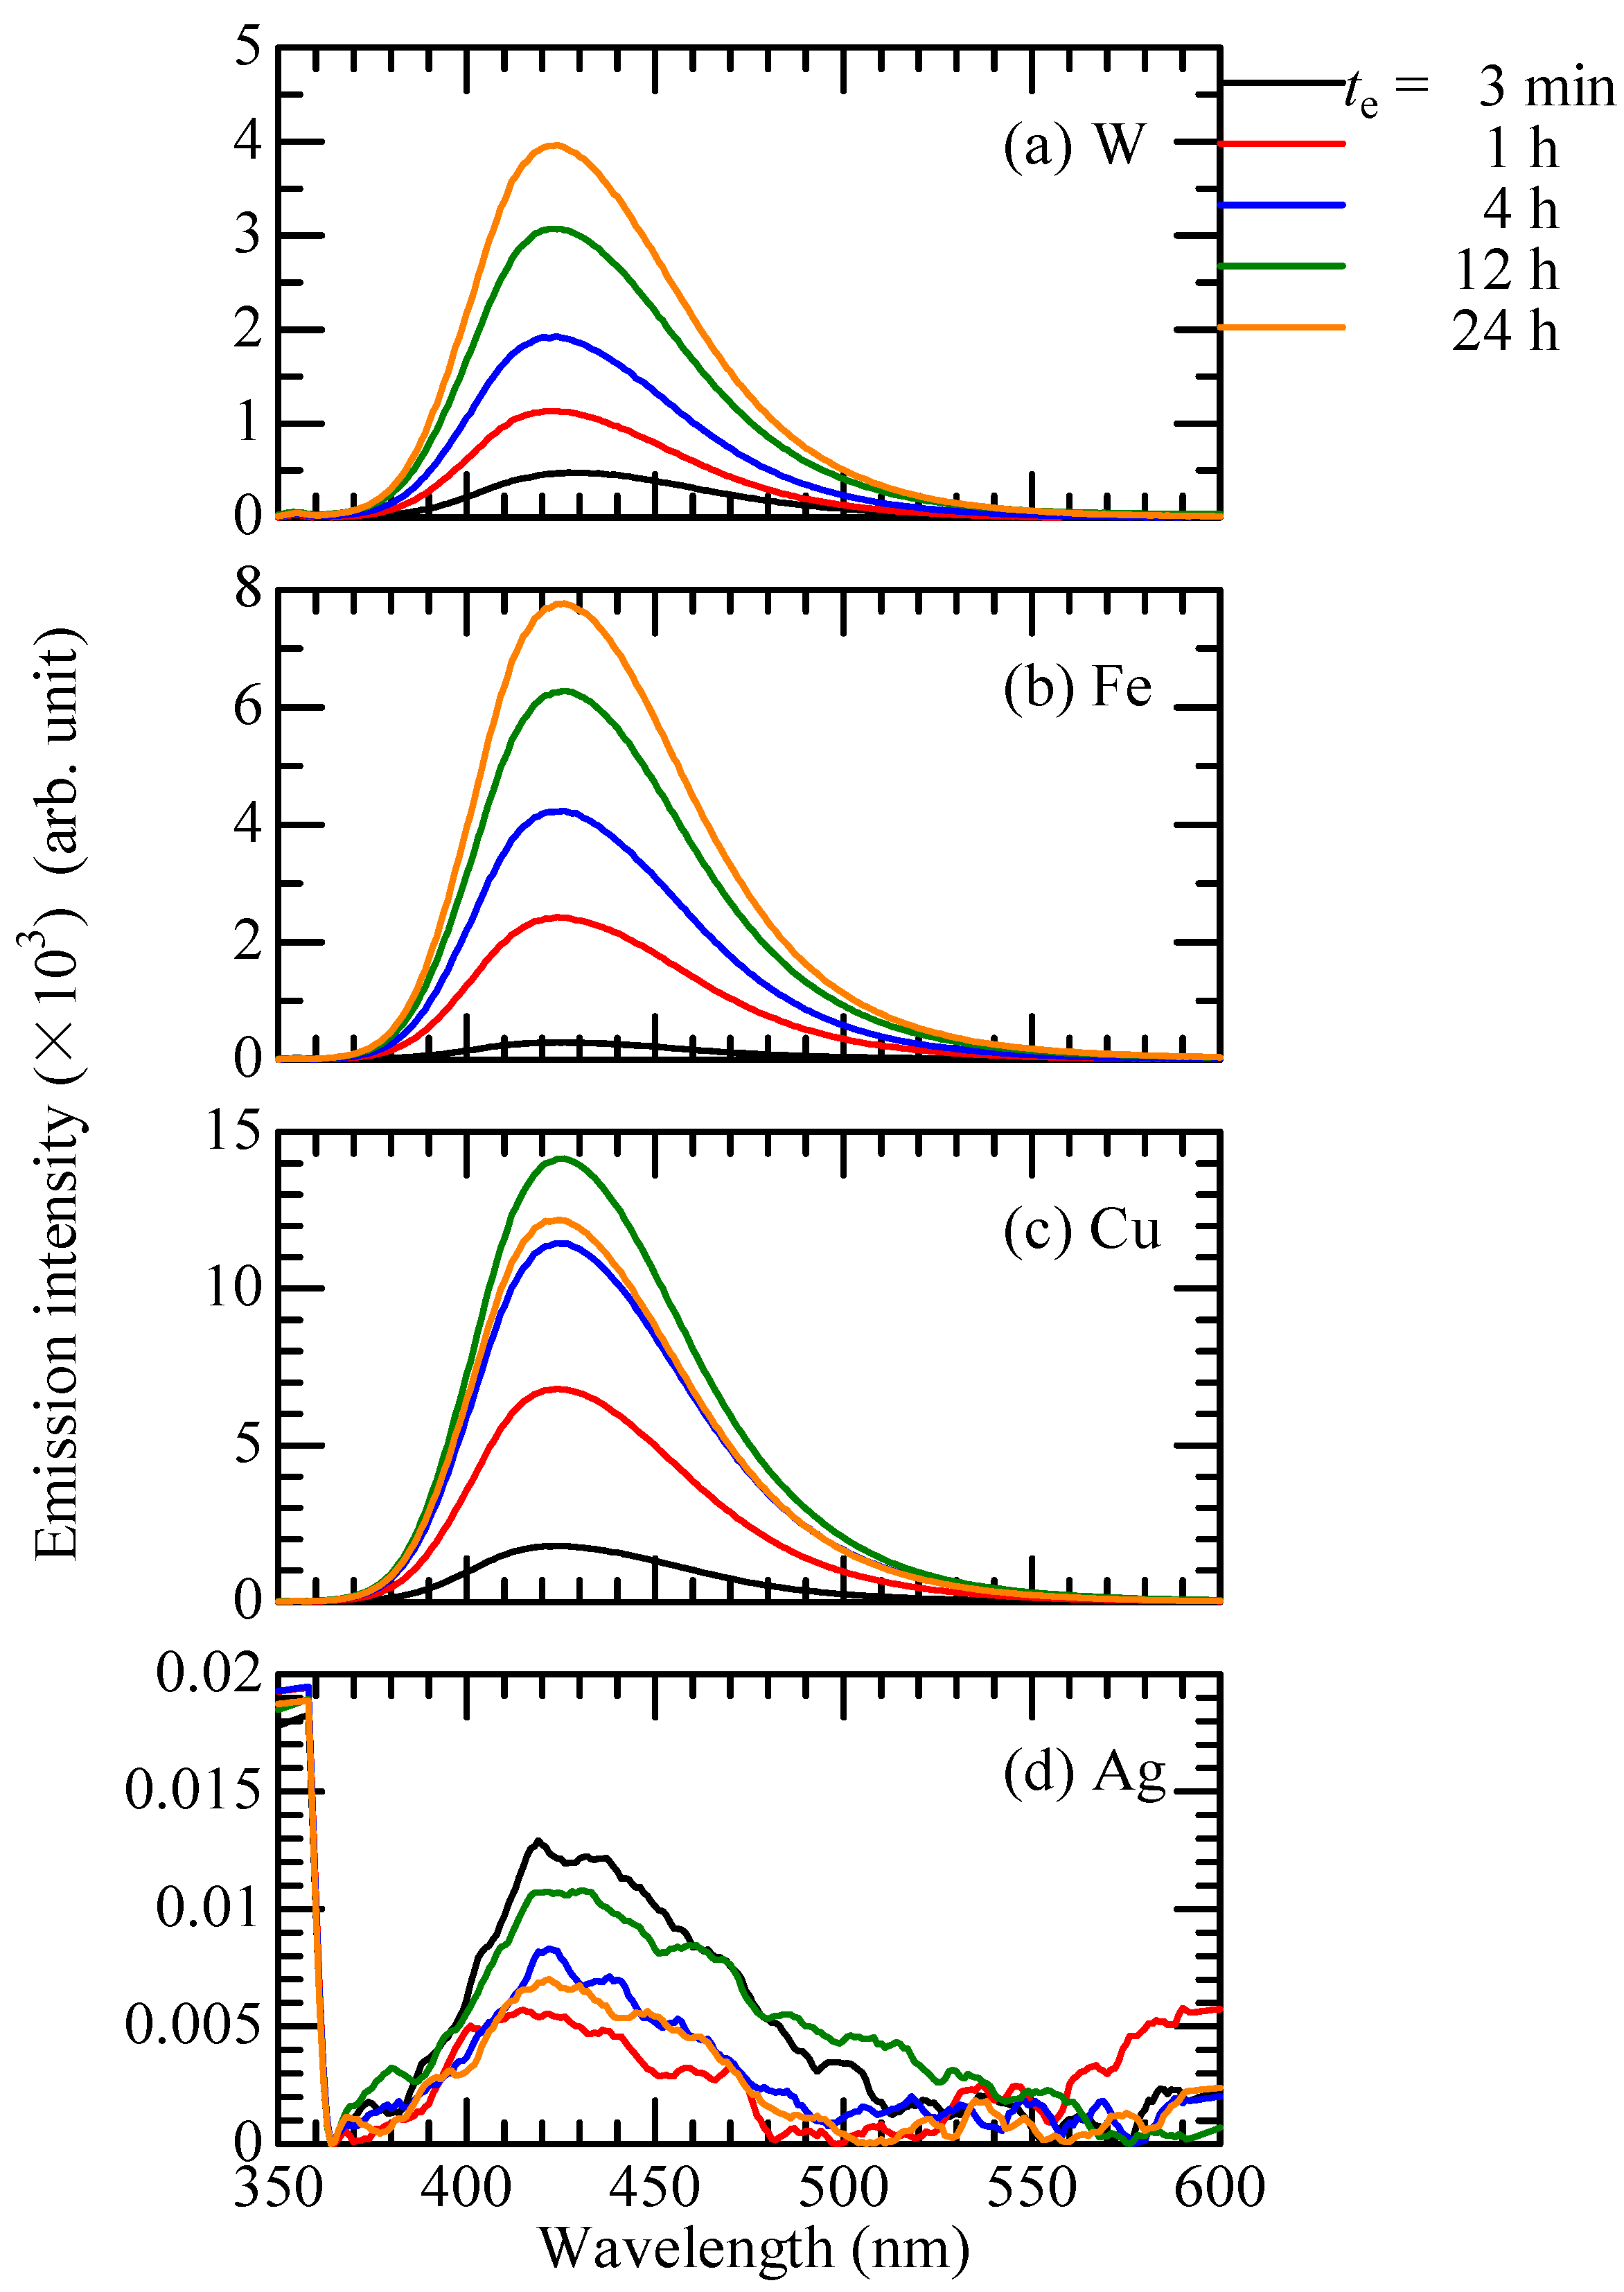
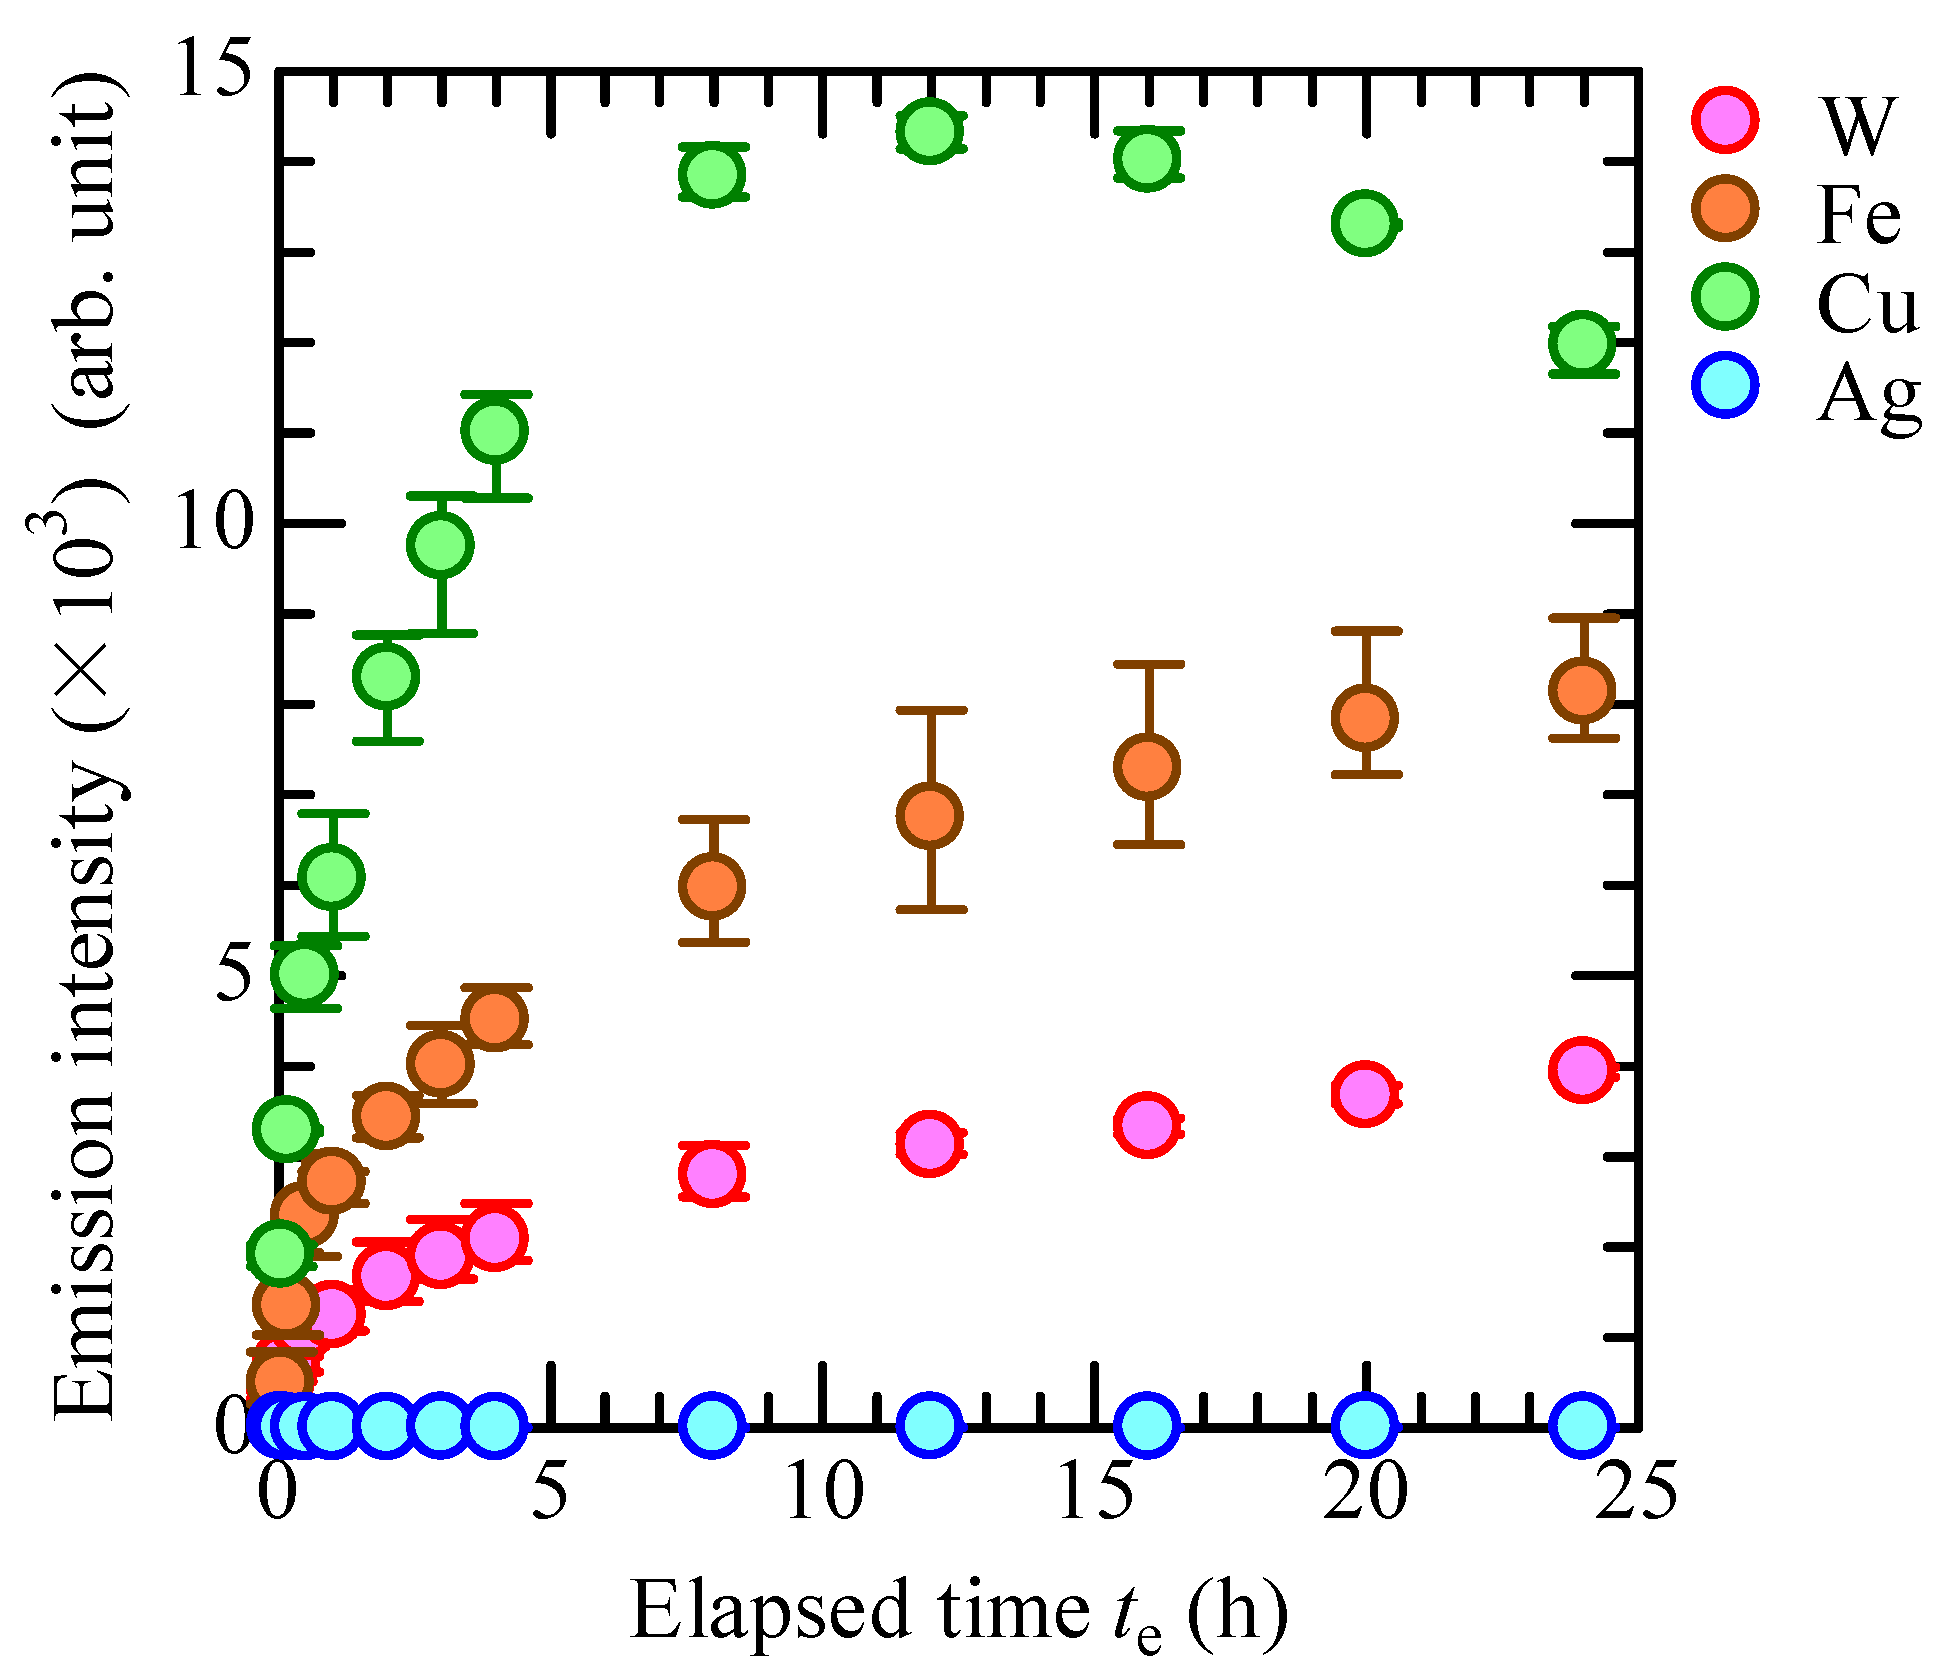
Figure 9 shows the fluorescence spectrum of CBPTW with NaTA. Figure 9a shows that the fluorescence spectrum of CBPTW(W) has a single peak at 425 nm and that the fluorescence intensity increases with increasing elapsed time, centered at 425 nm. Figure 9b shows that the fluorescence spectrum of CBPTW(Fe) shows the same increasing trend as that of CBPTW(W), while Figure 9c shows that the fluorescence intensity of CBPTW(Cu) is smaller at te = 24 h than that at te = 12 h. On the other hand, the fluorescence intensity of CBPTW(Ag) hardly changes regardless of the elapsed time as shown in Figure 9d. Figure 10 shows that the peak value at 425 nm, read from the spectrum in Figure 9, as a function of elapsed time. The fluorescence peak value of CBPTW(W) is 430 at te = 3 min and increases with increasing elapsed time, reaching 3900 at te = 24 h. The fluorescence peak value of CBPTW(Fe) shows a similar increasing trend as CBPTW(W), reaching 8100 at te = 24 h. The fluorescence peak value of CBPTW(Cu) increases until te = 12 h and is 14,300, and then decreases with increasing elapsed time to 12,000 at te = 24 h. On the other hand, the fluorescence peak value of CBPTW(Ag) remains almost unchanged at about 10 regardless of the elapsed time. The amount of OH radicals formed in CBPTW(Cu) was highest, followed by CBPTW(Fe), CBPTW(W), and CBPTW(Ag), in that order. This trend correlates with the decrease in H2O2 concentration shown in Figure 4, suggesting a relationship between H2O2 concentration and OH radical production. The decrease in fluorescence intensity observed in CBPTW(Cu) can be attributed to quenching effects caused by Cu2+ ions. Previous studies have shown that increased Cu2+ concentrations reduce HTA fluorescence, likely due to complex formation or other quenching interactions [15]. Such effects complicate radical detection and may lead to underestimation of actual hydroxyl radical levels in samples with high transition metal content. Notwithstanding, the superior catalytic activity of copper ions likely explains the elevated hydroxyl radical generation observed with Cu electrodes.
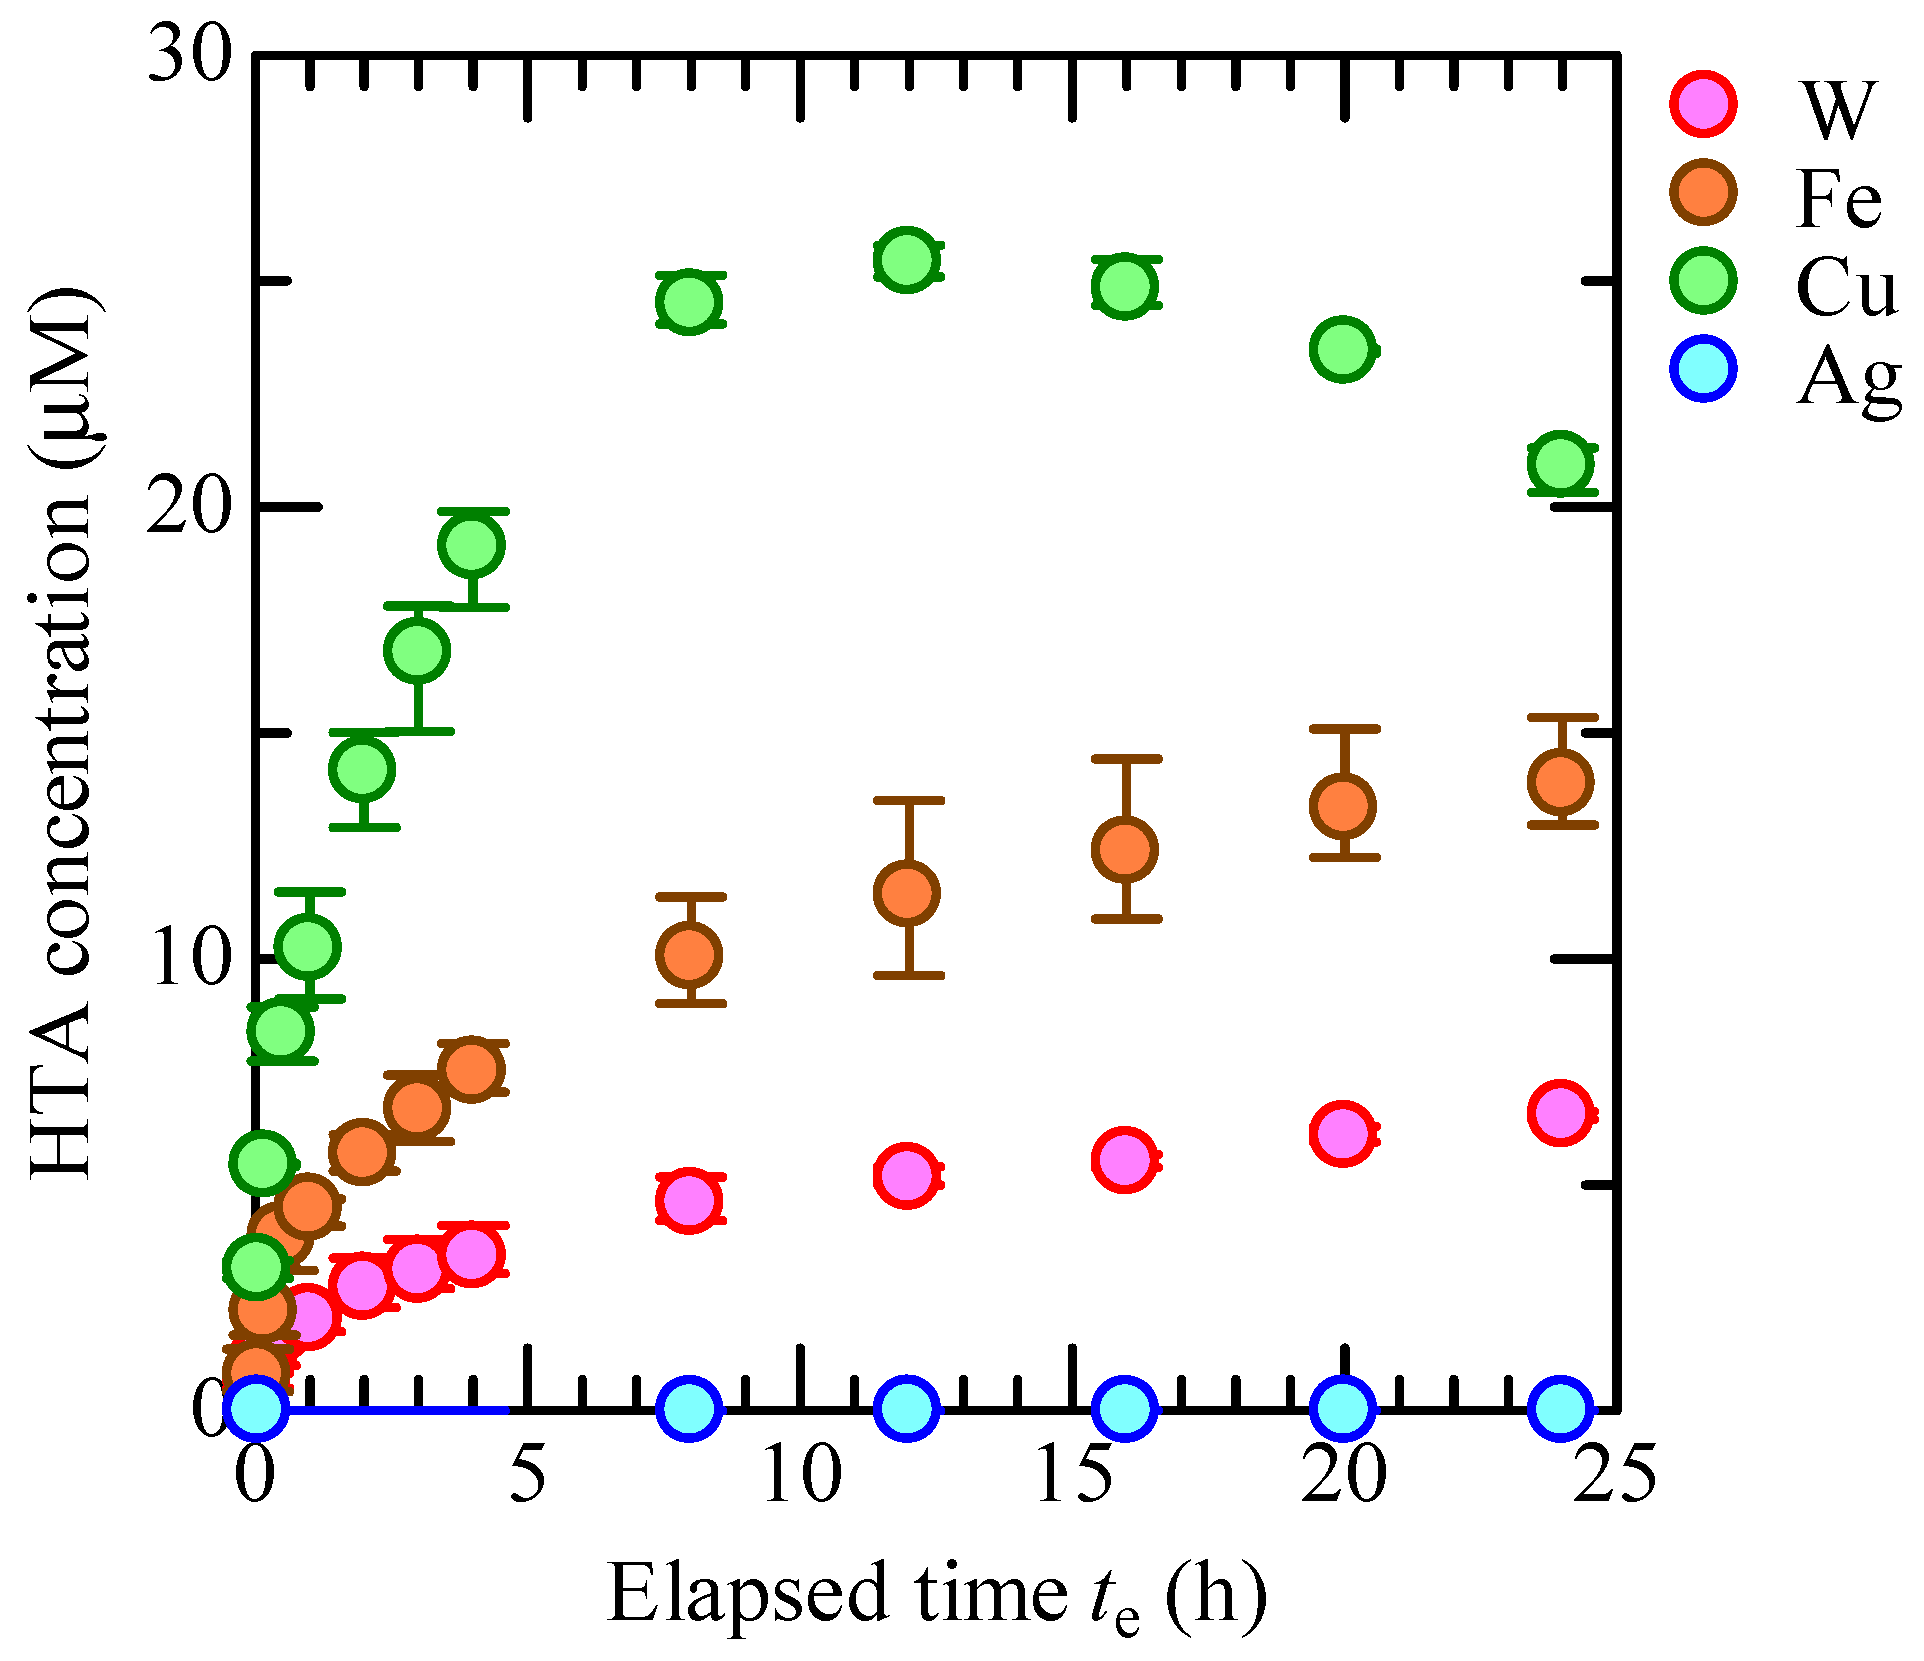
Using the HTA calibration curve shown in Figure 8, the fluorescence peak values shown in Figure 10 were converted to HTA concentrations and are shown in Figure 11. Figure 11 shows that the HTA concentrations produced in CBPTW(W), CBPTW(Fe), CBPTW(Cu), and CBPTW(Ag) are 6.5, 13.9, 20.9, and 0 mM at te = 24 h, respectively. It should be emphasized that the values shown are estimated based on HTA fluorescence as a proxy indicator, influenced by factors such as NaTA concentration and quenching effects by transition metal ions, and are therefore not absolute direct measurements of OH radicals. Assuming an assumed OH radical yield of 35% [10,16], the estimated quantities of OH radicals produced by te = 24 h in CBPTW(W), CBPTW(Fe) and CBPTW(Cu) are 2.3, 4.9 and 7.3 mM, respectively. However, the measured values may differ from the actual amount produced due to the concentration of the scavenger NaTA and the presence of transition metal ions [15,17].
Previous studies have extensively investigated hydroxyl radical and hydrogen peroxide formation via ultrasonic cavitation [18,19,20,21]. In contrast, the present study does not employ any ultrasound; all experiments employ only plasma discharge within cavitation bubbles. Therefore, the radical formation and oxidative processes observed here are solely attributed to plasma, not to sonochemical mechanisms. On the other hand, this experiment suggests that OH radicals are generated in CBPTW during storage after plasma and cavitation treatment. Metal ions and H2O2 may be involved in the reaction; however, further studies involving direct addition of metal nanoparticles or ions, use of chelators, and kinetic analyses are required to conclusively elucidate the reaction mechanism. Moreover, by adopting a more accurate method for investigating the metal state, deeper insights into CBPTW reaction may be obtained.

4. Conclusions

This study demonstrates the continuous generation of hydroxyl radicals in cavitation bubble plasma treated water using W, Fe, and Cu electrodes, with the production rate following the order Cu > Fe > W. The continuous generation of hydroxyl radicals in cavitation bubble plasma treated water is likely due to the catalytic decomposition of hydrogen peroxide by metal nanoparticles or ions released from the electrodes. Our findings clearly demonstrate that electrode material selection critically influences reactive oxygen species generation in cavitation bubble plasma treated water. This insight opens promising avenues for developing environmentally friendly water purification and sterilization technologies. Nonetheless, further direct experimental studies are necessary to fully elucidate the underlying catalytic mechanisms and to realize practical applications.

Author Contributions

Conceptualization, K.K. and Y.O.; methodology, K.K. and Y.O.; validation, K.K.; resources, Y.O.; data curation, K.K.; writing—original draft preparation, K.K.; writing—review and editing, Y.O.; supervision, Y.O. All authors have read and agreed to the published version of the manuscript.

Funding

This research received no external funding.

Data Availability Statement

The raw data supporting the conclusions of this article will be made available by the authors on request.

Conflicts of Interest

The authors declare no conflicts of interest.

References

  1. Jiang, S.; Wu, W.Y.; Ren, F.; Hsu, C.H.; Zhang, X.; Gao, P.; Wuu, D.S.; Huang, C.J.; Lien, S.Y.; Zhu, W. Growth of GaN Thin Films Using Plasma Enhanced Atomic Layer Deposition: Effect of Ammonia-Containing Plasma Power on Residual Oxygen Capture. Int. J. Mol. Sci. 2022, 23, 16204. [Google Scholar] [CrossRef]
  2. Cardinaud, C.; Peignon, M.C.; Tessier, P.Y. Plasma etching: Principles, mechanisms, application to micro- and nano-technologies. Appl. Surf. Sci. 2000, 164, 72. [Google Scholar] [CrossRef]
  3. Hayashi, N.; Ono, R.; Shiratani, M. Antioxidative activity and growth regulation of Brassicaceae induced by oxygen radical irradiation. Jpn. J. Appl. Phys. 2015, 54, 06D01. [Google Scholar] [CrossRef]
  4. Barjaste, A.; Dehghani, Z.; Dehghani, P.; Kaushik, N.; Choi, E.H.; Kaushik, N.K. Recent Progress in Applications of Non-Thermal Plasma for Water Purification, Bio-Sterilization, and Decontamination. Appl. Sci. 2021, 11, 3372. [Google Scholar] [CrossRef]
  5. Anpilov, A.M.; Barkhudarov, E.M.; Bark, Y.B.; Zadiraka, Y.V.; Christofi, M.; Kozlov, Y.N.; Kossyi, I.A.; Kop’ev, V.A.; Silakov, V.P.; Taktakisvili, M.I.; et al. Electric Discharge in Water as a Source of UV Radiation, Ozone and Hydrogen Peroxide. J. Phys. D Appl. Phys. 2001, 34, 933–999. [Google Scholar] [CrossRef]
  6. Lukes, P.; Locke, B.R. Plasmachemical Oxidation Processes in a Hybrid Gas-Liquid Electrical Discharge Reactor. J. Phys. D Appl. Phys. 2005, 38, 4074–4081. [Google Scholar] [CrossRef]
  7. Miyamoto, I.; Maehara, T.; Miyaoka, H.; Onishi, S.; Mukasa, S.; Toyota, H.; Kuramoto, M.; Nomura, S.; Kawashima, A. Effect of the Temperature of Water on the Degradation of Methylene Blue by the Generation of Radio Frequency Plasma in Water. J. Plasma Fusions Res. Series. 2009, 8, 627. [Google Scholar]
  8. Oka, Y.; Kuroshima, T.; Sawachika, K.; Yamashita, M.; Sakao, M.; Ohnishi, K.; Asami, K.; Yatsuzuka, M. Preparation of Silver Nanocolloidal Solution by Cavitation Bubble Plasma. Vacuum 2019, 167, 530–535. [Google Scholar] [CrossRef]
  9. Čech, J.; Sťahel, P.; Ráheľ, J.; Prokeš, L.; Rudolf, P.; Maršálková, E.; Maršálek, B. Mass Production of Plasma Activated Water: Case Studies of Its Biocidal Effect on Algae and Cyanobacteria. Water 2020, 12, 3167. [Google Scholar] [CrossRef]
  10. Sahni, M.; Locke, B.R. Quantification of Hydroxyl Radicals Produced in Aqueous Phase Pulsed Electrical Discharge Reactors. Ind. Eng. Chem. Res. 2006, 45, 5819–5825. [Google Scholar] [CrossRef]
  11. Santos, I.C.M.S.; Paz, F.A.A.; Simões, M.M.Q.; Neves, M.G.P.M.S.; Cavaleiro, J.A.S.; Klinowski, J.; Cavaleiro, A.M.V. Catalytic Homogeneous Oxyfunctionalization with Hydrogen Peroxide in the Presence of a Peroxotungstate. Appl. Catal. A 2008, 351, 166–173. [Google Scholar] [CrossRef]
  12. Yang, M.; Zhang, X.; Grosjean, A.; Soroka, I.; Jonsson, M. Kinetics and Mechanism of the Reaction between H2O2 and Tungsten Powder in Water. J. Phys. Chem. C 2015, 119, 22560–22569. [Google Scholar] [CrossRef]
  13. Moffett, J.W.; Zika, R.G. Reaction Kinetics of Hydrogen Peroxide with Copper and Iron in Seawater. Environ. Sci. Technol. 1987, 21, 804–810. [Google Scholar] [CrossRef]
  14. Pędziwiatr, P.; Mikołajczyk, F.; Zawadzki, D.; Mikołajczyk, K.; Bedka, A. Decomposition of Hydrogen Peroxide-Kinetics and Review of Chosen Catalysts. Acta Innov. 2018, 26, 45–52. [Google Scholar] [CrossRef]
  15. Gonzalez, D.H.; Kuang, X.M.; Scott, J.A.; Rocha, G.O.; Paulson, S.E. Terephthalate Probe for Hydroxyl Radicals: Yield of 2-Hydroxy Terephthalic Acid and Transition Metal Interference. Anal. Lett. 2018, 51, 2488–2497. [Google Scholar] [CrossRef]
  16. Kanazawa, S.; Furuki, T.; Nakaji, T.; Akamine, S.; Ichiki, R. Application of Chemical Dosimetry to Hydroxyl Radical Measurement During Underwater Discharge. J. Phys. Conf. Ser. 2013, 418, 012102. [Google Scholar] [CrossRef]
  17. Page, S.E.; Arnold, W.A.; McNeill, K. Terephthalate as a Probe for Photochemically Generated Hydroxyl Radical. J. Environ. Monit. 2010, 12, 1658–1665. [Google Scholar] [CrossRef] [PubMed]
  18. Gong, C.; Hart, D.P. Ultrasound Induced Cavitation and Sonochemical Yields. J. Acoust. Soc. Am. 1998, 104, 2675–2682. [Google Scholar] [CrossRef]
  19. Sazgarnia, A.; Shanei, A. Evaluation of Acoustic Cavitation in Terephthalic Acid Solutions Containing Gold Nanoparticles by the Spectrofluorometry Method. Int. J. Photoenergy 2012, 2012, 376047. [Google Scholar] [CrossRef]
  20. Ziembowicz, S.; Kida, M.; Koszelnik, P. Sonochemical Formation of Hydrogen Peroxide. Proceedings 2017, 2, 188. [Google Scholar] [CrossRef]
  21. Weissler, A. Formation of Hydrogen Peroxide by Ultrasonic Waves: Free Radicals. J. Am. Chem. Soc. 1958, 81, 1077–1081. [Google Scholar] [CrossRef]
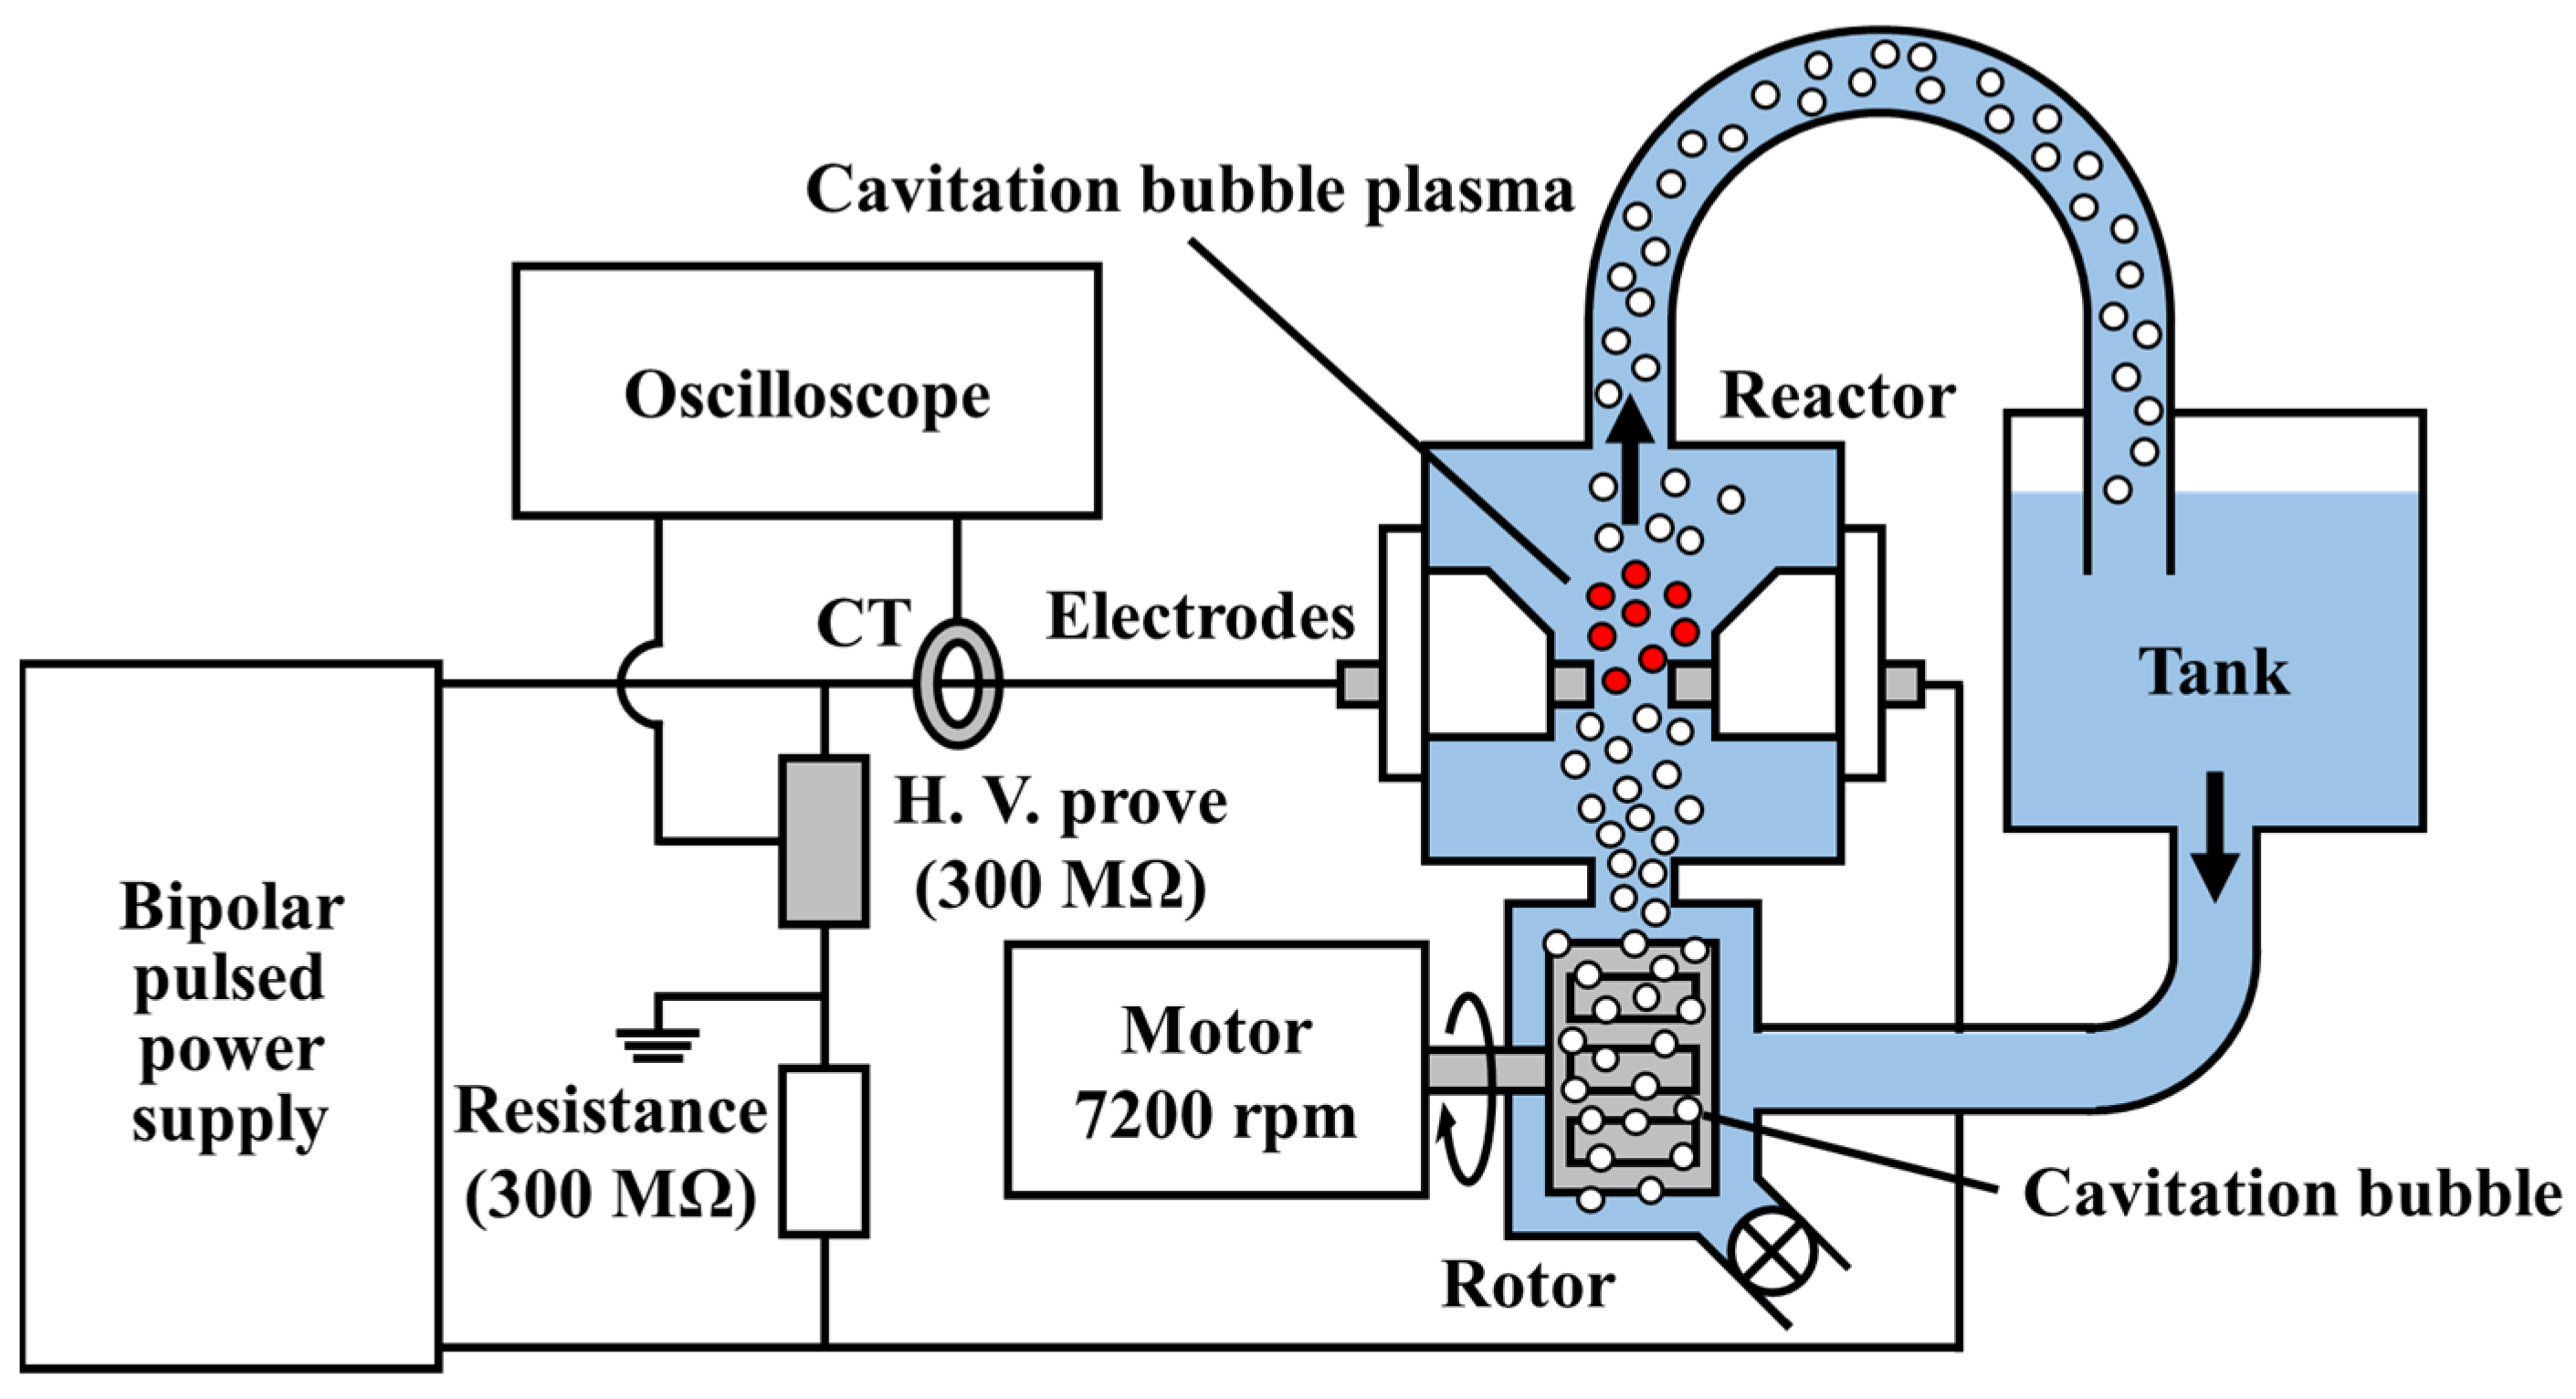
Figure 1. Schematic diagram of CBP apparatus for preparation of CBPTW.
Liquids 05 00026 g001
Figure 2. Reaction of disodium terephthalate (NaTA) with OH radicals to form 2-hydroxyterephthalic acid (HTA).
Liquids 05 00026 g002
Figure 3. Metal concentration of CBPTW prepared using W, Fe, Cu, and Ag electrodes, respectively.
Liquids 05 00026 g003
Figure 4. H2O2 concentration in CBPTW as a function of storage time, where the red, brown, green, blue points indicate the H2O2 concentration in CBPTW prepared using W, Fe, Cu, and Ag electrodes, respectively.
Liquids 05 00026 g004
Figure 5. Concentration of metal ions in CBPTW prepared using Fe and Cu electrodes as a function of storage time, where Fe2+ was below the detection limit (<0.1 ppm) and is therefore not presented.
Liquids 05 00026 g005
Figure 6. Fluorescence spectra of HTA solutions at various pH, where the black, red, and blue lines indicate fluorescence spectra of HTA solutions at pH = 4.1, 7.6, and 10.6, respectively; HTA concentration is 1 mM.
Liquids 05 00026 g006
Figure 7. Peak wavelength and fluorescence intensity in HTA solutions as a function of pH, where the black and red point indicate the peak wavelength and fluorescence intensity in HTA solutions; HTA concentration is 1 mM.
Liquids 05 00026 g007
Figure 8. HTA calibration curve, linearly approximated in the range of 0–20 µM.
Liquids 05 00026 g008
Figure 9. Fluorescence spectra of CBPTW with NaTA, where CBPTW is prepared using (a) W electrodes, (b) Fe electrodes, (c) Cu electrodes, and (d) Ag electrodes, respectively; excitation wavelength is 315 nm and NaTA concentration is 0.5 mM.
Liquids 05 00026 g009
Figure 10. Fluorescence peak values of CBPTW as a function of elapsed time, where the red, brown, green, blue points indicate the fluorescence peak values of CBPTW prepared using W, Fe, Cu, and Ag electrodes, respectively; excitation wavelength is 315 nm, fluorescence peak wavelength is 425 nm, and NaTA concentration is 0.5 mM.
Liquids 05 00026 g010
Figure 11. HTA concentrations of CBPTW as a function of elapsed time, where the red, brown, green, blue points indicate the HTA concentration values of CBPTW prepared using W, Fe, Cu, and Ag electrodes, respectively; excitation wavelength is 315 nm, fluorescence peak wavelength is 425 nm, and NaTA concentration is 0.5 mM.
Liquids 05 00026 g011
Disclaimer/Publisher’s Note: The statements, opinions and data contained in all publications are solely those of the individual author(s) and contributor(s) and not of MDPI and/or the editor(s). MDPI and/or the editor(s) disclaim responsibility for any injury to people or property resulting from any ideas, methods, instructions or products referred to in the content.