1. Introduction
The release of carbon dioxide (CO
2) into the atmosphere has adverse environmental consequences, since it contributes to the greenhouse effect, leading to global warming [
1]. Substantial cuts in CO
2 emissions are imperative within the industrial and energy sectors to reduce greenhouse gas emissions significantly by 2050 [
2].
Due to their distinctive attributes, ionic liquids (ILs) are considered viable solvents in gas-sweetening operations. Their attributes include notable capacity for CO
2 absorption and lower co-absorption of methane and ethane, low vapor pressure, chemical stability, a broad range of operational temperatures in a liquid state, and adaptability. Two fundamental categories of ILs exist: task-specific ILs (TSILs) and room-temperature ILs (RTILs). The principal contrast between these two types of sorbents lies in their absorption mechanisms. While RTILs follow conventional physical gas absorption governed by Henry’s Law, TSILs exhibit a dual absorption mechanism, encompassing both physical and chemical processes, potentially enabling them to capture more CO
2 [
2].
Over time, multiple technologies have been employed to reduce carbon dioxide emissions. Among these approaches is the process of carbon dioxide capture and storage (CCS), which utilizes a blend of aqueous amines in commercial plants. However, these solvents have several disadvantages, such as high cost, volatility, substantial energy consumption, and corrosive nature [
3,
4]. ILs are unique salts that exist as liquids at ambient temperature, a characteristic that is well-suited for various applications, and are gaining popularity as environmentally friendly and reusable absorbents for capturing CO
2. These non-volatile ILs are more ecologically sustainable than traditional organic solvents [
5]. They are composed of anions and cations. Their extremely low vapor pressure, which makes them eco-friendly, has earned them the name “Green Solvents” [
6]. One of the fundamental features of ILs is their ability to customize properties like density, conductivity, viscosity, hydrophobicity, gas solubility, and hydrogen-bonding capability by modifying the type of constituent ions or functionalizing them. This adaptability allows ILs to find extensive applications in various industrial sectors [
1].
Selection of Ionic Liquids
Analyzing a set of 2701 ionic liquids at the molecular level identified three promising triflate-based ionic liquids chosen for this research. The study also explored the relationships between Henry’s Law constants and the properties of these ionic liquids. Utilizing COSMO-RS (COnductorlike Screening Model for Real Solvents), our research group employed a thermodynamic approach to predict the Henry’s Law constants for CO
2, CH
4, and N
2 [
7]. The obtained values and the polarity parameters of the cations and anions used to explain CO
2–IL interactions will be discussed in the next section.
2. Materials and Methods
2.1. Materials
Information about the solvents used in this study is listed in
Table 1.
2.2. Solubility Measurement
This work describes experiments investigating gas solubility in ionic liquids using an IGA-003 Intelligent Gravimetric Analyzer (Hiden Isochema Ltd., Warrington, UK). The experiments were computer-aided and performed under elevated pressures reaching up to 1.5 MPa at 343 K. The IGA-003 measured weight changes in an ionic liquid when gas was injected into the system, and these changes were used to determine the solubility.
The setup encompassed diverse elements: an IGA-003 microbalance, a mass flow control, a gas cylinder, a vacuum pump, a pressure control, a functional computer, and a water bath (Polyscience, Niles, IL, USA) to control the temperature. A key aspect of these experiments was accounting for the buoyancy effect on the sample’s weight, as gravitational forces could introduce errors in solubility measurements. A counterbalance container was used to reduce the impact of buoyancy, and a mathematical formula was used to calculate the buoyancy force.
Figure 1 provides a detailed schematic diagram of the IGA-003. The study notes the potential impact of volume expansion at high temperatures and emphasizes the importance of considering sample expansion when calculating solubility. Information about buoyancy and other forces can be found in reference [
8].
2.3. Thermodynamic Modelling
2.3.1. Correlation of the Model
We used the Peng–Robinson Equation of State (PR EoS) to correlate the experimental solubility values of CO
2 in ILs.
The equation provided symbolizes the general Peng–Robinson equations of state. The intermolecular attractive force is denoted by am, and bm represents the van der Waals co-volume factor.
Using different mixing methods, the Peng–Robinson Equation of State (PR EoS) was used to correlate the experimental data [
9].
These rules are the following:
van der Waals one with a single binary interaction parameter (vdWI)
Two binary van der Waals interactions with two parameters (vdWII)
The NRTL model combined with Wong–Sandler mixing rules (WS-NRTL)
2.3.2. Van Der Waals Mixing Rules
The calculation of mixing parameters (a
m and b
m) was carried out using the van der Waals one (vdWI) and van der Waals two (vdWII) mixing methods [
9]. The following equations govern the mixing rules for vdWI and vdWII:
In this context, Equation (2) was employed to compute the combined attractive parameter (a
m). Equation (5) was used to derive the temperature-dependent binary interaction parameter (k
ij), which involves estimation of a
ij. The co-volume factor for the van der Waals one (vdWI) method was determined through Equation (3), and the co-volume for van der Waals two (vdWII) was obtained using Equation (4), where b
ij was calculated according to Equation (6) [
9].
2.3.3. Wong–Sandler Mixing Rule
The model employed Wong–Sandler mixing rules, incorporating the following equations.
In Equations (7) and (8), the parameter of attractive force “a” of the mixture and the co-volume parameter “b” were each given. As indicated, the activity coefficient and excess Gibbs energy were computed using the non-random two liquid (NRTL) model [
9]. The mixing parameters were determined using the binary parameters
,
, where
and
are the NRTL parameters, and
and
represent the interaction energies between molecules “i” and “j”, respectively [
9].
2.4. Critical Property Calculations
The modified Lydersen–Joback–Reid method calculates the ionic liquids’ acentric factor (ω) and critical properties. This method is an extension of Lydersen’s work, which integrated equations for critical pressure (Pc) and volume from Lydersen with those for normal boiling (T
b) and critical temperature (Tc) from Joback and Reid. A notable advantage of this approach is its ability to determine the high-molecular-weight critical properties accurately of ionic liquids [
10]. The three ionic liquids’ critical properties were computed and are shown in
Table 2.
2.5. Optimization of Binary Interaction Parameters
Nath and Sumon coded the thermodynamic model in MATLAB (2017a), utilizing a bubble point algorithm based on the three mixing rules [
9]. As depicted in Equation (20), the simulations involved optimizing the binary interaction parameters to minimize the error in the objective function (Err). These binary interaction parameters were adjusted within the 0.1 to 1.5 MPa pressure range.
2.6. Henry’s Law Constants, Entropy of Solvation, and Enthalpy
We used the solubility data to compute Henry’s Law constants for the three ionic liquids employed in this study. For each temperature, we plotted the fugacity of CO
2 against the mole fractions. Henry’s Law constants were determined by examining the limiting slope of the second-order polynomial dataset.
of the solute (i) in the solvent (j) is represented by the ratio at infinite dilution of the solute’s fugacity (i) to its mole fraction. In this context,
and
indicate the fugacities in the liquid and vapor phases, respectively, while
and
denote the mole fractions of solute (i) in the liquid and vapor phases, respectively, as described in reference [
11]. Assuming only CO
2 is present in the gas phase, Henry’s Law constant is expressed as
Once the Henry’s Law constant is established from the solubility data, the subsequent step involves calculating the enthalpy of solvation (ΔH
∞) at infinite dilution and the entropy of solvation (ΔS
∞) at infinite dilution using the following equations:
In these equations, ΔH∞ represents the enthalpy of solvation at infinite dilution, while ΔS∞ stands for the entropy of solvation at infinite dilution. R denotes the universal gas constant, while H represents Henry’s Law constant.
3. Results
3.1. Densities of the Ionic Liquids
We tested the densities of the three different ionic liquids used in this study at various temperatures ranging from 20 to 70 °C, increasing in 5 °C steps. The measurements were taken at an average atmospheric pressure of 98.5 kPa using an Anton Paar DSA 5000 density meter calibrated with air and water. As expected, the densities of all three liquids decreased as the temperature increased. Among the ILs, [BMIM][TfO] had the highest density, followed by [MBPY][TfO] and [BMP][TfO]. Density data are reported in the
Supplementary Material section (Table S1) and plotted in
Figure 2.
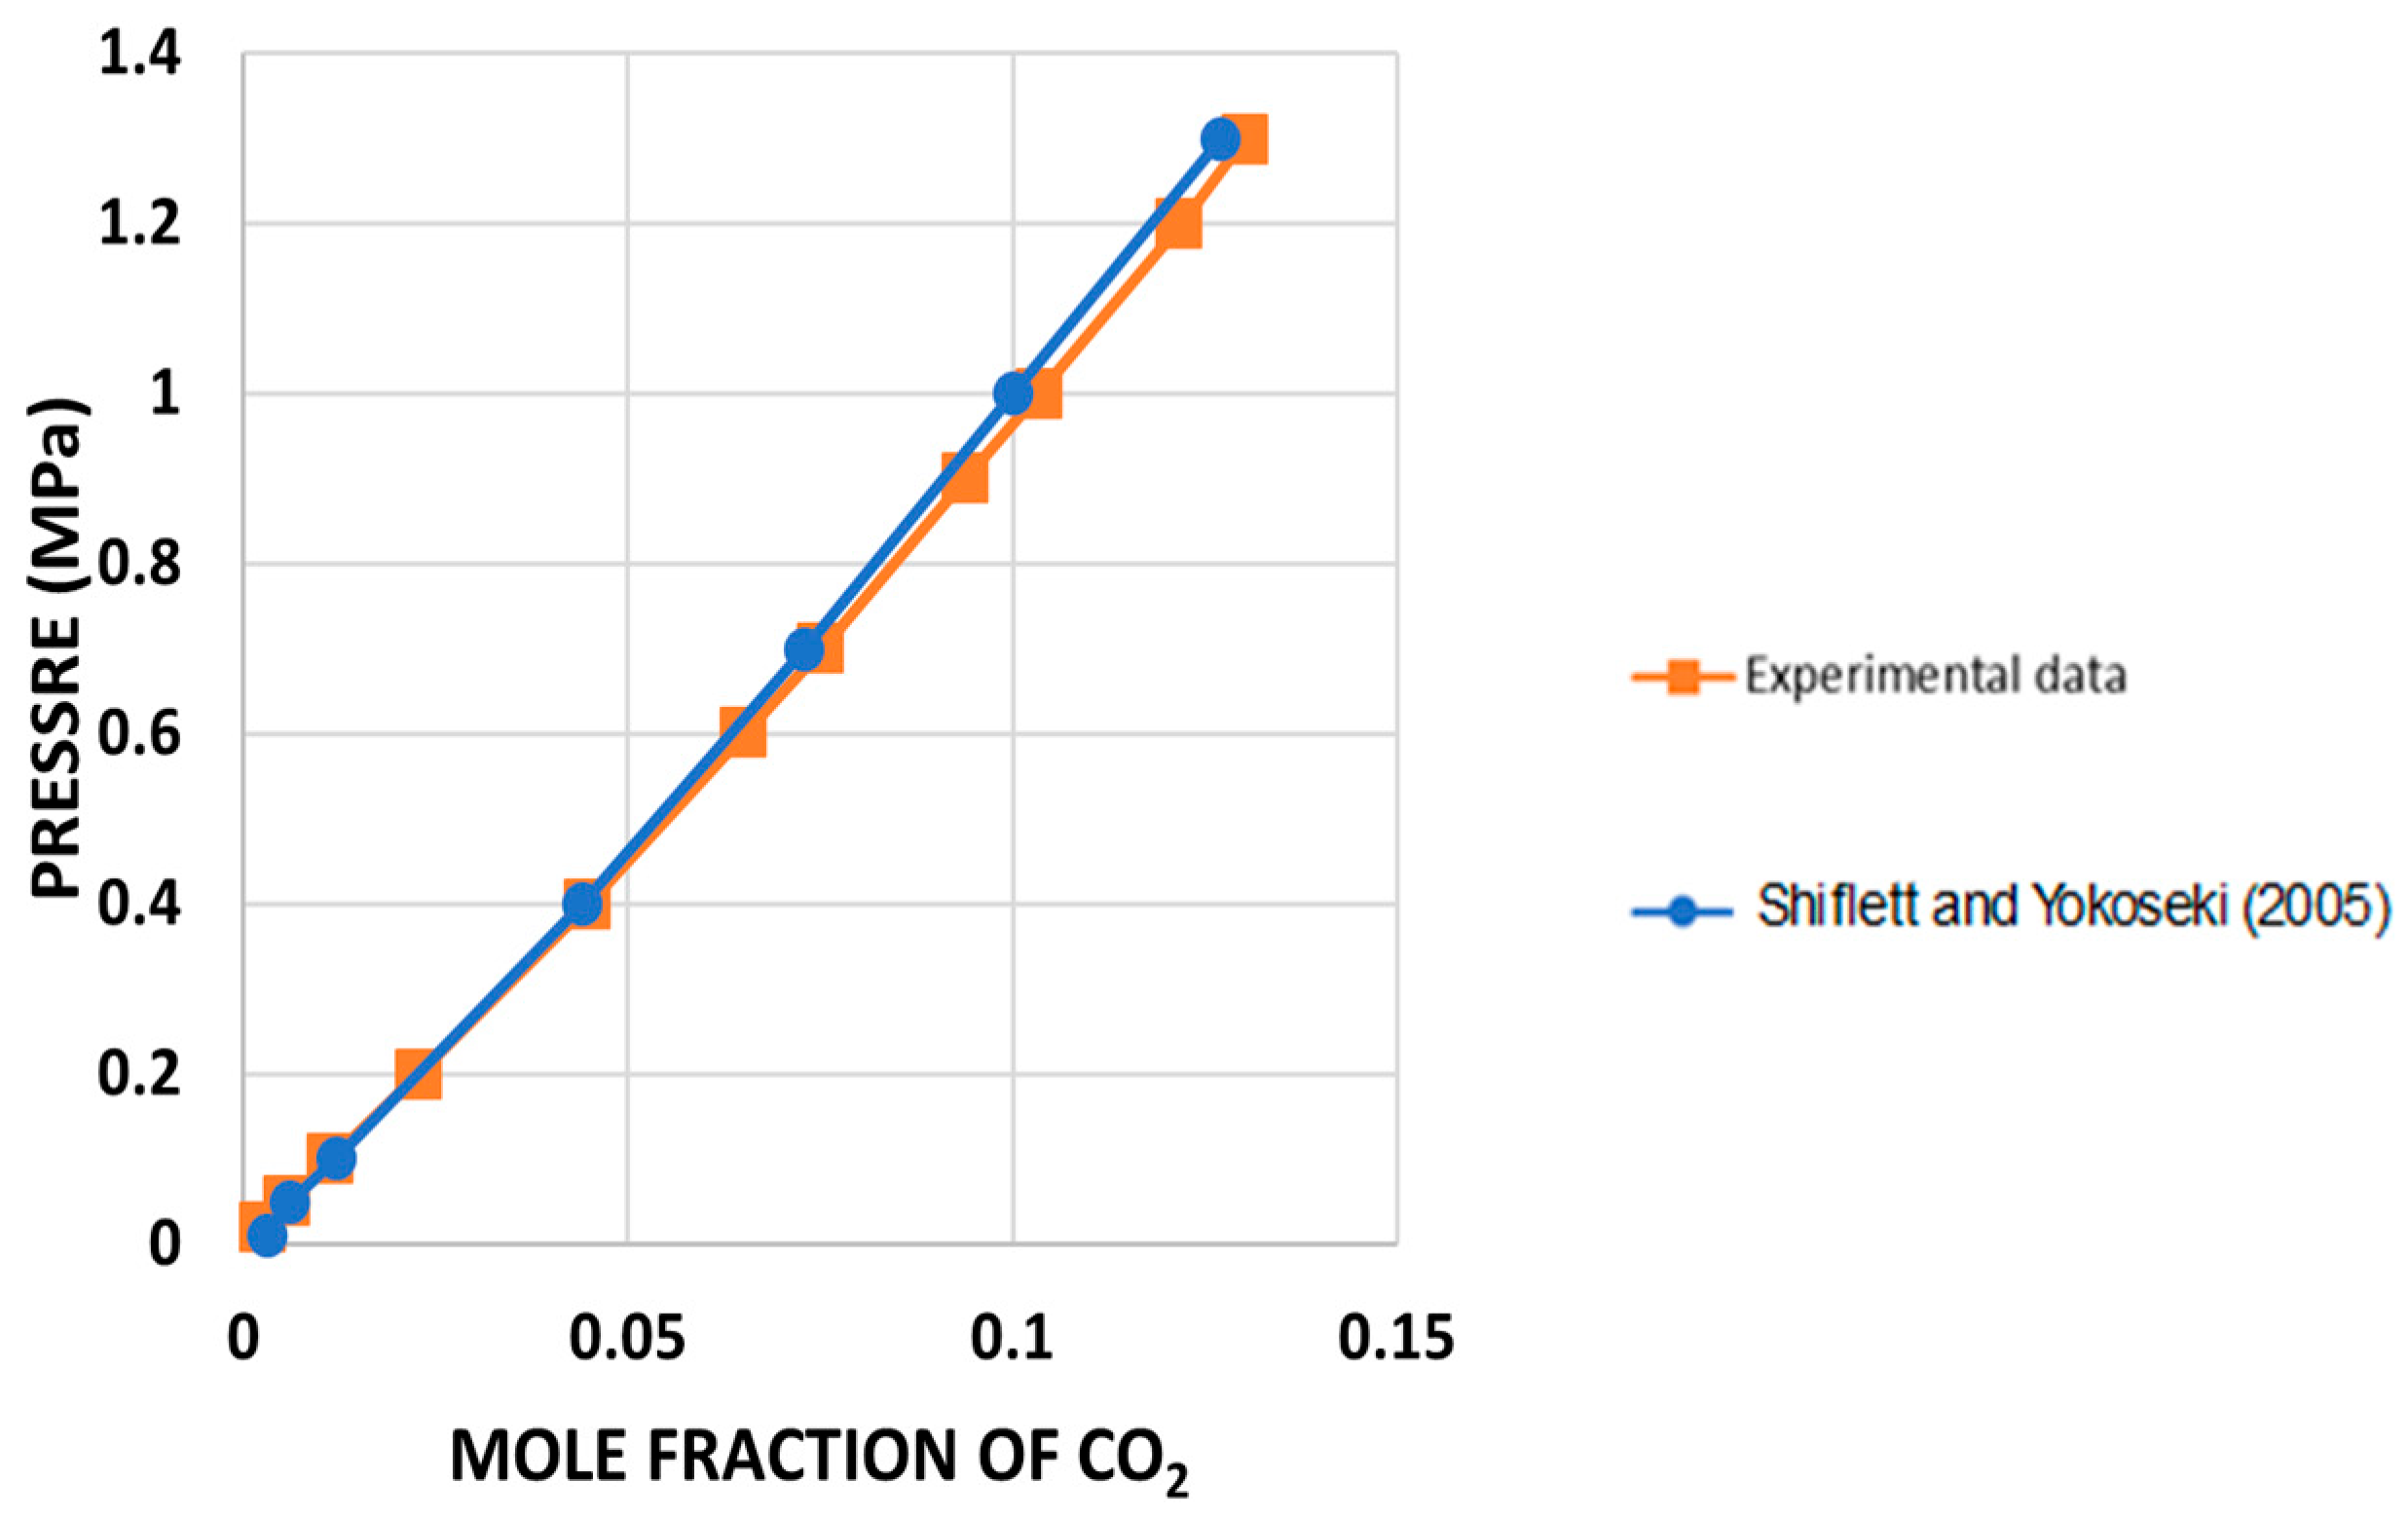
3.2. Validation of the CO2 Solubility Measurements
A validation test was conducted to verify proper operation of the IGA-003 and adherence to the relevant experimental procedures. This validation test employed the ionic liquid [BMIM][BF4] to validate CO
2 solubility at 323.15 K. The experiment’s results were compared with the data published by Shiflett and Yokozeki [
8]. They used the same ionic liquid and provided density information in their literature. The comparison yielded an absolute average deviation (AAD) of 0.024%.
Figure 3 demonstrates a quasi-perfect match between the experimental data and those reported in reference [
8].
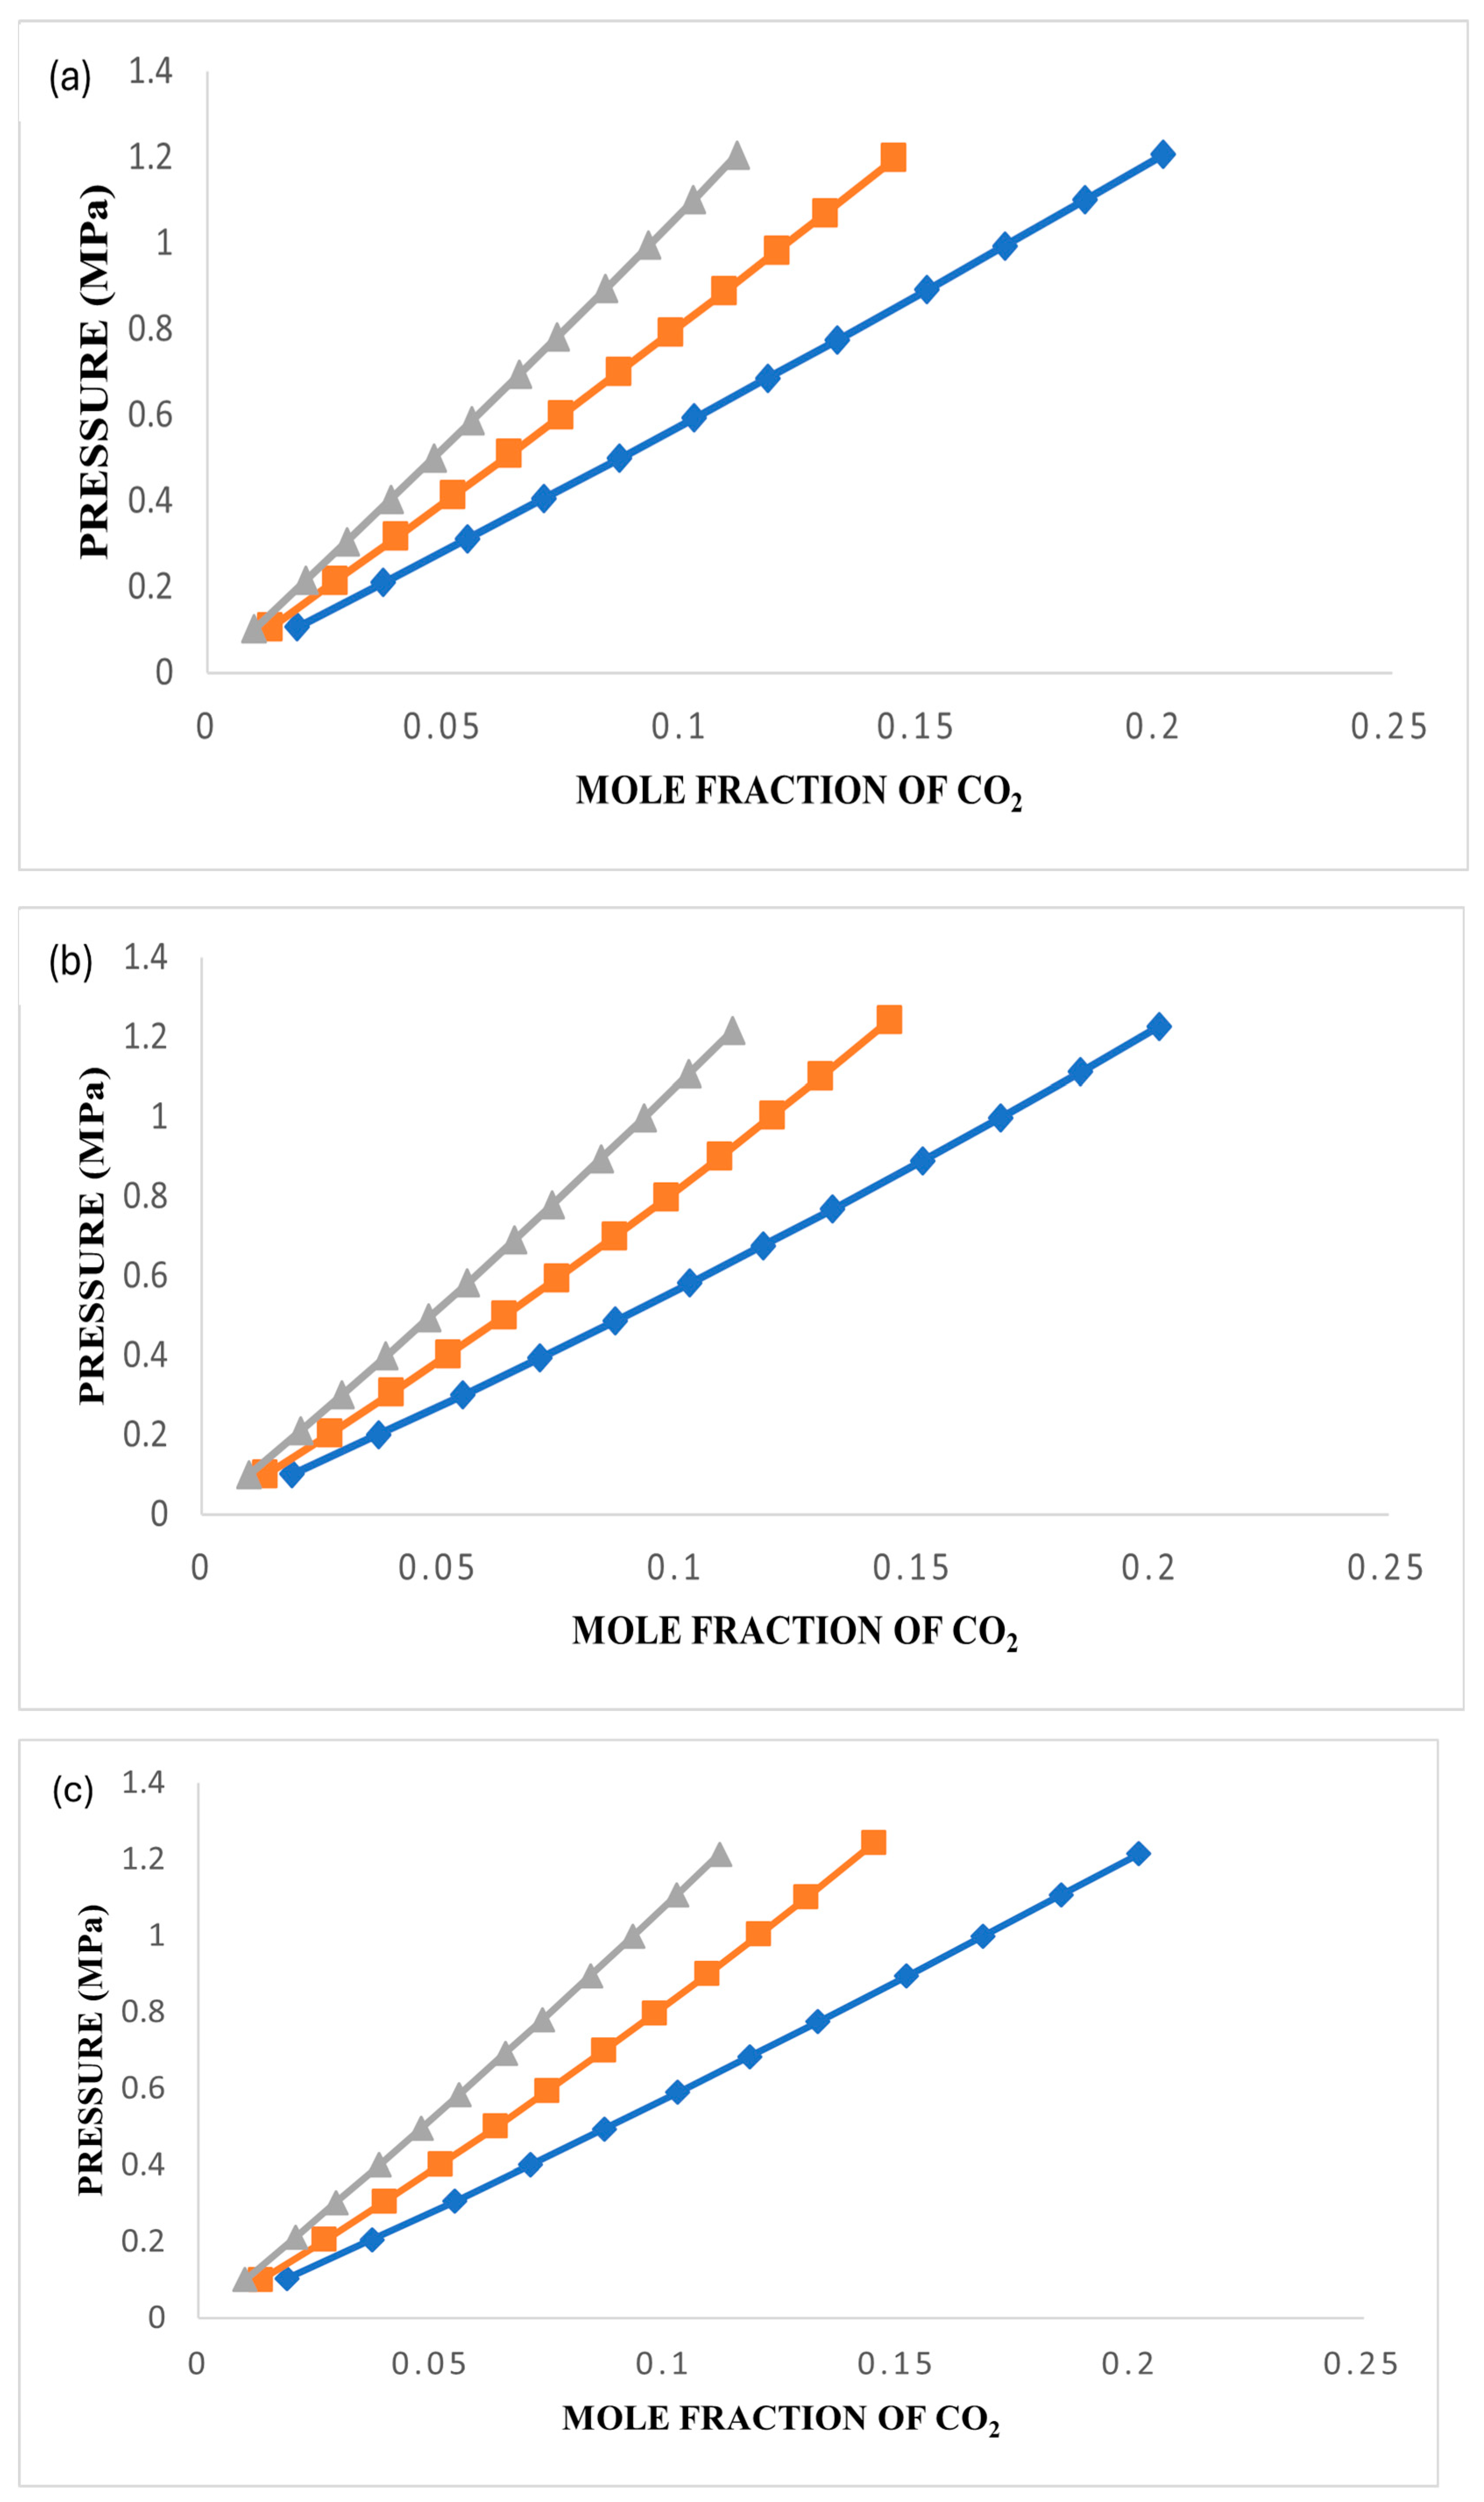
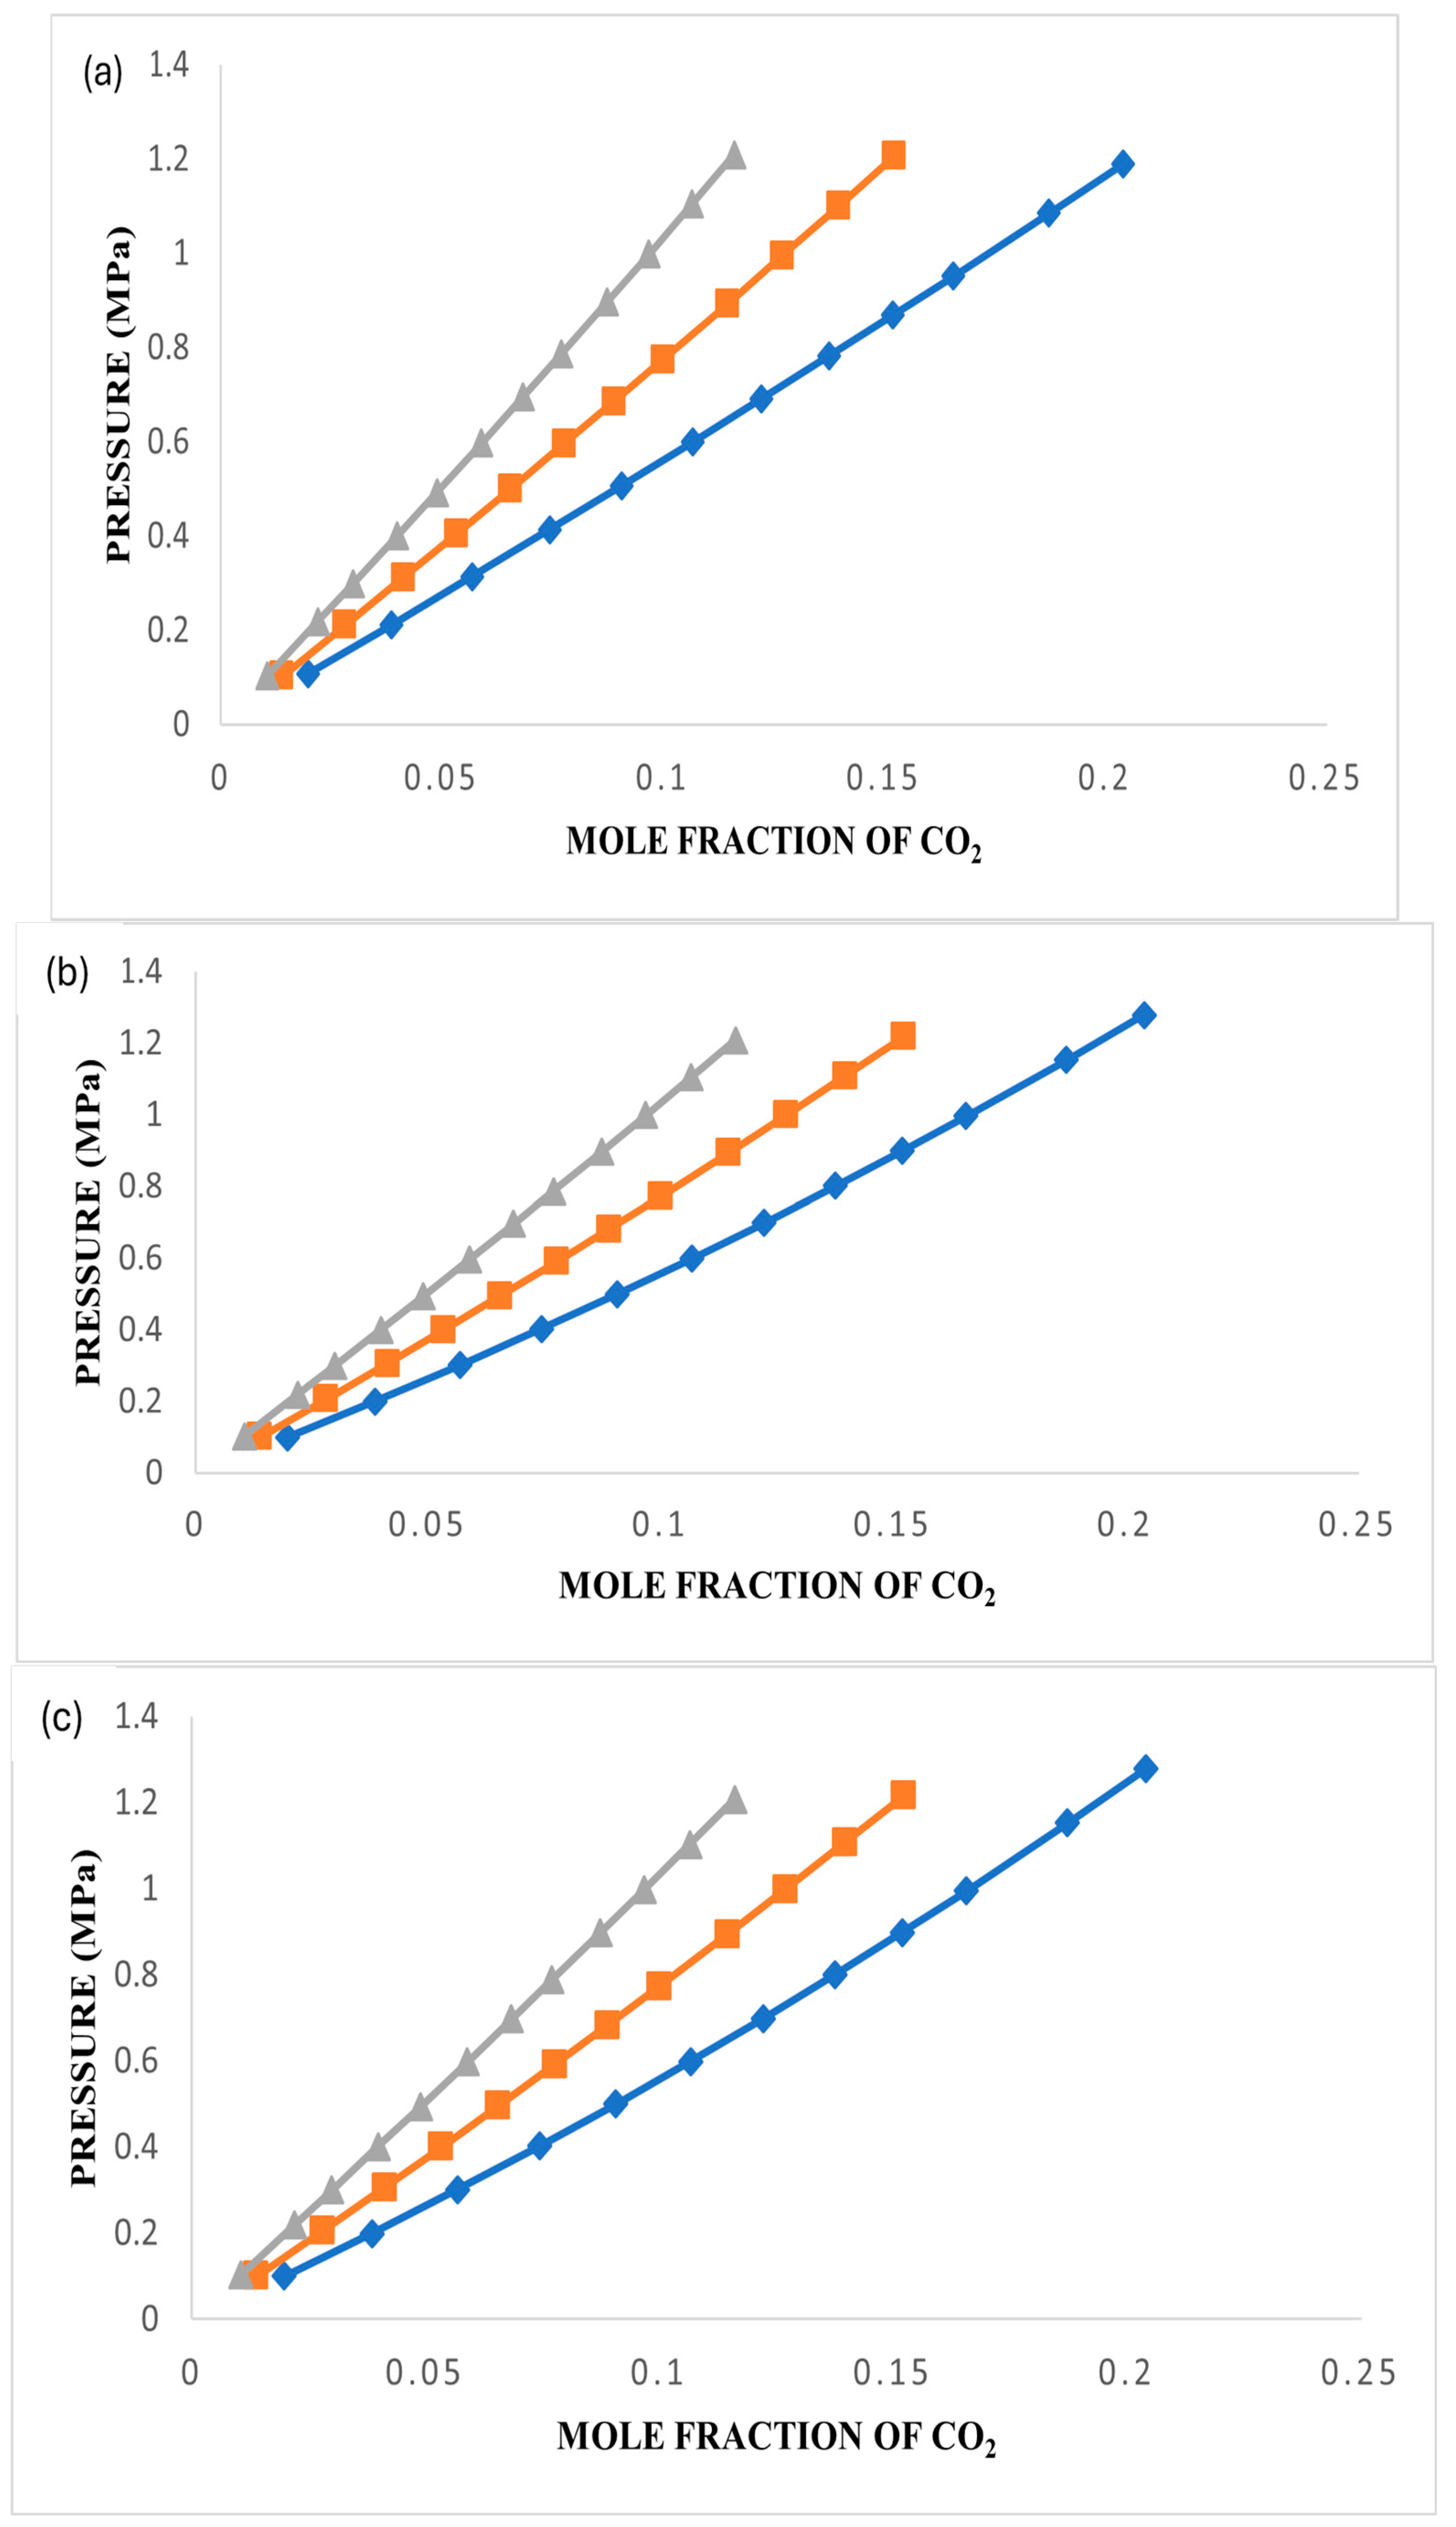
3.3. CO2 Solubility in Ionic Liquids
The investigation involved assessing the solubility of CO
2 in [BMIM][TfO], [BMP][TfO], and [MBPY][TfO] under various conditions, including temperatures of 303.15 K, 323.15 K, and 343.15 K and pressures of up to 1.5 MPa. The plots were generated and are presented in
Figure 4,
Figure 5 and
Figure 6 using the data collected for these three ionic liquids. Detailed experimental data are reported in
Tables S2–S4.
Figure 4,
Figure 5 and
Figure 6a–c represent plots of the experimental data and those obtained using the three models at the three temperatures for each ionic liquid.
4. Discussion
Table 3 summarizes the properties of the ionic liquids screened for their capacity to absorb CO
2 based on the results of our group’s computational simulation [
7]. COSMO-RS is a quantum chemistry-based equilibrium thermodynamics method that predicts the chemical potential μ of liquids. It processes the screening charge density σ on the surface of molecules to calculate the chemical potential μ
i of each species in solution. The temperature-dependent relative polarity descriptor (N) would be the residual pseudo-chemical potential of an ion at its infinite dilution in a protic polar solvent like water (reported in
Table 4). It quantifies the degree of chemical affinity of water with the ion due to various interactions (vdW, misfit, and H-bond). The polarity of ILs is considered the linear sum of the polarity of its constituent ions. The more negative the value of N, the more polar the ion is [
7].
In other terms, COSMO-RS is an excess Gibbs energy model for liquid mixtures based on surface charge interaction [
7]. The surface of a molecule or ion is divided into segments of a standard area. Each segment is identified by its average screening charge obtained from COSMO calculation. A histogram that shows the number of segments versus the corresponding screening charge density of a molecule or ion is called the sigma profile [
7]. The σ profile of a mixture is a mole fraction average of the σ profiles of the pure compounds. Such a profile gives the relative amount of surface with polarity σ on the molecule’s surface, providing detailed information about the molecular polarity distribution. The lowest energy conformer’s second sigma (sig2) moment is a polarity descriptor (reported in
Table 5). The 3D distribution of the polarization charges σ of each molecule is converted into a surface composition function (σ profile). Corresponding sigma potentials of the solvents can be used to ascertain the affinity of solvents to a solute [
7].
Our earlier study [
7] predicted that [TfO], with a more negative N, was more polar than [Tf2N] and had a lower capacity for CO
2, as confirmed by comparison with data published earlier [
11] and this study. This study reports that CO
2 solubility decreases with an increase in polarity.
Table 4 shows that the least polar cation is [MBPY], with the highest CO
2 solubility, followed by [BMP] and [BMIM]. The infinite dilution enthalpies and entropies of solvation for CO
2 in the anions and cations used in this study were reported in reference [
7].
4.1. Factors That Affect CO2 Solubility
4.1.1. Effect of Cations
Nath et al. [
9] confirmed that different cations did not notably alter the solubility of gases in an ionic liquid. The outcomes of their study remained broadly consistent, primarily due to the uniformity of the anion used. In a similar study, Taguiri et al. [
11] investigated the impact of various cations, all of which shared the common anion [Tf2N]. Their findings suggested that the choice of cation had minimal influence on the solubility of CO
2. In this study, the cations present were very similar in the number of carbons, varying only from C9 to C11. This slight difference was enough to rank the ILs, with the one with the highest solubility having the largest number of carbons.
4.1.2. Effect of Anions
In this investigation, three distinct ionic liquids share a common anion, [TfO]. The comparison in
Figure 7 illustrates that all three ionic liquids exhibit a similar trend in CO
2 solubility, with very close values. This consistency can be ascribed to the common anion. [TfO] had a very negative value of N (−19.66), making it a more polar anion compared to [Tf2N], for example. [Tf2N] with more fluorine atoms exhibits high CO
2 capacity.
4.1.3. Pressure and Temperature
As evidenced by the data presented in
Figure 4,
Figure 5 and
Figure 6, the solubility of gases in an ionic liquid is significantly affected by variations in both temperature and pressure. The collective findings from these figures unequivocally demonstrate that an increase in pressure results in a corresponding increase in CO
2 solubility. Conversely, solubility decreases as the temperature rises for all three ionic liquids under study.
4.1.4. Alkyl Chain Length
In studies published by Aghaie et al. [
12] and Ramdin et al. [
13], it was found that the length of the cation’s alkyl chain significantly affects the solubility of CO
2 in ionic liquids. A longer alkyl chain in the cation corresponds to higher CO
2 solubility. In this research, where ionic liquids share the same anion, the alkyl chains are the same for all three ionic liquids, resulting in similar solubility. Quaye et al. [
14] observed that ionic liquids with longer alkyl chains exhibit enhanced CO
2 solubility due to increased van der Waals interactions and surface area. Their study also concluded that 1-hexadecyl-3-methyl imidazolium bis (trifluoromethyl sulfonyl imide) with 21 carbons [IL2, C
21H
40F
6N
3O
4S
2] had a superior CO
2 solubility (based on Henry’s Law constants) compared to 1-decyl-3-methyl-imidazolium bis (trifluromethylsulfonyl imide with 15 carbons (IL1, C
15H
26F
6N
3O
4S
2), which resulted in a lower Henry’s Law constant. The experimental results presented in
Figure 7 show very close solubility data.
4.2. Henry’s Law Constants, Enthalpies, and Entropies
Henry’s Law constants were determined by plotting the fugacity against the mole fraction and fitting a second-order trend line to the data. The slope of this equation, obtained through differentiation, showed that Henry’s Law constants increased with higher temperatures, as shown in
Table 4. In this study, the slope was utilized to compute the enthalpy. The determined Henry’s Law constants were plotted against the reciprocal of temperature (1/T), and the slope of this graph was used to calculate the absorption enthalpy. This enthalpy value was multiplied by the universal gas constant (8.314 J/mol·K).
Table 4 demonstrates that, among the three temperatures investigated, among the three ionic liquids, [MBPY][TfO], the least polar and with the most significant size (number of carbons and hydrogens), exhibits the highest solubility, followed by [BMIM][TfO] and [BMP][TfO]. Note that [BMIM][TfO] and [BMP][TfO] had identical values at 323.15 K and 343.15 K.
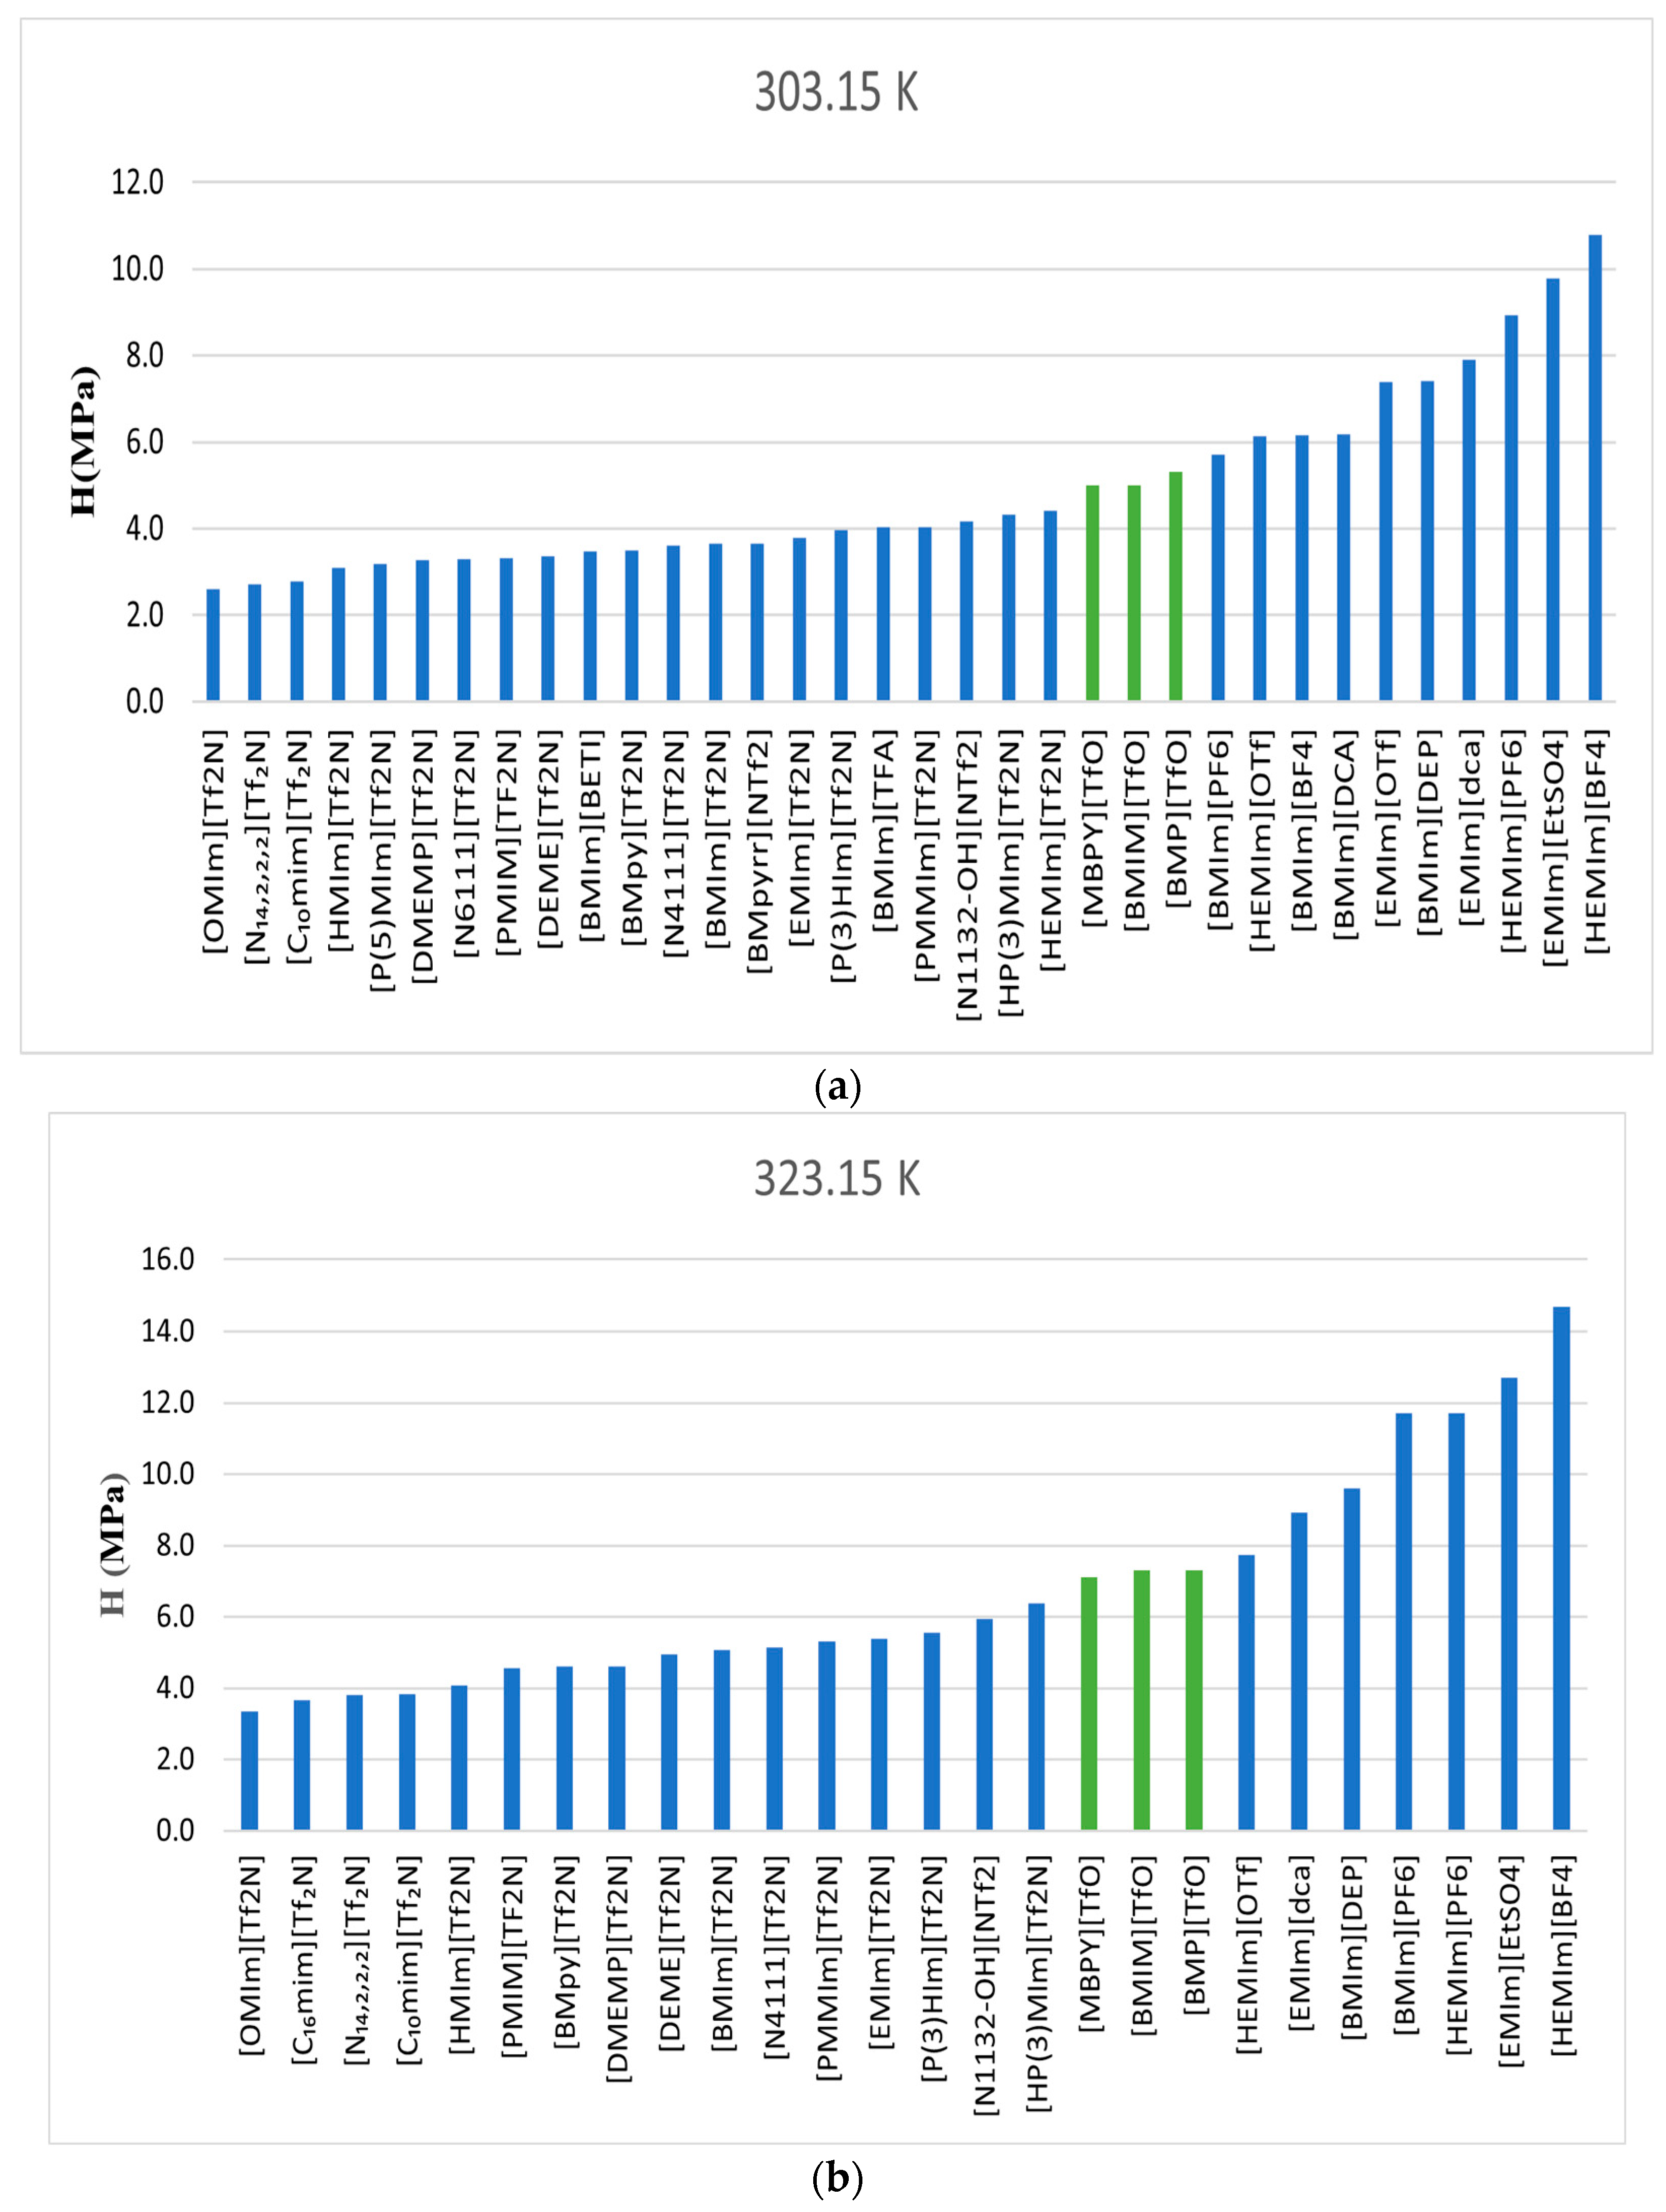
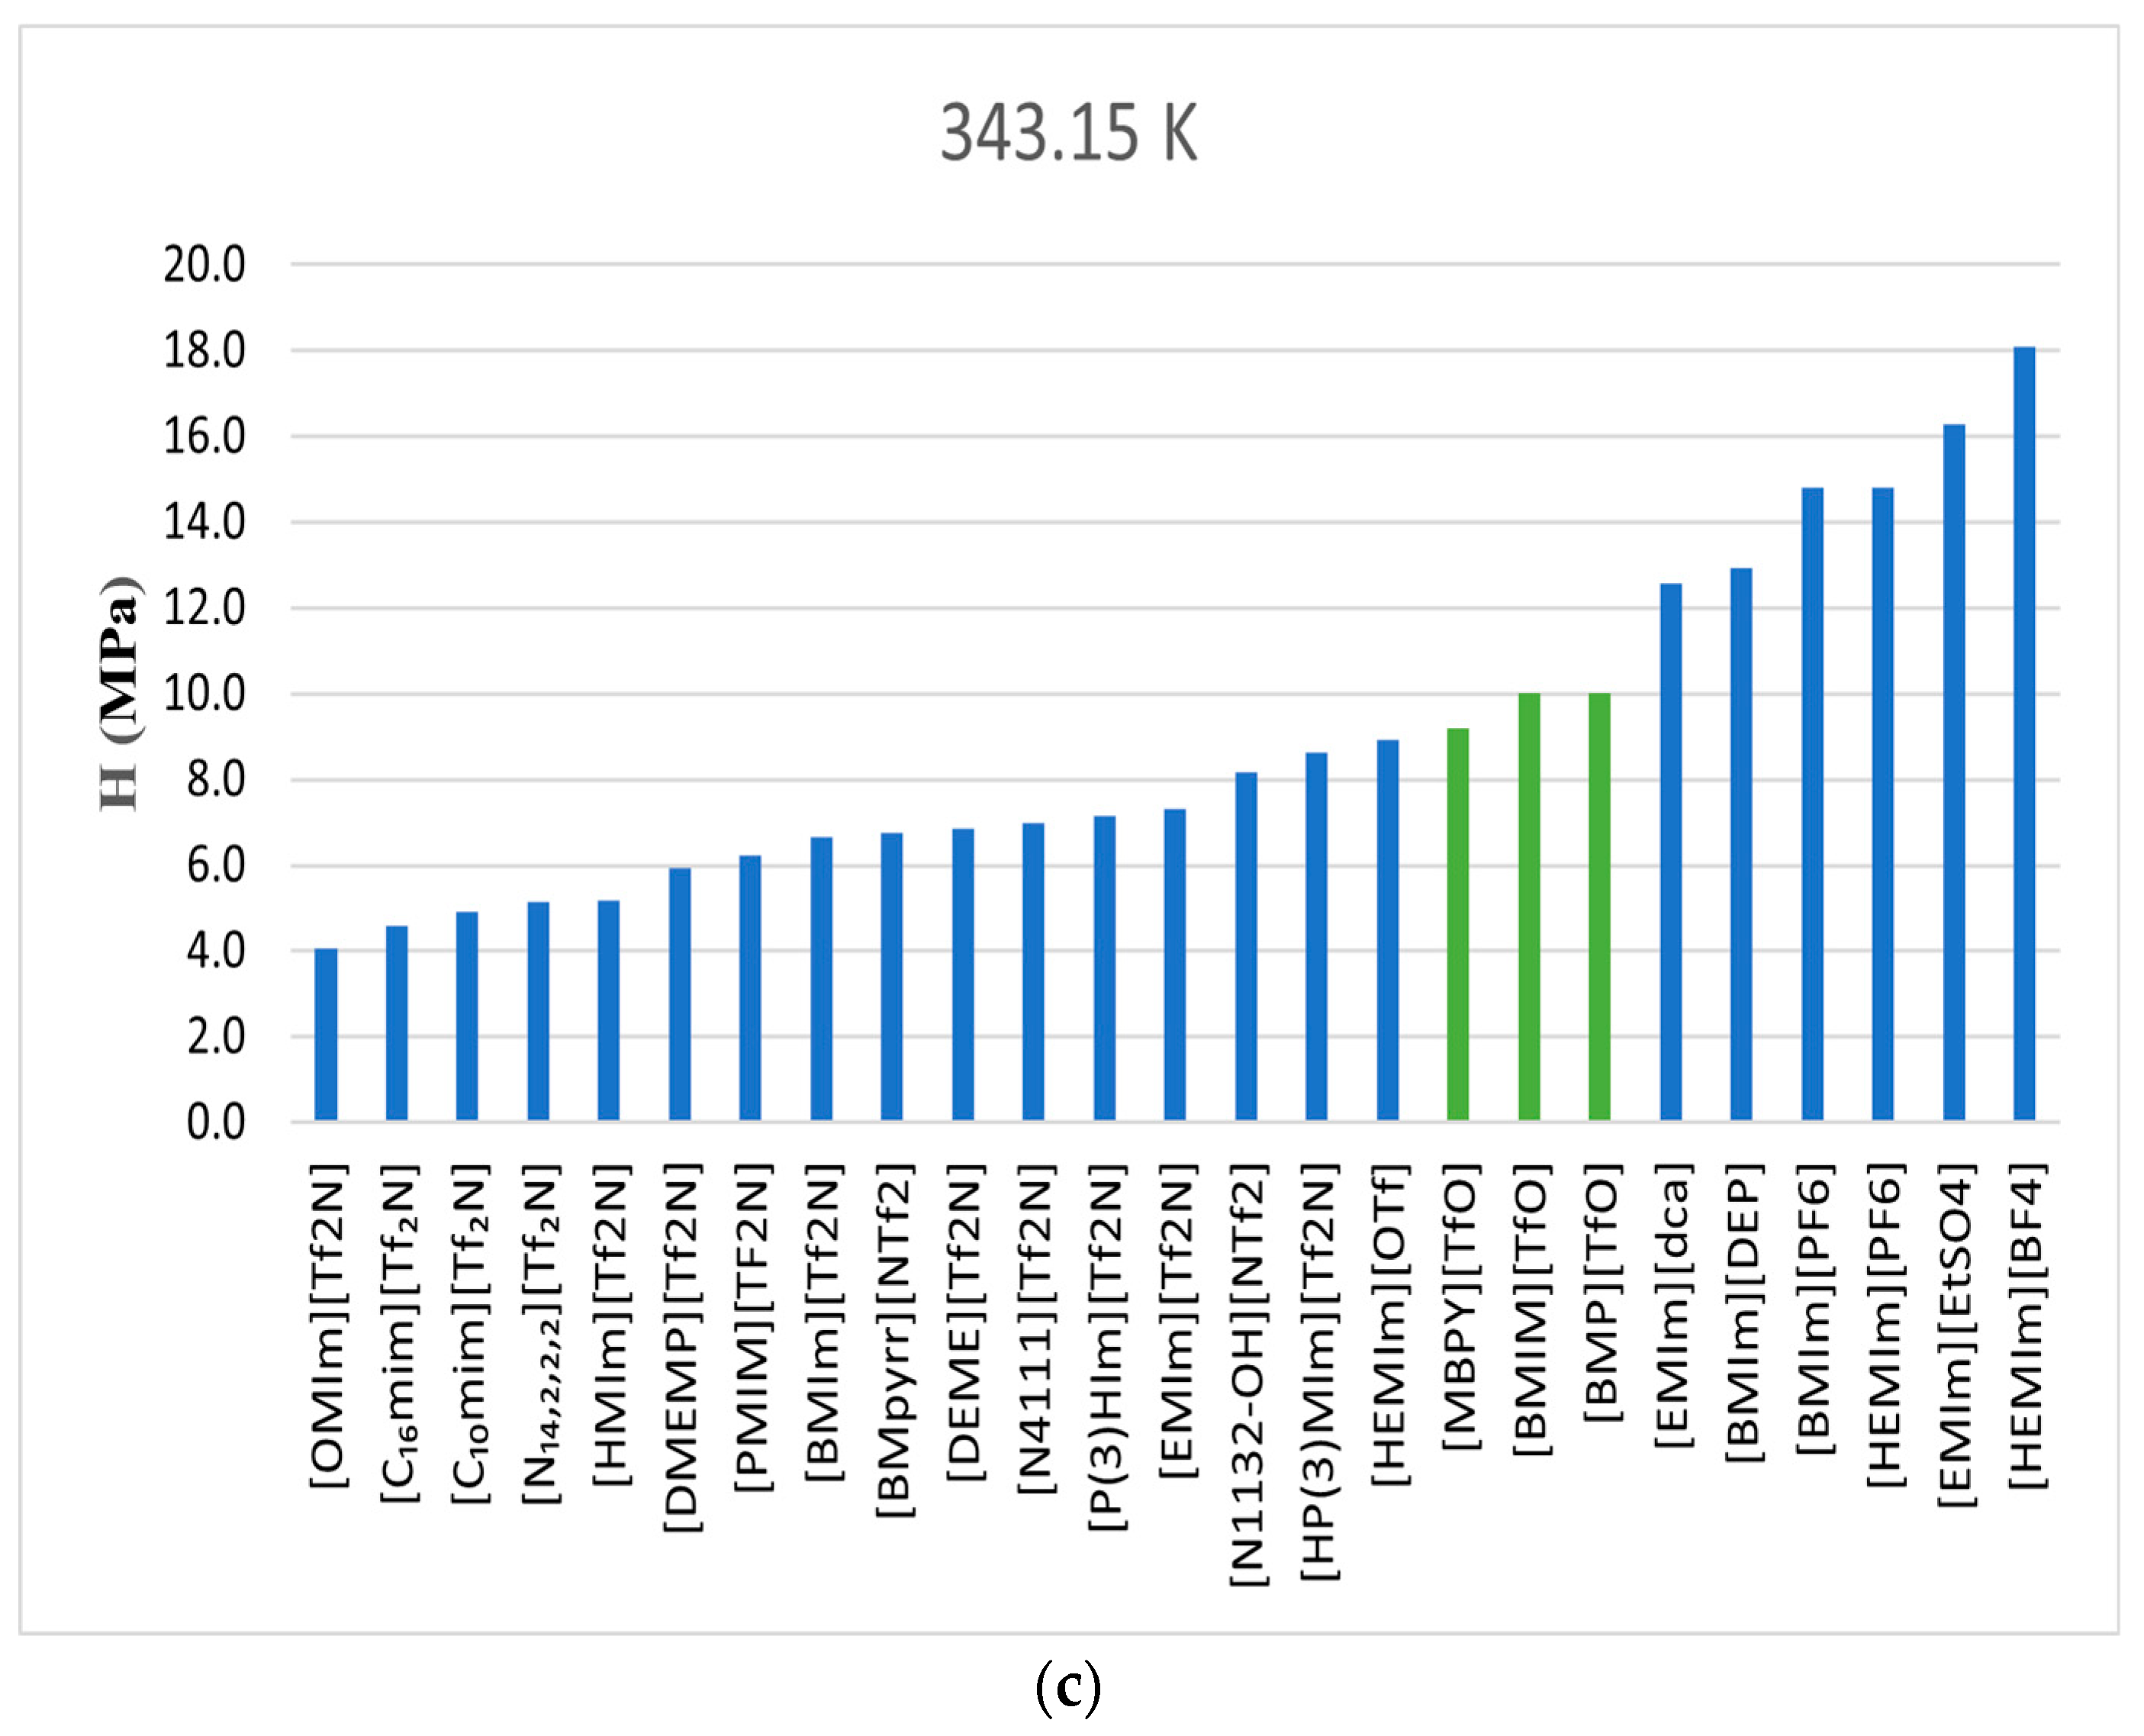
Figure 8 compares the CO
2 Henry’s Law constants determined in this study with those obtained from the literature [
6,
14,
15]. The ionic liquid featuring the highly fluorinated [Tf2N] as its anion exhibited higher CO
2 solubility than the ionic liquids used in this study (TfO-based) across the three temperatures of 303.15 K, 323.15 K, and 343.15 K. Values of the enthalpy and entropy at infinite dilution were determined to be negative, indicating exothermic absorption and an increase in system order.
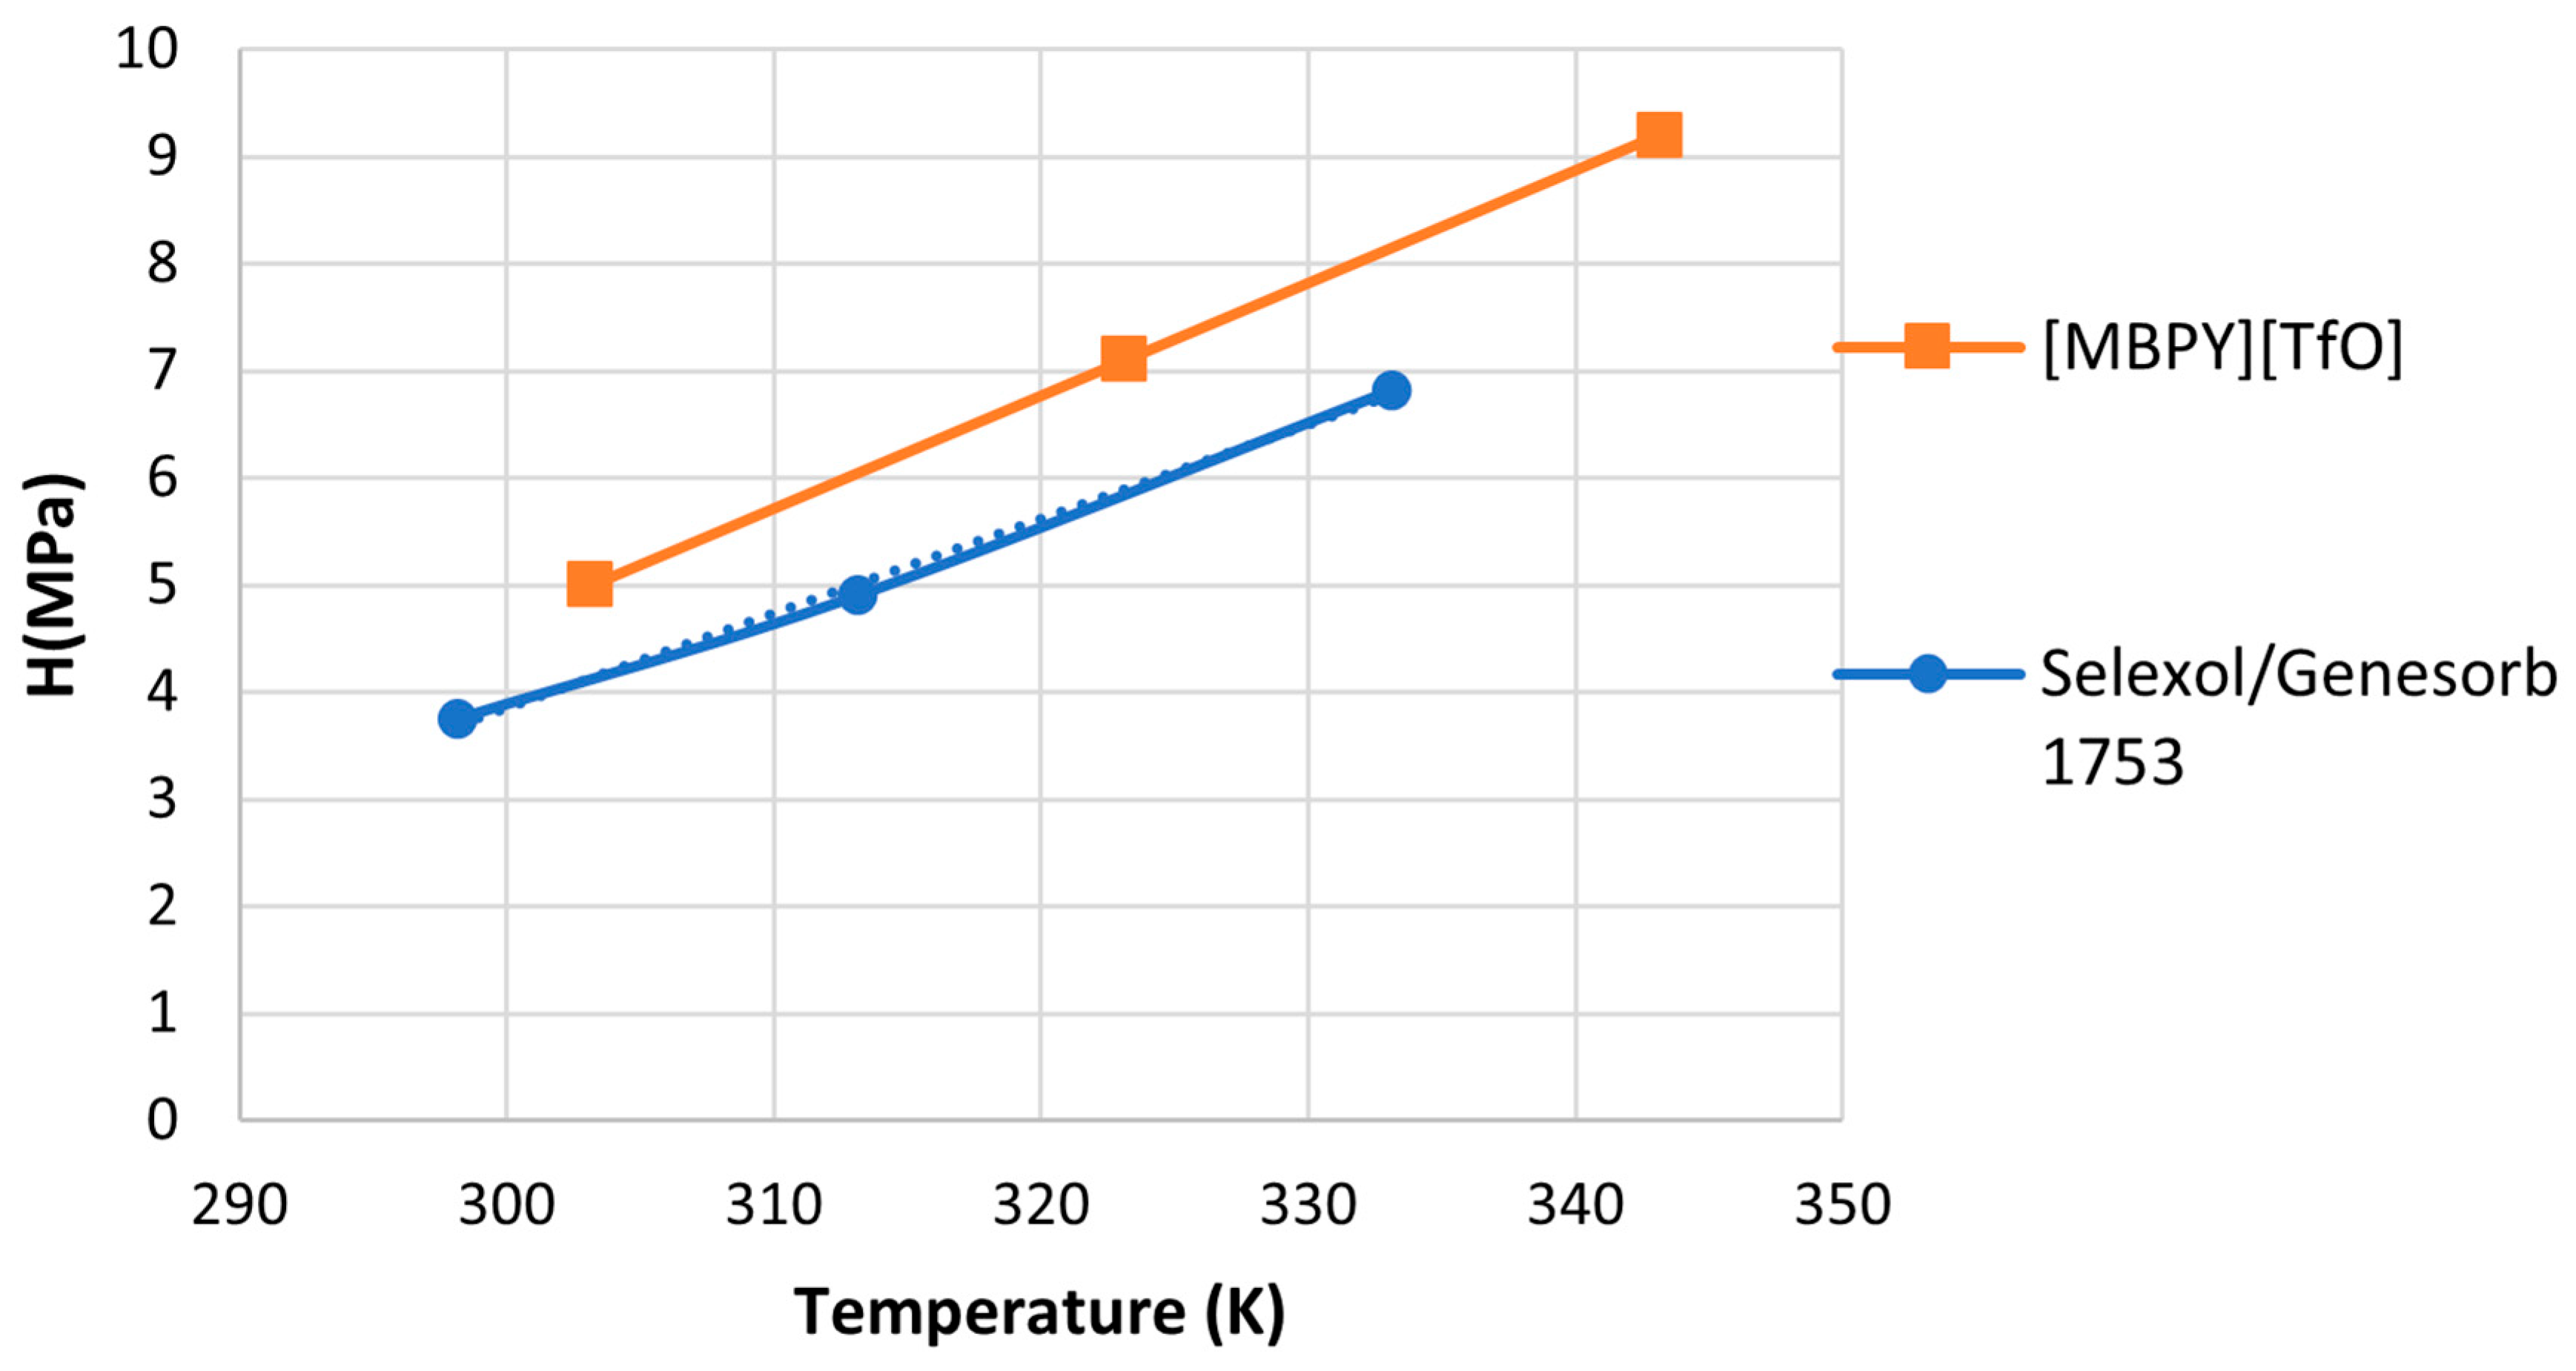
Finally, Henry’s Law constants of [MBPY][TfO] were compared with those of a widely used physical solvent known as Genesorb 1753 (Selexol
©). This particular solvent was selected for comparison due to its extensive use in gas-sweetening plants, waste air treatment, and purification of synthesis gases, as noted by [
16]. Henry’s Law constants for Selexol/Genesorb are reported for comparison [
16] and presented in
Figure 9. [MBPY][TfO] was chosen in this comparative analysis because it possesses the lowest Henry’s Law constant among the studied ionic liquids. Selexol/Genesorb 1753 had a lower Henry’s Law constant than [MBPY][TfO], and therefore a higher capacity for CO
2.
Table 5 summarizes the calculated interaction binary parameters and their corresponding average absolute deviations for each mixing rule. The average absolute deviations for the vdWI, vdWII, and WS-NRTL mixing rules applied to CO
2 in ionic liquids were determined to be 2.67%, 1.27%, and 1.24%, respectively. Among these mixing rules, the Wong–Sandler (WS-NRTL) mixing rule exhibited the least average absolute deviation, signifying its superiority as the favored option.
5. Conclusions
This study examines the solubility of CO2 in three promising ionic liquids ([BMIM][TfO], [BMP][TfO], and [MBPY][TfO]) at various temperatures and pressures. This study also reports the densities of these ionic liquids at different temperatures. The results indicated that CO2 solubility decreased with increasing temperature and increased with higher pressure. With the same [TfO] cation and the same alkyl chain, the three ILs presented very close absorption capacities. Based on Henry’s Law constants, [MBPY][TfO], the least polar, had slightly higher solubility among the three ionic liquids. The measured Henry’s Law constants were close to those predicted using COSMO-RS. Compared to Selexol/Genesorb 1753, [MBPY][TfO] exhibited a higher Henry’s Law constant, indicating that it was less effective in absorbing CO2. Based on several studies reported in the literature, the Henry’s Law constants of the ionic liquids determined in this study were higher when compared to [Tf2N]-based ionic liquids at all temperatures.
Additionally, binary interaction coefficients were regressed using the Peng–Robinson equation of state (PR-EoS), and three mixing rules (vdWI, vdWII, and WS-NRTL) were evaluated. The Wong–Sandler mixing rule had the lowest average absolute deviation (AAD).
Values of the enthalpy and entropy of absorption were negative, indicating exothermic absorption and an increase in system order. The enthalpy of absorption ranged from −25.9 kJ/mol for [MBPY] to −42.2 kJ/mol for [BMP], while the entropies varied from −8.3 kJ/mol·K for [MBPY] to −13.7 kJ/mol·K for [BMP].
Supplementary Materials
The following supporting information can be downloaded at:
https://www.mdpi.com/article/10.3390/liquids5020015/s1, Table S1. The experimental densities of the three ionic liquids used in this study; Table S2. CO
2 solubility at 303.15, 323.15, and 343.15 K in [BMP][TfO]; Table S3 CO
2solubility at 303.15, 323.15, and 343.15 K in [BMIM][TfO]; Table S4. CO
2solubility at 303.15, 323.15, and 343.15 K in [MBPY][TfO].
Author Contributions
Conceptualization, A.H.; methodology, R.A. and F.S.; software, R.A. and F.S.; validation, R.A. and F.S.; formal analysis, R.A. and F.S.; investigation, R.A. and F.S.; resources, A.H.; data curation, R.A. and F.S.; writing—original draft preparation, R.A.; writing—review and editing, A.H. and R.A.; visualization, R.A.; supervision, A.H.; project administration, A.H.; funding acquisition, A.H. All authors have read and agreed to the published version of the manuscript.
Funding
This research was funded by the Natural Sciences and Engineering Research Council of Canada (NSERC) under Discovery Grant number RGPIN-2024-05070.
Data Availability Statement
All experimental data acquired are reported in the manuscript.
Acknowledgments
The first author would like to thank Nadir Henni for training and guidance throughout the experimental and simulation works. He would also like to acknowledge the immense support of Naman Bhandari and Farhan Shaikh during their internships in the lab.
Conflicts of Interest
The authors declare no conflicts of interest. The funding agency had no role in the study’s design, in the collection, analysis, or interpretation of the data, in the writing of the manuscript, or in the decision to publish the results.
Abbreviations
The following abbreviations are used in this manuscript:
| AAD | Average absolute deviation |
| [BF4] | Tetrafluoroborate |
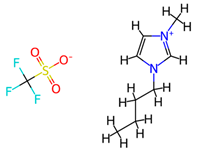
| [BMIM][TfO] | 1-Butyl-3-methylimidazolium triflate |
| [BMP][TfO] | 1-Butyl-1-methylpyrrolidinium triflate |
| CO2 | Carbon dioxide |
| [C10mim] | 1-Decyl-3-methylimidazolium |
| [C16mim] | 1-hexadecyl-3-methylimidazolium |
| [DCA] | Dicyanamide |
| [DEME] | N,n-diethyl-2-methoxy-n-methylethan-1-aminium |
| [DMEMP] | N,n-dimethyl-n-ethyl-n-(3-methoxypropyl)ammonium |
| [EMIm] | 1-Ethyl-3-methylimidazolium |
| EoS | Equation of state |
| [EtSO4] | Ethyl sulfate |
| H | Henry’s Law constant |
| [HMIm] | 1-Hexyl-3-methylimidazolium |
| [HEMIm] | 1-(2-Hydroxyethyl)-3-methylimidazolium |
| IGA | Intelligent gravimetric analyzer |
| ILs | Ionic liquids |
| K | Kelvin |
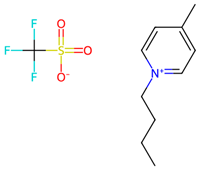
| [MBPY][TfO] | 1-Butyl-4-methylpyridium triflate |
| MDEA | Methyldiethanolamine |
| MEA | Monoethanolamine |
| [N1132-OH] | 1-(2-Nitrophenyl) ethanol |
| [N4111] | Butyl-trimethylammonium |
| [N14,2,2,2] | Tetradecyl-trimethylammonium |
| [OMIm] | 1-Octyl-3-methylimidazolium |
| Pc | Critical pressure |
| [PF6] | Hexafluorophosphate |
| [PMIM] | 1-Propyl-3-methylimidazolium |
| PR | Peng Robinson |
| [P(3)HIm] | 1-Allyl-3H-imidazolium |
| Tb | Boiling point temperature |
| Tc | Critical temperature |
| vdWI | van der Waals one |
| vdWII | van der Waals two |
| WS-NRTL | Wong–Sandler mixing rules combined with non-random two-liquid |
| x | Liquid mole fraction (moles gas/moles gas + moles solvent) |
| y | Vapor mole fraction |
References
- Arshad, M.W. CO2 Capture Using Ionic Liquids. Ph.D. Thesis, Technical University of Denmark, DTU, Lyngby, Denmark, 2009. [Google Scholar] [CrossRef]
- Vadillo, J.M.; Díaz-Sainz, G.; Gómez-Coma, L.; Garea, A.; Irabien, A. Chemical and Physical Ionic Liquids in CO2 Capture System Using Membrane Vacuum Regeneration. Membranes 2022, 12, 785. [Google Scholar] [CrossRef] [PubMed]
- Shukla, S.K.; Khokarale, S.G.; Bui, T.Q.; Mikkola, J.P.T. Ionic liquids: Potential materials for carbon dioxide capture and utilization. Front. Mater. 2019, 6, 42. [Google Scholar] [CrossRef]
- Macfarlane, D.R.; Kar, M.; Pringle, J.M. Fundamentals of Ionic Liquids: From Chemistry to Applications, 1st ed.; Wiley-VCH Verlag GmbH & Co.: Weinheim, Germany, 2017. [Google Scholar]
- Zhang, X.; Zhang, X.; Dong, H.; Zhao, Z.; Zhang, S.; Huang, Y. Carbon capture with ionic liquids: Overview and progress. Energy Environ. Sci. 2012, 5, 6668–6681. [Google Scholar] [CrossRef]
- Henni, N.; Henni, A.; Ibrahim, H. Solubility of carbon dioxide in promising methylimidazolium-based ionic liquids. Fluid Phase Equilibria 2022, 565, 3–10. [Google Scholar] [CrossRef]
- Sumon, K.Z.; Henni, A. Ionic liquids for CO2 capture using COSMO-RS: Effect of structure, properties and molecular interactions on solubility and selectivity. Fluid Phase Equilibria 2011, 310, 39–55. [Google Scholar] [CrossRef]
- Shiflett, M.B.; Yokozeki, A. Solubilities and diffusivities of carbon dioxide in ionic liquids: [bmim][PF6] and [bmim][BF4]. Ind. Eng. Chem. Res. 2005, 44, 4453–4464. [Google Scholar] [CrossRef]
- Nath, D.; Sumon, K.Z.; Tagiuri, A.; Henni, A. Effect of cation on the solubility of ethane in three bis(fluorosulfonyl)imide ([FSI]) based low viscosity ionic liquids. Fluid Phase Equilibria 2017, 454, 78–90. [Google Scholar] [CrossRef]
- Valderrama, J.O.; Rojas, R.E. Critical properties of ionic liquids. Revisited. Ind. Eng. Chem. Res. 2009, 48, 6890–6900. [Google Scholar] [CrossRef]
- Tagiuri, A.; Sumon, K.Z.; Henni, A. Solubility of carbon dioxide in three [Tf2N] ionic liquids. Fluid Phase Equilibria 2014, 380, 39–47. [Google Scholar] [CrossRef]
- Aghaie, M.; Rezaei, N.; Zendehboudi, S. A systematic review on CO2 capture with ionic liquids: Current status and prospects. Renew. Sustain. Energy Rev. 2018, 96, 502–525. [Google Scholar] [CrossRef]
- Ramdin, M.; De Loos, T.W.; Vlugt, T.J.H. State-of-the-art of CO2 capture with ionic liquids. Ind. Eng. Chem. Res. 2012, 51, 8149–8177. [Google Scholar] [CrossRef]
- Quaye, E.; Henni, A.; Shirif, E. Carbon Dioxide Solubility in Three Bis Tri (Fluromethylsulfonyl) Imide-Based Ionic Liquids. Molecules 2024, 29, 2784. [Google Scholar] [CrossRef] [PubMed]
- Nath, D.; Henni, A. Solubility of carbon dioxide (CO2) in four bis (trifluoromethyl-sulfonyl)imide ([Tf2N]) based ionic liquids. Fluid Phase Equilibria 2020, 524, 112757. [Google Scholar] [CrossRef]
- Rayer, R.V.; Henni, A.; Tontiwachwuthikul, P. High-pressure physical solubility of carbon dioxide (CO2) in mixed polyethylene glycol dimethyl ethers (Genosorb 1753). Can. J. Chem. Eng. 2012, 90, 576–583. [Google Scholar] [CrossRef]
| Disclaimer/Publisher’s Note: The statements, opinions and data contained in all publications are solely those of the individual author(s) and contributor(s) and not of MDPI and/or the editor(s). MDPI and/or the editor(s) disclaim responsibility for any injury to people or property resulting from any ideas, methods, instructions or products referred to in the content. |
© 2025 by the authors. Licensee MDPI, Basel, Switzerland. This article is an open access article distributed under the terms and conditions of the Creative Commons Attribution (CC BY) license (https://creativecommons.org/licenses/by/4.0/).


