Article

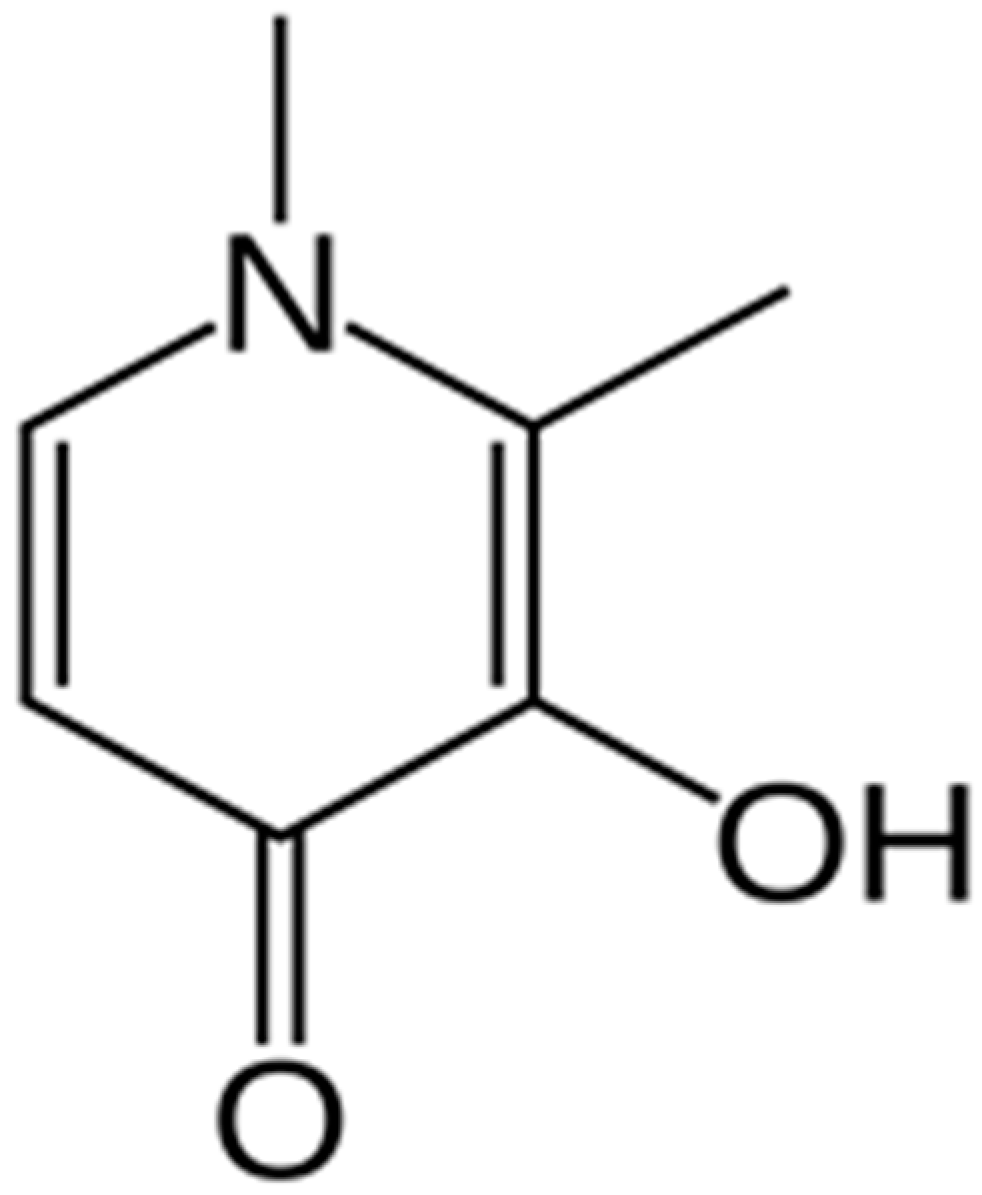
Solubility of Deferiprone in Non-Aqueous Mixtures of Polyethylene Glycol 400 and 1-Propanol at 293.2–323.2 K

1
Student Research Committee, Faculty of Pharmacy, Tabriz University of Medical Sciences, Tabriz 5165665811, Iran
2
Pharmaceutical Analysis Research Center and Faculty of Pharmacy, Tabriz University of Medical Sciences, Tabriz 5165665811, Iran
*
Author to whom correspondence should be addressed.
Submission received: 18 December 2024 / Revised: 30 January 2025 / Accepted: 4 February 2025 / Published: 13 February 2025
(This article belongs to the Collection Feature Papers in Solutions and Liquid Mixtures Research)

Abstract

:
Utilizing the shake-flask technique under atmospheric pressure (101 kPa) within the temperature range of 293.2 to 313.2 K, the experimental solubility and density values of deferiprone were determined in binary mixtures of polyethylene glycol 400 and 1-propanol. The mole fraction solubility of deferiprone exhibited an augmentation with elevated temperature and increased polyethylene glycol 400 mass ratio in polyethylene glycol 400 + 1-propanol compositions. A subsequent regression analysis of the solubility data was conducted employing the van’t Hoff, λh, Yalkowsky, modified Wilson, Jouyban–Acree and Jouyban–Acree–van’t Hoff models upon the comprehensive evaluation of the entire dataset; the van’t Hoff equation demonstrated the most favorable regression. Furthermore, the findings of this study hold significance for advancing the understanding of the basic thermodynamic data pertinent to the crystallization and industrial separation processes of deferiprone.

1. Introduction

Thalassemia is a genetic disease characterized by the synthesis of anomalous hemoglobin, encompassing an estimated 5–7% of the societies [1,2]. Thalassemic patients experience increased iron absorption, which can lead to an accumulation of iron in their bodies [3]. The iron overload initiates a cascade of platelet hyperactivity, increasing subsequent thromboembolic complications [4,5].
Deferiprone (3-hydroxy-1,2-dimethylpyridin-4(1H)-one, Figure 1), as an oral potent iron-chelating drug, has been used, in the past two decades, for the management of iron overload-induced toxicity, along with addressing various other conditions associated with iron-related toxicity [6].
In the pharmaceutical literature, aqueous solubility is acknowledged as a paramount and formidable physicochemical attribute of drug formulations, transcending the mode of administration. A profound comprehension of solubility profiles for pharmacologically active compounds is crucial, as it equips pharmaceutical researchers with the capacity to identify and employ the optimal solvent system for any given medicinal entity. This acumen is pivotal in navigating and overcoming the particularized challenges encountered in the development of pharmaceutical solutions [7]. Furthermore, solubility is intrinsically influenced by a triad of critical parameters: temperature, pressure, and the chemical nature of the solvent [8].
A plethora of sophisticated methodologies to augment drug solubility are documented within the scientific literature, including particle size reduction, solid dispersion, nanosuspension, micellar solubilization techniques, crystal modification and engineering, and hydrotropy. The selection of an appropriate strategy is contingent upon a matrix of criteria encompassing the chemical nature of the drug, the properties of potential excipients, and the desired characteristics of the final dosage form [8]. Nonetheless, cosolvency, which involves the incorporation of a compatible, non-toxic organic solvent into water or another solvent, remains the predominant strategy for enhancing the solubility of specific drugs or for probing the solubility profile of a drug within mixed solvent systems [9]. The solubility of drugs in water + cosolvent mixtures could be used in liquid formulations and also in designing the re-crystallization procedures for the purification of drugs from synthetic mixtures. The non-aqueous solvent mixtures could be used in the formulation of liquid dosage forms of potentially hydrolizable drugs or soft gel formulations.
Recently, investigations have been conducted on the solubility of deferiprone in aqueous binary mixtures, encompassing isopropanol, ethylene glycol, propylene glycol, polyethylene glycol 400 (PEG 400), ethanol, N-methyl-2-pyrrolidone (NMP), as well as a number of non-aqueous binary mixtures, including PEG 400 + 2-propanol, propylene glycol + 2-propanol, propylene glycol + ethanol, NMP + ethanol, and certain mono-solvents, such as chloroform, 1,4-dioxane, ethyl acetate, acetonitrile, and dichloromethane, mostly published by our research group (details of the references can be found from the databases; we did not cite them to avoid self-citation). In addition, Gheitasi et al. reported the solubility of deferiprone in acetonitrile, ethanol, acetic acid, sulfolane, and ethyl acetate and their mixtures [10], and Chahiyan-Broujeni and Gharib reported the solubility of this drug in different ionic strengths at various temperatures [11]. Previous investigations have focused on aqueous binary mixtures or alternative non-aqueous solvents. However, PEG 400 and 1-propanol mixtures represent a promising solvent system because of their compatibility with pharmaceutical applications, including drug solubilization, formulation, and re-crystallization. This study addresses this gap by providing new experimental solubility data and thermodynamic insights for the mentioned system. The primary objectives of this research endeavor include the following: (1) the determination of the equilibrium solubility and density values of deferiprone in the binary mixtures of PEG 400 and 1-propanol across various temperatures; (2) the correlation of the obtained data with established cosolvency models; and (3) the computation of apparent thermodynamic properties associated with the dissolution process of deferiprone in mixed solutions of PEG 400 and 1-propanol.

2. Materials and Methods

2.1. Materials

Table 1 enumerates the specificities, such as the Chemical Abstracts Service (CAS) identifier, origin, method of purification, molecular constitution, and the mass fraction purity pertinent to deferiprone powder and the used organic solvents, including ethanol, 1-propanol, and PEG 400.

2.2. Measurement of Deferiprone Solubility

To attain a solid–liquid equilibrium in the (PEG 400 + 1-propanol) mixed solutions, a stirring duration of 48 h at each specified temperature was employed. The widely utilized shake-flask method, renowned for its extensive application in solubility assessments, was employed, ensuring the reliability of the experimental procedures and equipment. In a concise description, 10 g of solvent mixtures with mass fraction ranges from w1 = 0.1–0.9 or pure solvent (i.e., w1 = 0.0 or 1.0) were introduced into glass vials. Excess deferiprone was added until saturation was achieved, indicated by incomplete dissolution. The solutions were continuously agitated for 48 h on a shaker (Behdad, Tehran, Iran) within an incubator (Kimia Idea Pardaz Azerbaijan, Tabriz, Iran) set to the desired pressure (101 kPa) and five temperature points to ensure the establishment of a solid–liquid equilibrium. Following equilibrium attainment, the supernatants were thoroughly centrifuged and appropriately diluted for the subsequent analyses. A UV-Vis spectrophotometer (Cecil BioAquarius CE 7250, Cambridge, UK) was utilized to determine the solution concentrations, with the dilution performed using ethanol: water (30:70) at a wavelength of 273.5 nm. The densities of the saturated solutions were measured using a 5 mL pycnometer, with an uncertainty of 0.001 g∙cm−3.

2.3. Computational Section

Six distinct mathematical models, namely the van’t Hoff, λh, Yalkowsky, modified Wilson, Jouyban–Acree and Jouyban–Acree–van’t Hoff models, have been employed for the purpose of correlating the solid–liquid equilibrium data. The intricate details of each model are explicated in the subsequent sections. The accuracy assessment of these models is conducted through the utilization of back-calculated data derived from each model under investigation. This evaluation is accomplished by employing the mean relative deviation (MRD%) calculation, as defined by Equation (1):
M R D % = 100 N C a l c u l a t e d   V a l u e O b s e r v e d   V a l u e O b s e r v e d   V a l u e
In this equation, N represents the total number of data points. The application of such rigorous methodologies is crucial for scrutinizing and validating the predictive capabilities of these mathematical models in representing solid–liquid equilibrium phenomena.

2.3.1. van’t Hoff Equation

The interrelation of temperature and solubility parameters is articulated by leveraging the van’t Hoff equation, a principle extrapolated from thermodynamic theory. This equation delineates the dependence of a reaction’s equilibrium constant on the enthalpy and entropy variations that are contingent on temperature. Within the ambit of solubility, it explicates the modality by which temperature modulates the solubility quotient of a solute within a solvent. The van’t Hoff equation is represented as follows [12]:
l n x T = A + B T
where x T is the solubility of the solute at temperature T, and A and B are empirical coefficients intrinsic to the model, with A typically encapsulating the entropic contributions and B reflecting the enthalpic changes involved in the dissolution process.

2.3.2. λh Equation

The λh equation, formulated by Buchowski et al. [13], scrutinizes the intricate relationship between solubility and temperature. This bivariate equation, incorporating the parameters λ and h, articulates the solvent activity across the saturation curve and delineates the solubility characteristics of solid substances capable of hydrogen bonding. The mathematical representation of the λh equation is as follows:
ln 1 + λ 1 x T x T = λ h 1 T 1 T m
where Tm denotes the melting temperature of the solute (specifically, 545.2 K for deferiprone in this context), and λ and h signify the model coefficients that are determined empirically. Both Equations (2) and (3) could be used for correlating the solute solubility in a certain composition of a binary solvent mixture at various temperatures.

2.3.3. Yalkowsky Model

The Yalkowsky solubility model presents an elementary linear correlation between the solubility of a pharmacological agent in composite solvent systems and its solubility in individual solvents at an isothermal condition. The model is algebraically conveyed as follows [14]:
ln x m = w 1   ln x 1 + w 2   ln x 2
where x1 and x2 are the mole fraction solubilities of the drug in the respective mono-solvents 1 and 2, and w1 and w2 represent the mass fractions of the mono-solvents 1 and 2, correspondingly, in the absence of the solute.

2.3.4. The Modified Wilson Model

In conjunction with the application of linear models for deferiprone solubility modeling, an alternative non-linear approach involves the utilization of the modified Wilson model to correlate the solubility data in mixed solvents at a constant temperature [9]. The modified Wilson model is a valuable tool in the realm of solubility modeling, offering a non-linear perspective on the interactions and associations governing the solute’s behavior in a given system. This model serves to enhance the precision of solubility predictions by capturing intricacies that may not be fully accounted for by linear approaches. Its application contributes to a more nuanced understanding of the thermodynamic aspects involved in solubility phenomena, facilitating advanced modeling and prediction capabilities in pharmaceutical research and industrial design. This non-linear model is expressed as follows:
ln x m = 1 w 1 1 + ln x 1 w 1 + w 2 λ 12 w 2 1 + ln x 2 w 1 λ 21 + w 2
where λ12 and λ21 represent the equation parameters. Both Equations (4) and (5) can be employed to correlate a solute solubility in binary solvent mixtures at an isothermal condition.

2.3.5. Jouyban–Acree Model

The Jouyban–Acree model, a linear framework, establishes the relationships between solubility data, temperature, and solvent composition. Its mathematical expression is formulated as follows [12]:
l n x m , T = w 1 l n x 1 , T + w 2 l n x 2 , T + w 1 · w 2 T i = 0 2 J i · ( w 1 w 2 ) i
In this equation, the Ji terms represent the model parameters, which are determined through the regression of l n x m , T w 1 l n x 1 , T w 2 l n x 2 , T against w 1 · w 2 T , w 1 · w 2 ( w 1 w 2 ) T , and w 1 · w 2 ( w 1 w 2 ) 2 T .

2.3.6. Jouyban–Acree–van’t Hoff Model

The incorporation of the van’t Hoff equation into the Jouyban–Acree model yields a precise framework for the correlation and prediction of drug solubility data. This enhanced model offers a comprehensive representation, aligning theoretical underpinnings with empirical observations, thereby contributing significantly to the accuracy and reliability of drug solubility predictions [12]:
l n x m , T = w 1 ( A 1 + B 1 T ) + w 2 ( A 2 + B 2 T ) + w 1 · w 2 T i = 0 2 J i · ( w 1 w 2 ) i
in which A1, B1, A2 and B2 are the van’t Hoff model’s parameter and are obtained by plotting ln x m , T  vs. 1/T in the mono-solvents at various temperatures. The Ji terms are obtained using the regression of ln x m , T w 1 A 1 + B 1 T w 2 A 2 + B 2 T against w 1 · w 2 T , w 1 · w 2 ( w 1 w 2 ) T , and w 1 · w 2 ( w 1 w 2 ) 2 T .

2.4. Thermodynamic Parameters

The thermodynamic characteristics of the dissolution process of deferiprone were evaluated through the application of the Gibbs and modified van’t Hoff equations. These calculations encompassed the determination of the apparent standard dissolution Gibbs energy (ΔG°), standard dissolution enthalpy (ΔH°) and standard dissolution entropy change (ΔS°) at 101 kPa. The modified van’t Hoff equation, expressed as Equation (6) is defined as follows:
l n x 1 T 1 T m p = H ° R
In this equation, x denotes the solubility of the solute in mole fraction units, R represents the ideal gas constant, and T corresponds to the absolute temperature in Kelvin (K). The mean harmonic temperature (Thm) is determined based on the number of temperatures studied (n) according to T h m = n / i = 1 n 1 / T (n is the number of studied temperatures). The slope and intercept of the ln x versus 1/T − 1/Thm plot are utilized to derive specific parameters like Δ H and Δ G for saturated mixed solutions, with the values calculated using the Gibbs equation. The Δ S ° values are computed by using the Gibbs equation.
To elucidate the relative influences of enthalpy (ζH) and entropy (ζTΔS) on the dissolution characteristics (e.g., (Δ = Δ − TΔ)) of deferiprone in mixed solutions of PEG 400 and 1-propanol, the subsequent equations are applied [15]:
ζ H = H ° ( H ° + T S ° )
ζ T Δ S = T S ° ( H ° + T S ° )
These equations provide a rigorous quantitative analysis, facilitating the determination of the proportional contributions of enthalpic and entropic factors to the overall dissolution behavior of deferiprone within the specified mixed solvent system. The utilization of such formulations contributes to a comprehensive understanding of the thermodynamic aspects governing the dissolution process, thereby enhancing the scientific comprehension of pharmaceutical formulations.

3. Results and Discussion

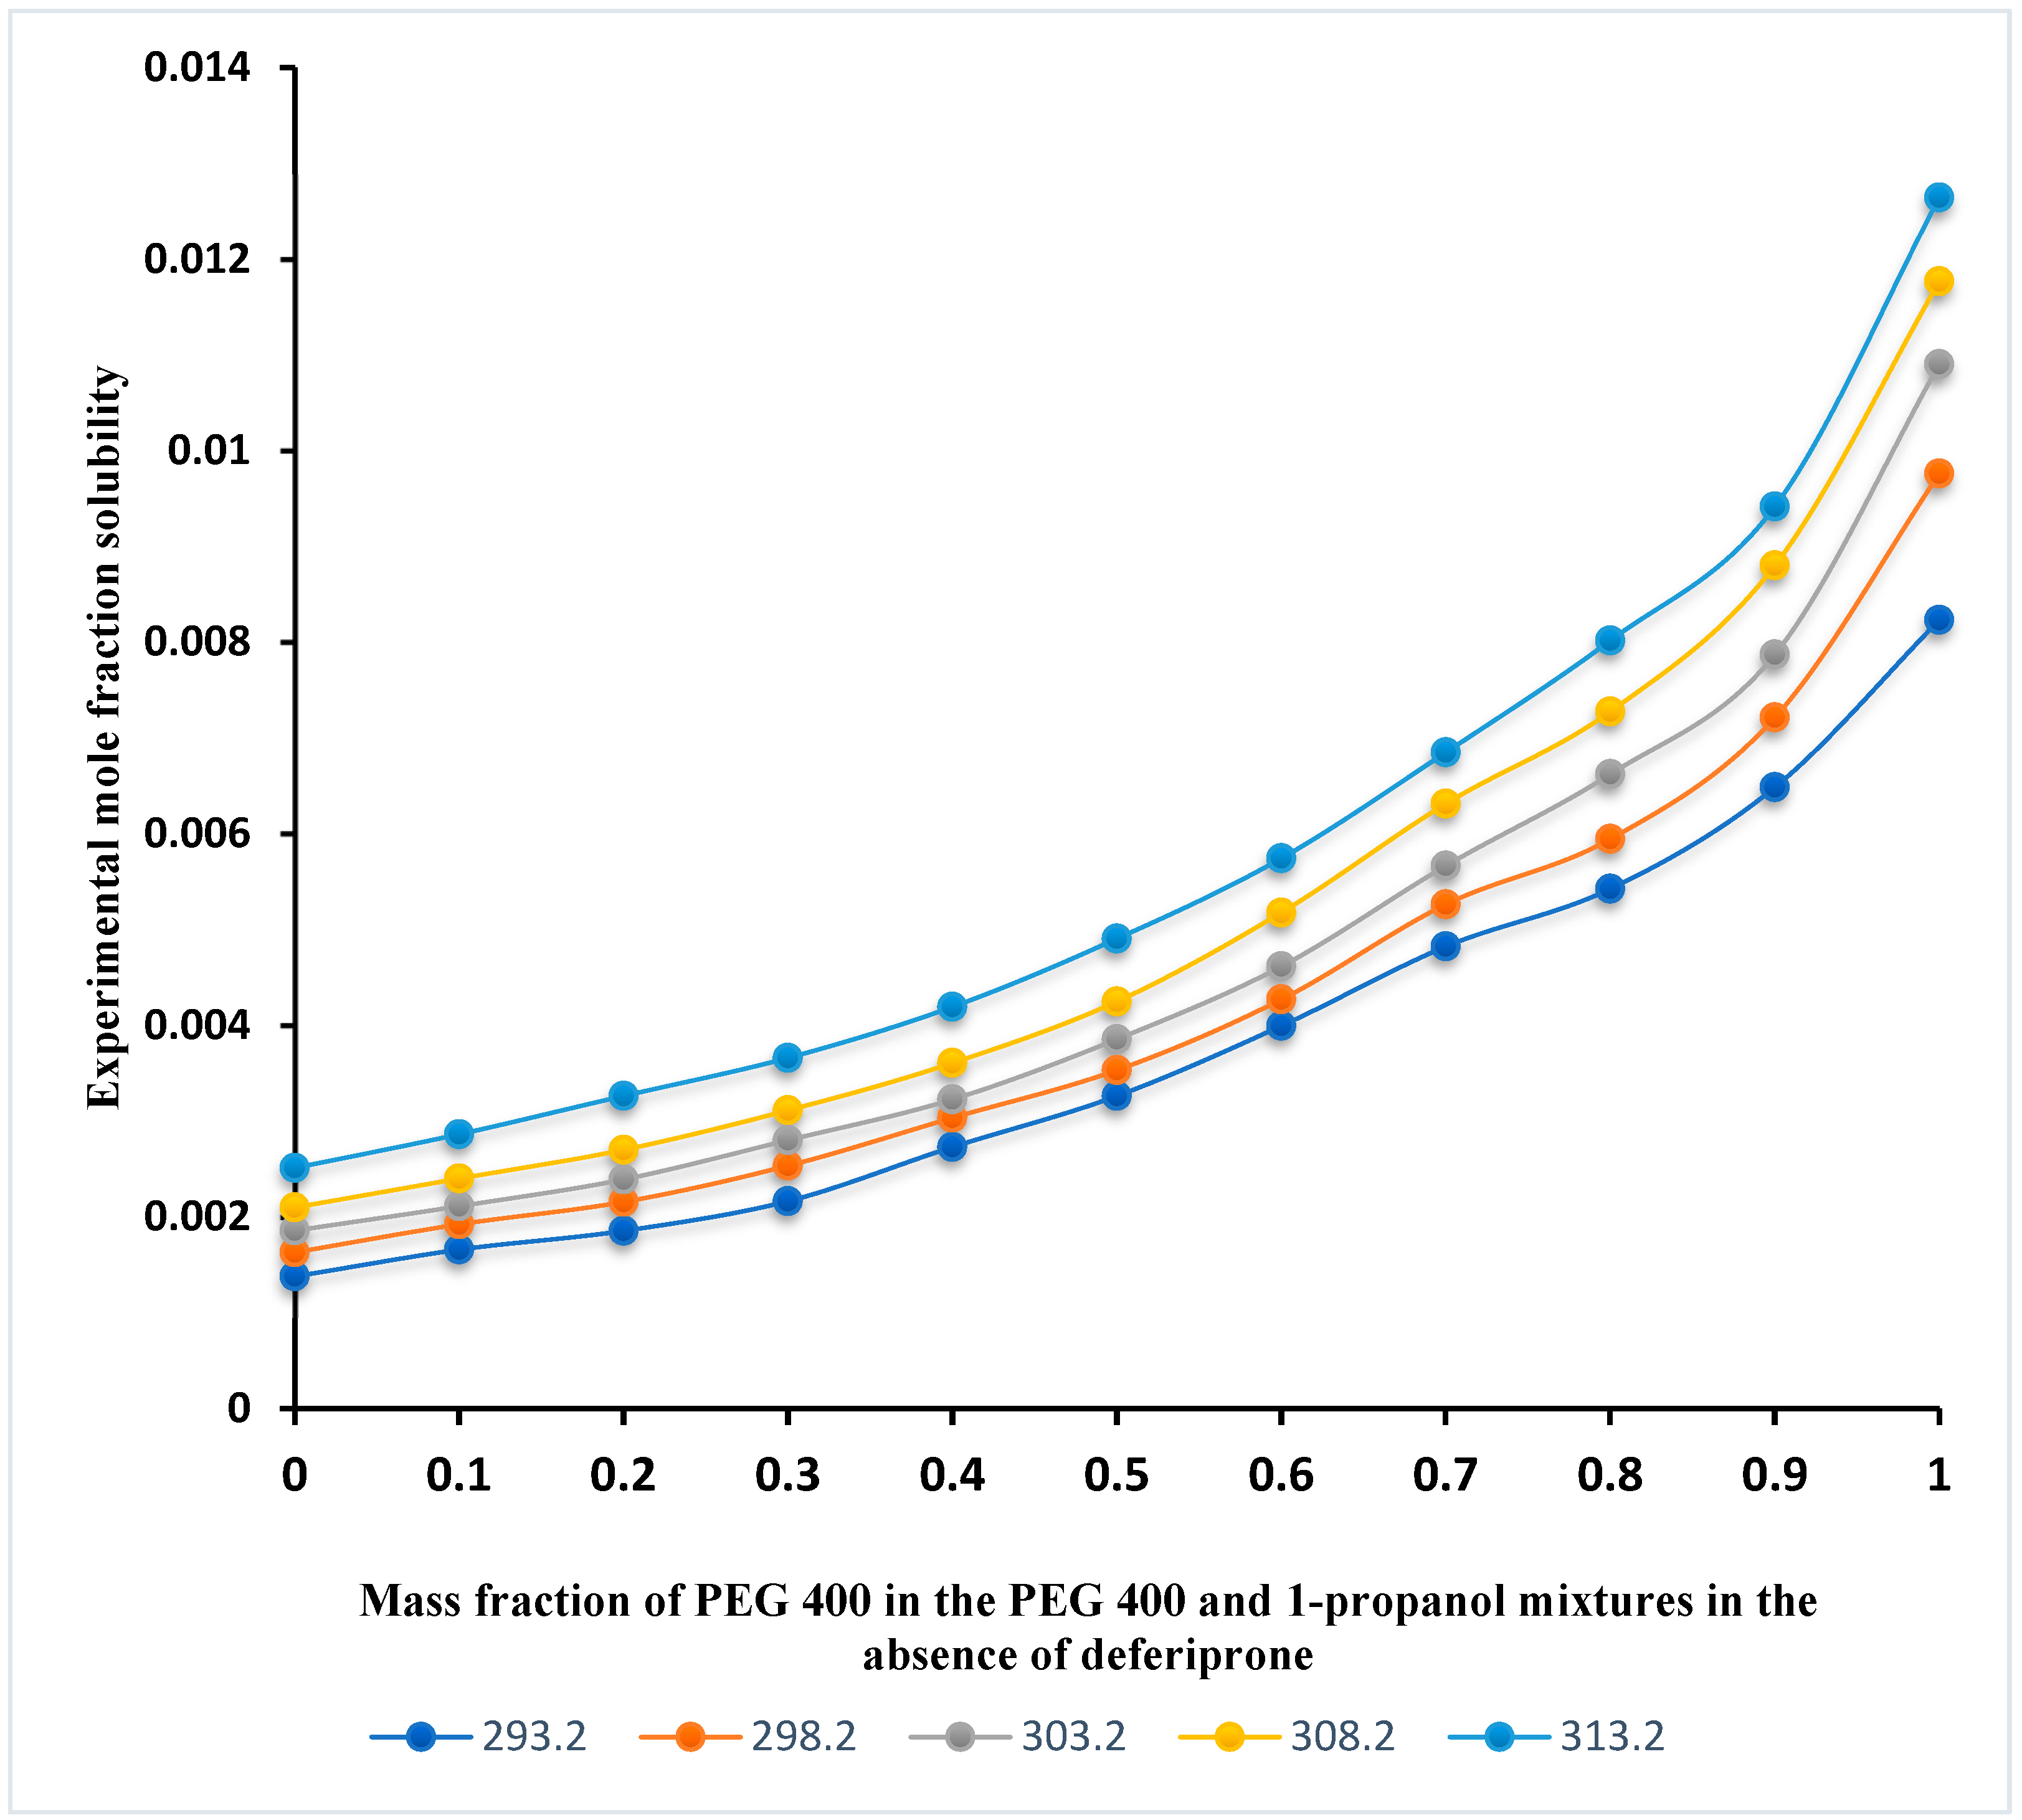
3.1. Solubility Profile of Deferiprone and Data Modeling

The relevance between mole fraction solubility and good solvent mass fraction, as well as temperature, is elucidated in Figure 2 and Table S1 (see Supplementary Materials). The graph indicates a consistent upward trend in the solubility of deferiprone across the solvent mixtures evaluated, with the peak mole fraction solubility detected in neat PEG 400. The overall trend of the solubility data is very similar to that of the solubility of deferiprone in PEG 400 + 2-propanol data reported in a previous work. This is an acceptable pattern since the solvent systems are very similar to each other.
The solubility data obtained from the experiments aligns closely with the correlated data using the van’t Hoff, λh, Yalkowsky, modified Wilson, Jouyban–Acree and Jouyban–Acree–van’t Hoff models. The parameters for these mathematical models, as well as the MRD% from the back-calculated data, are compiled in Table 2, Table 3, Table 4, Table 5 and Table 6. The MRD% for these models are notably low, being 1.4%, 2.0%, 8.5%, 1.8%, 2.8%, and 3.0%, respectively, for the van’t Hoff, λh, Yalkowsky, modified Wilson, Jouyban–Acree and Jouyban–Acree–van’t Hoff models, which underscores their robust predictive and correlative efficacy for solubility data. A slightly large MRD% was observed for the Yalkowsky model, which is an expected observation since it has a smaller number of model constants. It is obvious that, from a computational viewpoint, the more the number of curve-fit parameters, the more accurate the results. The main advantage for the Yalkowsky model is its simplicity and the requirement of the lowest number of training data points.
Additionally, the measured density (g·cm−3) values of the deferiprone-saturated solutions in the binary mixtures of PEG 400 and 1-propanol at various temperatures are detailed in Table 7.
The density data of the saturated solutions could be mathematically represented using an adopted version of the Jouyban–Acree model [16]. The model for correlating the reported density data in Table 7 is as follows:
ln ρ m , T = w 1 ln ρ 1 , T + w 2 ln ρ 2 , T 8.450 w 1 w 2 T
which correlated the data with the MRD% of 0.2 ± 0.2% (N = 55).

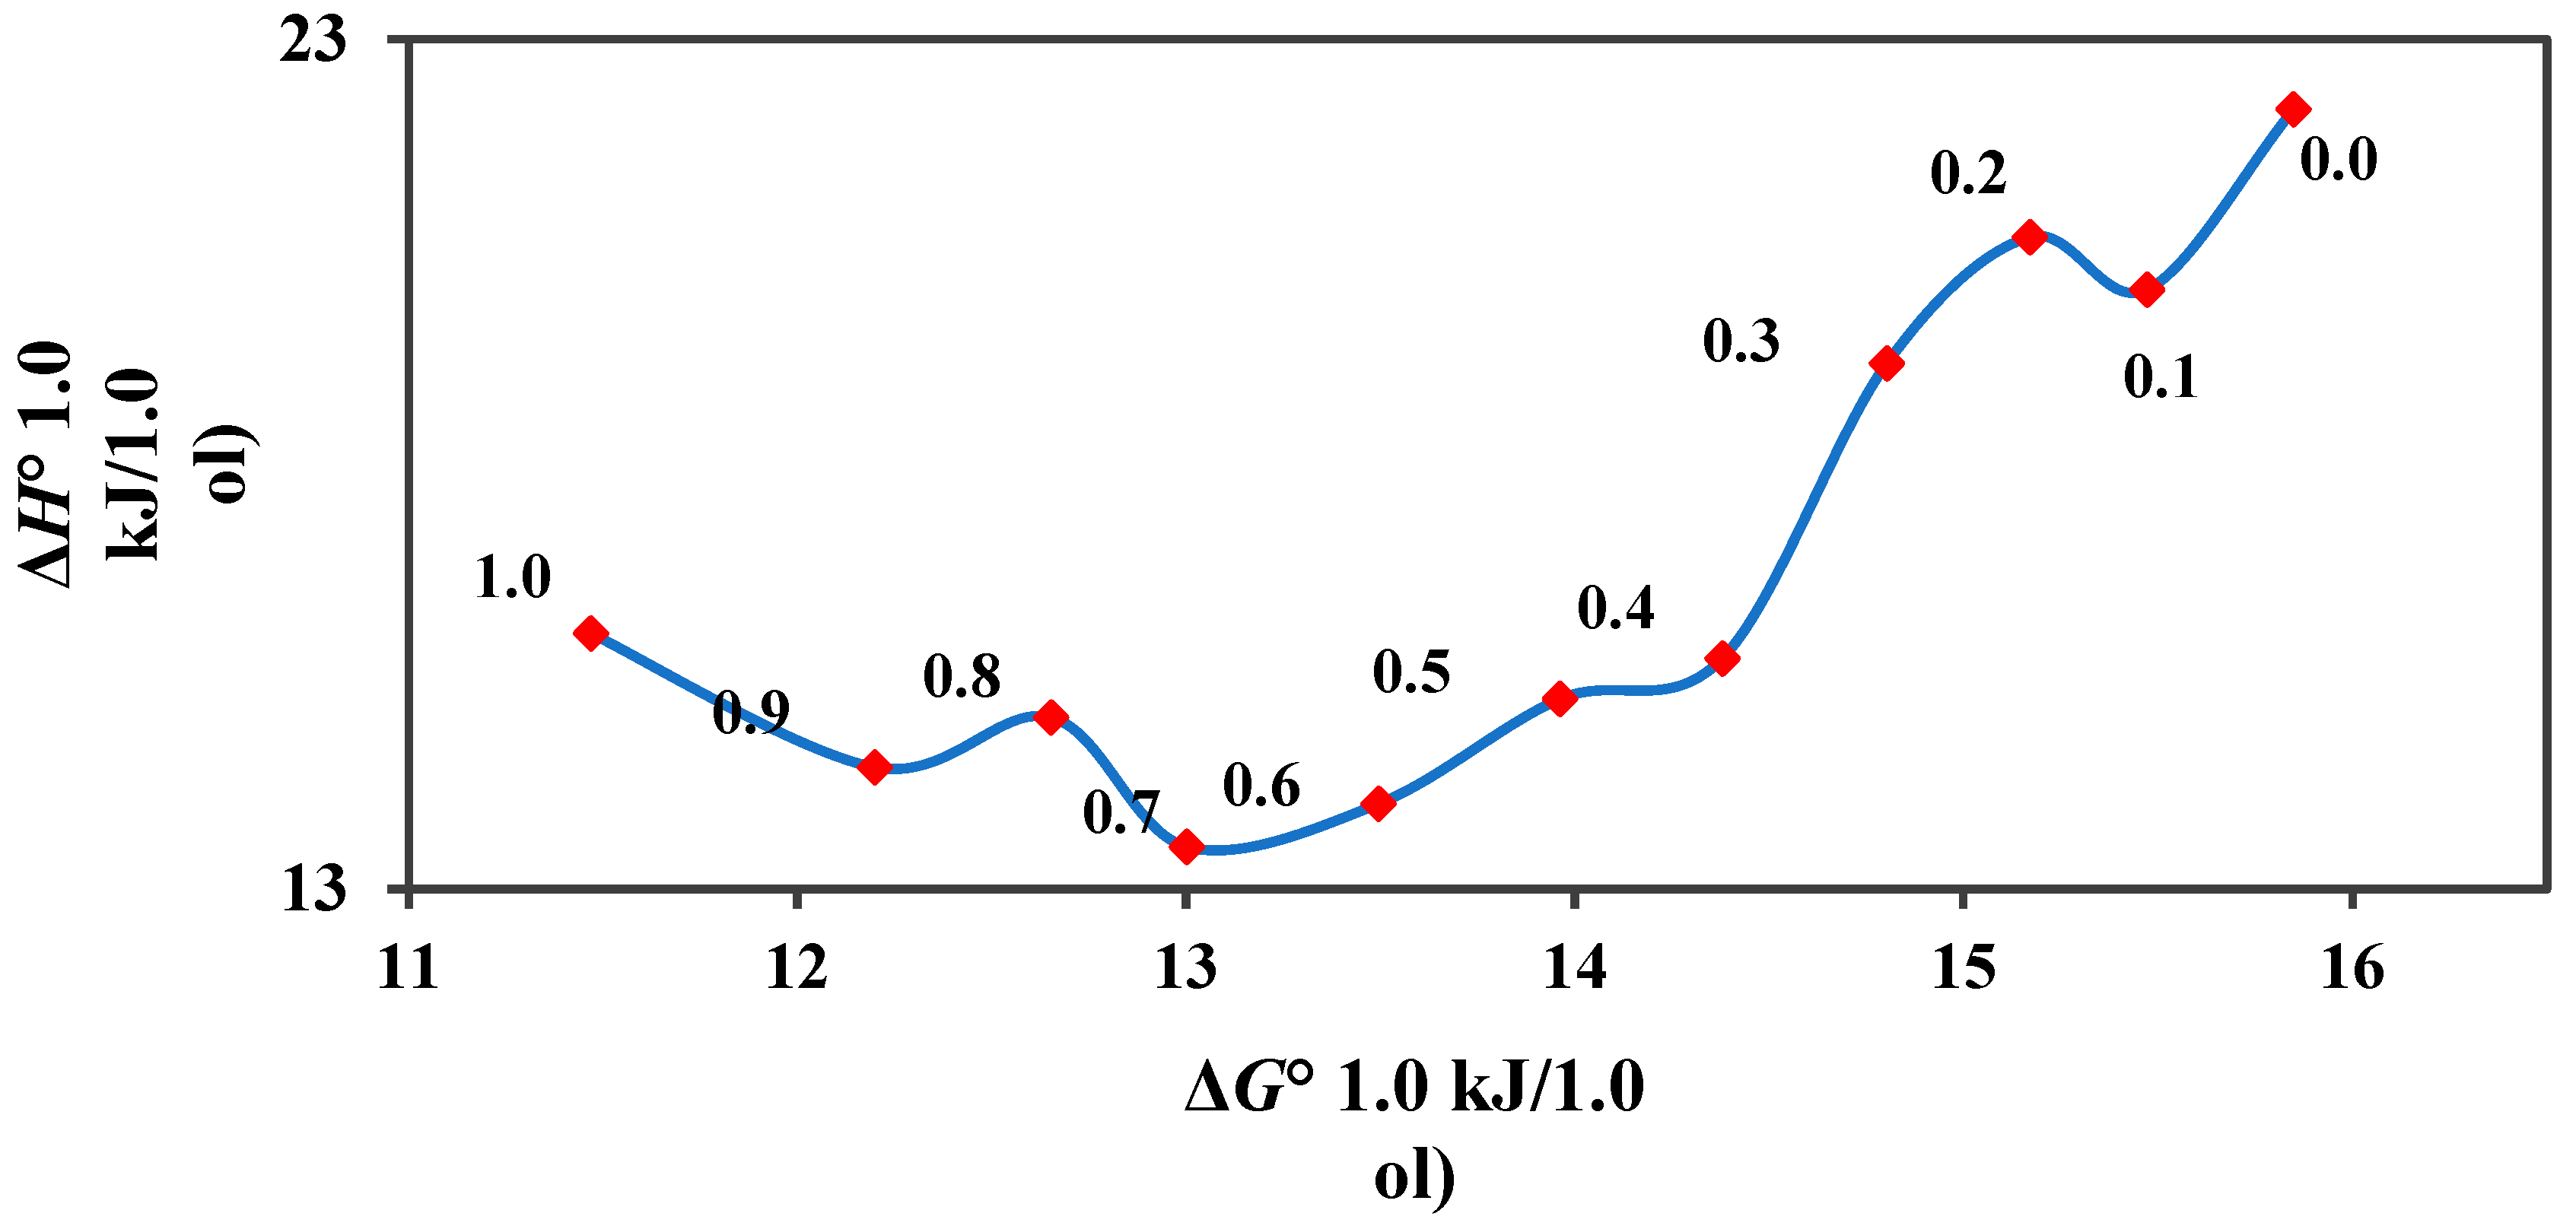
3.2. Calculation of Thermodynamic Parameters of Deferiprone Dissolution

As delineated in Table 8, the apparent thermodynamic properties (ΔG°, Δ and ΔS°) are derived through computations employing the Gibbs and van’t Hoff equations. The outcomes indicate that the dissolution of deferiprone is characterized by an endothermic nature and exhibits a propensity toward entropy-driven mechanisms. A more granular examination reveals positive ΔH° values across all mixtures, attaining a maximum of 22.18 kJ·mol−1 at w1 = 0.0 and a minimum of 13.50 kJ·mol−1 at w1 = 0.7. The positive entropy values in all instances signify an entropically favorable dissolution process. A comparative analysis between the two solvents underscores that the lowest reported ΔG° value corresponds to the maximum solubility, aligning with the established principles of general thermodynamics.
Enthalpy–entropy compensation analyses (Figure 3) elucidate that the mass transfer of deferiprone demonstrates a non-linear pattern characterized by positive slopes from 0.0 ≤ w1 ≤ 0.1, 0.2 ≤ w1 ≤ 0.7, and 0.8 ≤ w1 ≤ 0.9 and a negative slope from 0.1 ≤ w1 ≤ 0.2 and 0.7 ≤ w1 ≤ 0.8. In the initial scenario (mass fraction of PEG 400 from 0.0 ≤ w1 ≤ 0.1 and 0.2 ≤ w1 ≤ 0.7), the transfer of deferiprone is primarily governed by enthalpy whereas in the subsequent case (mass fraction of PEG 400 from 0.1 ≤ w1 ≤ 0.2 and 0.7 ≤ w1 ≤ 0.8), the driving force for deferiprone transfer is attributed to entropy.

4. Conclusions

This study documents the solubility and density metrics of deferiprone. Within binary mixtures, the incorporation of PEG 400 enhances solubility so that the solubility curve reaches its maximum point in neat PEG 400. This study also evaluates deferiprone’s solubility data using various mathematical models: the van’t Hoff, λh, Yalkowsky, modified Wilson, Jouyban–Acree, and Jouyban–Acree–van’t Hoff models. The MRD% for these equations are 1.4%, 2.0%, 8.5%, 1.8%, 2.7%, and 2.7%, respectively, indicating strong correlations. Furthermore, the apparent thermodynamic parameters of deferiprone’s dissolution were determined through Gibbs and van’t Hoff analyses, illustrating that entropy predominates as the dissolution’s driving force. The thermodynamic functions of mixing, such as ΔG° (Gibbs free energy change), Δ (enthalpy change) and ΔS° (entropy change), are all positive, indicating that the dissolution of deferiprone in the utilized alcohol solvents is both endothermic and driven by entropy.

Supplementary Materials

The following supporting information can be downloaded at: https://www.mdpi.com/article/10.3390/liquids5010005/s1, Table S1: Experimental mole fraction solubility (xm,T) values as the mean of three experiments (±standard deviation) measured for deferiprone in the binary mixtures of PEG 400 and 1-propanol at different temperatures.

Author Contributions

Conceptualization, A.J.; Methodology, H.R.; validation, H.R.; investigation, H.R.; data curation, H.R. and A.J.; writing—original draft, H.R. and A.J.; writing—review and editing, A.J.; visualization, A.J.; supervision, A.J.; funding acquisition, H.R. All authors have read and agreed to the published version of the manuscript.

Funding

The research protocol was approved and supported by the Student Research Committee, under grant number 69213, of the Faculty of Pharmacy, Tabriz University of Medical Sciences, Tabriz, Iran.

Data Availability Statement

We presented all data. Further data will be available on request.

Conflicts of Interest

The authors declare no conflicts of interest.

References

  1. Thachil, J.; Owusu-Ofori, S.; Bates, I. Haematological diseases in the tropics. In Manson’s Tropical Infectious Diseases; W.B. Saunders: Philadelphia, PA, USA, 2014; p. 894. [Google Scholar]
  2. Vij, R.; Machado, R.F. Pulmonary complications of hemoglobinopathies. Chest 2010, 138, 973–983. [Google Scholar] [CrossRef] [PubMed]
  3. Taher, A.T.; Saliba, A.N. Iron overload in thalassemia: Different organs at different rates. Hematology 2017, 2017, 265–271. [Google Scholar] [CrossRef] [PubMed]
  4. Iuliano, L.; Violi, F.; Pedersen, J.Z.; Praticò, D.; Rotilio, G.; Balsano, F. Free radical-mediated platelet activation by hemoglobin released from red blood cells. Arch. Biochem. Biophys. 1992, 299, 220–224. [Google Scholar] [CrossRef] [PubMed]
  5. Panigrahi, I.; Agarwal, S. Thromboembolic complications in β-thalassemia: Beyond the horizon. Thromb. Res. 2007, 120, 783–789. [Google Scholar] [CrossRef] [PubMed]
  6. Timoshnikov, V.A.; Kobzeva, T.V.; Polyakov, N.E.; Kontoghiorghes, G.J. Redox interactions of vitamin C and iron: Inhibition of the pro-oxidant activity by deferiprone. Int. J. Mol. Sci. 2020, 21, 3967. [Google Scholar] [CrossRef] [PubMed]
  7. Jouyban, A.; Abbasi, M.; Rahimpour, E.; Barzegar-Jalali, M.; Vaez-Gharamaleki, J. Deferiprone solubility in some non-aqueous mono-solvents at different temperatures: Experimental data and thermodynamic modelling. Phys. Chem. Liq. 2018, 56, 619–626. [Google Scholar] [CrossRef]
  8. Savjani, K.T.; Gajjar, A.K.; Savjani, J.K. Drug solubility: Importance and enhancement techniques. Int. Sch. Res. Not. 2012, 2012, 195727. [Google Scholar] [CrossRef] [PubMed]
  9. Jouyban, A. Review of the cosolvency models for predicting solubility of drugs in water-cosolvent mixtures. J. Pharm. Pharm. Sci. 2008, 11, 32–58. [Google Scholar] [CrossRef] [PubMed]
  10. Gheitasi, N.; Nazari, A.H.; Haghtalab, A. Thermodynamic modeling and solubility measurement of cetrizine hydrochloride and deferiprone in pure solvents of acetonitrile, ethanol, acetic acid, sulfolane, and ethyl acetate and their mixtures. J. Chem. Eng. Data 2019, 64, 5486–5496. [Google Scholar] [CrossRef]
  11. Chahiyan-Broujeni, H.; Gharib, F. Thermodynamic study on solubility of deferiprone at different ionic strengths and various temperatures. Montash Chem. 2016, 147, 1177–1181. [Google Scholar] [CrossRef]
  12. Zhou, C.; Shi, X.; Wang, H.; An, N. Measurement and correlation of solubilities of trans-ferulic acid in solvents. J. Chem. Ind. Eng. 2007, 58, 2705. [Google Scholar]
  13. Buchowski, H.; Ksiazczak, A.; Pietrzyk, S. Solvent activity along a saturation line and solubility of hydrogen-bonding solids. J. Phys. Chem. 1980, 84, 975–979. [Google Scholar] [CrossRef]
  14. Yalkowsky, S.H. (Ed.) Solubility and Solubilization in Aqueous Media, Techniques of Solubilization of Drugs; Marcel Dekker: New York, NY, USA, 1981. [Google Scholar]
  15. Perlovich, G.L.; Kurkov, S.V.; Bauer-Brandl, A. Thermodynamics of solutions: II. Flurbiprofen and diflunisal as models for studying solvation of drug substances. Eur. J. Pharm. Sci. 2003, 19, 423–432. [Google Scholar] [CrossRef] [PubMed]
  16. Jouyban, A.; Acree, W.E. A single model to represent physico-chemical properties of liquid mixtures at various temperatures. J. Mol. Liq. 2021, 323, 115054. [Google Scholar] [CrossRef]
Figure 1. Molecular structure of deferiprone.
Liquids 05 00005 g001
Figure 2. Experimental mole fraction solubility values measured for deferiprone in the binary mixtures of PEG 400 and 1-propanol at different temperatures under atmospheric pressure (101 kPa).
Liquids 05 00005 g002
Figure 3. Enthalpy–entropy compensation plot for deferiprone in the mixtures of PEG 400 and 1-proanol at 303.0 K. The numbers represent the mass fraction of PEG 400 in PEG 400 and 1-propanol mixtures in the absence of deferiprone.
Liquids 05 00005 g003
Table 1. Information of the materials used in the study.
Chemical NameCAS No.Molecular FormulaMolar Mass
(g·mole−1)
SourcePurity (Percentage)Analysis Method
Deferiprone30652-11-0C7H9NO2139.15Arasto Pharmaceutical Chemicals Inc., Tehran, Iran≥99.7%HPLC a
1-Propanol71-23-8C3H8O60.10Merck, Darmstadt, Germany≥99.5%GC b
Polyethylene glycol 40025322-68-3C2nH4n+2On+1, n = 8.2 to 9.1380–420Merck, Darmstadt, Germany≥99.0%GC b
Distilled deionized water7732-18-5H2O18.02Shahid Ghazi Pharmaceutical Co., Tabriz, Iran≥99.9%GC b
Ethanol64-17-5C2H6O46.07Jahan Alcohol Teb, Arak, Iran≥93.5%GC b
a high-performance liquid chromatography; b gas chromatography.
Table 2. The van’t Hoff model parameters and the corresponding MRD% for deferiprone in the binary mixtures of PEG 400 and 1-propanol.
w1ABMRD%
0.002.512−2667.4481.2
0.101.819−2412.1511.9
0.202.185−2486.6422.0
0.301.741−2307.8751.5
0.400.530−1890.2122.2
0.500.506−1832.6651.8
0.600.202−1684.2221.4
0.700.196−1623.2790.6
0.800.940−1806.6590.3
0.900.886−1736.0010.7
1.001.802−1925.6542.4
Overall1.4
Table 3. The λh equation constants and the MRD% for the back-calculated solubility of deferiprone in the binary mixtures of PEG 400 and 1-propanol.
w1λhMRD%
0.000.50520.1032.4
0.100.50521.2133.0
0.200.50624.6803.2
0.300.50626.2192.2
0.400.50625.6262.9
0.500.50729.2632.7
0.600.50832.1852.1
0.700.51037.3051.1
0.800.51247.5531.0
0.900.51454.2310.6
1.000.52078.6291.5
Overall2.0
Table 4. ln x values of deferiprone obtained by the Yalkowsky model in the binary mixtures of PEG 400 and 1-propanol at different temperatures.
ln x
w1293.2 K298.2 K303.2 K308.2 K313.2 K
0.00−6.59−6.42−6.29−6.17−5.99
0.10−6.41−6.24−6.11−5.99−5.83
0.20−6.23−6.06−5.94−5.82−5.66
0.30−6.05−5.88−5.76−5.65−5.50
0.40−5.87−5.70−5.58−5.48−5.34
0.50−5.69−5.52−5.40−5.30−5.18
0.60−5.51−5.35−5.23−5.13−5.02
0.70−5.34−5.17−5.05−4.96−4.86
0.80−5.16−4.99−4.87−4.79−4.69
0.90−4.98−4.81−4.70−4.61−4.53
1.00−4.80−4.63−4.52−4.44−4.37
MRD%3.28.211.110.19.7
Overall MRD%8.5
Table 5. The modified Wilson model parameters at the investigated temperatures and the MRD% for the back-calculated deferiprone solubility in the binary mixtures of PEG 400 and 1-propanol.
T (K)λ12λ21MRD%
293.20.7111.2212.4
298.20.7561.3232.1
303.21.4620.6841.6
308.21.4330.6981.4
313.21.4550.6871.6
Overall 1.8
Table 6. Parameters calculated for the Jouyban–Acree and Jouyban–Acree–van’t Hoff model for deferiprone solubility in the binary mixtures of PEG 400 and 1-propanol.
Jouyban–AcreeJouyban–Acree–van’t Hoff
J0−131.586A11.802
J1−56.892B1−1925.654
J2−144.322A22.512
B2−2667.448
J0−131.235
J1−56.563
J2−143.446
MRD% 2.83.0
Table 7. Measured density (g·cm−3) of deferiprone-saturated solutions in the binary mixtures of PEG 400 and 1-propanol at different temperatures.
w1293.2 K298.2 K303.2 K308.2 K313.2 K
0.000.802 ± 0.0010.798 ± 0.0010.796 ± 0.0010.794 ± 0.0010.788 ± 0.001
0.100.823 ± 0.0010.823 ± 0.0010.822 ± 0.0010.820 ± 0.0010.819 ± 0.001
0.200.853 ± 0.0020.851 ± 0.0010.849 ± 0.0000.847 ± 0.0010.845 ± 0.003
0.300.879 ± 0.0010.877 ± 0.0010.877 ± 0.0000.875 ± 0.0010.874 ± 0.001
0.400.907 ± 0.0010.906 ± 0.0010.906 ± 0.0010.905 ± 0.0010.904 ± 0.001
0.500.940 ± 0.0020.938 ± 0.001 0.937 ± 0.0010.936 ± 0.0010.936 ± 0.001
0.600.971 ± 0.0010.971 ± 0.0010.969 ± 0.0020.967 ± 0.0020.967 ± 0.001
0.701.007 ± 0.0011.006 ± 0.0011.005 ± 0.0011.003 ± 0.0011.002 ± 0.001
0.801.042 ± 0.0011.042 ± 0.0011.039 ± 0.0011.038 ± 0.0011.038 ± 0.001
0.901.082 ± 0.0001.080 ± 0.0011.079 ± 0.0011.075 ± 0.0021.074 ± 0.001
1.001.123 ± 0.0011.120 ± 0.0011.119 ± 0.0011.116 ± 0.0021.114 ± 0.001
Table 8. Apparent thermodynamic parameters for dissolution behavior of deferiprone in the binary mixtures of PEG 400 and 1-propanol at Thm (303 K).
w1 aΔG°
(kJ·mol−1)
ΔH°
(kJ·mol−1)
ΔS°
(J·K−1·mol−1)
TΔS°
(kJ·mol−1)
ζHζTΔS
0.0015.8522.1820.886.330.7780.222
0.1015.4720.0615.134.580.8140.186
0.2015.1720.6718.165.500.7900.210
0.3014.8019.1914.474.390.8140.186
0.4014.3815.724.411.340.9220.078
0.5013.9615.244.20 1.270.9230.077
0.6013.4914.001.680.510.9650.035
0.7013.0013.501.630.490.9650.035
0.8012.6515.027.822.370.8640.136
0.9012.2014.437.372.230.8660.134
1.0011.4716.0114.994.540.7790.221
a w1 is the mass fraction of PEG 400 in the PEG 400 and 1-propanol mixtures in the absence of deferiprone.
Disclaimer/Publisher’s Note: The statements, opinions and data contained in all publications are solely those of the individual author(s) and contributor(s) and not of MDPI and/or the editor(s). MDPI and/or the editor(s) disclaim responsibility for any injury to people or property resulting from any ideas, methods, instructions or products referred to in the content.

