Article

Visualization of the 3D Structure of Subcritical Aqueous Ca(NO3)2 Solutions at 25~350 °C and 40 MPa by Raman and X-Ray Scattering Combined with Empirical Potential Structure Refinement Modeling

1
Key Laboratory of Comprehensive and Highly Efficient Utilization of Salt Lake Resources, Key Laboratory of Salt Lake Resources Chemistry of Qinghai Province, Qinghai Institute of Salt Lakes, Chinese Academy of Sciences, Xining 810008, China
2
Department of Chemistry, Faculty of Science, Fukuoka University, 8-19-1 Nanakuma, Jonan, Fukuoka 814-0180, Fukuoka, Japan
*
Author to whom correspondence should be addressed.
Current address: Research Institute, Maeda Road, 208 Oohata, Tsuchiura 300-4111, Ibaraki, Japan.
Submission received: 26 September 2024 / Revised: 17 December 2024 / Accepted: 18 December 2024 / Published: 24 December 2024
(This article belongs to the Collection Feature Papers in Solutions and Liquid Mixtures Research)

Abstract

:
Raman scattering measurements were performed on 1 mol dm−3 aqueous calcium nitrate (Ca(NO3)2) and sodium nitrate (NaNO3) solutions containing 4% (w/w) D2O in a temperature range from 25 to 350 °C and pressure of 40 MPa. As the temperature increased, the N–O symmetric stretching vibrational band (ν1) of NO3 at 1045–1047 cm−1 shifted to a lower wavenumber by 5~6 cm−1. The band analysis using one Lorentzian component showed that the full-width at half maximum (FWHM) did not change significantly below 175 °C but increased rapidly above 200 °C for both solutions. The peak area for an aqueous Ca(NO3)2 solution showed a breakpoint between 225 and 250 °C, suggesting a change in the coordination shell of NO3 at 175~250 °C. The OD symmetric stretching vibrational band of HDO water was deconvoluted into two Gaussian components at 2530 and 2645 cm−1; the former component has high temperature dependence that is ascribed to the hydrogen bonds, whereas the latter one shows less temperature dependence due to the non-hydrogen bonds of water. X-ray scattering measurements were performed on a 1 mol dm−3 aqueous Ca(NO3)2 solution at 25 to 210 °C and 40 MPa. Empirical potential structure refinement (EPSR) modeling was used to analyze the X-ray scattering data. Ca2+ forms a rigid coordination shell consisting of about seven water molecules at 2.48 Å and one NO3 at 25~170 °C, with further water molecules substituted by NO3 at 210 °C. NO3 is surrounded by 13~14 water molecules at an N–Ow distance of 3.6~3.7 Å. The tetrahedral network structure of solvent water pertains from 25 to 170 °C but is transformed to a dense packing arrangement at 210 °C.

Graphical Abstract

1. Introduction

Subcritical and supercritical water near the critical point (374.1 °C, 22.1 MPa) has attracted much attention as a new reaction field due to its unique properties not available under ambient conditions [1,2,3,4]. For example, the dielectric constant of water is 78 at 25 °C and 0.1 MPa, which dissolves electrolytes well. However, at 400 °C and 30 MPa, it decreases to about 6 [5] and behaves like a less polar organic solvent, making the electrolytes almost insoluble. On the other hand, the ionic product of water is 10−14 mol2 dm−6 at 25 °C and 0.1 MPa but increases to 10−11 mol2 dm−6 at 250 °C and 30 MPa, so acid-catalyzed reactions are promoted in subcritical water [1,2,3]. Taking advantage of its properties, subcritical and supercritical water has been used in applied fields, such as extraction and separation, the decomposition of chlorinated compounds, such as polychlorinated biphenyl (PCB) [1,2,3], and the formation of metal oxide fine particles [4]. To understand the unique properties and the underlying mechanism of reactions in subcritical and supercritical water and aqueous electrolyte solutions and the further development of supercritical water technology, the speciation and the local structure of aqueous electrolyte solutions under subcritical and supercritical conditions are highly needed.
Vibrational spectroscopy (IR and Raman), X-ray/neutron scattering methods, X-ray absorption spectroscopy (EXAFS and XANES), and theoretical calculations have often been used to determine the speciation and structure of aqueous electrolyte solutions [6,7]. IR and Raman scattering can indirectly obtain structural information from changes in the vibrational modes of dissolved chemical species and solvent water. On the other hand, X-ray/neutron scattering and EXAFS can provide direct structural information, such as the interatomic distance and coordination number. Therefore, it is important to use complementary techniques to determine solution structure. X-ray and neutron scattering methods provide only one-dimensional structural information averaged over time and space. Soper developed an empirical potential structure refinement (EPSR) modeling method to overcome this inherent limitation, reproducing experimental values by modifying the two-body potential based on structure factors obtained from X-ray/neutron scattering measurements [8,9,10]. EPSR modeling has proved useful in obtaining the site–site pair distribution functions, coordination number distributions, angle distribution, three-dimensional spatial density functions regarding ion solvation and association, and solvent water in aqueous electrolyte solutions.
Mg2+ and Ca2+ in aqueous solutions play an important role in biological systems, such as ion channels and transporters in membrane proteins [11,12]. To date, the speciation and solvation structure of Mg2+ and Ca2+ have been determined using Raman spectroscopy [13,14,15,16], X-ray scattering [16,17,18,19,20,21], neutron scattering [22,23,24,25,26], EXAFS [27,28,29], and classical molecular dynamics, ab initio, and density functional theory (DFT) calculations [17,19,21,27,28]. It has been established that Mg2+ forms the first solvation shell of six water molecules in aqueous solutions at room temperature. However, the solvation structure of Ca2+ remains ambiguous, e.g., the coordination number varies within 5.1~10, and the Ca–Ow (Ow is the water oxygen atom) distance is 2.39~3.46 Å. High-pressure and high-temperature perturb ion solvation and association and help us understand the intrinsic nature of ion solvation. Spohn and Brill [14] performed a Raman spectroscopy study of the species in 5.48 mol kg−1 Ca(NO3)2 aqueous solution up to 450 °C and 30 MPa. They observed that the width of the symmetric N–O band (ν1) of NO3 increases linearly to about 160 °C and then at a faster but steadily changing rate above 160 °C. They indicated an ion association between Ca2+ and NO3 as the temperature increases, but the detailed structure of the species was not conclusive. Takamuku et al. measured X-ray scattering of aqueous CaCl2·RH2O (R = 10 and 25, corresponding to 4.72 and 2.12 mol dm−3) in the pressure range of 0.7~1.6 GPa and the temperature range of 100~400 °C using synchrotron radiation at SPring-8 [20]. They concluded that the Ca–Ow and Cl–Ow distances do not change with pressure and temperature in the thermodynamic states measured. The hydration number of Ca2+ is 4~5, significantly smaller than 6~8 under ambient conditions. The number of the Ca2+–Cl ion pairs was determined as 0.3 with a Ca-Cl distance of 2.7–2.75 Å. Yamaguchi et al. performed neutron scattering experiments of 2 mol dm−3 CaCl2 aqueous solution in D2O at 0.1 MPa/25 °C and 1 GPa/25 °C [26]. About seven water molecules surround Ca2+ at both pressures at the Ca-Ow and Ca-Hw (Hw is the water hydrogen) distances of 2.44 and 3.70 Å, respectively, which differs from that reported by Takamuku [20]. We have developed high-temperature and high-pressure Raman and X-ray scattering cells operated over a pressure range from 0.1 to 40 MPa and a temperature range from 25 to 350 °C [30,31]. These cells successfully determined the species and structures of aqueous Mg(NO3)2 solutions at 25~350 °C and 40 MPa using Raman and X-ray scattering methods [29].
In this study, we measured Raman spectra on a 1 mol dm−3 Ca(NO3)2 aqueous solution and a 1 mol dm−3 NaNO3 aqueous solution as a reference at 25~350 °C and 40 MPa. NO3 was chosen rather than Cl since the former is less aggressive at high temperatures. Furthermore, energy dispersive X-ray scattering measurements were performed at 25 °C and 0.1 MPa and from 100 to 210 °C and 40 MPa. Empirical potential structure refinement (EPSR) calculations were performed based on the obtained structure factors to determine the solvation and association of Ca2+ and NO3 and the solvent water structure. Based on the Raman spectra and X-ray scattering data, we visualized the three-dimensional (3D) structure of hydrogen bonds in water and the ion solvation and association.

2. Materials and Methods

2.1. Sample Preparation and Compositions

Sodium nitrate NaNO3 (special grade reagent) and calcium nitrate tetrahydrate Ca(NO3)2·4H2O (special grade reagent) were purchased from Wako Chemical Co. Ltd. and used without further purification. Next, 1 mol dm−3 aqueous NaNO3 and Ca(NO3)2 solutions were prepared by dissolving dry metal nitrates into degassed distilled water. The concentration of Na+ was determined by drying an NaNO3 solution at 283 °C and weighing the dry NaNO3 powder. The concentration of Ca2+ was determined by titration with a standard EDTA (ethylenediaminetetraacetic acid) aqueous solution using an EBT (Eriochrome Black T) indicator. The concentration of NO3 was determined by a cation exchange resin method. A certain amount of an aqueous Ca(NO3)2 solution was passed through a column packed with a cation exchange resin (H type) (Muromachi Chemical Ltd., Omuta, Fukuoka, Japan). The effluent was titrated with a standard aqueous NaOH solution using a phenolphthalein indicator. The density of the sample solutions was measured at 25 °C using a densitometer DMA 35 (Anton Paar GmbH, Tokyo, Japan). The results obtained are summarized in Table 1. The sample solutions for Raman spectral measurements were prepared by adding 4% (w/w) D2O (D = 99.8%, Kanto Kagaku Ltd., Tokyo, Japan) to aqueous NaNO3 and Ca(NO3)2 solutions to observe the O–D symmetric band of solvent water instead of the complex O–H band of water.

2.2. Raman Scattering Measurements

Raman spectra were measured with a laser Raman spectrometer T64000 (HORIBA Jobin Yvon, Kyoto, Japan). A high-pressure pump inserted a sample solution into a high-temperature and high-pressure Raman cell with a sapphire window cut on the C-axis plane (Taiatsu Glass Ltd., Tokyo, Japan) (Figure 1). The sample solution was irradiated with Ar+ laser light (wavelength 5145 Å), and the backscattered light was detected with a CCD detector. The laser power was 100 mW. Measurements were carried out at 25 K intervals in the temperature range from 25 to 350 °C at a pressure of 40 MPa. For each thermodynamic condition, the integration time of measurement was 15 min. The obtained Raman spectrum was analyzed using Origin Ver. 7. A Lorentzian function Equation (1) was used as a fitting function for the ν1(NO) band of the nitrate ion.
y = y 0 + 2 A π w 4 x x c 2 + w 2 .
Here, xc is the peak wavenumber, A is the area, and w is the band’s FWHM. We measured the symmetric stretching mode (ν1), the antisymmetric stretching mode (ν3), and the bending mode (ν4) of NO3. Band analysis of the ν3 and ν4 modes was not performed since the intensity of the ν3 mode was weak, and the ν4 band partially overlapped with the 720–750 cm−1 band of a sapphire window. The O–D symmetric stretching band (ν1) of water (HDO) was analyzed using the Gaussian function, which gave better fits than the Lorentzian function.

2.3. X-Ray Scattering Measurements

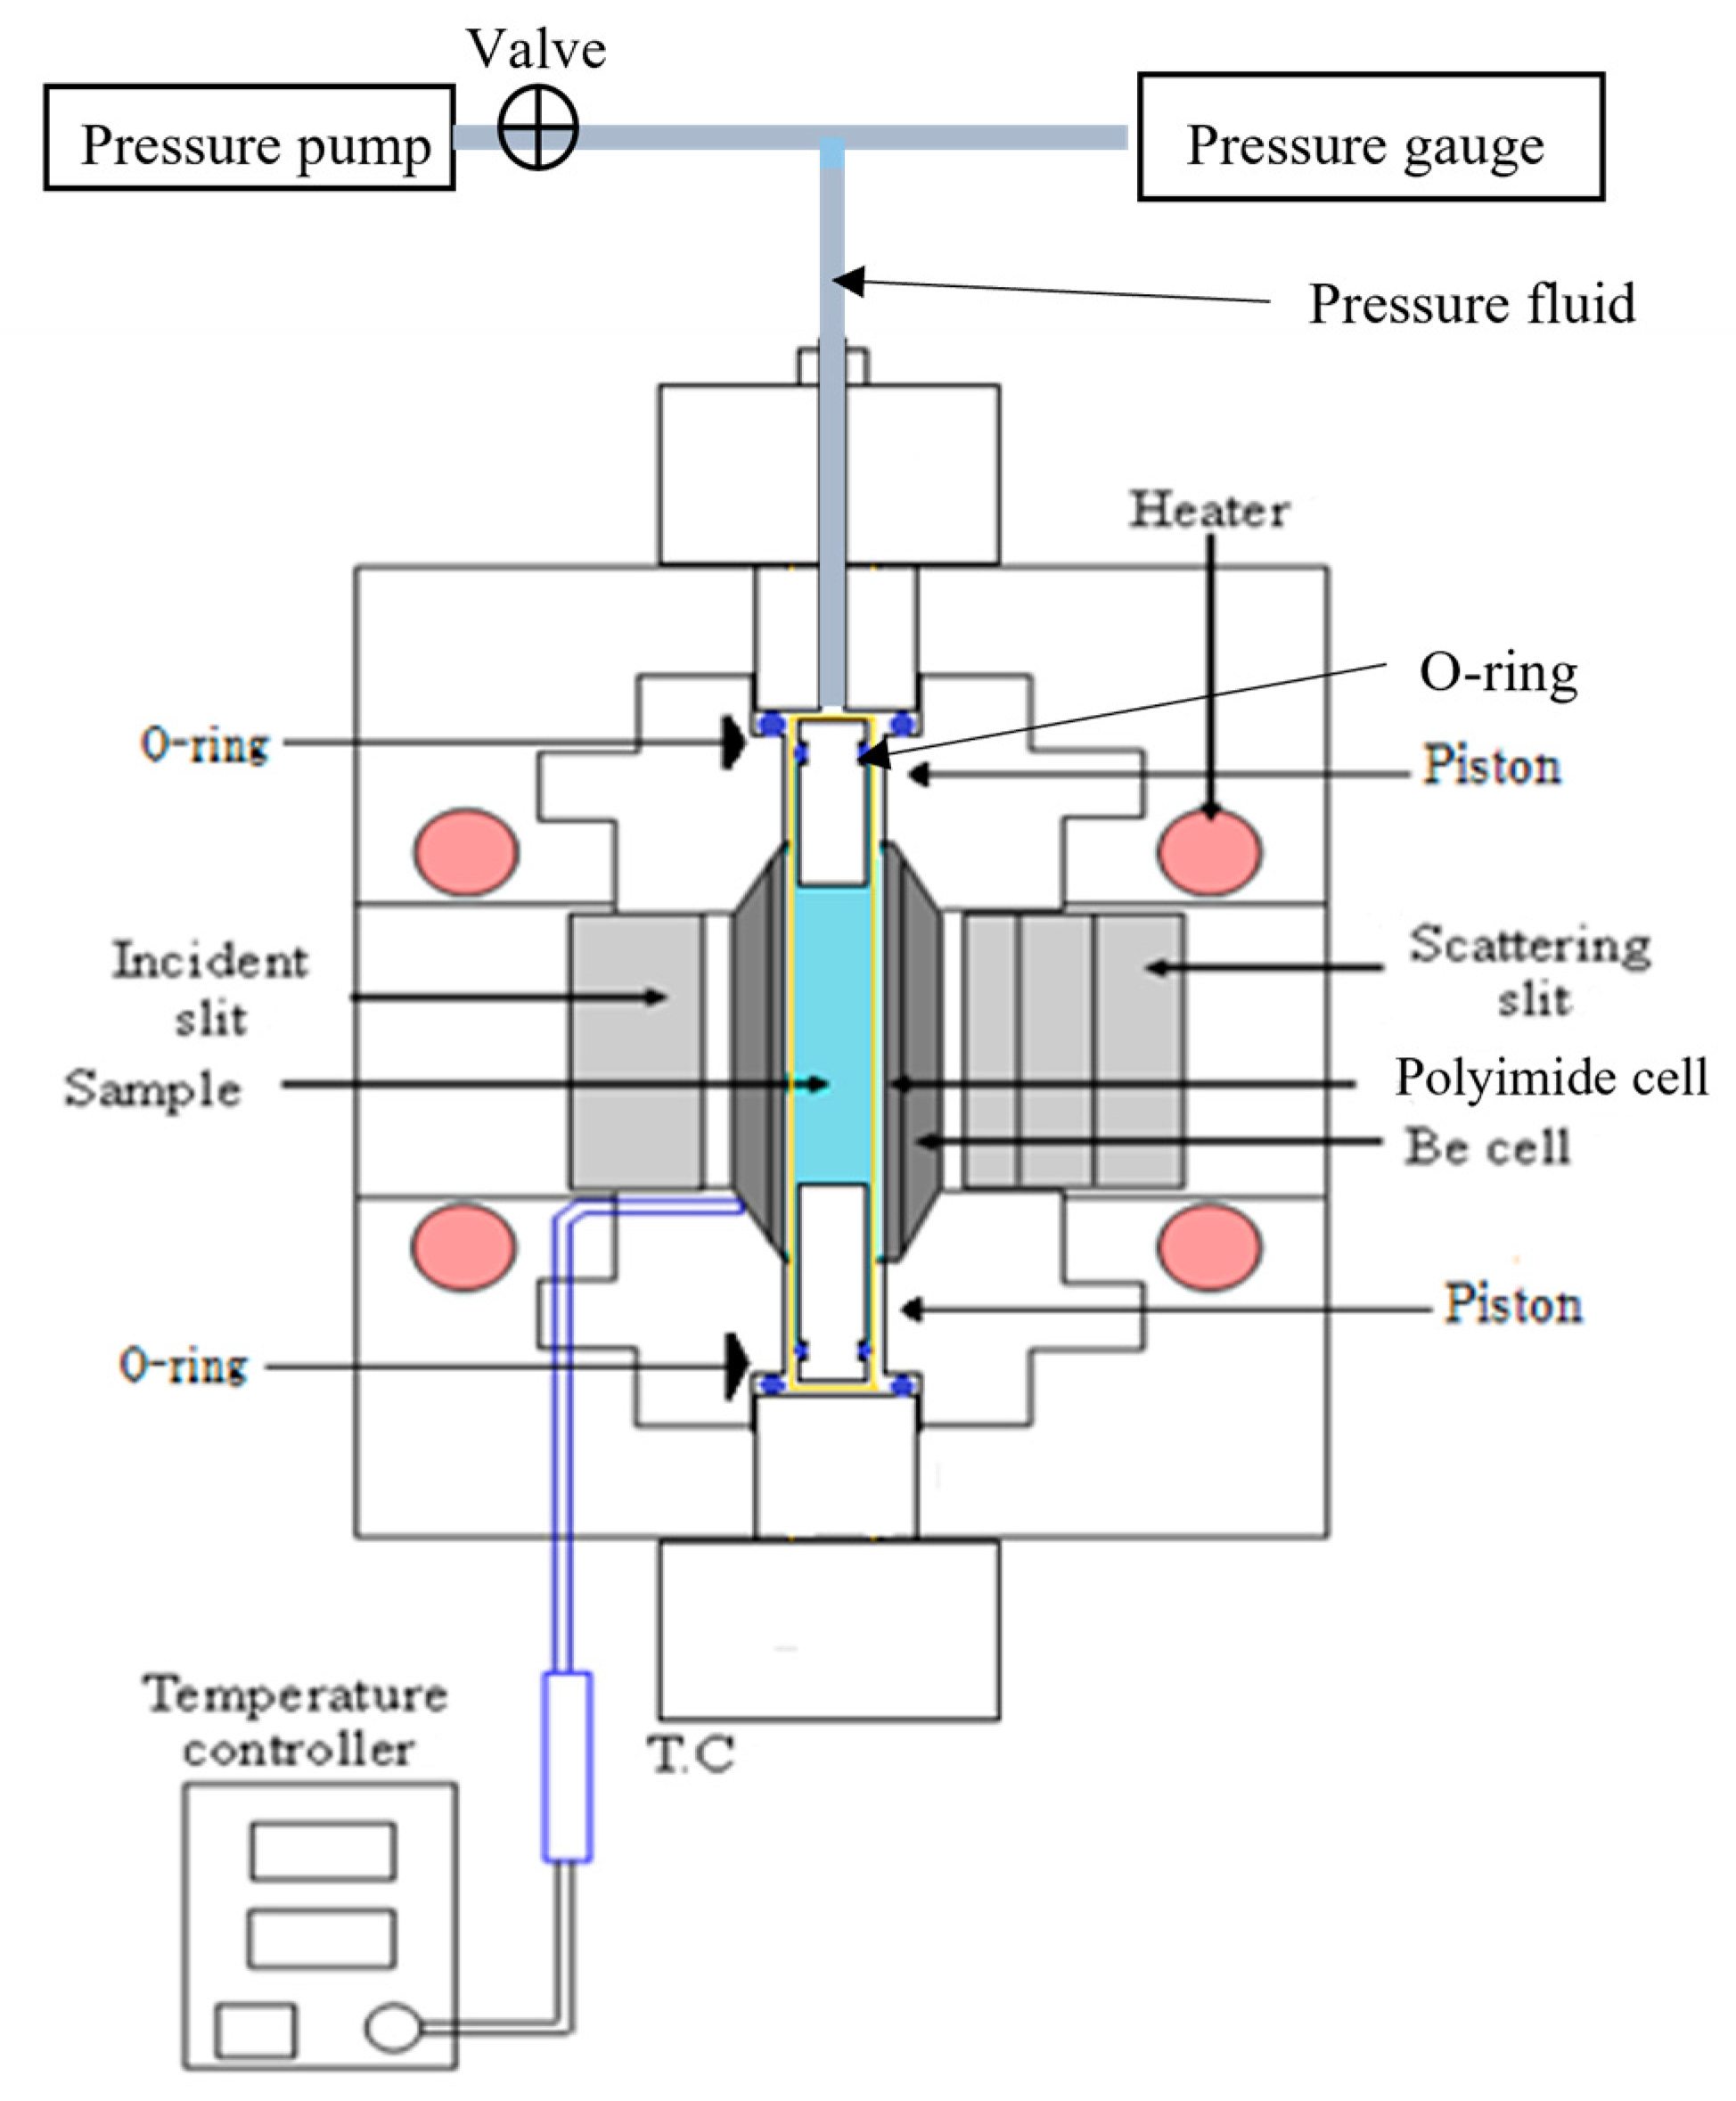
Energy-dispersive X-ray diffraction (EDXD) measurements were made on an X-ray goniometer (Rigaku, TTR, Akishima, Tokyo, Japan) equipped with a Ge-solid state detector (SSD) (Canberra, GL0210R, Tokyo, Japan). White X-rays were generated from a rotating tungsten anode (Rigaku, ultraX 18, 50 kV, 300 mA). The X-ray source and Ge-SSD were moved in the vertical direction. The goniometer radius is 185 mm. The energy resolution of the SSD is approximately 200 eV in the X-ray energy range used. The limit of SSD count loss is 30,000 cps. The signals detected by the SSD are amplified by a preamplifier and then accumulated for each energy of 2048 channels by a multichannel analyzer (MODEL 2030, Canberra). The details and performance of the energy-dispersive X-ray diffractometer have been described in refs. [30,31,32]. The solution sample was inserted into a high-temperature, high-pressure cell (PC50SCW-X, Syn Corporation Ltd., Kizugawa, Kyoto, Japan) (Figure 2). The cell body is made of Hastelloy and can be heated up to 500 °C by inserting four cartridge heaters. The measurement temperature of the Be cell was controlled to ±0.1 °C using a temperature controller and a K-type thermocouple. The sample section uses a beryllium (Be) cell (inner diameter 7.5 mm, outer diameter 11 mm, length 24 mm) (Japan Special Metals Co., Ltd., Osaka, Japan) around a polyimide cell (inner diameter 5 mm, outer diameter 7 mm, length 23 mm) (Syn Corporation, Ltd., Kizugawa, Kyoto, Japan). Outside the beryllium cell, tungsten slits of 0.1 mm width and 20 mm length were installed at 0° on the incident beam side and at −8° on the scattering side; those of 0.3 mm width and 20 mm length were used at 18°, 40°, and 60° on the scattering side. The slit combinations allowed us to measure only a sample solution without the scatterings from beryllium and polyimide cells. To assess the reliability of all correction procedures in EDXD, we performed conventional angle-dispersive X-ray diffraction (ADXD) measurement of a sample solution using an X-ray diffractometer (DIP301, Bruker AXS, Osaka, Japan) with an imaging plated area detector at 25 °C and 0.1 MPa. The details of data reduction procedures in ADXD were described elsewhere [6,7].

2.4. Data Correction and Analysis

To derive the structure–function i(Q) using the energy dispersive method, we needed the following corrections according to Nishikawa and Iijima’s method [33] and Hosokawa and Tamura’s method [34].

2.4.1. Energy Correction

The scattered X-ray signals detected by SSD were accumulated with a multichannel analyzer of 2048 channels for each energy. The relation (quadratic function) between the X-ray energy and channel number was obtained by measuring the energy of fluorescent X-rays of metal oxides of Y (Kα = 14.96 keV), Mo (17.48), Sn (25.27), La (33.44), and Sm (40.12) [35].

2.4.2. Escape Peak Correction

Some incident X-ray photons excite the K core electrons of Ge atoms, and Ge emits Kα and Kβ characteristic fluorescent X-rays. Since the Ge crystal does not adsorb fluorescent X-rays, an escape peak appears where the energy of the escaped fluorescent X-rays reduces the pulse height. This correction is made by Equation (2).
I ( E ) = 1 ( 1 y α ( E ) ) ( 1 y β ( E ) ) J ( E ) y α ( E + E K α ) 1 y α ( E + E K α ) J ( E + E K α ) y β ( E + E K β ) 1 y β ( E + E K β ) J ( E + E K β ) .
I(E) is the true X-ray intensity, J(E) is the apparent intensity observed by SSD, and yα(E) and yβ(E) are the escape rates of Ge Kα and Ge Kβ, respectively, at each energy of SSD. The escape rate was taken from the values measured by Mitsuhashi et al. [36]. The energies of Kα and Kβ fluorescent X-rays of Ge are 9.87 and 10.98 keV, respectively.

2.4.3. Absorption Correction

In transmission mode measurements using a high-temperature and high-pressure sample cell, it is necessary to correct the absorption by a Be cell, GC cell, and solution sample. Because of the W slits of 0.1 and 0.3 mm, the absorption by the Be and GC cells was corrected as flat plates. The absorption by the sample was corrected for a cylindrical sample using the program XCYLABS [37,38]. The mass line absorption coefficients of the sample and cell were taken from the literature [39].

2.4.4. The Incident Spectral Intensity I0

The incident X-ray spectrum was estimated using the Monte Carlo method developed by Funakoshi [40]. Thus, the scattering intensity corrected at each scattering angle was divided by the incident intensity I0 and then normalized to an absolute intensity (electron units) by a high-angle region method [41]. The scattering intensities in absolute units at the individual scattering angles were normalized and merged to obtain the total scattering intensity using the overlapping regions. All calculations were performed with the MCEDX program [40].
The incoherent scattering of a sample solution was subtracted from the total scattering intensity to obtain the coherent intensity I e u c o h Q . The interference function i(Q) was calculated by Equation (3).
i Q = I e u c o h x i f i 2 Q .
Here, xi is the molar concentration of component i in the solution, and fi(Q) is the atomic scattering factor of component i. The values of each atomic and incoherent scattering factor were taken from the literature [31]. The radial distribution function D(r) was obtained by the Fourier transform of i(Q) as Equation (4).
D r = 4 π r 2 ρ 0 + 2 r π Q m i n Q m a x Q i Q M Q sin ( Q r ) d Q .
ρ0 is the number density, and Qmin and Qmax are the lower and upper limits of wavevector Q, respectively. M(Q) is the modification function expressed as M ( Q ) = [ x i f i 2 ( 0 ) / x i f i 2 ( Q ) ] e x p   ( 0.01 Q 2 ) to correct the phase shift and minimize the termination effect in the Fourier transform. All calculations were made using the KURVLR program [37].

2.4.5. EPSR Modeling

The structure factor F(Q) used for EPSR calculations and the corresponding total distribution functions G(r) were derived using Equations (5) and (6), respectively.
F Q = I e u c o h Q x i f i 2 ( Q ) x i f i 2 ( Q ) ,
G r = Q m i n Q m a x Q F Q sin Q r d Q .
In total, 18 Ca2+ ions, 36 NO3 ions, and 1000 water molecules were placed in the unit cell for Monte Carlo calculations to reproduce the measured sample concentration. The total potential in EPSR consists of the reference potential Uref and the empirical potential (EP) energy UEP. Uref consists of the Lennard-Jones and Coulomb terms expressed by Equation (7).
U r e f r = 4 ε i j ( σ i j r ) 12 ( σ i j r ) 6 + q i q j 4 π ε 0 r .
The reference potentials employed were SPC/E [42] for water, the model of Mamatkulov et al. [43] for Ca2+, and the value of Megyes et al. [44] for NO3. The potential parameter values are given in Table 2.
First, Monte Carlo calculations were repeated over 10,000 times using the reference potentials until the system reached equilibrium. Once the system reached equilibrium, the structure factors of the system were calculated and compared with the measured values. Next, the empirical potential UEP was calculated using the difference in structure factors between EPSR calculations and experiments. Using the new potential obtained by correcting the reference potential using the obtained UEP, the Monte Carlo calculations were continued until a good agreement between the simulated and experimental structure factors was attained. Then, the calculation of UEP was stopped, and the Monte Carlo calculations were repeated tens of thousands of times until sufficient statistics in the structural information were integrated [8,9,10]. The pair distribution functions, coordination number distributions, and spatial density functions (3D structure) were calculated from the finally obtained structure. All calculations were performed using the EPSR25 program [45].

3. Results and Discussion

3.1. Raman Spectra

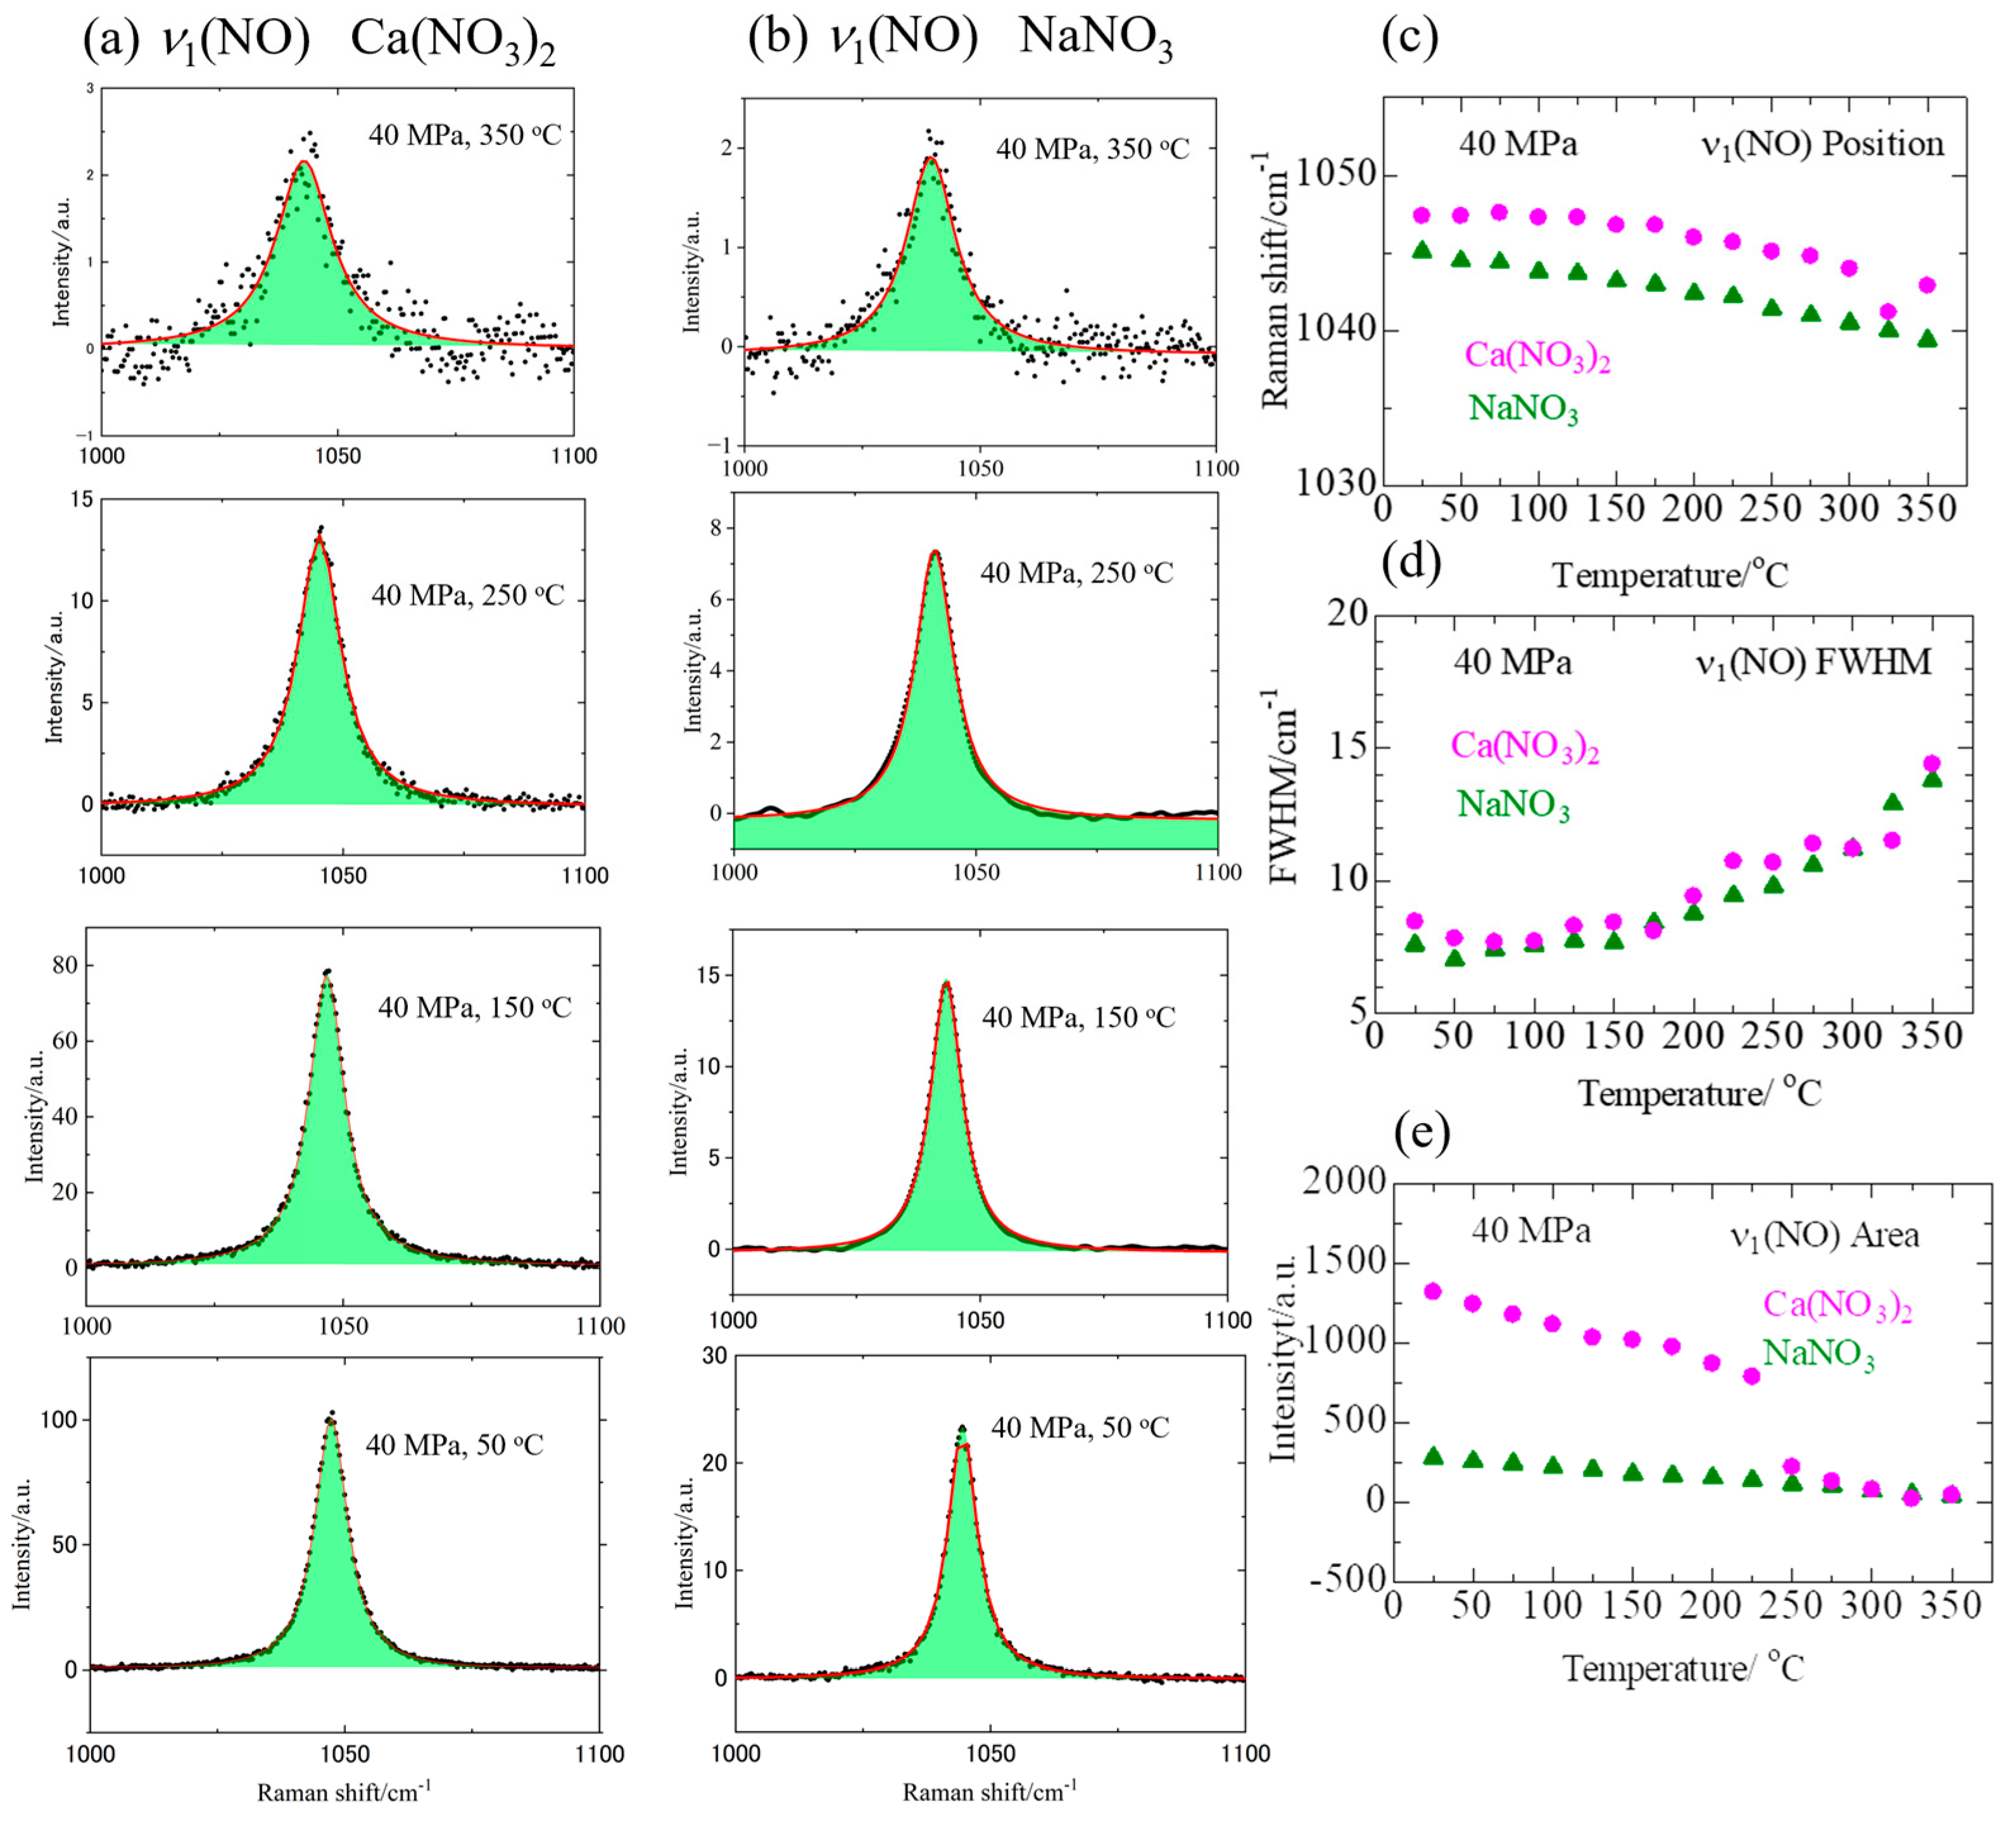
Figure 3a,b shows the examples of the fitting results of aqueous Ca(NO3)2 and NaNO3 solutions, respectively, under selected thermodynamic conditions. Figure 3c–e shows the temperature dependence of the peak position, FWHM, and the area of the NO stretching ν1 band of NO3, respectively. A quantitative analysis of the ν1(NO) band was performed using Equation (1) by a nonlinear least-squares fitting procedure in which the peak position, FWHM, and the area of the ν1(NO) band were allowed to vary. For clarity, in the Supplementary Materials, Figure S1a,b reports all Raman spectra measured in a temperature range from 25 to 350 °C at 40 MPa. The optimized numerical values of the peak position, FWHM, and area at all temperatures are summarized in Table S1.
As the temperature increases, the peak position shifts to a lower wavenumber, suggesting a change in the local structure around NO3. Specifically, as shown in Figure 3c, the peak position for an aqueous NaNO3 solution shifts monotonically to a lower wavenumber as the temperature rises. In contrast, for an aqueous Ca(NO3)2 solution, the position remains relatively stable at around 150 °C, and then it decreases with increasing temperature up to 350 °C. The peak height decreases due to a reduction in density with increasing temperature. The peak shape could be well reproduced by a single Lorentzian band at all temperatures.
The decrease in the wavenumber of the ν1 (NO) band suggests that NO3 solvation becomes more robust. At room temperature, NO3 acts as a structure-breaking ion. However, as shown in a later section, at elevated temperatures, the tetrahedral network structure of the solvent water is partially distorted or broken down, resulting in more free water molecules surrounding NO3. It is noted that the peak position for an aqueous Ca(NO3)2 solution is higher than an aqueous NaNO3 solution. This observation suggests that NO3 is associated with Ca2+, i.e., ion pairing. These results are consistent with those in the literature [14].
The FWFM values for both nitrate solutions do not show a significant change below 150 °C but increase with an increase in temperature. Furthermore, above 250 °C, the FWHM for an aqueous Ca(NO3)2 solution shows a different behavior from the corresponding aqueous NaNO3 solution, suggesting some change in Ca2+ solvation. Similar behavior is also observed in the temperature dependence of the area of an aqueous Ca(NO3)2 solution, which does not appear for an aqueous NaNO3 solution. The anomalous change in FWFM and area suggests a possible change in the contact ion pairs between Ca2+ and NO3. This issue will be discussed in more detail later in the X-ray scattering section.
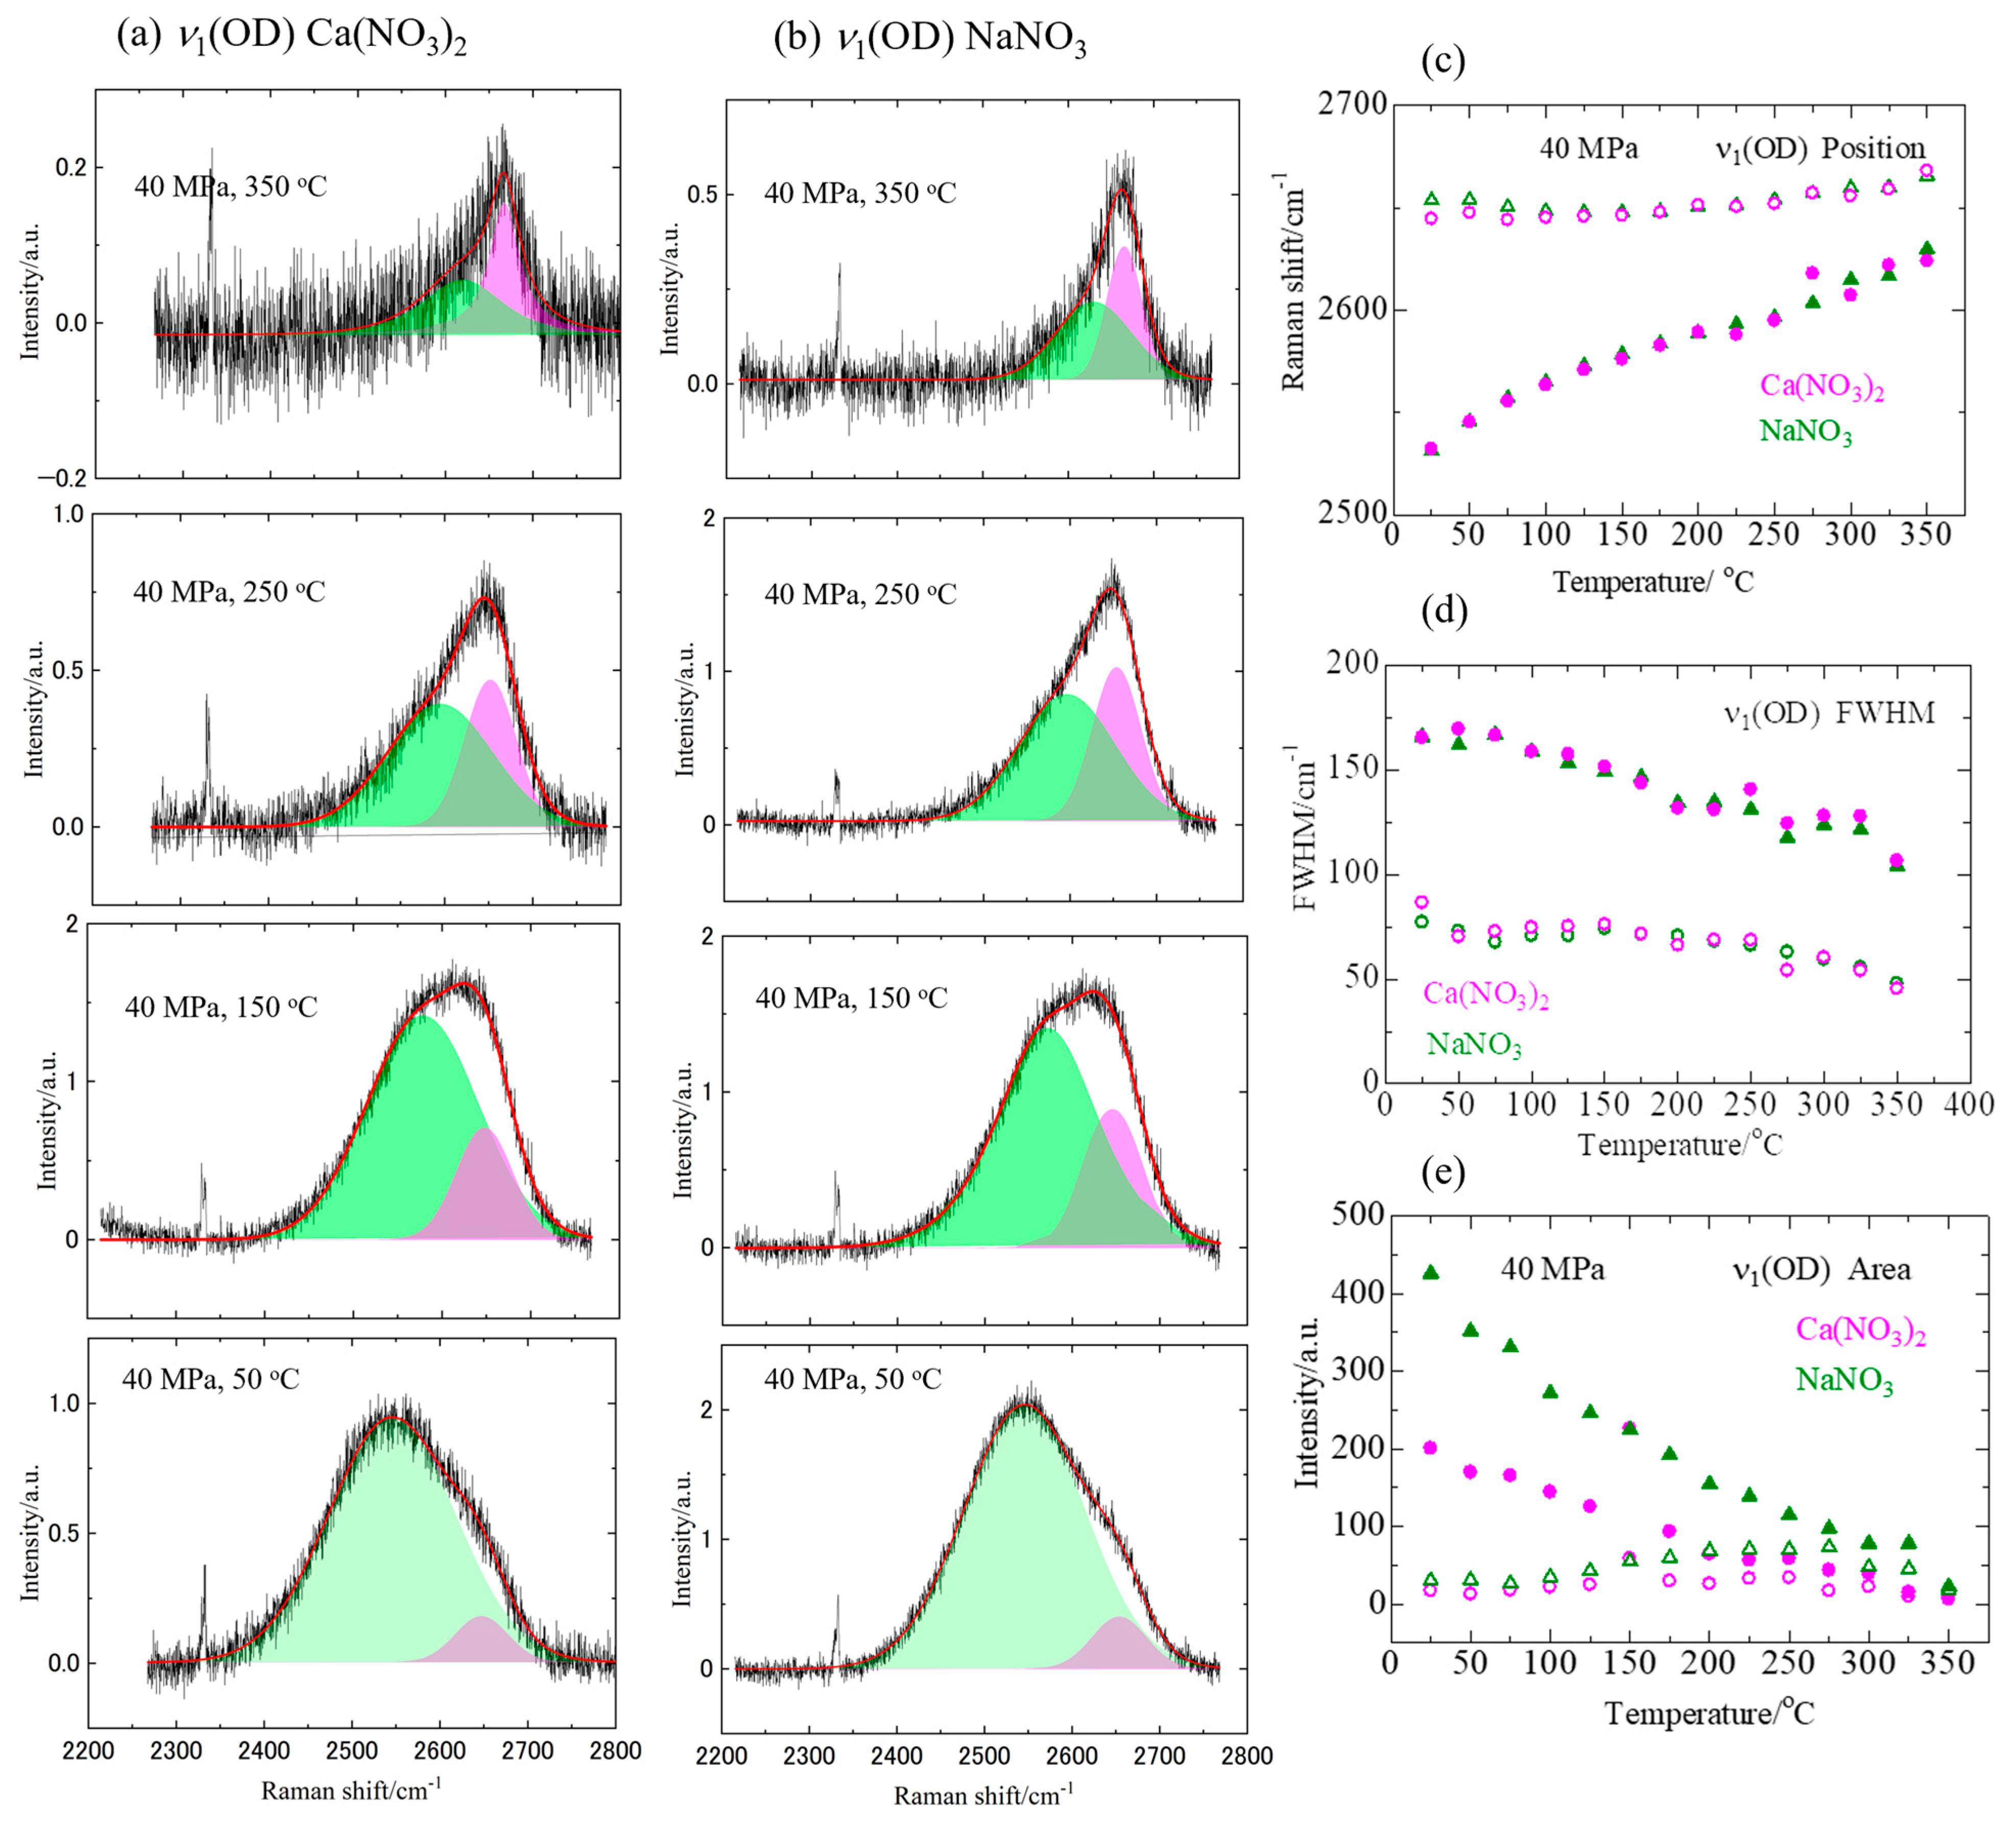
Figure 4a,b shows the selected Raman spectra of the ν1 band of the O–D symmetric stretching vibration of HDO water molecules in 1 mol dm−3 Ca(NO3)2 and NaNO3 aqueous solutions containing 4% (w/w) D2O, respectively. The results of the deconvolution analysis of the spectra are plotted as a function of temperature in Figure 4c–e, respectively. Figure S2a,b shows Raman spectra acquired in the temperature range from 25 °C to 350 °C at 40 MPa, and the numerical values are summarized in Table S2.
As seen in Figure 4a–c, the OD spectra for both solutions can be resolved into two Gaussian components: one is a largely temperature-dependent component of the wavenumber varying from 2532 cm−1 at 25 °C to 2629 cm−1 at 350 °C and another almost temperature-independent one at a wavenumber of 2645–2668 cm−1. The results presented here for temperatures below 100 °C are consistent with those obtained from Raman spectral studies of HDO in H2O in the temperature range of 16–97 °C [46]. As stated in ref. [46], the temperature-less dependent component can be assigned to non-hydrogen bonds of HDO molecules, while the temperature-dependent component corresponds to hydrogen-bonded HDO molecules. The gradual shift in the peak position to a higher wavenumber with increasing temperature suggests a weakening of the hydrogen bonds at elevated temperatures. In Figure 4d,e, the FWHM and area of the component at 2532–269 cm−1 associated with hydrogen bonds decrease monotonically with temperature. However, they exhibit less temperature dependence above 200 °C, indicating a change in the solvent water structure.

3.2. X-Ray Scattering and EPSR Modeling

3.2.1. Total Interference Functions and Radial Distribution Functions

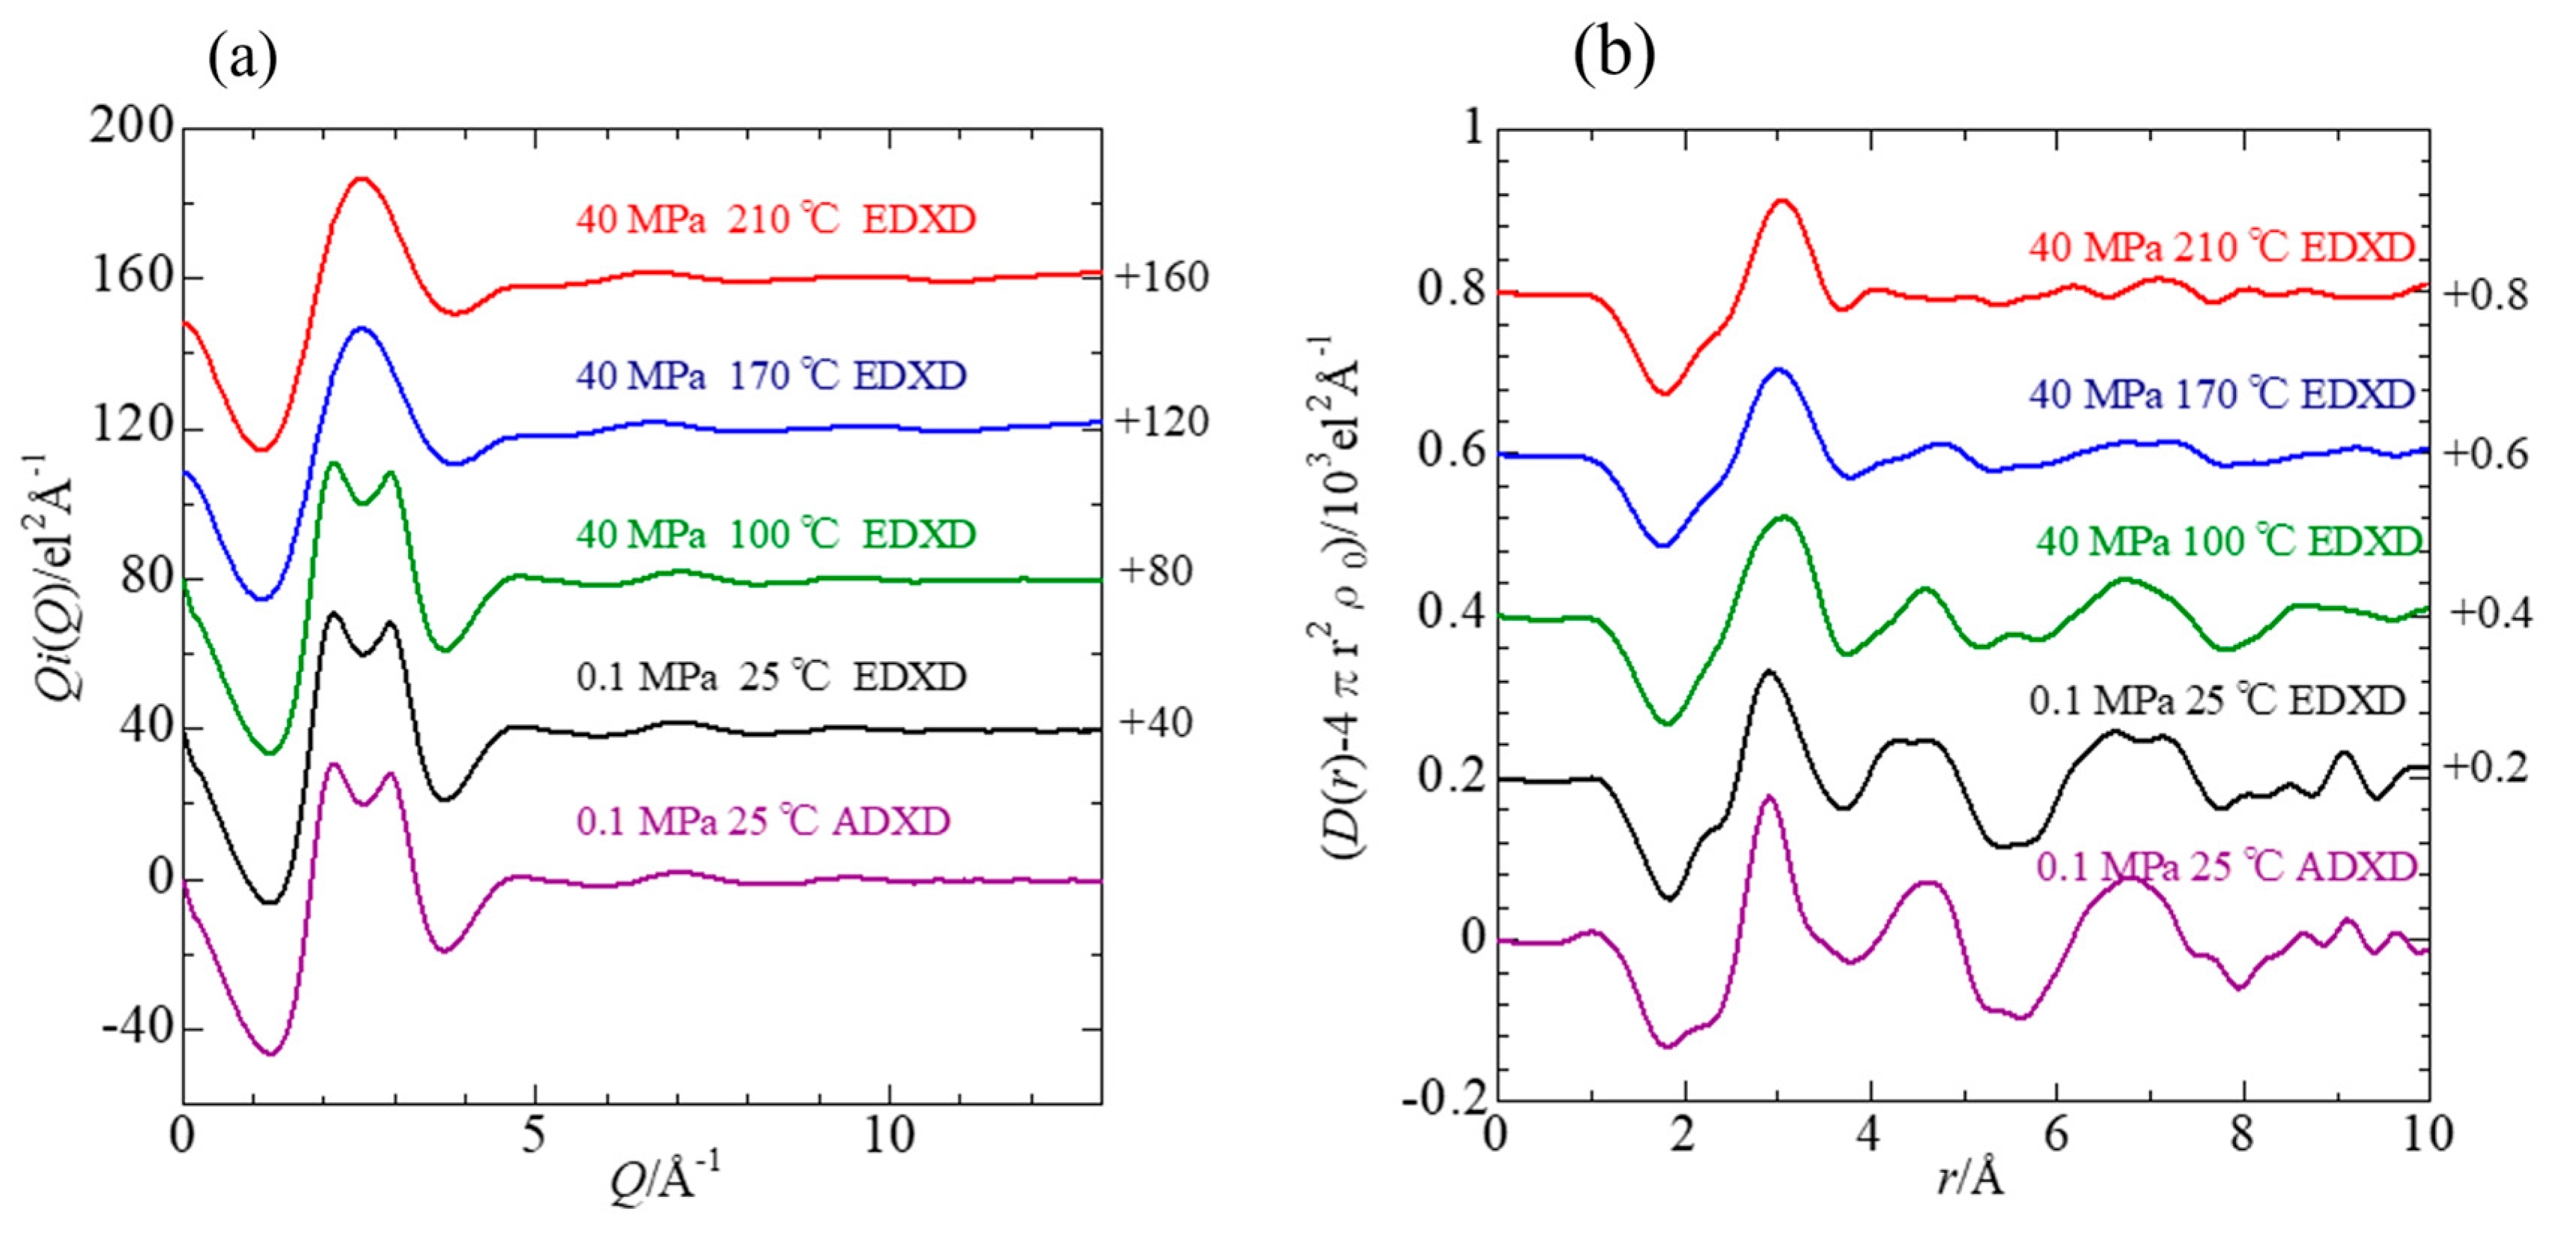
Figure 5a,b shows the Q-weighed interference functions and the corresponding radial distribution functions (RDFs) in the form of D(r)-4πr2ρ0 of a 1 M Ca(NO3)2 aqueous solution measured by energy-dispersive X-ray diffraction (EDXD) over a temperature range from 25 to 210 °C. The same solution was also measured at 0.1 MPa and 25 °C by angle-dispersive X-ray diffraction to confirm the reliability of data correction procedures in EDXD.
X-ray diffraction (ADXD) at 25 °C and 0.1 MPa and the results were compared with those obtained by EDXD. The EDXD data agree with the ADXD ones, showing that the data correction with EDXD was properly performed. Figure S2a,b shows the structure factors F(Q) and the corresponding G(r) obtained by experiments and EPSR modeling, respectively. A good agreement between the experiment and EPSR modeling was attained under all thermodynamic conditions, i.e., at 25 °C and 0.1 MPa. As seen in Figure 5a and Figure S3a, the interference functions Qi(Q) and the structure factor F(Q) at Q = 2–3 Å−1 show two peaks, characteristic of the tetrahedral network structure of solvent water [42]. However, at 170 and 210 °C, the two separated peaks become one peak, suggesting that the tetrahedral structure of water is distorted or broken down. This finding is consistent with the results of the Raman spectra of the v1(OD) band (Figure 5).
As seen in Figure 5b and Figure S3b, RDFs at 25 °C and 0.1 MPa show peaks at 2.8, 4.6, and 6.8 Å due to the first-neighbor, second-neighbor, and third-neighbor H2O–H2O interactions of the tetrahedral network structure of solvent water. The features remain at 100 °C and 40 MPa, although the amplitudes become smaller. However, at 170 and 210 °C and 40 MPa, the first-neighbor peak at 2.8 Å becomes broader, and the second and third-neighbor peaks are weakened and disappear at 210 °C and 40 MPa, demonstrating that the tetrahedral network structure of water is broken down. The peak ascribed to the Ca2+–H2O bonds due to the Ca2+ hydration is seen as a shoulder at around 2.4 Å.

3.2.2. Solvent Water

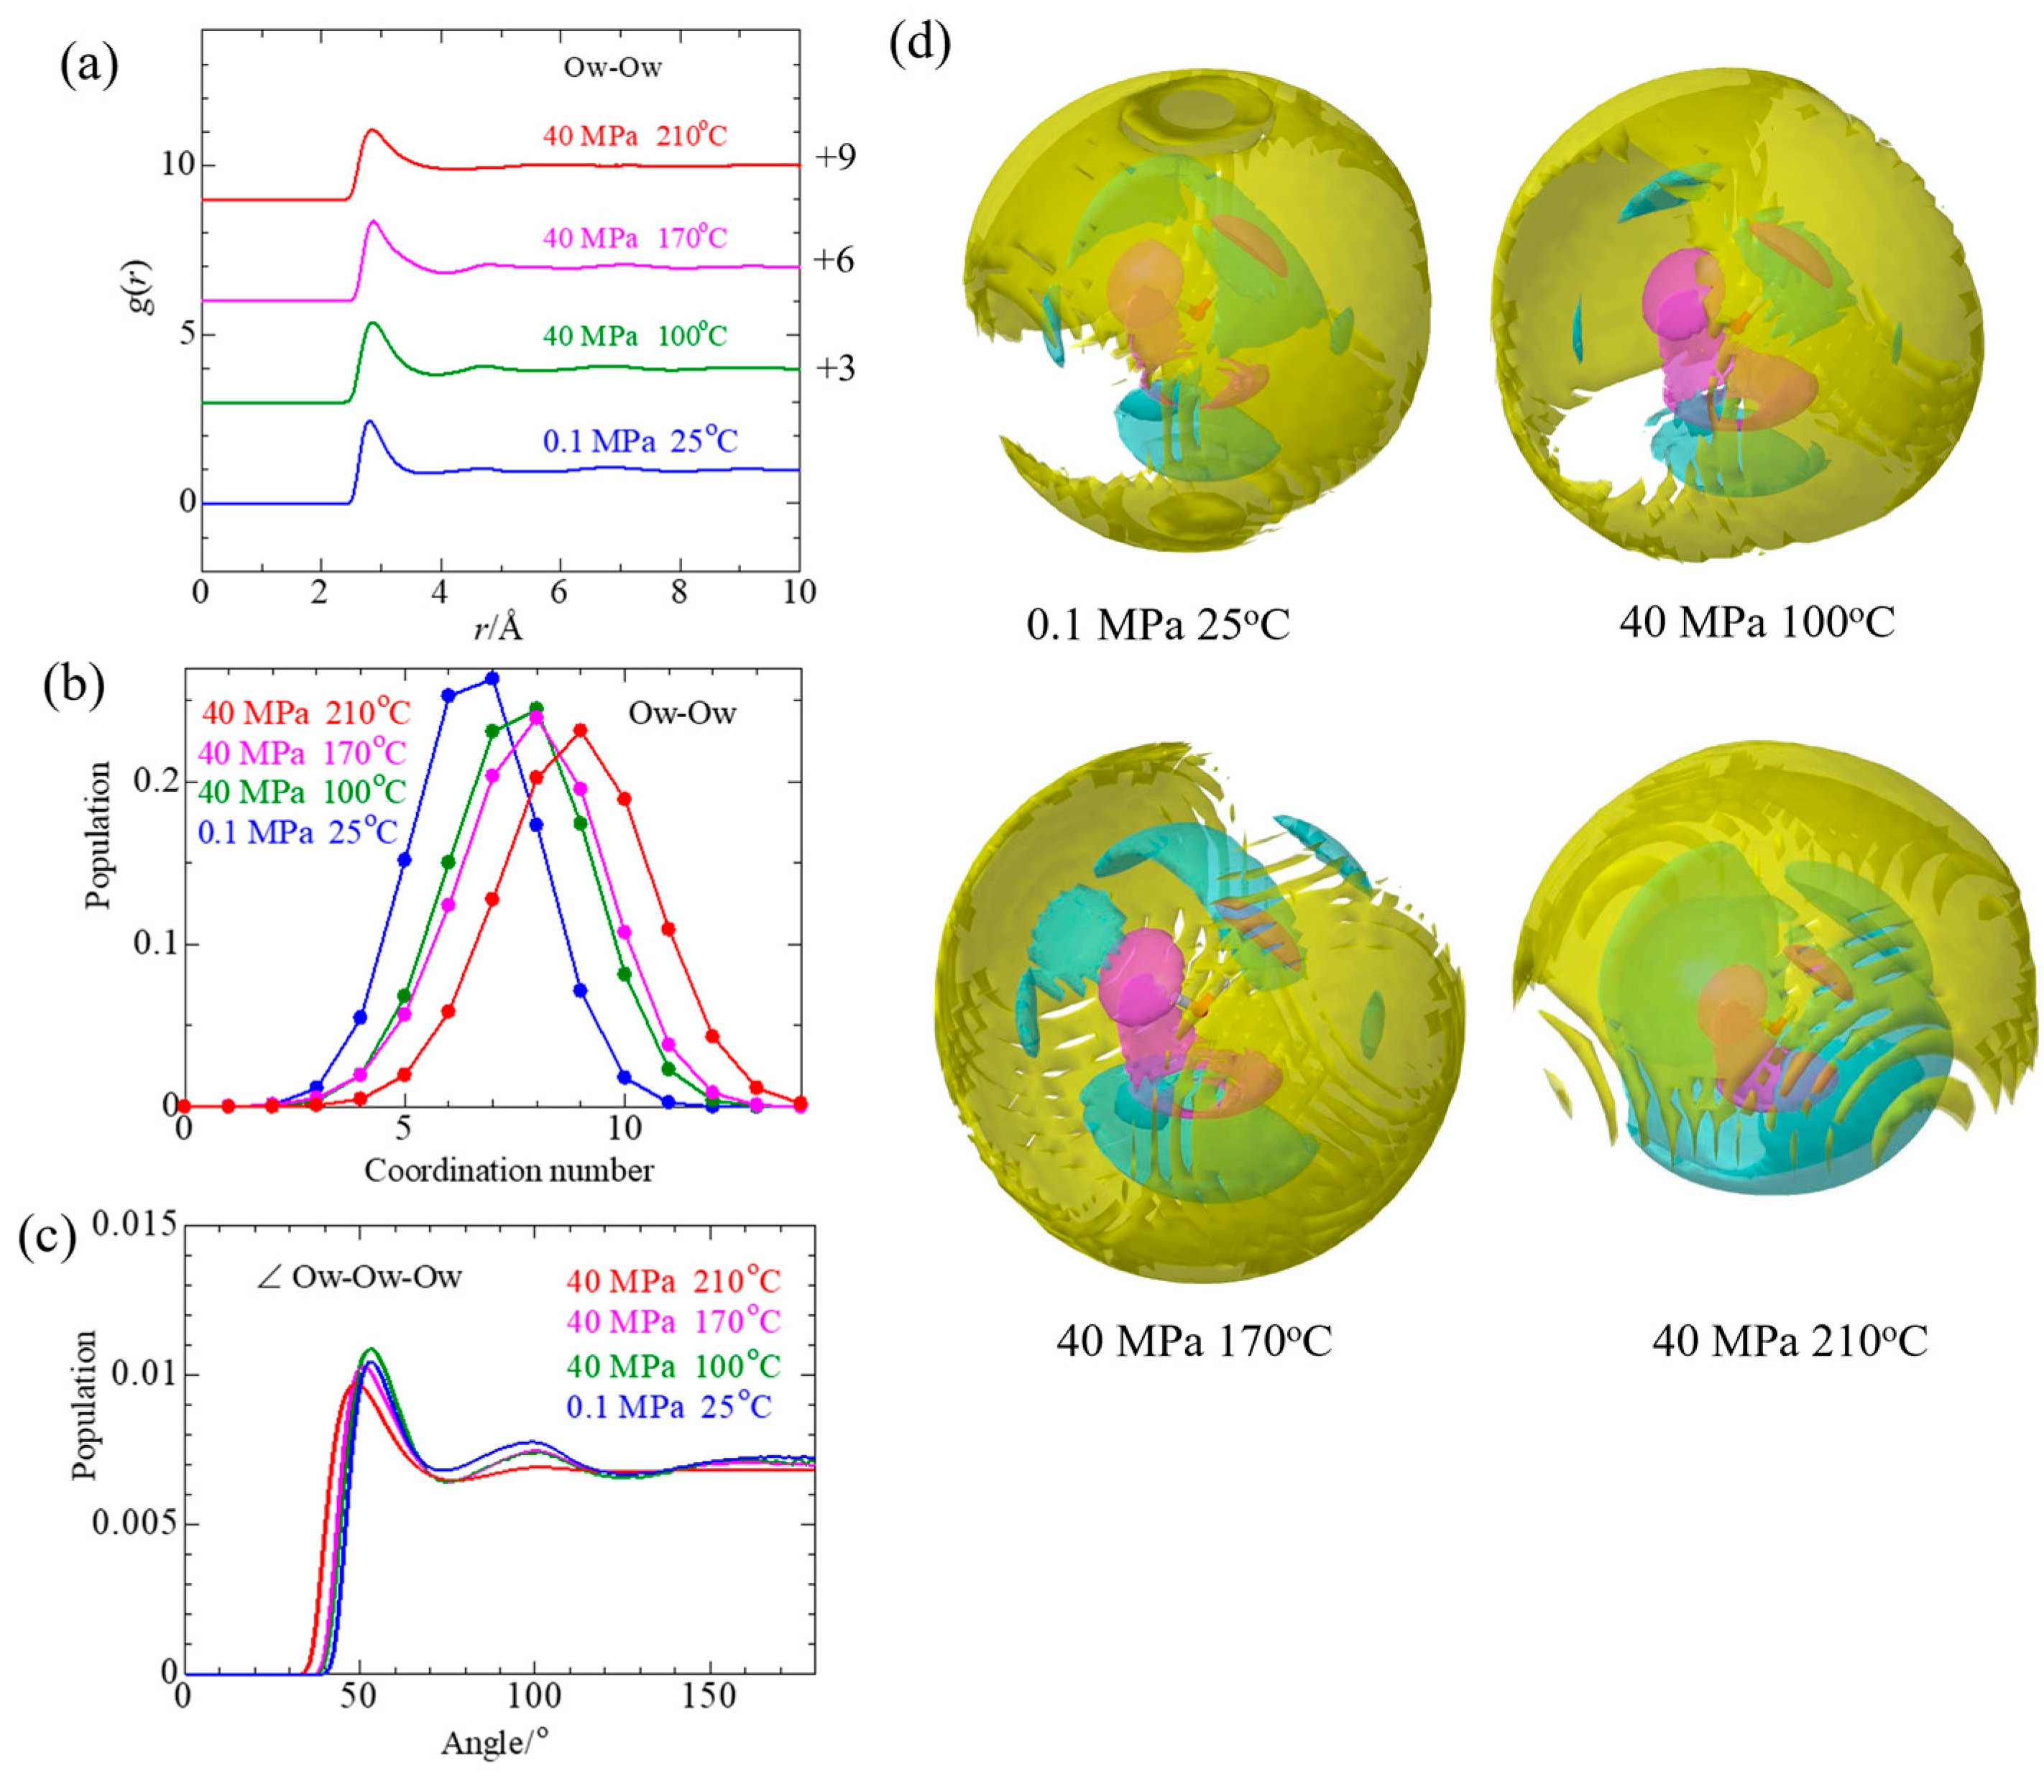
Figure 6a shows the Ow–Ow (Ow is the oxygen atom of the water molecule) pair distribution functions g(r) between solvent water molecules at each temperature obtained from EPSR modeling. At 25 °C and 0.1 MPa, peaks are observed at 2.8 Å, 4.6 Å, and 6.9 Å, indicating that the solvent water has a tetrahedral network structure in a 1 mol dm−3 Ca(NO3)2 aqueous solution. As the temperature increases, the peak in the first neighborhood decreases and broadens to the longer distance side, suggesting an increase in non-hydrogen bonding at 3.3 Å. There is no noticeable change in the peak position of the second and third neighboring peaks up to 170 °C, but at 210 °C, the second peak shifts to the longer distance side at around 6 Å, and the third peak is not discernible. This feature has been reported for subcritical and supercritical water in which water’s tetrahedral network structure is transformed into a dense packing structure [47].
Figure 6b shows the coordination number distribution of adjacent water molecules around a central water molecule. In the present study, the coordination number nij of the atom pair i-j was calculated using Equation (8), defined as the number of atoms j around atoms i between the minimum distance (rmin) and the maximum distance (rmax).
n i j = 4 π ρ j r m i n r m a x g i j ( r ) r 2 d r .
Here, ρj is the number density of atom j. The highest population of the Ow–Ow coordination shift from 6.5 at 25 °C to 9 at 210 °C. Table 3 summarizes the interatomic distance and the mean coordination number of the Ow–Ow pairs. The mean number of water molecules in the first coordination shell of solvent water molecules falls within a range of 6.6~7.8 at temperatures from 25 to 170 °C and increases to 8.8 at 210 °C. Figure 6c shows the angle distributions of ∠Ow–Ow–Ow of solvent water molecules under various thermodynamic conditions. The predominant peak at 40–60° is ascribed to the non-hydrogen bonds of interstitial water molecules, whereas that at 70–120° arises from the tetrahedral network structure of water. The peak due to the hydrogen bonds at 70–120° is most remarkable at 25°, gradually decreases with increasing temperature, and almost disappears at 210 °C. On the other hand, the peak of the non-hydrogen bonds increases at elevated temperatures and shifts to a smaller angle side. Thus, these results confirm the structure change from the tetrahedral network structure to a dense packing arrangement at 210 °C. The present results are comparable with those of subcritical water at 143 °C and 53 MPa [47]. However, the coordination number of Ow–Ow is far from the value (10.3) for a 2 mol dm−3 CaCl2 aqueous solution in the gigapascal pressure range [26].
Figure 6d shows the spatial density functions of the neighboring water molecules in the first, second, and third shells around a central water molecule. The first shell structure appears similar at all temperatures. The second shell keeps the tetrahedral network arrangement until 170 °C and becomes very disordered at 210 °C. The third-neighbor shell remains at 170 °C but disappears in the hemisphere on the lone-pair electron side of a central water oxygen atom at 210 °C. All results are consistent with the inflection point of the Raman ν1(O-D) band at 170 °C.

3.2.3. Ca2+ Solvation

Figure 7a shows the pair distribution function g(r) of Ca2+-Ow under each thermodynamic condition. The Ca2+–Ow (r1) distance in the first solvation shell is 2.48 Å, and this peak position is almost independent of temperature within experimental errors. The present Ca–Ow distance agrees well with the literature value (2.48 Å) under ambient conditions [7,26]. The peak position of the second hydration shell shifts slightly from 4.72 Å at 25 °C to 4.83–4.89 Å at high temperatures. This result indicates that the water molecules in the second hydration shell are thermally fluctuated as the temperature increases. Figure 7b shows the coordination number distribution of water molecules around Ca2+. The highest population is found at CN = 7. As discussed in the next section, one NO3 enters the first coordination shell of Ca2+. Thus, the total coordination number becomes eight, consistent with the literature value (8) [7,26]. The Ca2+ solvation differs from the Mg2+ solvation of six water molecules in an octahedral geometry. This difference in the coordination number between Mg2+ and Ca2+ is responsible for their biological functions [11,12]. When the temperature increases from 25 to 210 °C, the peak of the coordination number distribution shifts from ~7 at 25 °C to ~6 at 210 °C. From Table 3, the average solvation number for Ca–Ow is 6.9 at 25 °C and 0.1 MPa and decreases to 6.1 at 210 °C. The decreased coordination number at 210 °C shows that the ion pair formation is favorable at elevated temperatures. This finding agrees with the results of Raman spectral measurements where an inflection point appeared at 150–200 °C in the N–O stretching vibration band ν1 of NO3 [13]. Figure 7c shows the angle distribution functions of ∠Ow–Ca–Ow. Two peaks at 70° and 140° become lower in height and broaden with increasing temperature. The position of both peaks does not shift significantly with temperature, showing the rigid first solvation shell of Ca2+.

3.2.4. Ca2+–NO3 Ion Pair

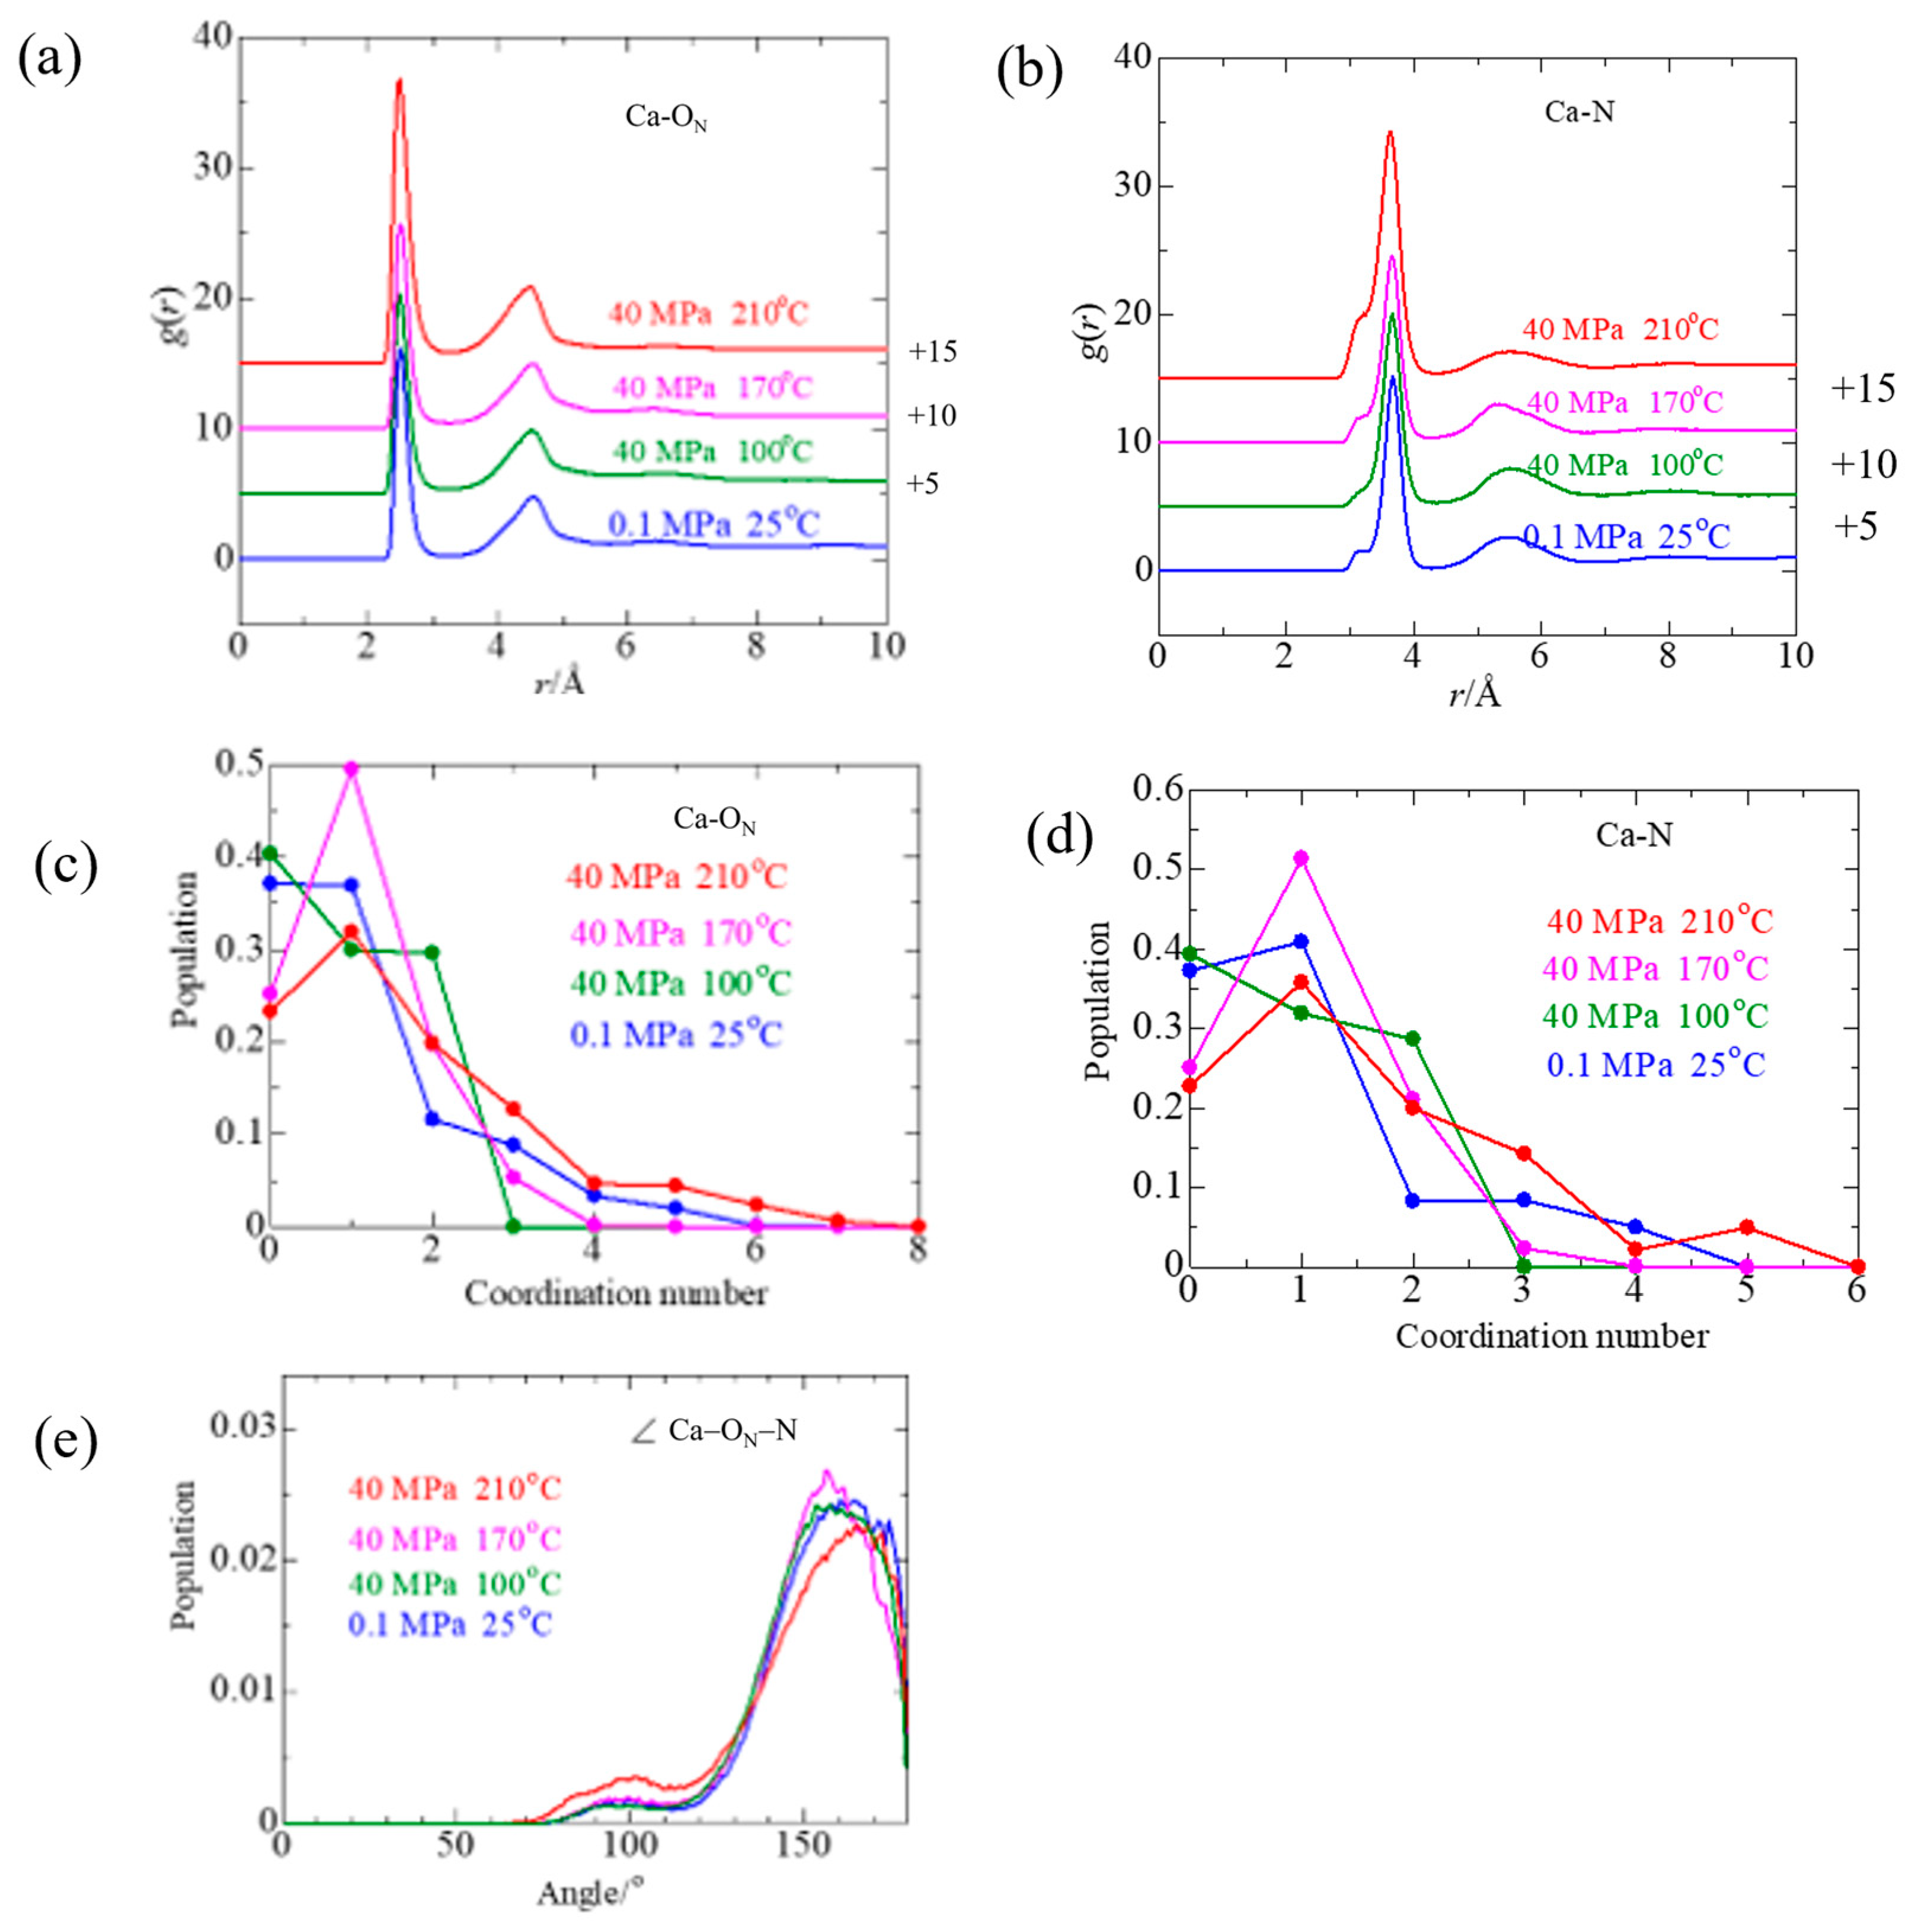
Figure 8a,b shows the pair distribution functions of CaON (ON is the oxygen atom of NO3) and Ca–N atom pairs obtained from EPSR calculations. Since the first peak of Ca–ON is observed at 2.47–2.51 Å, NO3 partially enters the first solvation shell of Ca2+ to form contact ion pairs. The corresponding Ca–N distance is 3.63–3.65 Å. It should be noted that a shoulder appears at ~3.16 Å and grows at 170 and 210 °C. Figure 8c,d shows the corresponding coordination number distributions under each thermodynamic condition calculated from the pair distribution functions in Figure 8a and Figure 8b, respectively, using Equation (8). In both cases, the coordination number distribution shifts to the higher coordination number side at elevated temperatures. Table 3 summarizes the average coordination number under each thermodynamic condition. At all temperatures measured, the contact ion pairs are formed and favored at 210 °C. The present results confirm the expectation of the ion association from Raman spectra [13]. The mean coordination number of Ca–ON and Ca–N is almost consistent with one, showing that NO3 is bound to Ca2+ in a monodentate fashion. Figure 8 eshows the angle distribution functions of ∠Ca–ON–N. A predominant peak is observed within 140~170°, with a small broad peak centered at 100°, growing at 210 °C. The predominant peak corresponds to the value (3.67 Å) calculated geometrically for the monodentate coordination of NO3 to Ca2+. NO3 can coordinate Ca2+ via a bidentate manner. Using ∠Ca–ON–N = 100° with the Ca–ON and N–O distances, the Ca–N distance is estimated to be 2.96 Å, close to 3.16 Å for a shoulder of gCa–N(r) in Table 3. Thus, at 170 and 210 °C, a small percent of NO3 might be bound to Ca2+ in a bidentate manner. In Section 3.2.2, the structure of water at 210 °C forms a dense packing arrangement in which the tetrahedral network structure is broken down, resulting in the low dielectric constant of water [5]. This would be one of the reasons why ion pairs are favored at 210 °C.

3.2.5. NO3 Solvation

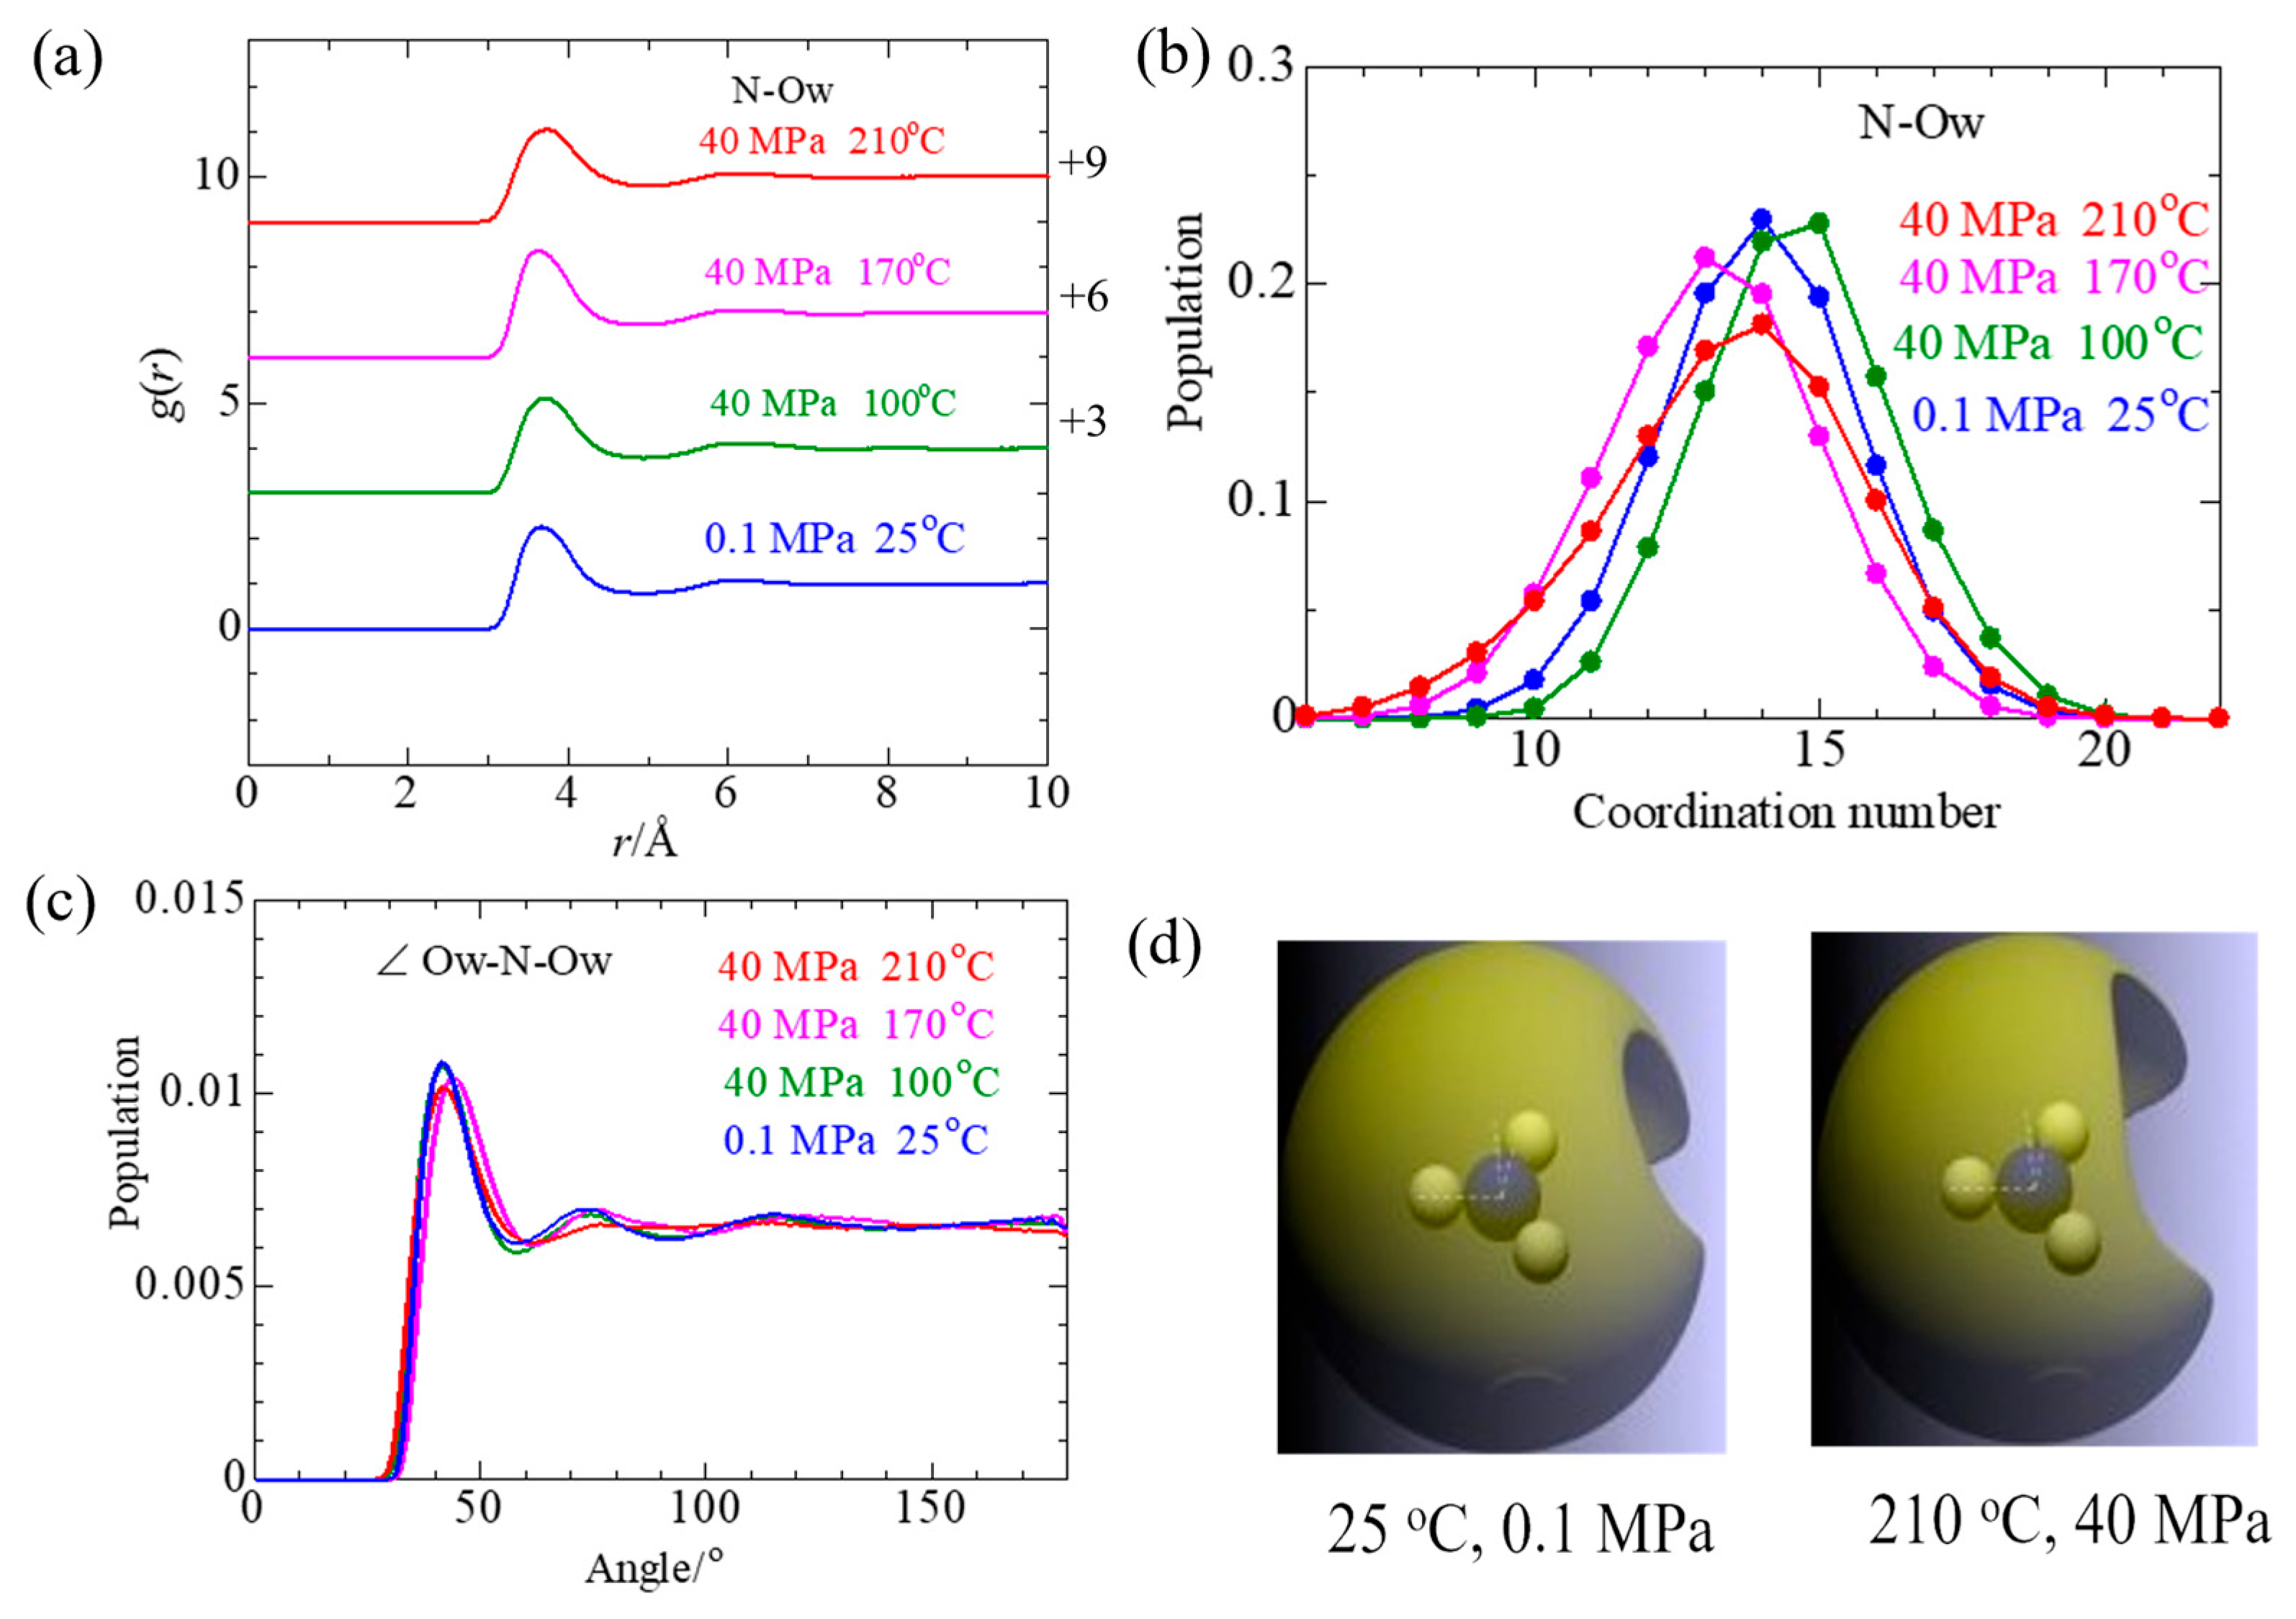
Figure 9a shows the N–Ow pair distribution functions g(r) under each thermodynamic condition obtained from the EPSR calculation. Almost no significant temperature change appears in the first and second solvation shells observed at ~3.6 and ~6.2 Å, respectively. Figure 9b shows water molecules’ corresponding coordination number distributions around a central NO3. The center of the distribution shifts from ~14 at 25 °C to ~13 at 170 and 210 °C with peak broadening. Table 3 summarizes the N–Ow distance in the first and second solvation shells and the mean coordination number of the nearest water molecules around NO3. The value is 14.2 between 25 and 100 °C, and there is a slight tendency to decrease to 13.3 at 150 and 210 °C. Figure 9c shows the angle distribution of ∠Ow–N–Ow, which has a broad peak centered at 45° without further peaks. Thus, the water molecules surround a central NO3 uniformly. The corresponding 3D structure is shown in Figure 9d. We can see a vacancy available for entering NO3, which becomes larger due to increasing ion-pair formation at 210 °C.

4. Conclusions

We have developed high-temperature and high-pressure Raman and X-ray scattering cells to determine the local structures of aqueous electrolyte solutions under extreme conditions. Using the high-pressure cell, Raman spectra of a 1 mol dm−3 Ca(NO3)2 aqueous solutions were measured at 25 to 350 °C and 40 MPa. Temperature dependence in the N–O stretching ν1 band of NO3 and the O–D stretching ν1 band of the solvent water suggested that the solvation of NO3 and solvent water structure changes at ~170 °C. Energy-dispersive type X-ray scattering measurements on the same solution combined with EPSR modeling revealed that this structural change is due to NO3 entering the first solvation shell of Ca2+ to form a Ca2+–NO3 contact ion pair. The temperature and pressure effects on the local structure of Ca2+, NO3, and solvent water were determined at the molecular level. The present results will serve to understand the unique properties and the underlying mechanism of processes of subcritical and supercritical aqueous electrolyte solutions and to develop supercritical water technology further.

Supplementary Materials

The following supporting information can be downloaded at https://www.mdpi.com/article/10.3390/liquids5010001/s1. Figure S1. The Raman spectra of the v1 (NO) band of NO3 in 1 mol dm−3 Ca(NO3)2 and NaNO3 aqueous solutions; Table S1. The results of peak position, FWHM, and area of deconvolution analysis of the v1(N-O) band of NO3; Figure S2. The Raman spectra of the v1 (OD) band of HDO water for 1 mol dm−3 Ca(NO3)2 and NaNO3 aqueous solutions; Table S2. The results of peak position, FWHM, and area of deconvolution analysis of the v1(OD) band of HDO water; Figure S3. Structure factors F(Q) and the corresponding radial distribution functions G(r) of a 1 mol dm−3 Ca(NO3)2 aqueous solution.

Author Contributions

Conceptualization, writing—original draft preparation-review, and editing: T.Y.; X-ray experiments and EPSR calculations: T.Y., K.L., Y.M. and N.F.; review and editing: K.Y. All authors have read and agreed to the published version of the manuscript.

Funding

This work was partly supported by Grants-in-Aid for Scientific Research (Exploratory Research 19655007, Fundamental Research C 23550023), Fukuoka University Graduate School Development Priority Funds, and research by area by the Research Promotion Department.

Data Availability Statement

Data are available on request.

Acknowledgments

The authors thank the late Eugine Gorbaty for constructing a high-pressure X-ray scattering cell.

Conflicts of Interest

The authors declare no conflicts of interest.

References

  1. Sako, T.; Sugeta, T.; Otake, K.; Sato, M.; Tsugumi, M.; Hiaki, T.; Hongo, M. Decomposition of Dioxins in Fly Ash with Supercritical Water Oxidation. J. Chem. Eng. Jpn. 1997, 30, 744–747. [Google Scholar] [CrossRef]
  2. Brunner, G. Applications of Supercritical Fluids. Annu. Rev. Chem. Biomol. Eng. 2010, 1, 321–342. [Google Scholar] [CrossRef]
  3. Supercritical Fluids: Fundamentals and Applications; Kiran, E., Debenedetti, P.G., Peters, C.J., Eds.; Springer: Dordrecht, The Netherlands, 2000. [Google Scholar]
  4. Ohara, S.; Mousavand, T.; Sasaki, T.; Umetsu, M.; Naka, T.; Adschiri, T. Continuous production of fine zinc oxide nanorods by hydrothermal synthesis in supercritical water. J. Mater. Sci. 2008, 43, 2393–2396. [Google Scholar] [CrossRef]
  5. Uematsu, M.; Franck, E.U. Static dielectric constant of water and steam. J. Phys. Chem. Ref. Data 1980, 9, 1291–1306. [Google Scholar] [CrossRef]
  6. Yamaguchi, T. Historical development of a study of the structure and dynamics of liquids and solutions. J. Mol. Liq. 2024, 395, 123919. [Google Scholar] [CrossRef]
  7. Yamaguchi, T.; Persson, I. (Eds.) Coordination Chemistry: Metal Ions and Complexes in Solution; Royal Society of Chemistry: London, UK, 2023. [Google Scholar]
  8. Soper, A.K. Computer simulation as a tool for the interpretation of total scattering data from glasses and liquids. Mol. Simul. 2012, 38, 1171–1185. [Google Scholar] [CrossRef]
  9. Soper, A.K. Empirical potential Monte Carlo simulation of fluid structure. Chem. Phys. 1996, 202, 295–306. [Google Scholar] [CrossRef]
  10. Soper, A.K. Partial structure factors from disordered materials diffraction data: An approach using empirical potential structure refinement. Phys. Rev. B. 2005, 72, 104204. [Google Scholar] [CrossRef]
  11. Hess, P.; Tsien, R.W. Mechanism of ion permeation through calcium channels. Nature 1984, 309, 453–456. [Google Scholar] [CrossRef]
  12. Dudev, T.; Lim, C. Importance of Metal Hydration on the Selectivity of Mg2+ and Ca2+ in Magnesium Ion Channels. J. Am. Chem. Soc. 2013, 135, 17200–17208. [Google Scholar] [CrossRef]
  13. Irish, D.E.; Walrafen, G.E. Raman and Infrared Spectral Studies of Aqueous Calcium Nitrate Solutions. J. Chem. Phys. 1967, 46, 378–384. [Google Scholar] [CrossRef]
  14. Spohn, P.D.; Brill, T.B. Raman Spectroscopy of the Species in Concentrated Aqueous Solutions of Zn(NO3)2, Ca(NO3)2, Cd(NO3)2, LiNO3, and NaNO3 up to 450 °C and 30 MPa. J. Phys. Chem. 1989, 93, 6224–6231. [Google Scholar] [CrossRef]
  15. Wang, Y.; Zhu, F.; Yamaguchi, T.; Yoshida, K.; Wang, G.; Liu, R.; Song, L.; Zhou, Y.; Liu, H. Structure of phase change energy storage material Ca(NO3)2.4H2O. J. Mol. Liq. 2022, 356, 119010. [Google Scholar] [CrossRef]
  16. Licheri, G.; Piccaluga, G.; Pinna, G. X-ray diffraction study of the average solute species in CaCl2 aqueous solutions. J. Chem. Phys. 1976, 64, 2437–2441. [Google Scholar] [CrossRef]
  17. Probst, M.M.; Radnai, T.; Heinzinger, K.; Bopp, P.; Rode, B.M. Molecular dynamics and X-ray investigation of an aqueous calcium chloride solution. J. Phys. Chem. 1985, 89, 753–759. [Google Scholar] [CrossRef]
  18. Yamaguchi, T.; Hayashi, S.; Ohtaki, H. X-Ray diffraction study of calcium(II) chloride hydrate melts: CaCl2·RH2O (R = 4.0, 5.6, 6.0, and 8.6). Inorg. Chem. 1989, 28, 2434–2439. [Google Scholar] [CrossRef]
  19. Megyes, T.; Grósz, T.; Radnai, T.; Bakó, I.; Pálinkás, G. Solvation of Calcium Ion in Polar Solvents: An X-ray Diffraction and ab initio Study. J. Phys. Chem. A 2004, 108, 7261–7271. [Google Scholar] [CrossRef]
  20. Takamuku, T.; Umecky, T.; Yagafarov, O.F.; Katayama, Y.T. Structures of aqueous calcium chloride solutions by energy-dispersive-ray diffraction under high temperatures and high pressures. Bunseki Kagaku 2015, 64, 203–210. (In Japanese) [Google Scholar] [CrossRef]
  21. Wang, G.; Zhou, Y.; Yamaguchi, T.; Liu, H.; Zhu, F.; Wu, Z. Structure of Aqueous CaCl2 solutions by X-ray Scattering and Density Functional Theory. Russ. J. Phys. Chem. A 2022, 96, S68–S76. [Google Scholar] [CrossRef]
  22. Cummings, S.; Enderby, J.E.; Howe, R.A. Ion hydration in aqueous CaCl2 solutions. J. Phys. C Solid State Phys. 1980, 13, 1. [Google Scholar] [CrossRef]
  23. Hewish, N.A.; Neilson, G.W.; Enderby, J.E. Environment of Ca2+ ions in aqueous solvent. Nature 1982, 297, 138. [Google Scholar] [CrossRef]
  24. Badyal, Y.S.; Barnes, A.C.; Cuello, J.J.; Simonson, J.M. Understanding the effects of Concentration on the Solvation Structure of Ca2+ in Aqueous Solution. II: Insights into Longer Range Order from Neutron Diffraction Isotope Substitution. J. Phys. Chem. A 2004, 108, 11819–11827. [Google Scholar] [CrossRef]
  25. Bruni, F.; Imberti, S.; Mancinelli, R.; Ricci, M.A. Aqueous solutions of divalent chlorides; ions hydration shell and water structure. J. Chem. Phys. 2012, 136, 064520. [Google Scholar] [CrossRef]
  26. Yamaguchi, T.; Nishio, M.; Yoshida, K.; Takumi, M.; Nagata, K.; Hattori, T. Ion Hydration and Association in an Aqeous Calcium Chloride Solution in the GPa Range. Eur. J. Inorg. Chem 2019, 1170–1177. [Google Scholar] [CrossRef]
  27. Spångberg, D.; Hermansson, K.; Lindqvist-Reis, P.; Jalilehvand, F.; Sandström, M.; Persson, I. Model Extended X-Ray Absorption Fine Structure (EXAFS) Spectra from Molecular Dynamics Data for Ca2+ and Al3+ Aqueous Solutions. J. Phys. Chem. B 2000, 104, 10467–10472. [Google Scholar] [CrossRef]
  28. Jalilehvand, F.; Spångberg, D.; Lindqvist-Reis, P.; Hermansson, K.; Persson, I.; Sandström, M. Hydration of the Calcium Ion. An EXAFS, Large-Angle X-Ray Scattering, and Molecular Dynamics Simulation Study. J. Am. Chem. Soc. 2001, 123, 431–441. [Google Scholar] [CrossRef] [PubMed]
  29. Fulton, J.L.; Heald, M.S.; Badyal, Y.S.; Simonson, J.M. Understanding the effects of concentration on the Solvation Structure of Ca2+ in Aqueous Solution. I: The Perspective on Local Structure from EXAFS and XANES. J. Phys. Chem. A 2003, 107, 4688–4696. [Google Scholar] [CrossRef]
  30. Yamaguchi, T.; Li, K.; Yamauchi, M.; Fukuyama, N.; Yoshida, K. Visualization of 3D structure of aqueous magnesium nitrate solution at 25~350 °C and 40 MPa as revealed by Raman scattering, X-ray diffraction and Empirical Potential, Structure Refinement Modeling. Bunseki Kagaku 2015, 64, 295–308. [Google Scholar] [CrossRef]
  31. Yamaguchi, T.; Fujimura, K.; Uchi, K.; Yoshida, K.; Katayama, Y. Structure of water from ambient to 4 GPa revealed by energy-dispersive X-ray diffraction combined with empirical potential structure refinement modeling. J. Mol. Liq. 2012, 176, 44–51. [Google Scholar] [CrossRef]
  32. Fujimoto, T.; Yoshida, K.; Yamaguchi, T. Energy dispersive X-ray diffractometer designed for measurements of solution under extreme condition and its performance. Fukuoka Univ. Sci. Rep. 2003, 33, 55–63. [Google Scholar]
  33. Nishikawa, K.; Iijima, T. Corrections for Intensity Data in Energy-dispersive X-Ray Diffractometry of Liquids. Application to Carbon Tetrachloride. Bull. Chem. Soc. Jpn. 1984, 57, 1750–1759. [Google Scholar] [CrossRef]
  34. Hosokawa, S.; Tamura, G. Structural Studies on the Meal-Nonmetal Transition in Expanded Mercury-X-ray Diffraction Measurements by the Energy-Dispersive Method. Mem. Fac. Integr. Art Sci. Hiroshima Univ. Ser. IV 1992, 17, 1–34. [Google Scholar]
  35. Ibers, J.A.; Hamilton, W.C. (Eds.) International Tables for X-Ray Crystallography; The Kynoch Press: Birmingham, UK, 1962; Volume IV. [Google Scholar]
  36. Mitsuhashi, T.; Nagao, J.; Iijima, T. In Proceedings of the Annual Meeting of the Crystallographic Society of Japan, Tokyo, Japan, 1982.
  37. Paalman, H.H.; Pings, C.J. Numerical evaluation of X-Ray Absorption Factors for Cylindrical Samples and Annular Sample Cells. J. Appl. Phys. 1962, 33, 2635–2639. [Google Scholar] [CrossRef]
  38. XCYLABS; Laboratory of Solution Chemistry, Department of Chemistry, Fukuoka University: Jonan, Fukuoka, Japan.
  39. International Tables for X-Ray Crystallography; MacGillavry, C.H., Rieck, G.D., Eds.; The Kynoch Press: Birmingham, UK, 1962; Volume III. [Google Scholar]
  40. Funakoshi, K. Energy-Dispersive X-Ray Diffraction for Binary Alkali Silicate Melts Using Synchrotron Radiation Under High Pressure and Temperature. Ph.D. Thesis, Tokyo Institute of Technology, Meguro, Japan, 1997. [Google Scholar]
  41. Johansson, G.; Sandström, M. Computer Programs for the Analysis of Data on X-Ray Diffraction by Liquids. Chem. Scr. 1973, 4, 195–198. [Google Scholar]
  42. Berendsen, H.J.C.; Grigera, J.R.; Straatsma, T.R. The missing term in effective pair potentials. J. Phys. Chem. 1987, 91, 6269–6271. [Google Scholar] [CrossRef]
  43. Mamatkulov, S.; Fyta, M.; Netz, R.R. Force fields for monovalent and divalent metal cations in TIP3P water based on thermodynamic and kinetic properties. J. Chem. Phys. 2013, 138, 024505. [Google Scholar] [CrossRef] [PubMed]
  44. Megyes, T.; Balint, S.; Peter, E.; Grosz, T.; Bako, I.; Krienke, H.; Bellissent-Funel, M.C. Solution Structure of NaNO3 in Water; Diffraction and Molecular Dynamics Simulation Study. J. Phys. Chem. B 2009, 113, 4054–4064. [Google Scholar] [CrossRef]
  45. Soper, A.K. EPSR25, Empirical Potential Structure Refinement–EPSR Shell: A User’s Guide ISIS; Rutherford Appleton Laboratory: Didcot, UK, 2009. [Google Scholar]
  46. Walrafen, G.E. Raman spectral studies of HDO in H2O. J. Chem. Phys. 1968, 48, 244–251. [Google Scholar] [CrossRef]
  47. Yamanaka, K.; Yamaguchi, T.; Wakita, H. Structure of water in the liquid and supercritical states by rapid X-ray diffractometry using an imaging plate detector. J. Chem. Phys. 1994, 101, 9830–9836. [Google Scholar] [CrossRef]
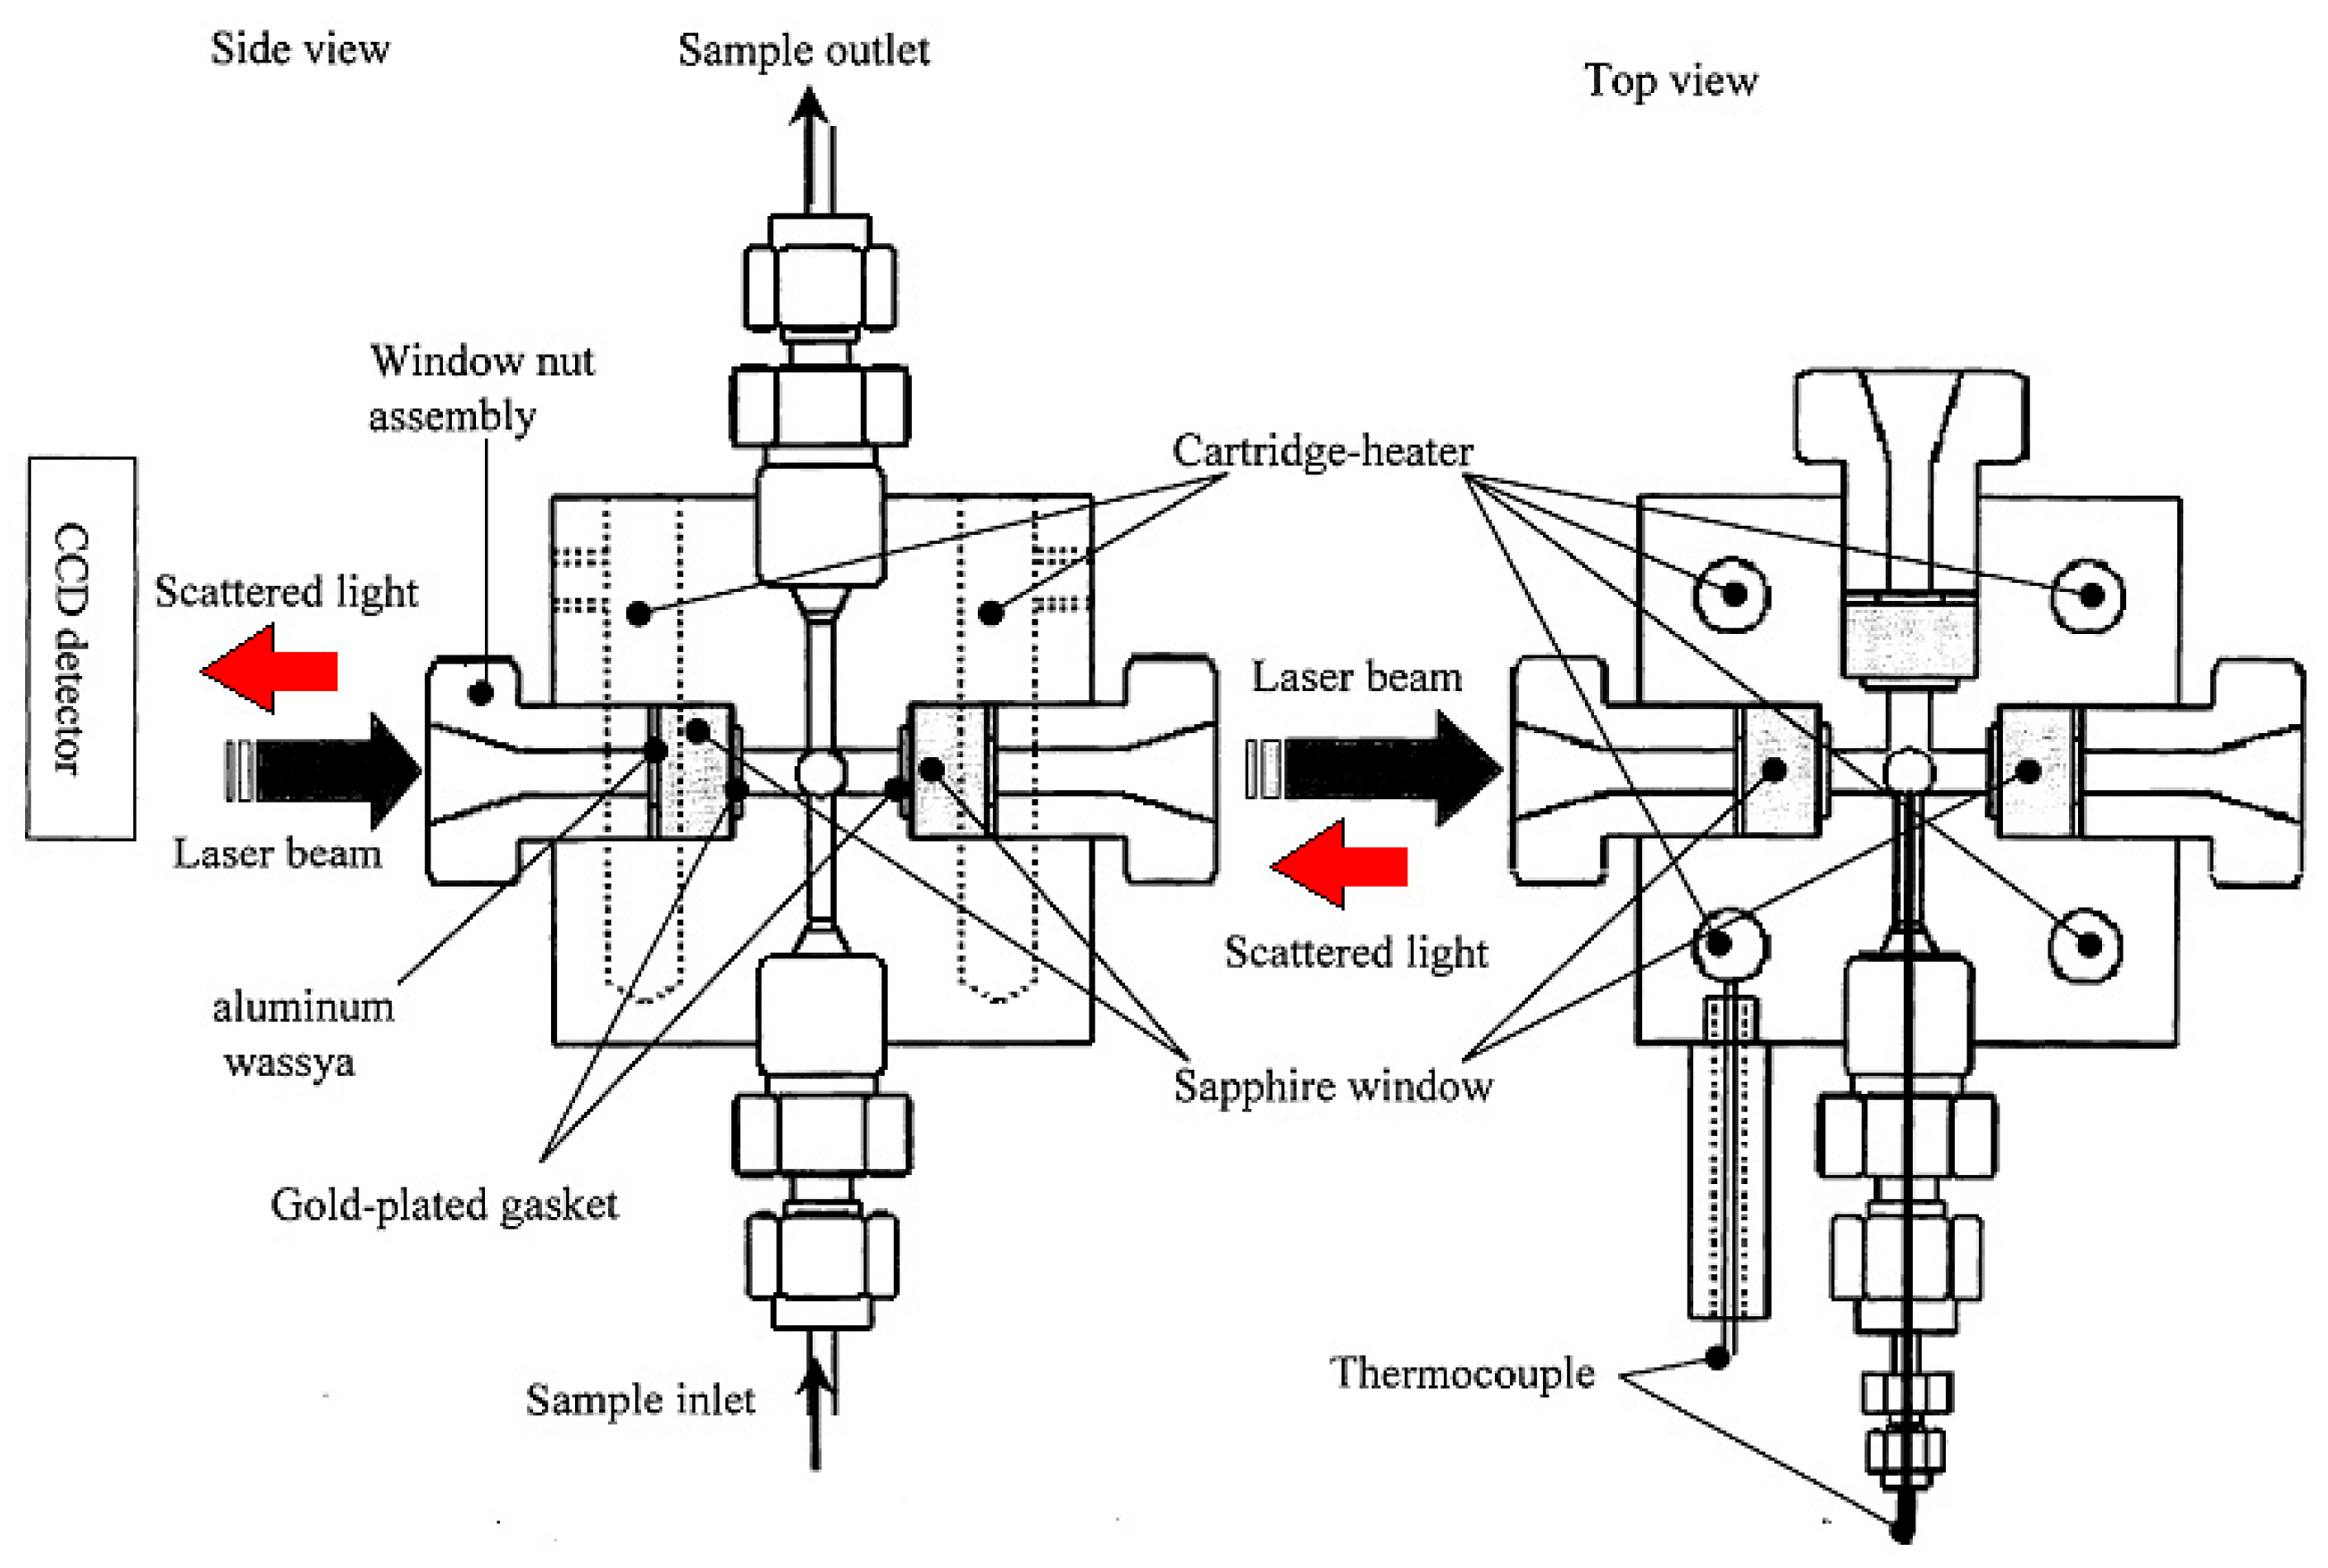
Figure 1. High-temperature and high-pressure Raman cell (Taiatsu Glass Ltd., Tokyo, Japan) (reproduced from ref. [30] with permission from the Japan Society of Analytical Chemistry, Copyright 2015).
Liquids 05 00001 g001
Figure 2. A high-temperature and high-pressure cell assembly used for EDXD.
Liquids 05 00001 g002
Figure 3. (a,b) Raman Spectra of the ν1 (NO) band of NO3 in 1 mol dm−3 Ca(NO3)2 and 1 mol dm−3 NaNO3 aqueous solutions at selected thermodynamic states; the dots represent the experimental values, the green peak area, and the red line show the fitted spectra. (ce) plot the position, FWHM, and area of the ν1(NO) peak as a function of temperature obtained by least-squares fitting.
Liquids 05 00001 g003
Figure 4. (a,b) The Raman spectra of symmetric stretching vibration of the O–D band (ν1) of HDO molecules at selected thermodynamic conditions. The solid lines show the experimental values, and the green and pink areas and red solid lines represent the components of the hydrogen bonds, non-hydrogen bonds, and their sum, respectively, at selected thermodynamic conditions. (ce) The temperature dependence of the peak position, FWHM, and area of the ν1 (OD) band. The pink circles and green triangles correspond to the aqueous Ca(NO3)2 and NaNO3 solutions. The filled and unfilled circles and triangles correspond to hydrogen bonds and non-hydrogen bonds, respectively.
Liquids 05 00001 g004
Figure 5. (a) Q weighted interference functions i(Q) and (b) the corresponding radial distribution functions (RDFs) in the form of D(r)-4πr2ρ0 of a 1 mol dm−3 Ca(NO3)2 aqueous solution over a temperature range from 25 at 0.1 MPa to 210 °C at 40 MPa. The data obtained by ADXD are included for comparison with those obtained by EDXD.
Liquids 05 00001 g005
Figure 6. (a) Pair distribution functions, (b) coordination number distributions, and (c) angle distributions of Ow–Ow pairs. (d) Spatial density functions of the water oxygen atoms in the first-neighbor (red), second-neighbor (blue), and third-neighbor (yellow) shells around a central water molecule (a water oxygen atom in red and two water hydrogen atoms in white) obtained by EPSR modeling for 1 mol dm−3 Ca(NO3)2 aqueous solution in various thermodynamic states.
Liquids 05 00001 g006
Figure 7. (a) Ca–Ow pair distribution functions, (b) Ca–Ow coordination number distributions, and (c) the angle distributions of ∠Ow–Ca–Ow for the Ca2+ solvation in 1 molar Ca(NO3)2 aqueous solutions at 100, 170, and 210 °C and 40 MPa, together with those at ambient condition (25 °C, 0.1 MPa) (color online).
Liquids 05 00001 g007
Figure 8. (a) Ca–ON pair distribution functions, (b) Ca–N pair distribution functions, (c) Ca–ON coordination number distributions, (d) Ca–N coordination number distributions, and (e) the angle distributions of ∠Ca–O–N for Ca2+–NO3 interactions in a 1 mol dm−3 Ca(NO3)2 aqueous solution at 100, 170, and 210 °C and 40 MPa, together with those at ambient conditions (25 °C, 0.1 MPa) (color online).
Liquids 05 00001 g008
Figure 9. (a) N-Ow pair distribution functions, (b) N-Ow coordination number distributions, (c) the angle distributions of ∠Ow-N-Ow for the NO3 solvation, and (d) the spatial density functions in a 1 mol dm−3 Ca(NO3)2 aqueous solution at 100, 170, and 210 °C and 40 MPa, together with those at ambient conditions (25 °C, 0.1 MPa). In (d), the yellow lobes represent the nearest-neighbor water oxygen atoms around a central NO3. The black and white balls show the nitrogen and oxygen atoms of NO3, respectively (color online).
Liquids 05 00001 g009
Table 1. Composition and density of aqueous NaNO3 and Ca(NO3)2 solutions at 25 °C.
Concentration/mol dm−3Density/g cm−3
MNO3H2O
Na+0.9360.93654.11.052
Ca2+0.9441.8953.21.113
Table 2. Potential parameter values used in EPSR modeling for a 1 molar Ca(NO3)2 aqueous solution [42,43,44].
OwHwCaNO
ε (kJ/mol)0.6500.000.7800.8370.649
σ (Å)3.1650.002.7903.9003.154
Atomic mass161401416
Coulomb Charge q (e)−0.8480.4242.0000.860−0.620
Table 3. Structure parameters of the solvation of Ca2+, NO3, ion association, and solvent water in a 1 mol dm−3 Ca(NO3)2 aqueous solution under various thermodynamic conditions. r1 and r2 denote the peak position of the first and second peaks of the corresponding pair distribution functions. CN is the mean coordination number of the atom pairs obtained by integration of Equation (8) from rmin to rmax. sh denotes a shoulder.
Atom PairThermodynamic Conditionr1 (Å)r2 (Å)CNrmin (Å)rmax (Å)
Ca2+–Ow25 °C, 0.1 MPa2.484.726.9 ± 1.32.223.22
100 °C, 40 MPa2.484.897.2 ± 1.12.223.36
170 °C, 40 MPa2.484.836.8 ± 1.02.243.36
210 °C, 40 MPa2.464.866.1 ± 1.62.183.40
Ca2+–ON25 °C, 0.1 MPa2.474.541.1 ± 1.22.223.36
100 °C, 40 MPa2.484.520.89 ± 0.832.223.12
170 °C, 40 MPa2.514.621.1 ± 0.82.223.12
210 °C, 40 MPa2.484.501.7 ± 1.62.183.32
Ca2+–N25 °C, 0.1 MPa3.665.481.0 ± 1.12.864.14
100 °C, 40 MPa3.16sh
3.65
5.270.89 ± 0.822.844.18
170 °C, 40 MPa3.16sh
3.65
5.321.0 ± 0.72.844.18
210 °C, 40 MPa3.16sh
3.63
5.521.5 ± 1.32.724.36
25 °C, 0.1 MPa3.656.1213.9 ± 1.72.884.78
N–Ow100 °C, 40 MPa3.606.1814.5 ± 1.72.944.80
170 °C, 40 MPa3.546.2813.1 ± 1.92.944.80
210 °C, 40 MPa3.726.2613.4 ± 2.22.824.98
Ow–Ow25 °C, 0.1 MPa2.814.666.6 ± 1.42.343.74
100 °C, 40 MPa2.864.707.6 ± 1.62.403.92
170 °C, 40 MPa2.864.797.8 ± 1.72.444.04
210 °C, 40 MPa2.844.76sh
5.72
8.8 ± 1.72.344.28
Disclaimer/Publisher’s Note: The statements, opinions and data contained in all publications are solely those of the individual author(s) and contributor(s) and not of MDPI and/or the editor(s). MDPI and/or the editor(s) disclaim responsibility for any injury to people or property resulting from any ideas, methods, instructions or products referred to in the content.