Article

A Basic Approach to Equations of States for Studying the Real Behavior of Noble Gases

Department of Chemistry, LMU University of Munich, Butenandtstr. 13, D-81377 Munich, Germany
Submission received: 8 October 2024 / Revised: 29 November 2024 / Accepted: 21 January 2025 / Published: 29 January 2025

Abstract

:
The relation between the pressure and molar concentration (in mol/L) of real gases in a low- to medium-pressure range is precisely described by a logarithmic two-parameter equation. Increasing the concentration caused an increase in pressure and also the weakening of the effect due to intermolecular interactions, forming the basis for an equation with an adjusted parameter. Exceeding a critical concentration by a further increase caused a switch to another set of parameters in the same equation. At high pressure, a second switch to an exponential term was observed. This equation of state, defined segment by segment, was attributed to three different structures of the medium. The validity of the equations found was verified with experimental data reported in the literature for helium, neon, argon, krypton, and xenon and is discussed in more detail for argon. The temperature dependence of the parameters of the equations is reported and the formation of a liquid phase is discussed.

1. Introduction

The dependence of the volume of a gas (v) on pressure (p) has been of general interest for a long time [1]. Reference is made to various applications, such as the detection of the influence of intermolecular interactions. In principle, equations of states allow quantitative descriptions of such interactions. A complete absence of interactions would lead to the equation for ideal gases being supported by the kinetic gas theory and realized by highly diluted permanent gases. Real gases exhibit more complex behavior caused by noticeable interactions where suitable equations of state are still under discussion. The van der Waals equation is one of the most established; however, it requires a Maxwell construction as a further assumption to cover the two-phase region of real systems and is still under discussion [2]. This creates a general problem, as there are no analytic functions consisting of curved and linear segments. Thus, even the introduction of more parameters in more complex functions maintains them as approximations, such as in the Clausius [3], Dieterici, Redlich–Kwong [4], Redlich–Kwong–Soave [5], Peng–Robinson [6], Benedict–Webb–Rubin [7], Bertholet [8], and Wohl [9] equations. More recent concepts have applied a perturbation theory of intermolecular interactions, such as the Statistical Association Fluid Theory (SAFT), considering various types of such interactions [10,11,12,13]. A global uniform treatment of these intermolecular interactions would bring about further progress.

2. General Intermolecular Interactions

The pressure p of a gas or liquid depends on the number of particles in a volume. This is more conveniently indicated by the applied molar concentration c (the inverse of volume/mol), widely applied in chemistry. Starting from highly diluted gases with essentially independent, non-interacting particles, the pressure p is expected to be proportional to the concentration c. This results in the differential Equation (1), where const1 is a constant for the proportionality between the effect of concentration and pressure, considering the different dimensions of c and p.
dp = const1·dc
The intermolecular interactions of particles become increasingly important at higher concentrations of c. Only a fraction of the effects of c on p remains, whereby this becomes smaller at higher concentrations of c so that an inverse proportionality becomes an approach [14]. Accordingly, the differential Equation (2), with a different constant const2 for proportionality, was obtained for higher concentrations.
dp = const2/c ·dc
A scaling factor c* is defined as the shift from ideal behavior, according to Equation (1), to more real behavior in (2); for experimental verification and further details, see below. Equation (2) was divided by this scaling factor c*, multiplied by c, and added to Equation (1). A separation of variables resulted in the differential Equation (3), in which the denominator is dimensionless.
d p = c o n s t 1 + c o n s t 2 / c * c c * + 1   d c
Equation (4) was obtained by integrating Equation (3) with the integration constant po.
p = ( c * ·   c o n s t 1 + c o n s t 2 ) ·   ln c c * + 1 + p o
All constants of the pre-factor were combined to form the constant E for simplification, which characterized the energetic effect of concentration c on pressure p [E = ( c * ·   c o n s t 1 + c o n s t 2 ) ] ) to obtain Equation (5). Finally, po was expected to be close to zero because of infinite diluted gases.
p = E ·   ln c c * + 1 + p o
Equation (5) had to be tested for practical applications. Firstly, Equation (5) was converted into the Ideal Gas Equation for diluted gases by a Taylor series expansion and truncation after the linear term, resulting in Equation (6), where c << c* and the concentration c is the number of moles n over the volume V.
p   E c + c *   ·   c     E c *   ·   c = E     n c *     V                     c < < c *
This resulted in the Ideal Gas Equation (7) with R·T = E/c*.
p · V   n   ·   E c * = n   ·   R · T                     c < < c *
Secondly, the application of Equation (5) to the description of the behavior of real gases will be tested. The noble gas argon was used as a model based on the precise measurements of Michels, Levelt, and De Graaff [15] (compare also Refs. [16,17]) because its atoms form spherically symmetrical simple spheres with no tendency to form any chemical bonds. An isotherm at −120 °C, just above the critical point [18] of about −122 °C, was used for the test, since appreciable real behavior could be expected.

3. Argon

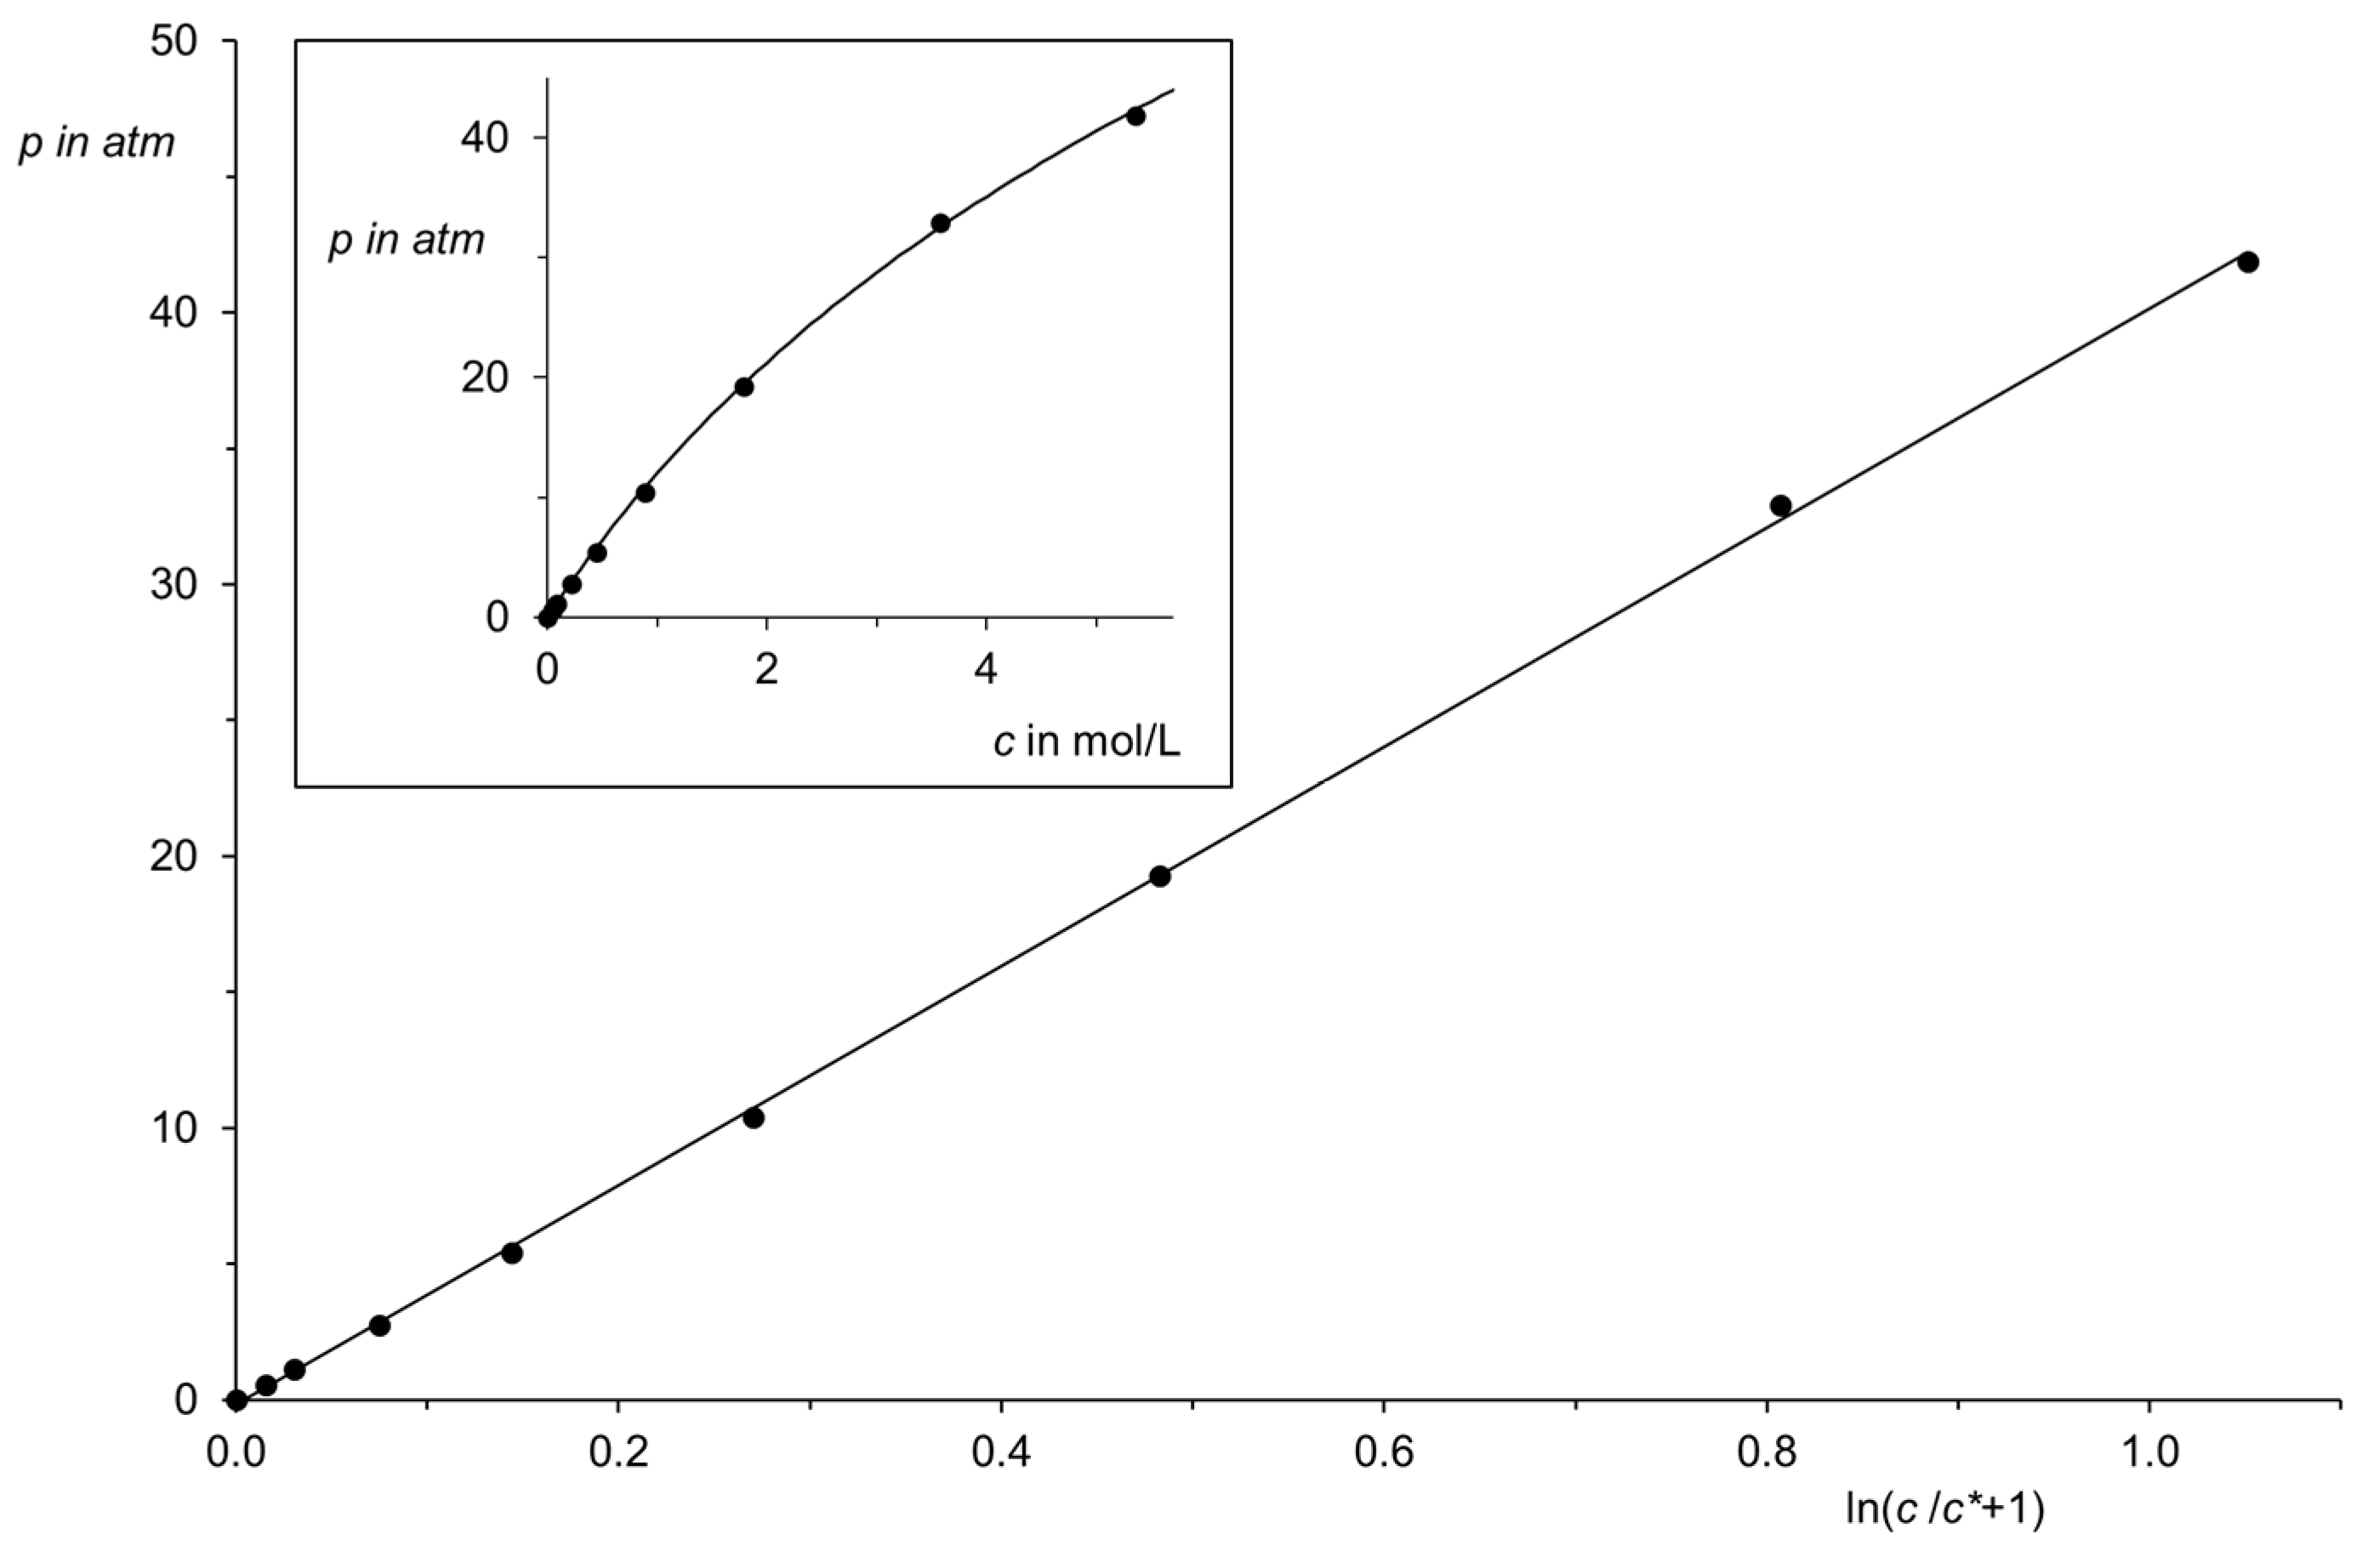
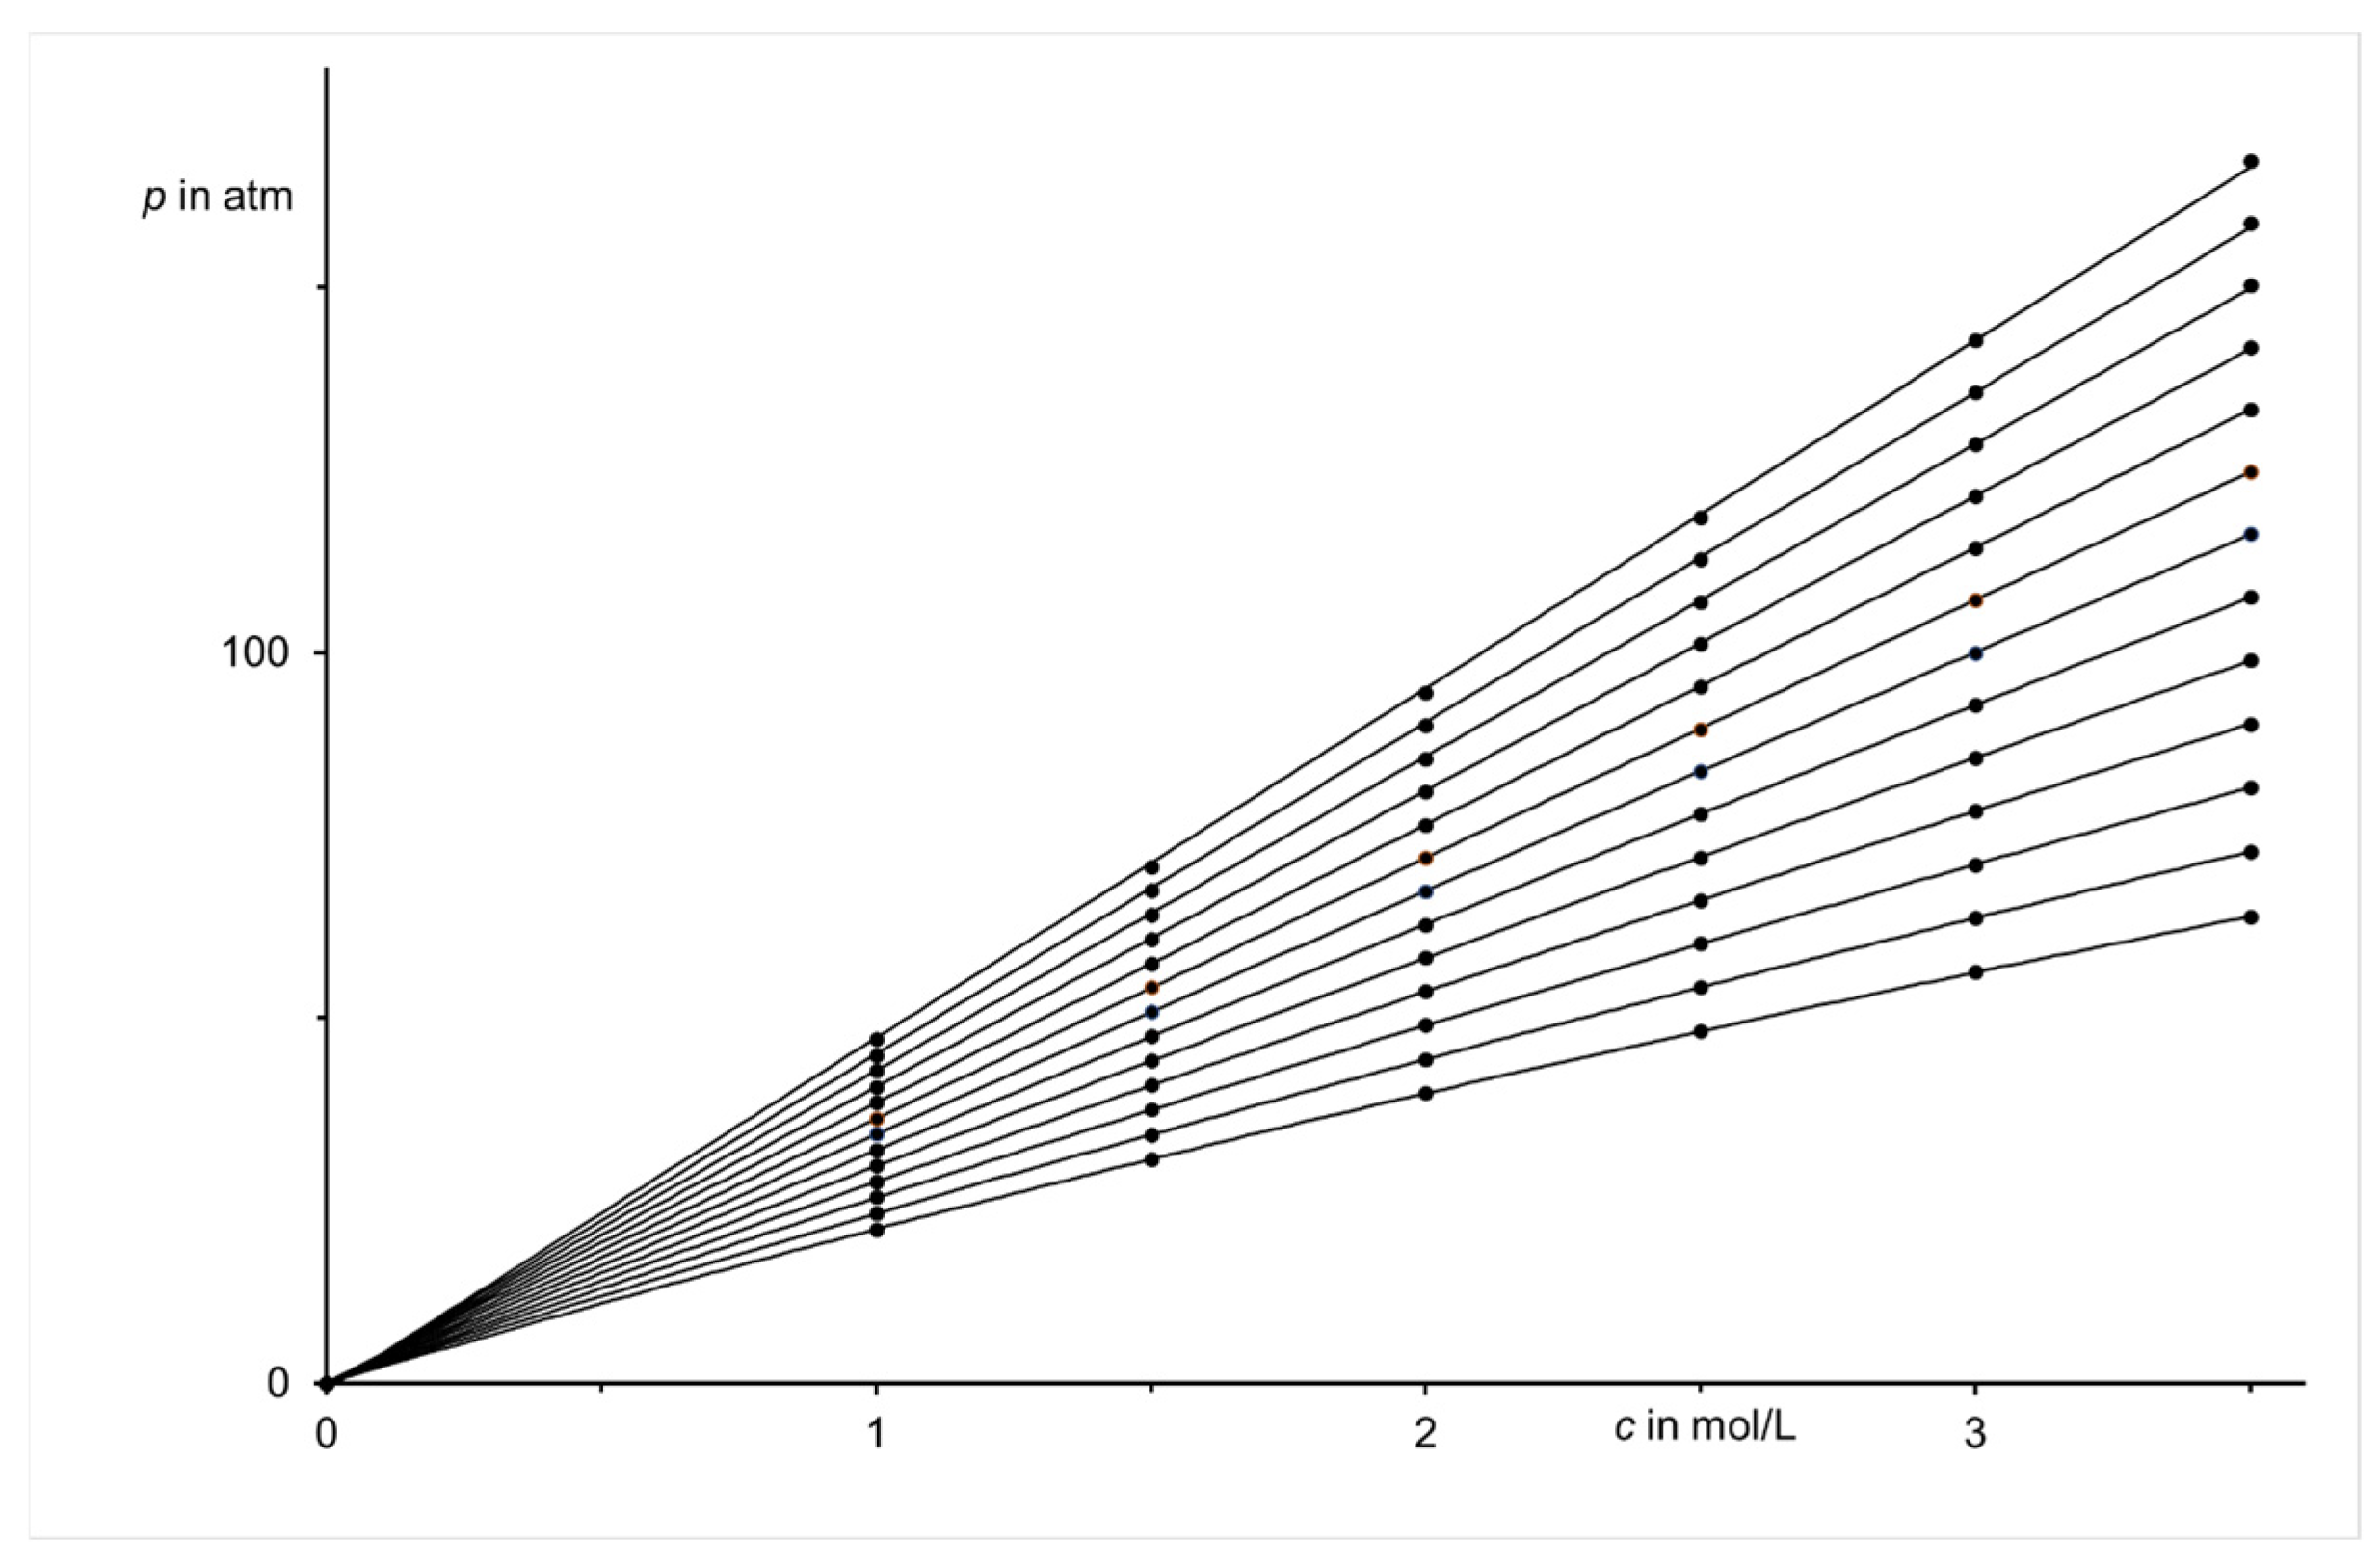
The linear correlation between the pressure p of Ar at −120 °C and the function of the concentration c represented by Equation (5) are shown in Figure 1 (performance of target to actual comparison, where r means the correlation number [19] and σ the standard deviation. r2 means the measure of determination) and indicates a good accordance with the real system because of statistical scatter within the limits of experimental error. The standard deviation of 0.3 atm corresponds to a relative error of 1.6% at the medium pressure of 19.3 atm. The calculated function compared to the experimental data is shown in the inset of Figure 1. The limiting concentration c of 5.4 mol/L corresponds to a permanent contact of argon atoms (see below). The agreement of Equation (5) with the experimental data is not limited to the isotherm near the critical point, but also applies for all reported isotherms above and below the critical point: see Figure 2 where the data of all linear correlation are given in the caption.

4. Further Noble Gases

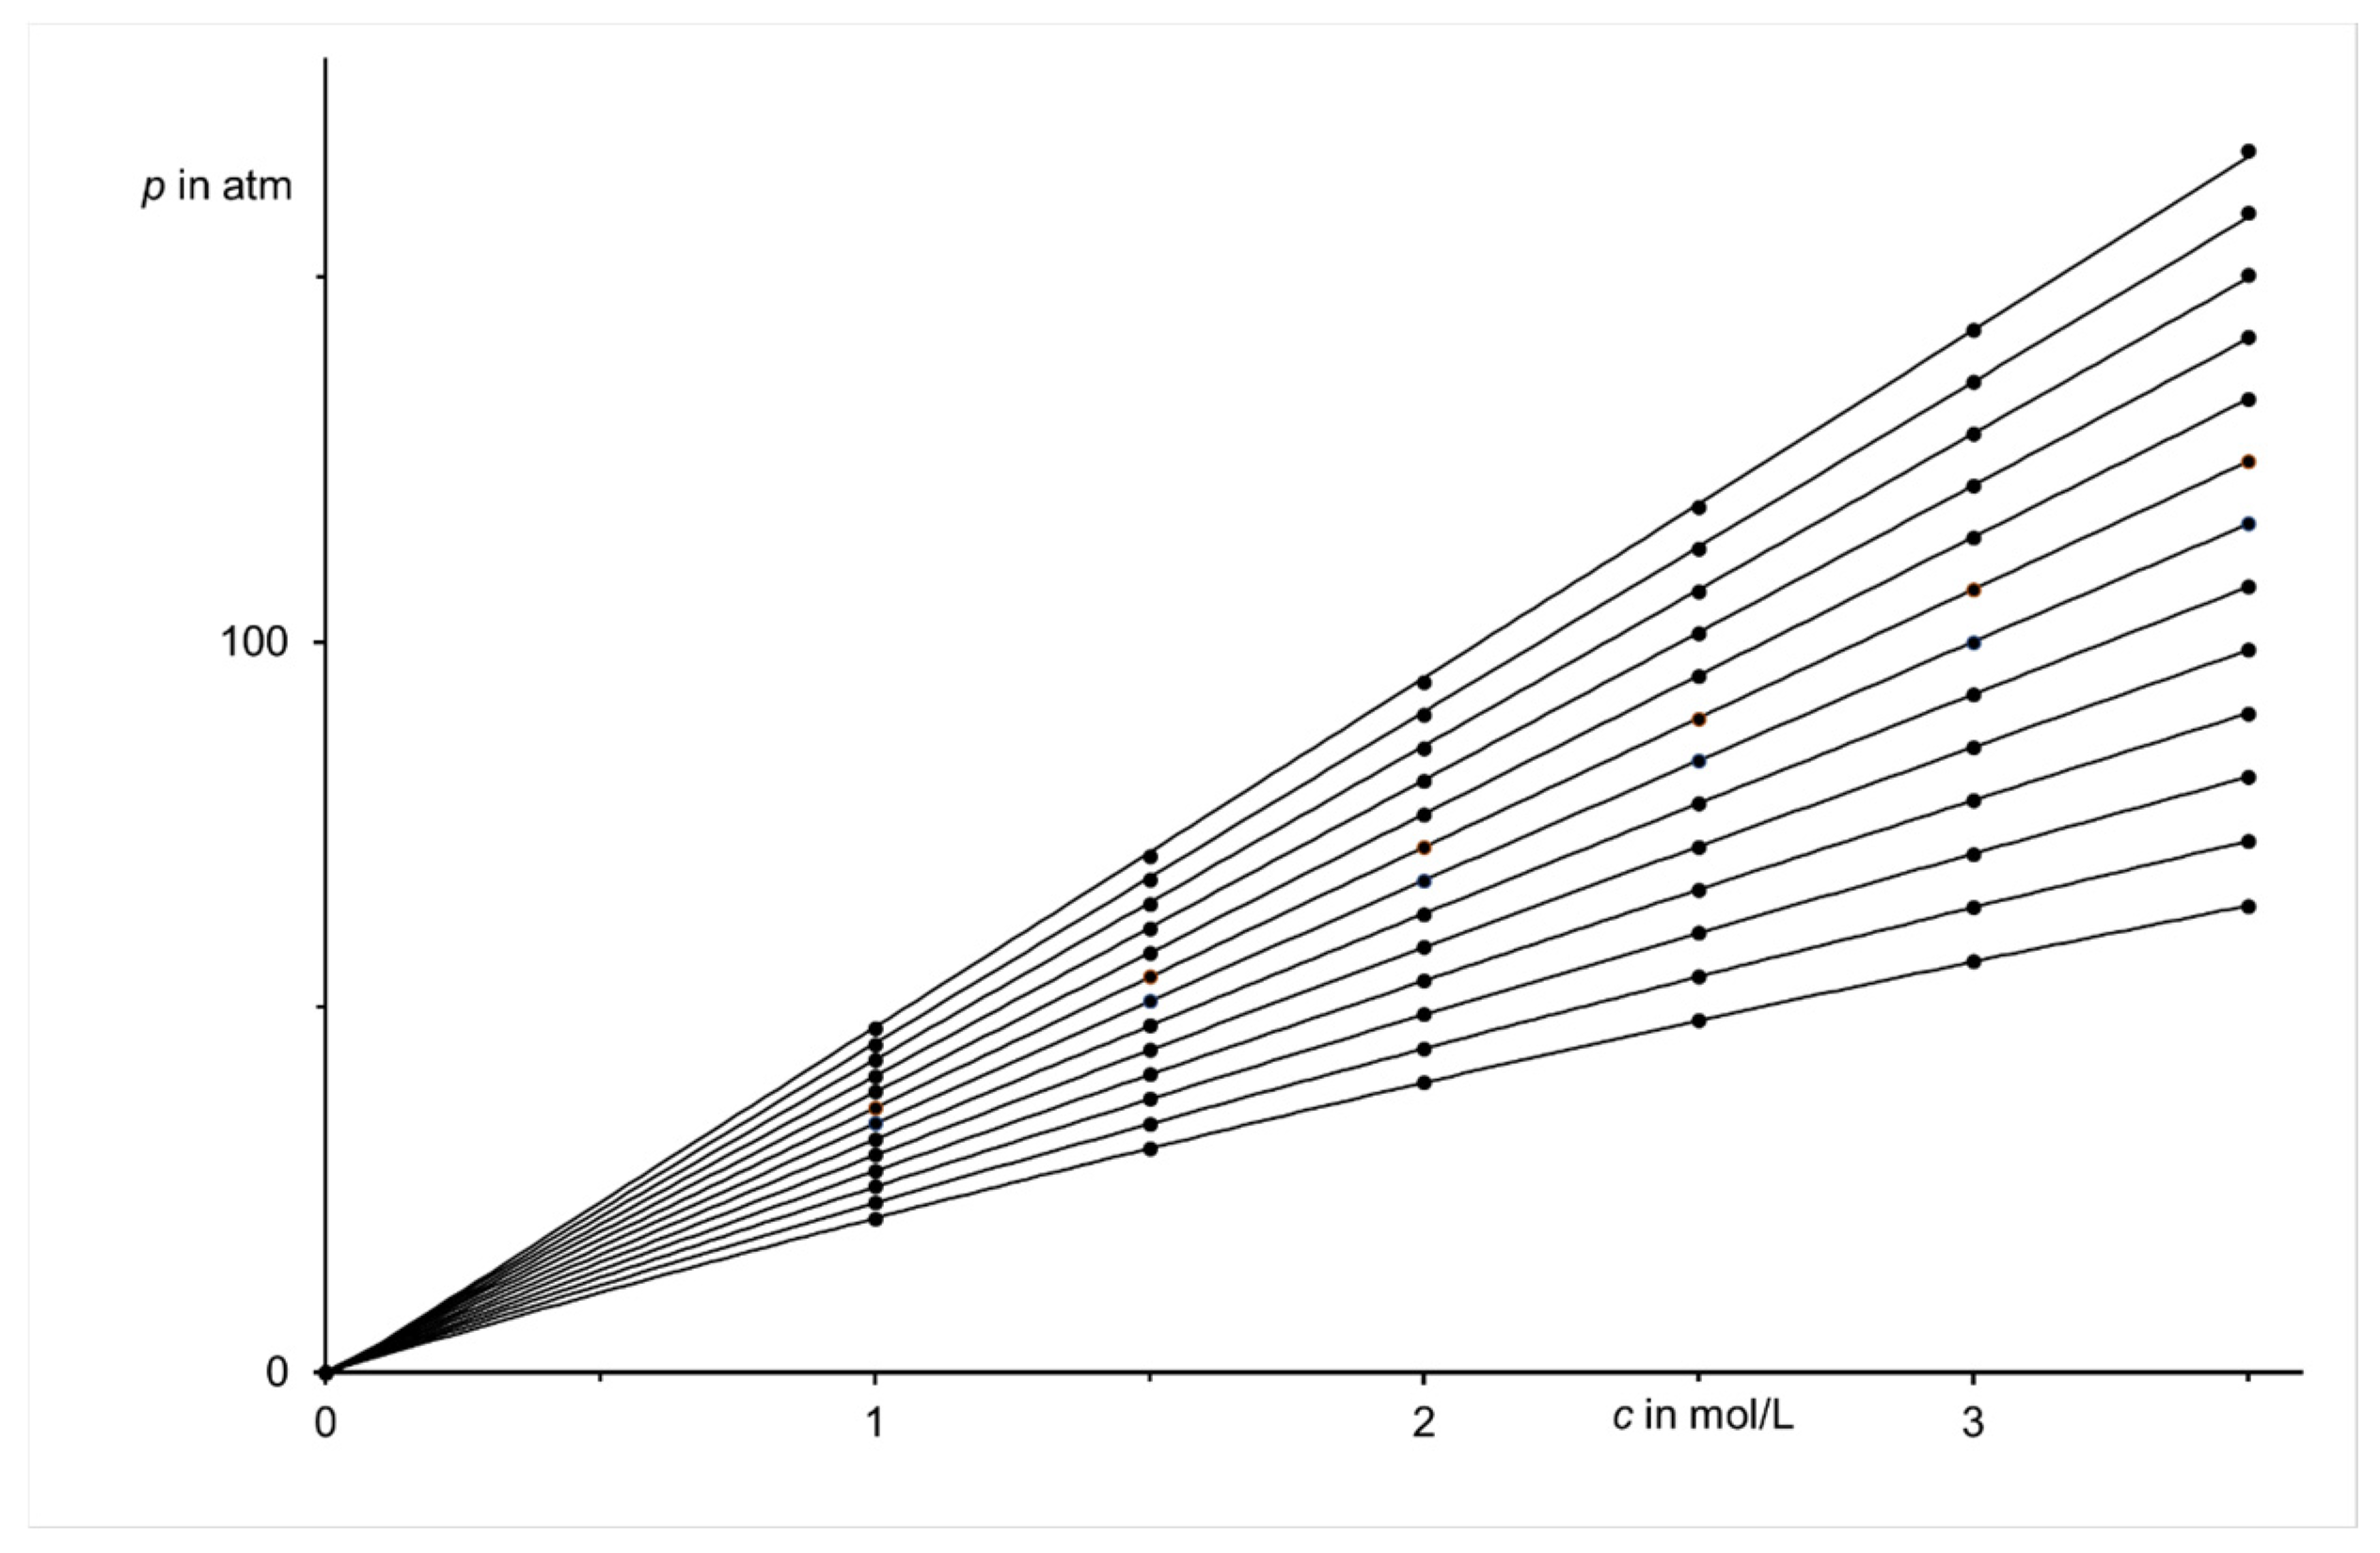
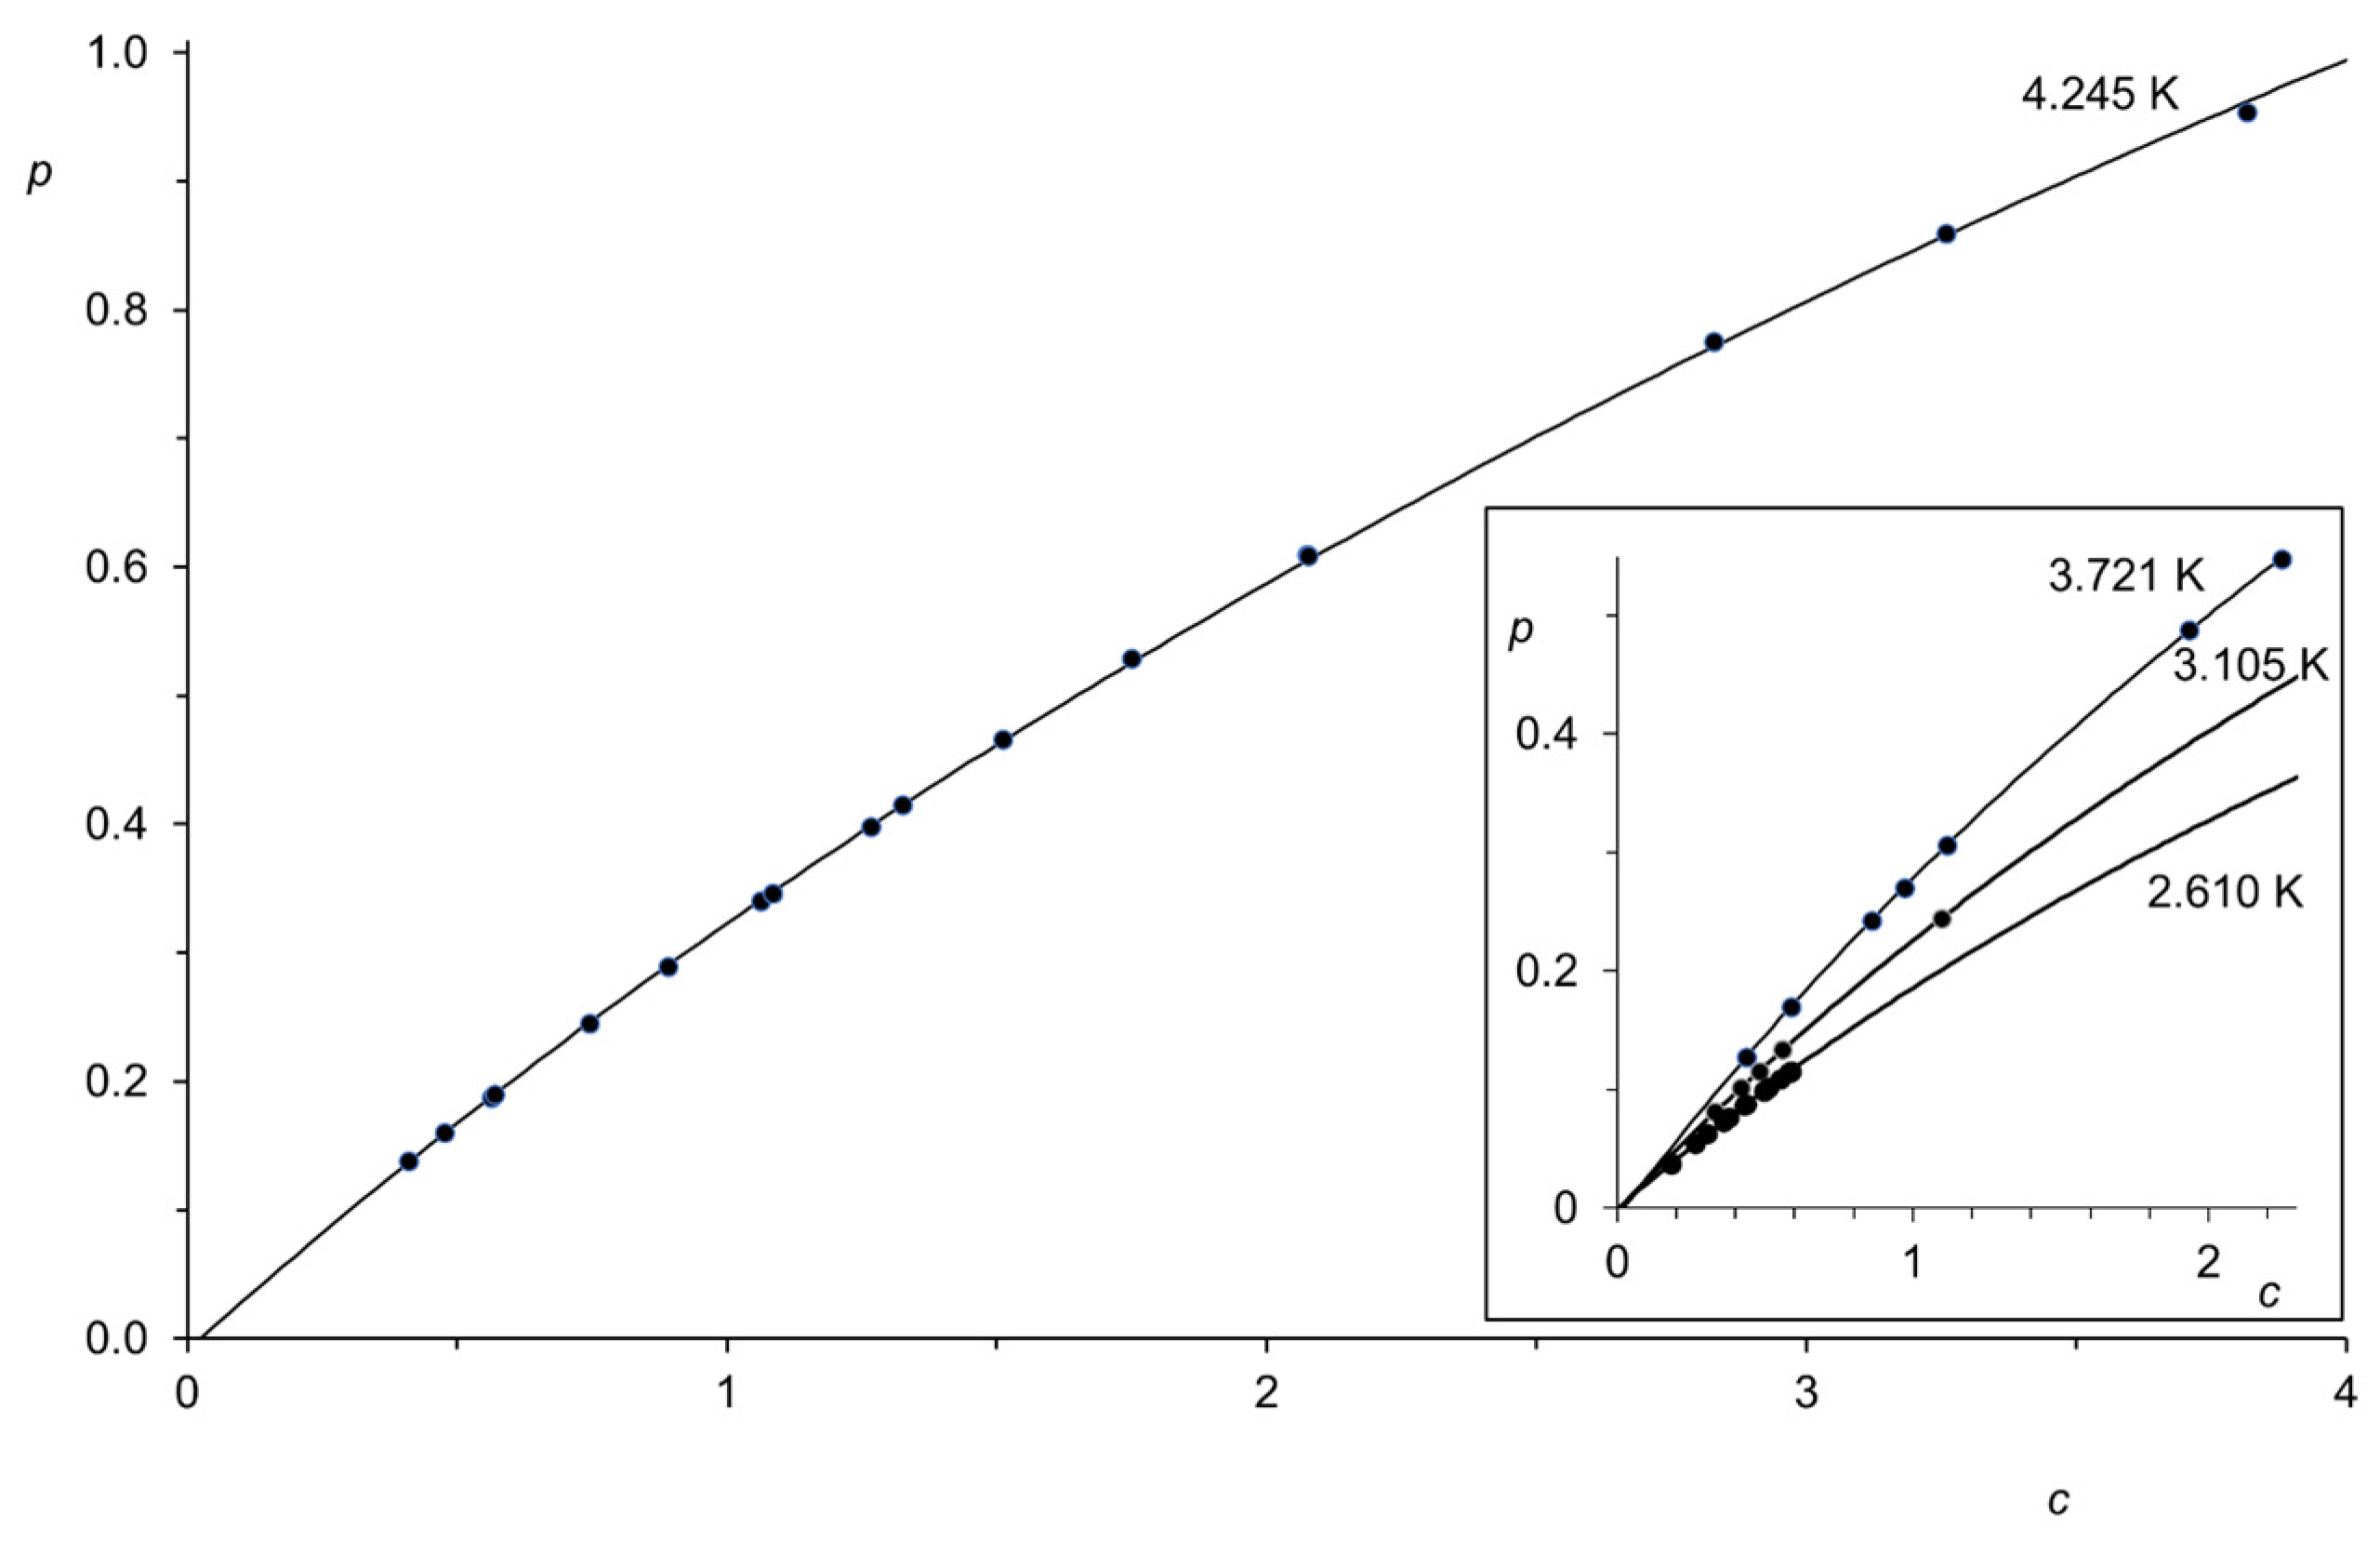
Equation (5) also applies to the other noble gases for similar concentration ranges as for the heavier noble gas krypton until 3.5 mol/L, as shown in Figure 3. The correlations according to Equation (5) are even better than for argon, where an almost ideal behavior is observed for temperatures of 200 °C and more. The even heavier noble gas xenon also fulfills Equation (5) and can be seen in Figure 4; the statistical data are given the caption.
The application of Equation (5) can be verified for the lighter neon and is shown in Figure 5; the smaller size of the atoms includes increased concentrations until 5.5 mol/L.
The application of Equation (5) can even be extended to the very light helium and is verified by a linear correlation of the precise measurement of the isotherm at 4.245 K (Leyden isotherm), see Figure 6. The application of Equation (5) to the isotherm at 4.245 K is shown in Figure 7, where the given function closely follows the experimental data. The application for even lower temperatures is shown in the inset.

5. Exceeding Limiting Concentrations

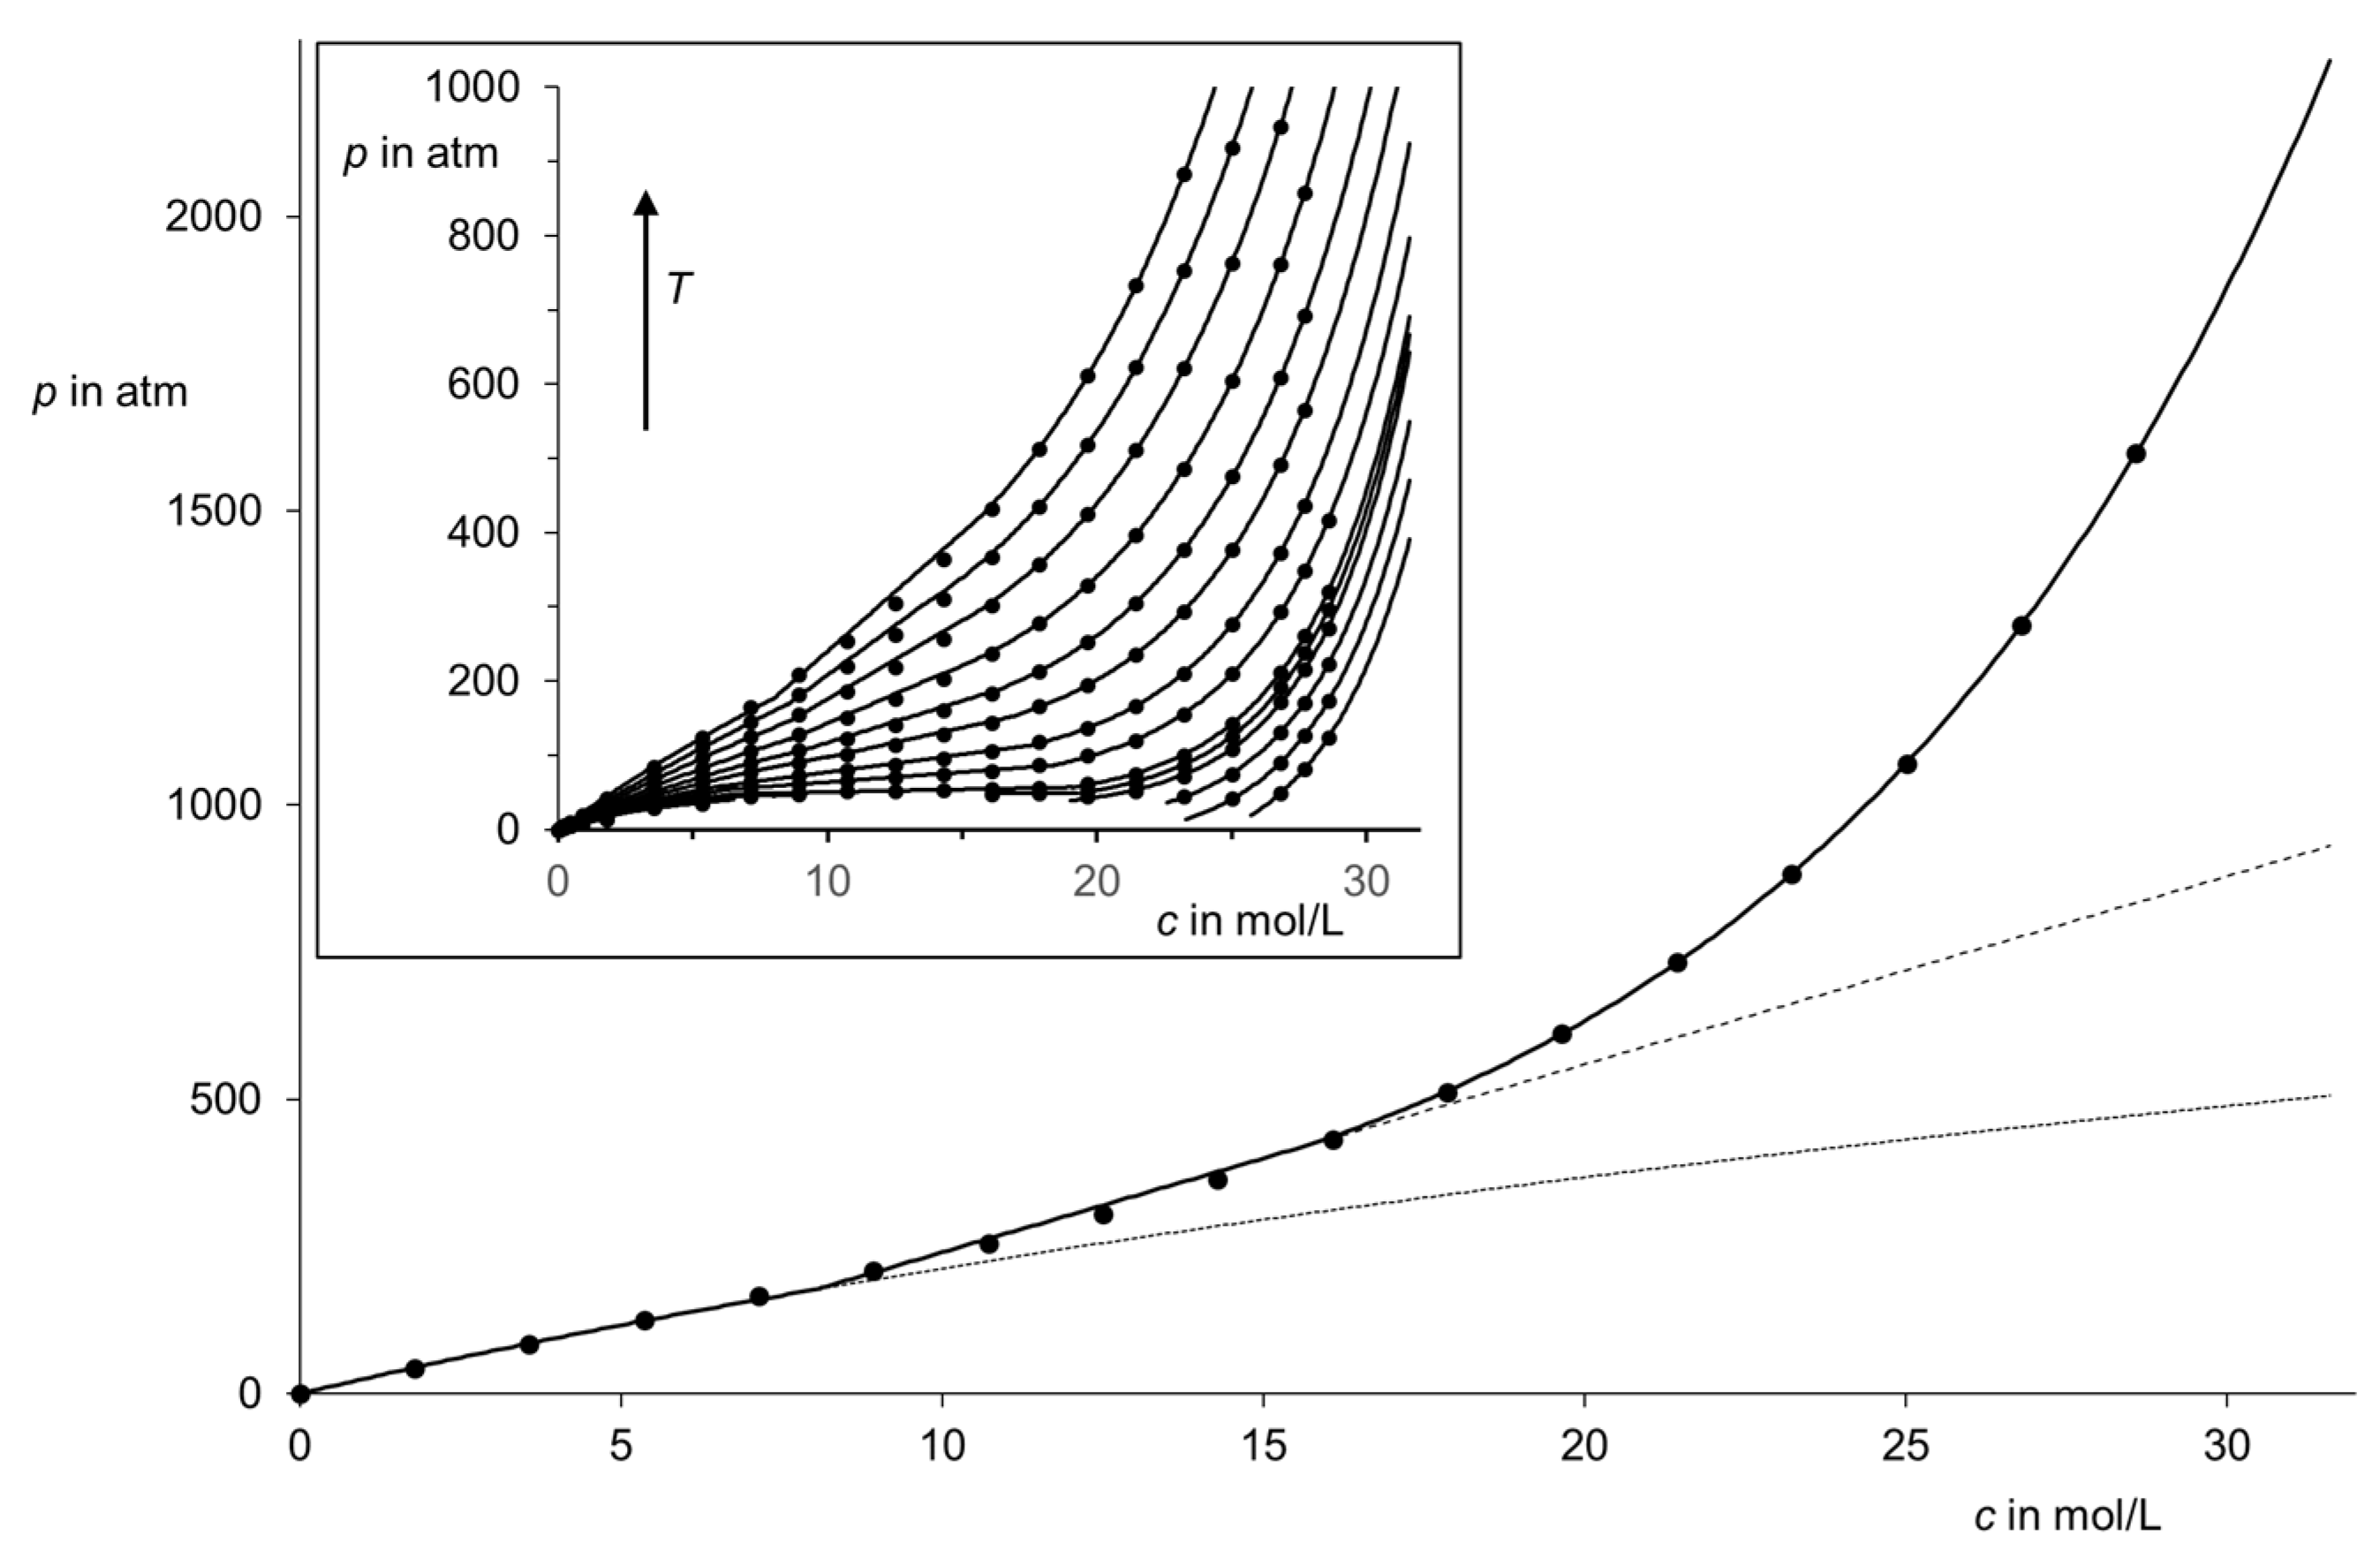
The concentration dependence of the argon pressure below the limiting concentration c of 5.4 mol/L is shown in Figure 1 and essentially corresponds to the individual movement of atoms with occasional contact with other atoms. The dependence of p on the concentration c can be realized by means of Equation (5) up to about 8.6 mol/L, as is shown in Figure 8. Exceeding this concentration leads to an abrupt change in the parameters E and c* of Equation (5) and a non-zero intercept po. This change is shown in Figure 8 by the solid curve up to 8.6 mol/L and the dotting continued in the extrapolation to higher concentrations. The function for higher concentration corresponds to the experimental data up to 18 mol/L and is indicated by the solid curve and the dashed extrapolation to higher concentrations. For even higher concentrations, the pressure p increases exponentially with the concentration c, according to Equation (8), with the parameters E and po and the intercept p*.
p = po·eE·c + p*
No further deviations were found. The isotherms of argon for lower temperatures were investigated to obtain more information, since the influence of the interactions on p is significantly stronger, as is shown in the inset of Figure 8. Equations (5) and (8) are valid for the entire range of measured temperatures from 25 until −140 °C and cover even the range below the critical point of −122.3 °C for both monophasic branches; detailed information on the parameters of Equations (5) and (8) as well as statistical data can be found in Table 1.
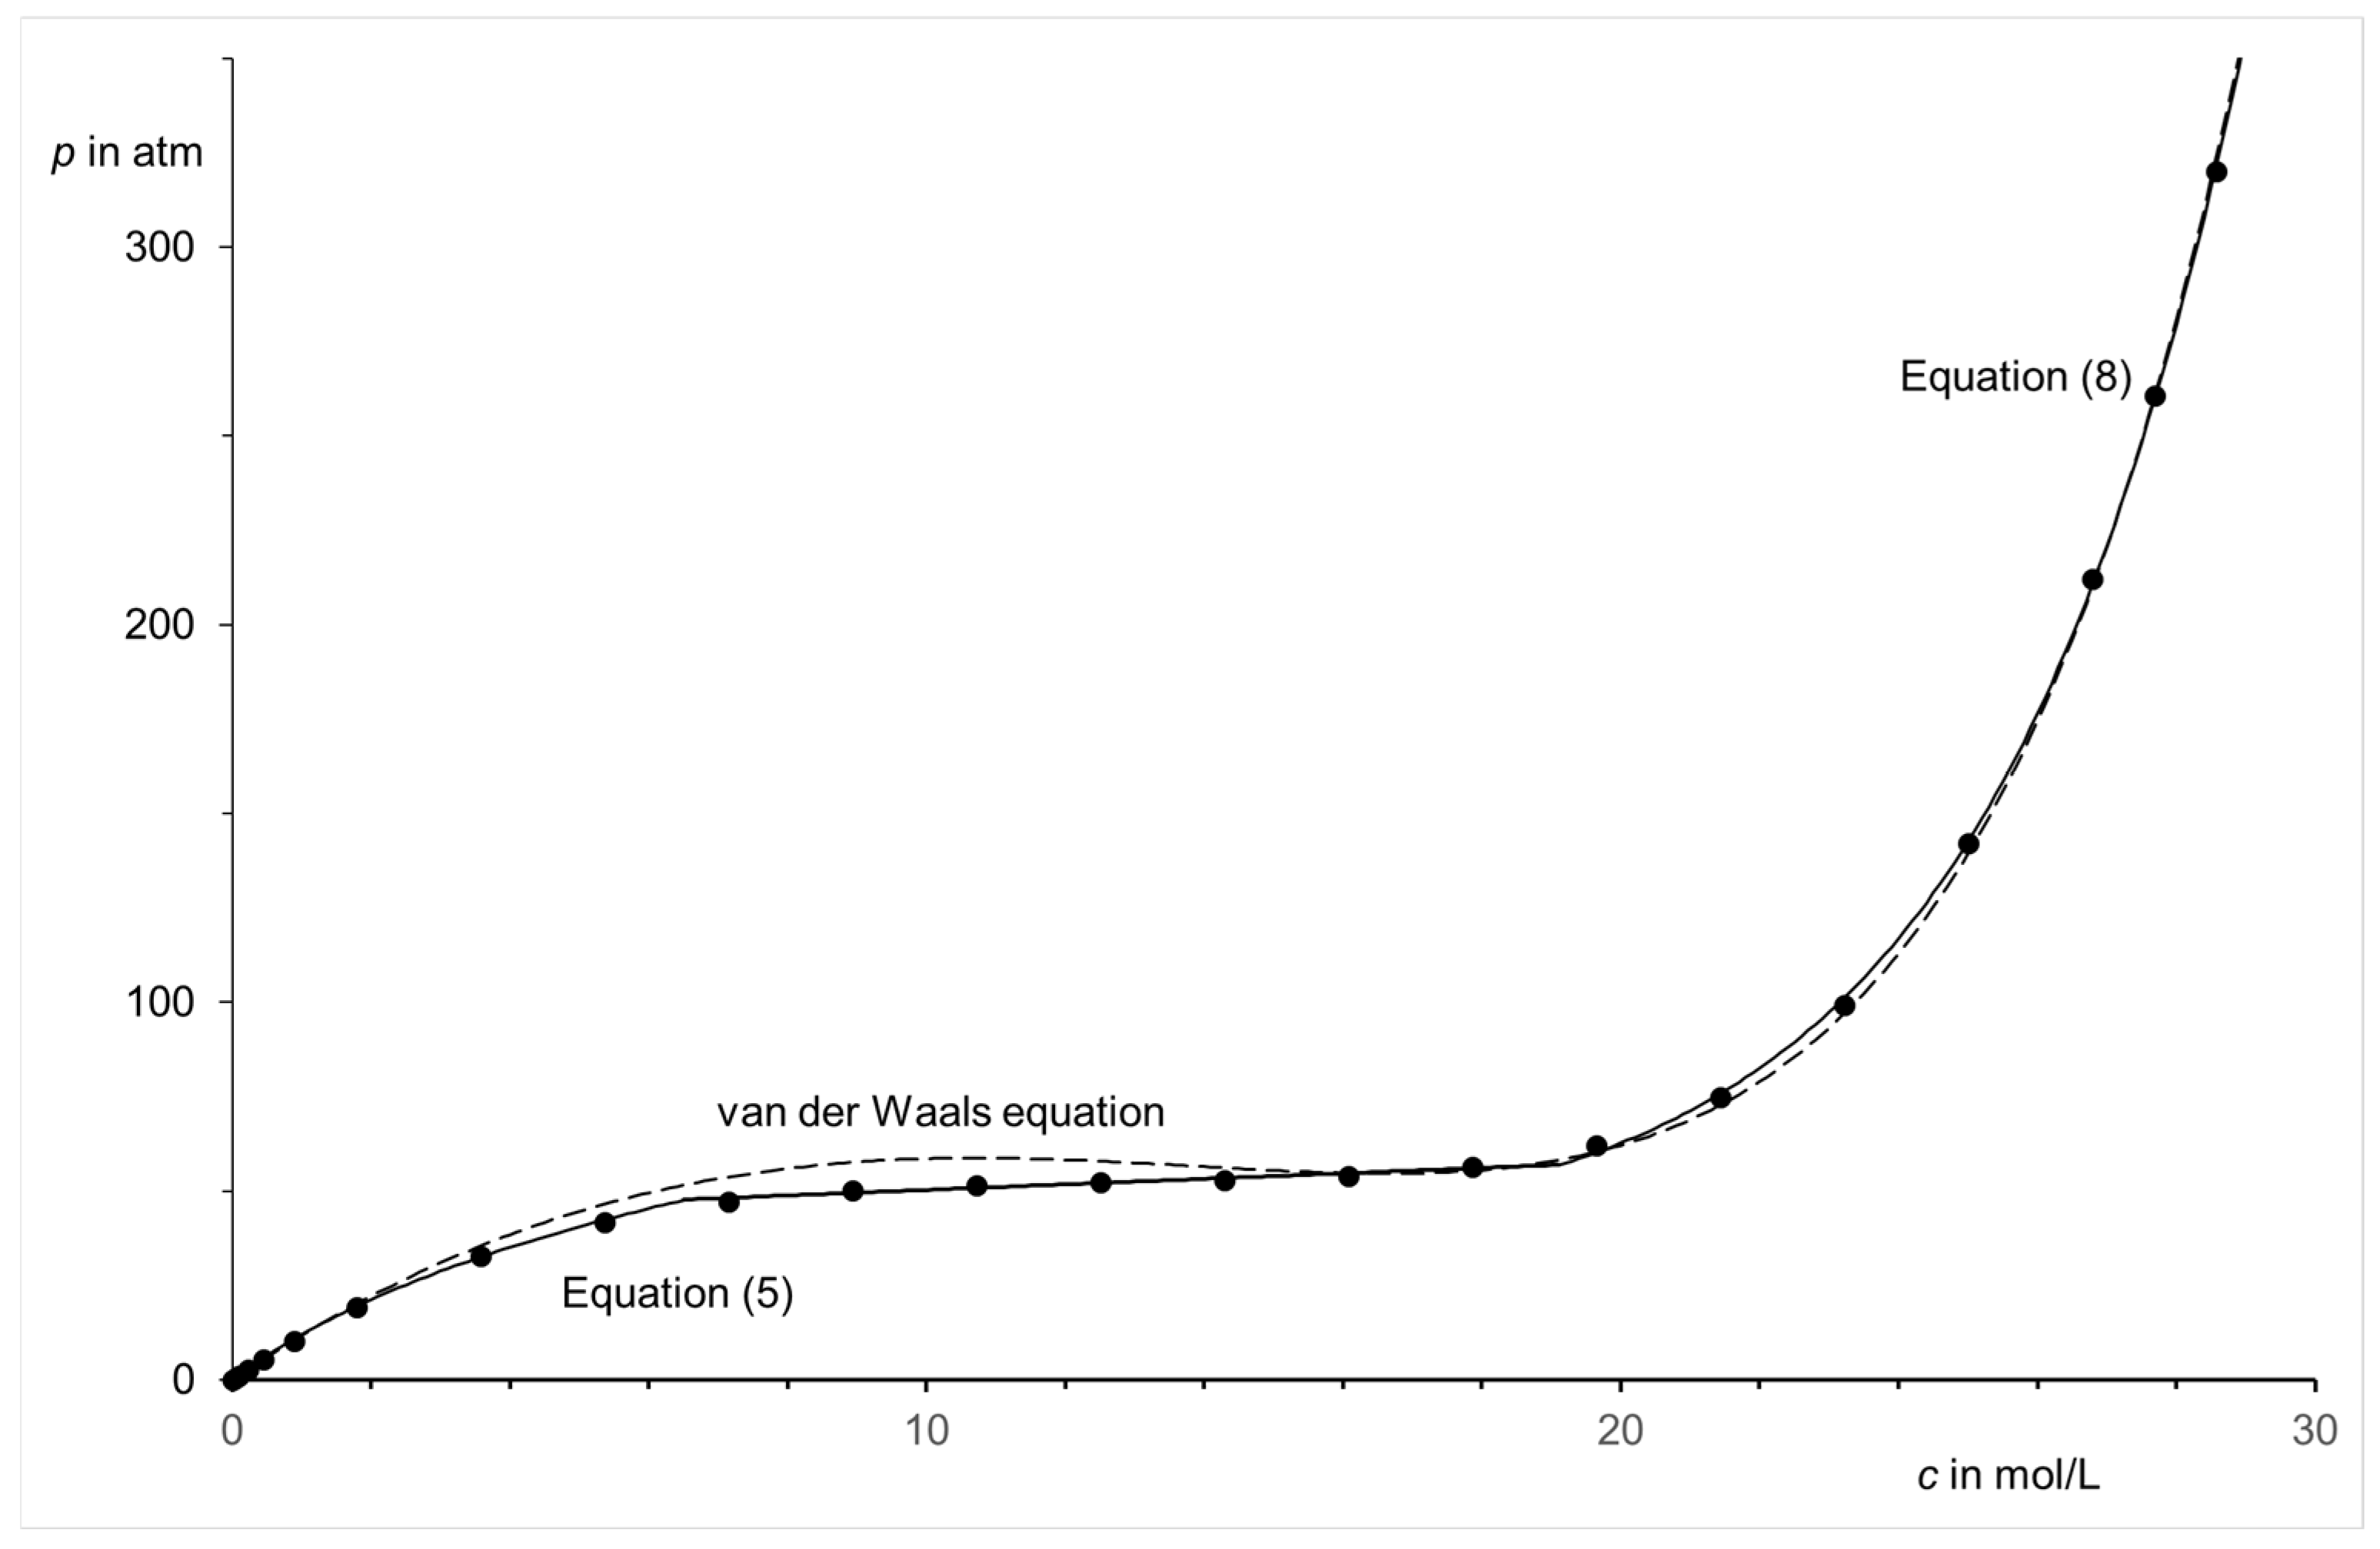
The application of Equation (5) and (8), respectively, was compared with the well-established van der Waals equation p = n·R·T/(V-n·b) − a·n2/V2) where p means the pressure, V the volume, n the moles, T the absolute temperature, and R the universal gas constant. a and b are adjustable coefficients. The van der Waals equation was transformed to use the concentration c = n/V to obtain p = c·R·T/(1-c·b) − c2·a. The parameters a and b were adapted to the experimental values of the isotherm at −120 °C by means of the least squares, as is shown in Figure 9. The segmental adaptation using Equations (5) and (8) (solid curves) gives appreciably better results than the van der Waals equation (dashed curve).
The results shown in Figure 8 are interpreted in relation to the atomic contacts. At low concentrations, there are only random sporadic interactions between the particles, which can essentially still enable their free movement. As the concentration increases, the distance between the particles decreases until permanent contact is achieved and a comparably abrupt transition to a changed structure of the medium occurs. The concentration ck(i–ii) of about 8.62 mol/L observed for this transition corresponds to a cube of 5.78 Å for the volume for one atom. The statistical average distance [27,28] is smaller by a factor of about 0.55 and is 3.20 Å; this indicates an effective diameter of one argon atom. A further increase in the concentration c reduces the distance between the particles more and more until a dense packing at ck(ii–iii) of 18 mol/L is achieved; this corresponds to a cube of 4.52 Å for one atom. The most dense are hexagonal or cubic faced packings. Thus, a dense cubic-face-centered packing can be used for an approximation to ck(ii–iii) where the lattice constant is larger by a factor of √2 than the interatomic distance so that 3.19 Å is obtained; this is in good agreement with the distance 3.20 Å found for ck(i–ii).
For comparison, the reported [29] van der Waals radius for argon of 1.88 Å gives a diameter of 3.76 Å for argon atoms. This value is in acceptable agreement with the distance of 3.2 Å found, for which the application of a completely different model has to be considered.
A further increase in concentration c results in a strong repulsion of the electron shell of the atoms, verified by the exponential Equation (8) and the right branch in Figure 8, with a strong increase in pressure p.

6. The Two-Phasic Region

Figure 8 represents the isotherm of argon at 25 °C, which is appreciable above the critical point of 150.87 K and −122.28 °C, respectively. Similar isotherms are obtained for lower temperatures up to the critical point; see the inset of Figure 8 and Table 1. Even below the critical point, Equations (5) and (8) can be applied to the branches in region (i) with low concentration and region (iii) with high concentration, indicating a generally similar behavior of the medium. The formation of two phases is interpreted as limited miscibility of the two structures of the medium, the densely packed arrangement in region (iii) and the less densely arrangement in region (i) and (ii), respectively. As a consequence, a surface between these phases is formed which is characterized by the surface tension. The surface tension between these structures decreases with increasing temperatures and vanishes at the critical point.

7. Isotherms of Other Noble Gases

Isotherms similar to those interpreted for argon were found for the other noble gases. The critical concentration ck(i–ii) of krypton was found at about 5.0 mol/L and corresponds to the larger dimension of krypton atoms, while xenon reaches the transition at 3.2 mol/L. The smaller homologue neon requires 15 mol/L. The relative concentrations of transition are approximately proportional to the relative volume of the elementary cells of crystalline noble gases because they present the volumes of the atoms and are given in Figure 10 (all noble gases form cubic face centered crystal lattices). The ck(i–ii) value of helium can be estimated from the lattice constant of crystalline material by extrapolation and would require more than 30 mol/L and a very high pressure, respectively.
The ck(i–ii) values of argon were only slightly temperature-dependent, as shown in the inset in Figure 10; the concentration may be essentially determined by the atomic dimensions of argon. There was a sufficiently large experimental basis for the determination at various temperatures, where there seems to be a slight increase at lower temperatures. However, considerable experimental uncertainties stand in the way of an exact determination.

8. The Temperature Dependence of Parameters

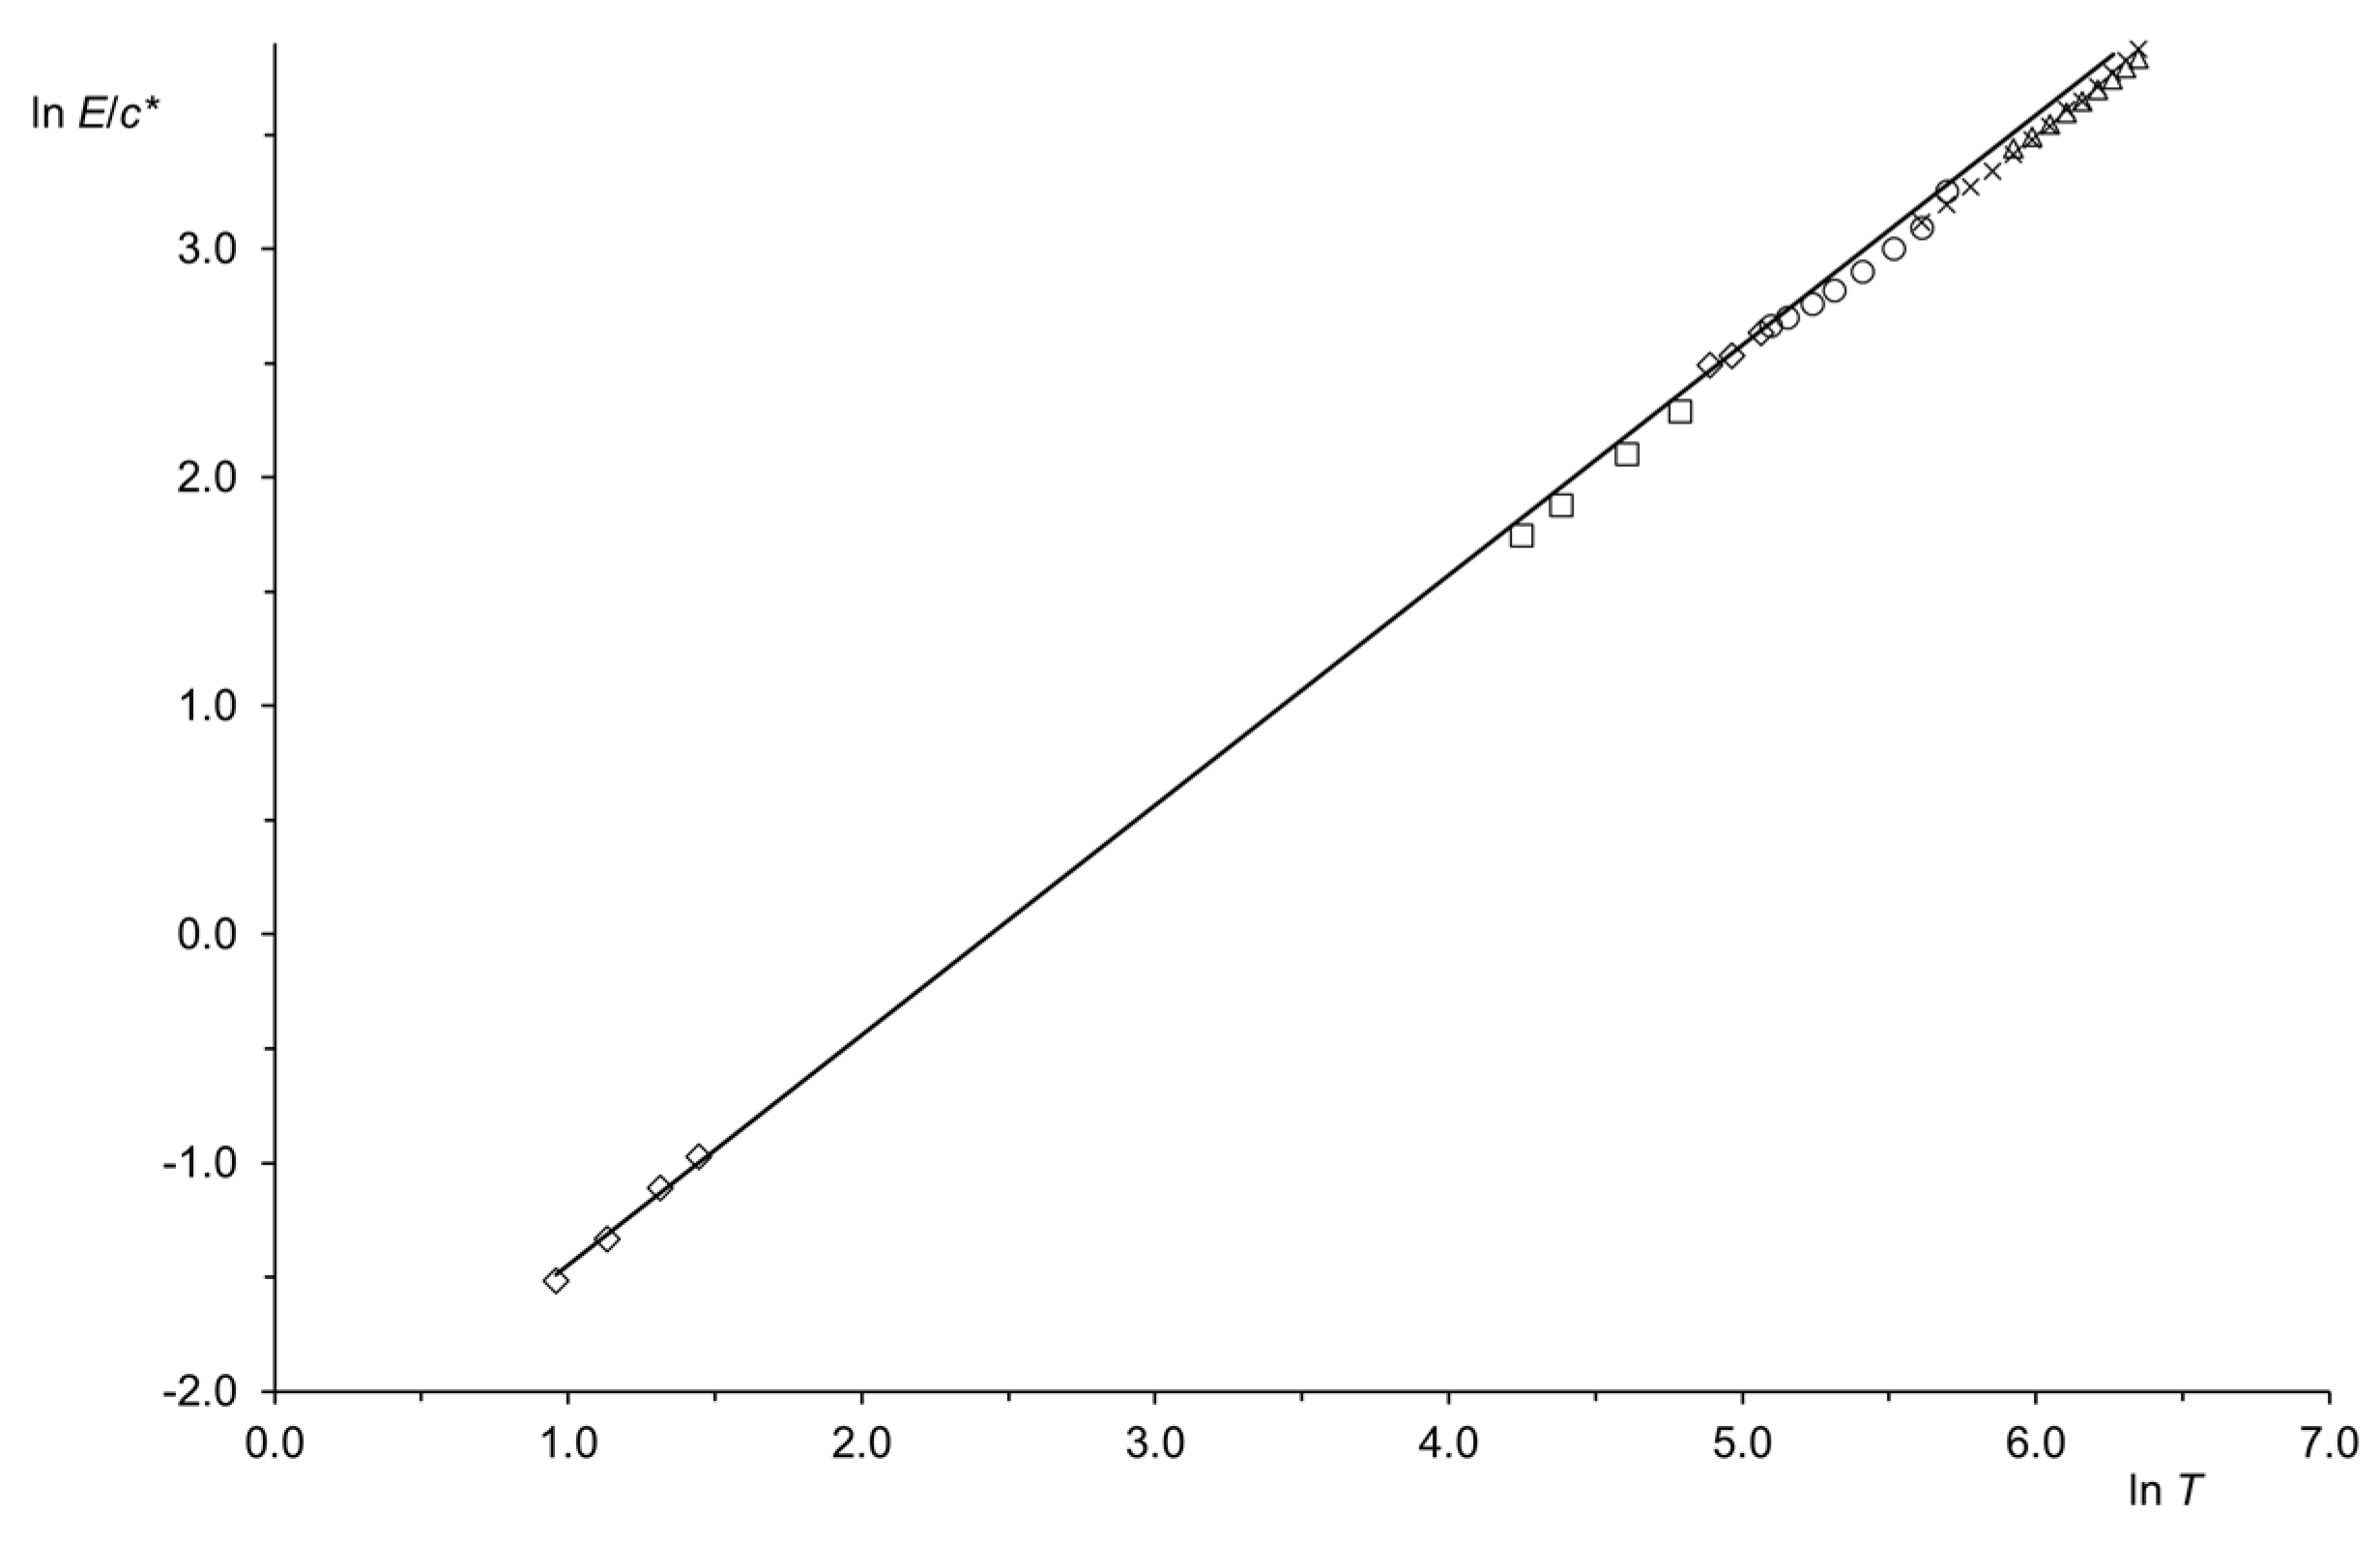
A linear temperature dependence of the quotient E/c* is to be expected according to Equation (7) based on the comparison of the coefficients with the equation of ideal gases. To check this, the ln E/c* of the experimental values were plotted against ln T in Figure 11. Slopes were found close to 1. The slope of 0.939 was found for argon for region (i) above the critical point (see Figure 11); the slope decreases slightly to 0.87 with stronger scattering of the points when lower temperatures are included. The slope for the heavier Kr was 1.022 and for Xe 0.922. Similar results were obtained for the less heavy Ne of 1.01 and for He of 1.007. The approximation to the slope to 1 is remarkable because this means an extrapolation to ideal gases from dense gases with strong real behavior.
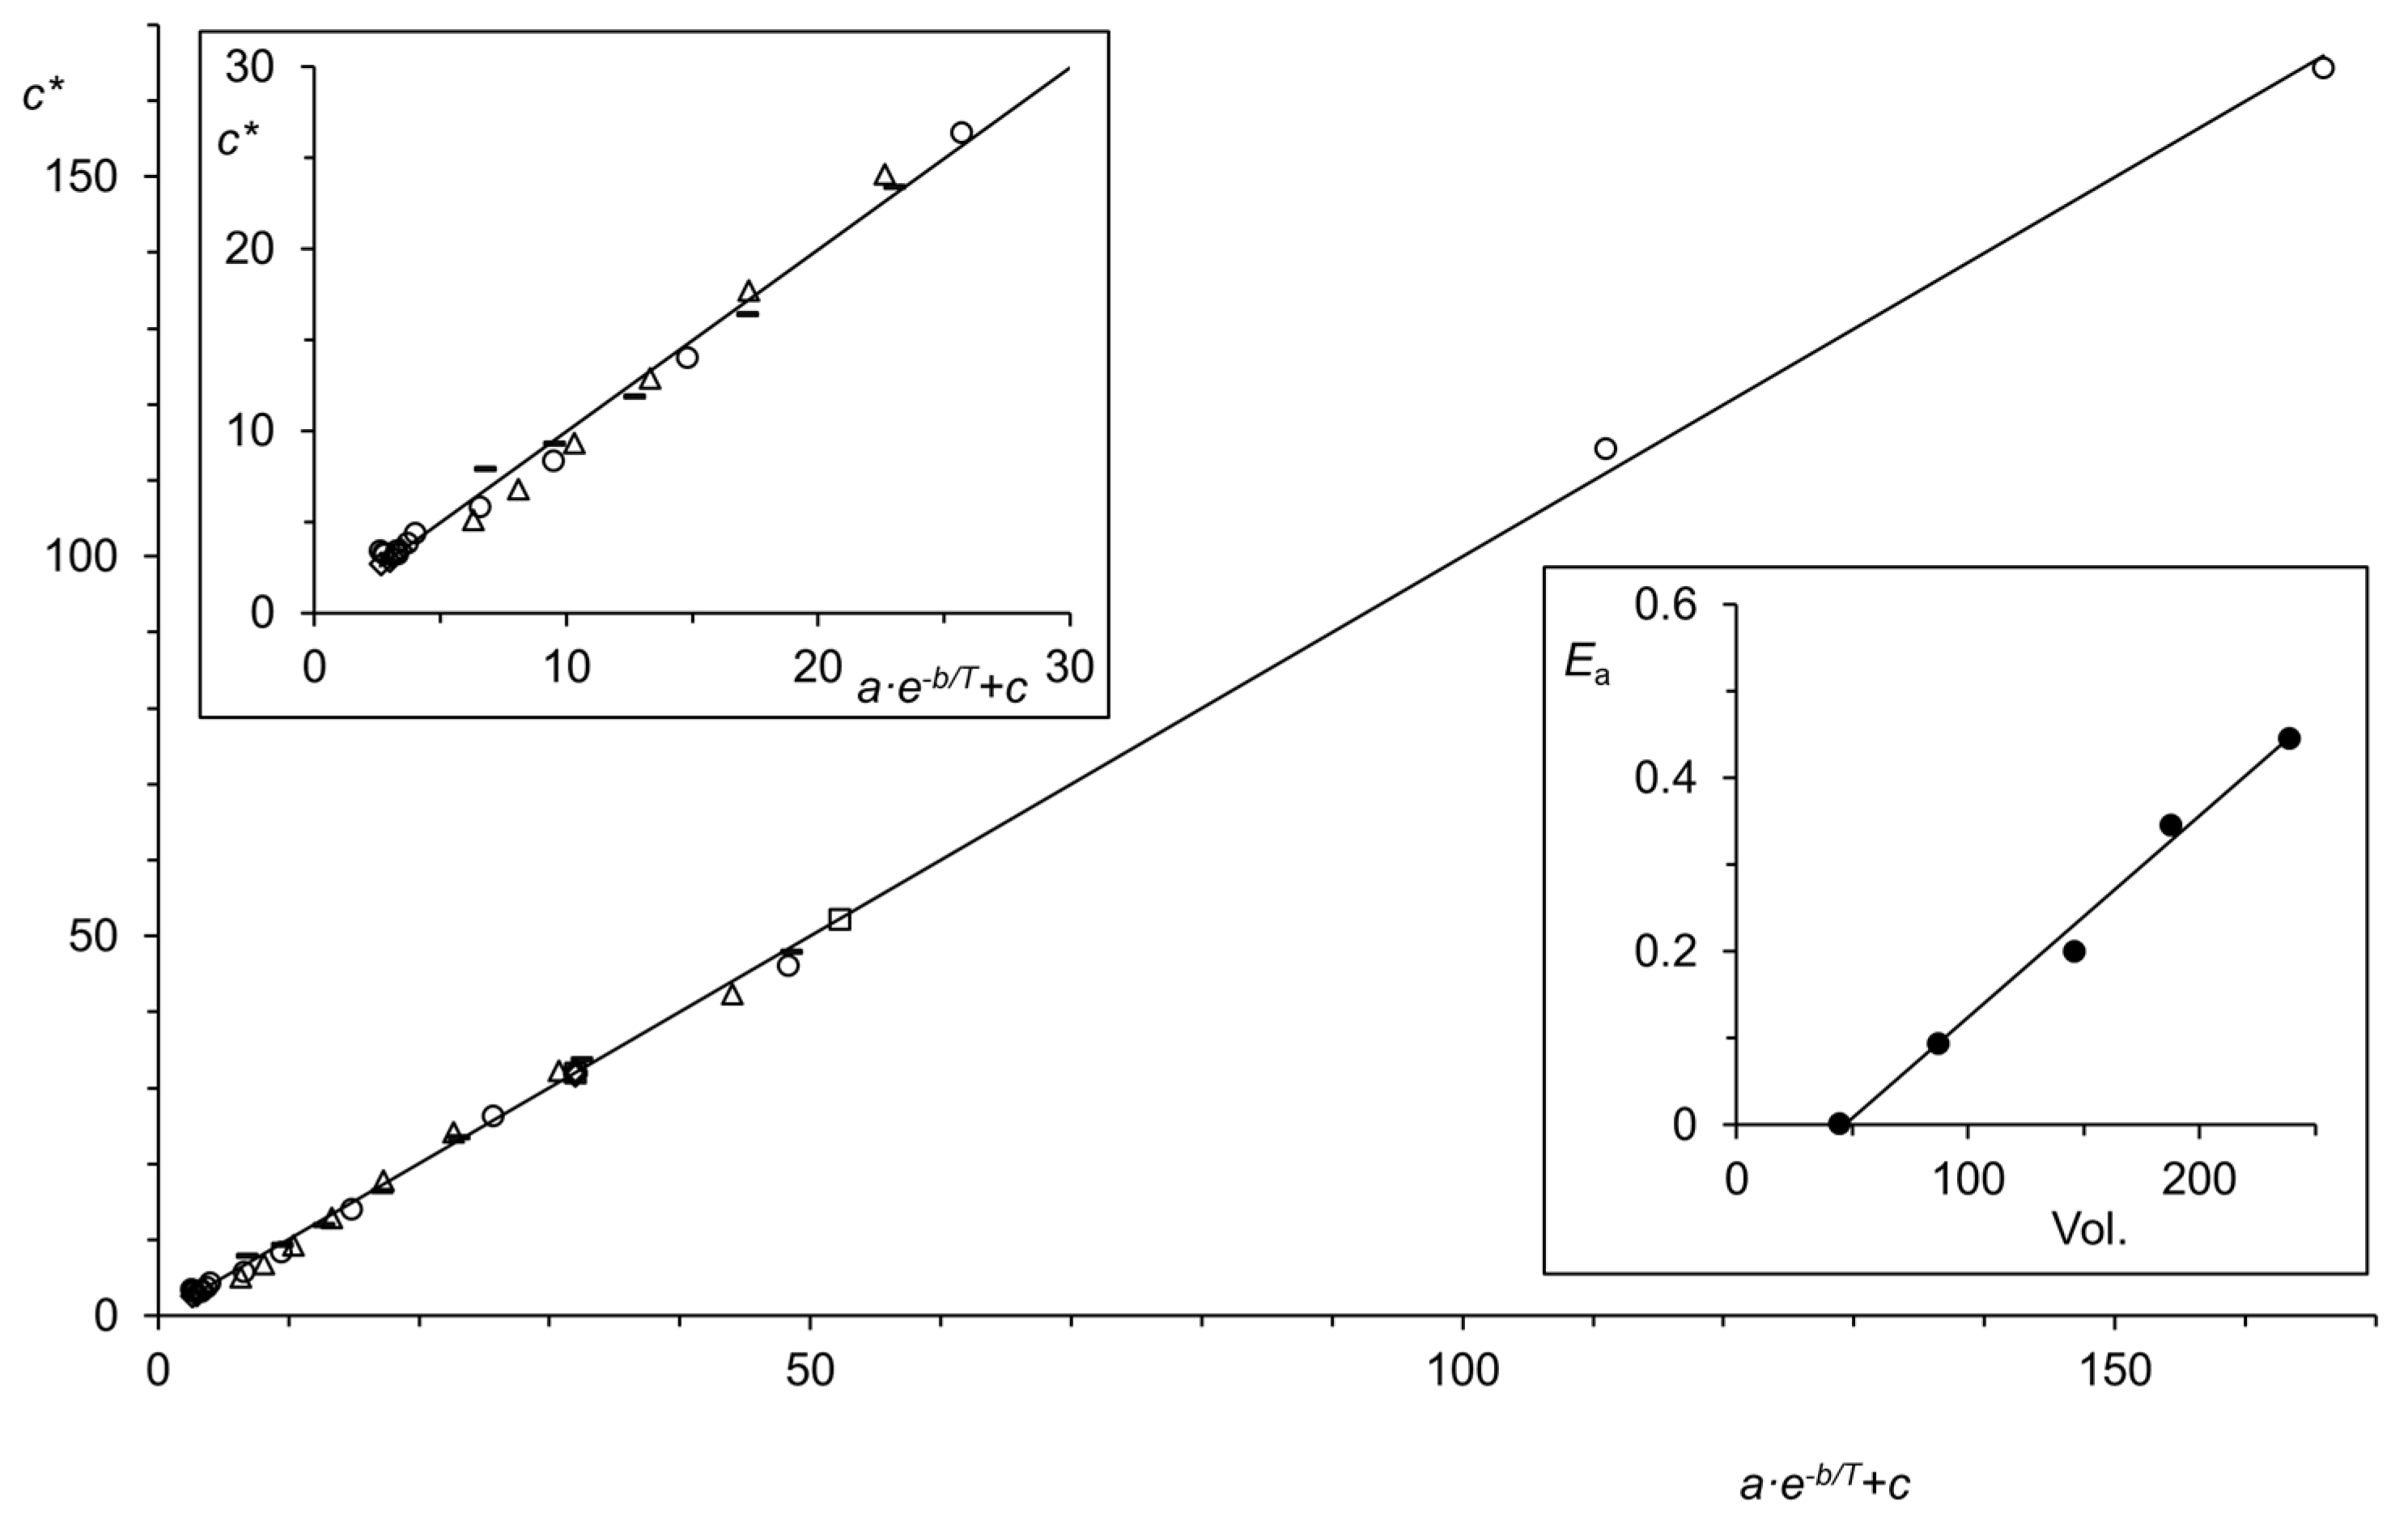
The temperature dependence of the parameter c* is completely different from the quotient E/c* as there is initially a strong increase with the temperature and finally a plateau is reached at very high temperatures. The primary increase can be described by an Arrhenius diagram, which is shown in Figure 12. Remarkably, the data for all noble gases cover the same linear correlation. Apparently, activation is involved in the atomic interactions where the activation energy (Ea) can be calculated from the Arrhenius diagram (b/R) and is 1.8 J/mol for He, 95 J/mol for Ne, 201 J/mol for Ar, 346 J/mol for Kr, and 447 J/mol for Xe. These small values of activation energy correspond approximately to the volume of the elementary cells of crystalline noble gases, as can be seen in the inset lower right in Figure 12. This could be due to the fact that the electron shell becomes softer as the diameter of the atoms increases, allowing more interactions at atomic contacts.

9. Conclusions

The concept that the pressure of gases increases with the concentration, where the increase is gradually damped by intermolecular interactions, led to a logarithmic two-parameter equation for pressure and concentration. A continuous increase in the concentration led to a critical concentration bring exceeded with a switch to a second set of the parameters for the same equation. A further continuous increase in concentration causes a second critical value and switch to an exponential dependency of the pressure on concentration. This was verified by experimental data for the noble gases He, Ne, Ar, Kr, and Xe. The behavior was interpreted in terms of three different structures of media in which (i) at low concentrations only random contacts exist, which (ii) after exceeding a critical concentration form a structure with permanent contacts, and which (iii) after exceeding a second critical concentration form densely packed particles with increasing repulsion of the electron shell. No further change could be detected (it would be of interest whether the exponential Equation (8) remains suitable for extremely high pressure). The formation of liquid phases was attributed to a limited miscibility of structure with free particles and densely packed particles. Investigation of the temperature dependence of the parameter yielded the law for ideal gases at high dilution and a verification of the Arrhenius equation for the critical concentration c* of the two-parameter equation. This was interpreted as a contribution of an activated process to the temperature dependence of parameters, whereby only small activation energies of a few to several hundred J/mol were found. The activation energies correlate linearly with the volume of the elementary cells of crystalline noble gases, indicating the importance of increasing size-dependent softening of the atoms for their interaction.
The developed equations for the state of gases and liquids can be useful for determining the concentration of gases by pressure measurements [30], whereby the high precision of the developed equations is of particular advantage.

Funding

This research received no external funding.

Data Availability Statement

No new primary data were created. All used primary data were taken from the cited literature available in numerical data. The generated secondary data are obtained by standard calculations and are obvious from the text (all necessary statistical data are also reported there).

Conflicts of Interest

The author declares no conflicts of interest.

References

  1. Eucken, A.; Wicke, E. Grundriss der Physikalischen Chemie, 10th ed.; Akademische Verlagsgesellschaft Geest & Portig: Leipzig, Germany, 1959. [Google Scholar]
  2. Woodcock, L.V. On Failures of van der Waals’ Equation at the Gas–Liquid Critical Point. Int. J. Thermophys. 2018, 39, 120. [Google Scholar] [CrossRef]
  3. Clausius, R. Über das Verhalten der Kohlensäure in Bezug auf Druck, Volumen und Temperatur. Ann. Phys. Chem. 1880, 9, 337–357. [Google Scholar] [CrossRef]
  4. Redlich, O.; Kwong, J.N.S. On the Thermodynamics of Solutions. V. An Equation of State. Fugacities of Gaseous Solutions. Chem. Rev. 1949, 44, 233–244. [Google Scholar] [CrossRef]
  5. Soave, G. Equilibrium Constants from a Modified Redlich-Kwong Equation of State. Chem. Eng. Sci. 1972, 27, 1197–1203. [Google Scholar] [CrossRef]
  6. Peng, D.-Y.; Robinson, D.B. A New Two-Constant Equation of State. Ind. Eng. Chem. Fundam. 1976, 15, 59–64. [Google Scholar] [CrossRef]
  7. Benedict, M.; Webb, G.B.; Rubin, L.C. An Empirical Equation for Thermodynamic Properties of Light Hydrocarbons and Their Mixtures: I. Methane, Ethane, Propane, and n-Butane. J. Chem. Phys. 1940, 8, 334–345. [Google Scholar] [CrossRef]
  8. Ree, F.H. Thermodynamic Functions at Liquid–Vapor Transition Range of the van der Waals, the Berthelot, and the Dieterici Equations of State. J. Chem. Phys. 1962, 36, 3373–3378. [Google Scholar] [CrossRef]
  9. Wohl, A. Untersuchungen über die Zustandsgleichung ΙII. Die Hauptzustandsgleichung und die Zustandsgleichungen der Einzelstoffe. Z. Phys. Chem. 1921, 99, 226–233. [Google Scholar] [CrossRef]
  10. Chapman, W.G.; Gubbins, K.E.; Jackson, G.; Radosz, M. Equation-of-state solution model for associating fluids. Fluid Phase Equilib. 1989, 52, 31–38. [Google Scholar] [CrossRef]
  11. Nezbeda, I. On Molecular-Based Equations of State: Perturbation Theories, Simple Models, and SAFT Modeling. Front. Phys. 2020, 8, 287. [Google Scholar] [CrossRef]
  12. Huang, S.H.; Radosz, M. Equation of State for Small, Large, Polydisperse, and Associating Molecules. Ind. Eng. Chem. Res. 1990, 29, 2284–2294. [Google Scholar] [CrossRef]
  13. Dufal, S.; Lafitte, T.; Haslam, A.J.; Galindo, A.; Clark, G.N.I.; Vega, C.; Jackson, G. The A in SAFT: Developing the contribution of association to the Helmholtz free energy within a Wertheim TPT1 treatment of generic Mie fluids. Mol. Phys. 2015, 113, 948–984. [Google Scholar] [CrossRef]
  14. Langhals, H. How the Concept of Solvent Polarity Investigated with Solvatochromic Probes Helps Studying Intermolecular Interactions. Liquids 2023, 3, 481–511. [Google Scholar] [CrossRef]
  15. Michels, A.; Levelt, J.M.; De Graaff, W. Compressibility Isotherms of Argon at Temperatures Between −25 °C and −155 °C, and at Densities up to 640 Amagat (Pressures up to 1050 Atmospheres). Physica 1958, 24, 659–671. [Google Scholar] [CrossRef]
  16. Michels, A.; Wijker, H.; Wijker, H.K. Isotherms of Argon Between 0 °C and 150° C and Pressures up to 2900 Atmospheres. Physica 1949, 15, 627–633. [Google Scholar] [CrossRef]
  17. Michels, A.; Levelt, J.M.; Wolkers, G.J. Thermodynamic Properties of Argon at Temperatures Between 0 °C and −140 °C and at Densities up to 640 Amagat (Pressures up to 1050 atm). Physica 1958, 24, 769–794. [Google Scholar] [CrossRef]
  18. McCain, W.D., Jr.; Ziegler, W.T. Critical Temperature, Critical Pressure, and Vapor Pressure of Argon. J. Chem. Eng. Data 1967, 12, 199–202. [Google Scholar] [CrossRef]
  19. Taylor, J.R. Error Analysis: The Study of Uncertainties in Physical Measurements, 2nd ed.; University Science Books: Sausalito, CA, USA, 1997; ISBN 0-935702-42-3. [Google Scholar]
  20. Beattie, J.A.; Brierley, J.S.; Barriault, R.J. The compressibility of krypton. I. An equation of State for krypton and the weight of a liter of krypton. J. Chem. Phys. 1952, 20, 1613–1615. [Google Scholar] [CrossRef]
  21. Beattie, J.A.; Brierley, J.S.; Barriault, R.J. The Compressibility of Gaseous Krypton. II. The Virial Coefficients and Potential Parameters of Krypton. J. Chem. Phys. 1952, 20, 1615–1618. [Google Scholar] [CrossRef]
  22. Beattie, J.A.; Barriault, R.J.; Brierley, J.S. The Compressibility of Gaseous Xenon. I. An Equation of State for Xenon and the Weight of a Liter of Xenon. J. Chem. Phys. 1951, 19, 1219–1221. [Google Scholar] [CrossRef]
  23. Michels, A.; Wassenaar, T.; Louwerse, P. Isotherms of Neon at Temperatures Between 0 °C and 150 °C and at Densities up to 1100 Amagat (Pressure up to 2900 Atmospheres). Physica 1960, 26, 539–543. [Google Scholar] [CrossRef]
  24. Keesom, W.H.; Kraak, H.H. The compressibility of helium gas between 2.6 °K and 4.2 °K. Physica 1935, 2, 37–44. [Google Scholar] [CrossRef]
  25. Keesom, W.H.; Walstra, W.K. Isotherms of helium at liquid helium temperatures. Physica 1940, 7, 985–991. [Google Scholar] [CrossRef]
  26. Canfield, F.B.; Leland, T.W.; Kobashy, R. Compressibility Factors for Helium-Nitrogen Mixtures. J. Chem. Eng. Data 1965, 10, 92–96. [Google Scholar] [CrossRef]
  27. Hertz, P. Über den gegenseitigen durchschnittlichen Abstand von Punkten, die mit bekannter mittlerer Dichte im Raume angeordnet sind. Math. Ann. 1909, 67, 387–398. [Google Scholar] [CrossRef]
  28. Chandrasekhar, S. Stochastic Problems in Physics and Astronomy. Rev. Mod. Phys. 1943, 15, 1–89. [Google Scholar] [CrossRef]
  29. Bondi, A. van der Waals Volumes and Radii. J. Phys. Chem. 1964, 68, 441–451. [Google Scholar] [CrossRef]
  30. Langhals, H. Determination of the Concentration of Gases by Measurement of Pressure. Anal. Lett. 1987, 20, 1595–1610. [Google Scholar] [CrossRef]
Figure 1. Linear correlation between measurements of the pressure p in atm (filled spheres) and ln (c/c* + 1) according to Equation (5): Ar at −120 °C, c < 5.4 mol·L−1; E = 40.3 atm, c* = 2.88 mol·L−1, r = 0.999 8, n = 9, standard deviation = 0.3 atm, intercept = −0.18 atm. Inset: measurements of the pressure p in atm (filled spheres) at −120 °C as the function of the molar concentration c of Ar (filled circles) and calculated pressure p in atm according to Equation (5) (solid curve).
Liquids 05 00002 g001
Figure 2. Diagram of state of Ar for concentrations c < 5.4 mol·L−1. The discontinuous measurements were taken from [15] and are shown as filled circles. The curves were calculated using Equation (5) and applying the least squares method to fit c* to the experimental data. The corresponding increasing temperatures T from bottom to top and the data of linear correlations according to Equation (5) are: T = −140 °C, E = 36.3 atm, c* = 3.25 mol/L, r = 0.999996, n = 7, σ = 0.02 atm, intercept = −0.02 atm; T = −135 °C, E = 19.5, c* = 1.67, r = 0.999996, n = 6, σ = 0.02, intercept = −0.005; T = −130 °C, E = 27.9, c* = 2.00, r = 0.9995, n = 9, σ = 0.43, intercept = −0.25; T = −125 °C, E = 33.8, c* = 4.23, r = 0.9997, n = 9, σ = 0.4, intercept = −0.2; T = −122.5 °C, E = 36.9, c* = 2.65, r = 0.9998, n = 9, σ = 0.3, intercept = −0.2; T = −120 °C, E = 40.3, c* = 2.88, r = 0.9998, n = 9, σ = 0.3, intercept = −0.2; T = −110 °C, E = 55.5, c* = 3.86, r = 0.99994, n = 9, σ = 0.2, intercept = −0.1; T = −100 °C, E = 74.1, c* = 4.98, r = 0.99998, n = 9, σ = 0.3, intercept = −0.09; T = −85 °C, E = 110.1, c* = 6.97, r = 0.999996, n = 9, σ = 0.07, intercept = −0.05; T = −70 °C, E = 158.7, c* = 9.45, r = 0.9999997, n = 9, σ = 0.02, intercept = −0.02; T = −50 °C, E = 250.7, c* = 13.7, r = 0.9999997, n = 9, σ = 0.02, intercept = 0.01; T = −25 °C, E = 439.2, c* = 21.8, r = 0.999999, n = 9, σ = 0.06, intercept = 0.04; T = 0 °C, E = 791.3, c* = 35.8, r = 0.999998, n = 9, σ = 0.08, intercept = 0.05; T = 25 °C, E = 564.9, c* = 21.8, r = 0.9998, n = 9, σ = 1.4, intercept = −0.9.
Liquids 05 00002 g002
Figure 3. Diagram of state of Kr for concentrations c < 3.5 mol·L−1. The discontinuous measurements were taken from [20,21] and shown as filled circles. Curves were calculated using Equation (5) and applying the least squares method to fit c* to the experimental data. The corresponding increasing temperatures T from bottom to top and the data of the linear correlations according to Equation (5) are: T = 0 °C, E = 154.0 atm, c* = 6.81 mol/L, r = 0.9999993, n = 7, σ = 0.001 atm, intercept = −0.01 atm; T = 25 °C, E = 232.4, c* = 9.53, r = 0.9999992, n = 7, σ = 0.04, intercept = 0.03; T = 50 °C, E = 334.7, c* = 12.7, r = 0.9999996, n = 7, σ = 0.03, intercept = 0.03; T = 75 °C, E = 487.0, c* = 17.2, r = 0.9999992, n = 7, σ = 0.04, intercept = 0.05; T = 100 °C, E = 699.0, c* = 23.0, r = 0.9999991, n = 7, σ = 0.05, intercept = 0.03; T = 125 °C, E = 1050, c* = 32.5, r = 0.9999989, n = 7, σ = 0.06, intercept = 0.04; T = 150 °C, E = 1668, c* = 48.6, r = 0.9999987, n = 7, σ = 0.07, intercept = −0.04; T = 175 °C, E = 1791, c* = 48.6, r = 0.9999895, n = 7, σ = 0.2, intercept = −0.2; T = 200 °C, E = 7302, c* = 190.2, r = 0.9999986, n = 7, σ = 0.09, intercept = 0.06; T = 225 °C, E = 7769, c* = 190, r = 0.999994, n = 7, σ = 0.2, intercept = −0.2; T = 250 °C, E = 8236, c* = 190, r = 0.99998, n = 7, σ = 0.3, intercept = −0.4; T = 275 °C, E = 8701, c* = 190, r = 0.99996, n = 7, σ = 0.5, intercept = −0.5; T = 300 °C, E = 9167, c* = 190, r = 0.99994, n = 7, σ = 0.7, intercept = −0.8.
Liquids 05 00002 g003
Figure 4. Diagram of state of Xe for concentrations c < 3.5 mol·L−1. Discontinuous measurements were taken from [22] and shown as filled circles. The curves were calculated using Equation (5) and applying the least squares method to fit c* to the experimental data. The corresponding increasing temperatures T from bottom to top and the data of linear correlations according to Equation (5) are: T = 16.65 °C, E = 41.16 atm, c* = 1.47 mol/L, r = 0.9997, n = 7, σ = 0.5 atm, intercept = −0.12 atm; T = 25 °C, E = 48.24, c* = 1.72, r = 0.9998, n = 7, σ = 0.4, intercept = −0.11; T = 50 °C, E = 74.04, c* = 2.59, r = 0.99995, n = 7, σ = 0.2, intercept = −0.09; T = 75 °C, E = 107.4, c* = 3.61, r = 0.999986, n = 7, σ = 0.2, intercept = −0.06; T = 100 °C, E = 150.9, c* = 4.83, r = 0.999998, n = 7, σ = 0.06, intercept = −0.03; T = 125 °C, E = 207.4, c* = 6.30, r = 0.99999994, n = 7, σ = 0.01, intercept = −0.004; T = 150 °C, E = 281.2, c* = 8.12, r = 0.999995, n = 7, σ = 0.04, intercept = 0.02; T = 175 °C, E = 377.0, c* = 10.3, r = 0.9999987, n = 7, σ = 0.07, intercept = 0.04; T = 200 °C, E = 511.0, c* = 13.3, r = 0.999997, n = 7, σ = 0.1, intercept = 0.06; T = 225 °C, E = 695.8, c* = 17.3, r = 0.999996, n = 7, σ = 0.1, intercept = 0.7; T = 250 °C, E = 958.6, c* = 22.7, r = 0.999996, n = 7, σ = 0.1, intercept = 0.08; T = 275 °C, E = 1358, c* = 30.7, r = 0.999996, n = 7, σ = 0.2, intercept = 0.096; T = 300 °C, E = 2038, c* = 44.0, r = 0.999996, n = 7, σ = 0.2, intercept = 0.10.
Liquids 05 00002 g004
Figure 5. Diagram of state of Ne for concentrations c < 5.5 mol·L−1. The discontinuous measurements were taken from [23] and shown as filled circles. Curves were calculated using Equation (5) and applying the least squares method to fit c* to experimental data. The corresponding increasing temperatures T from bottom to top and the data of linear correlations according to Equation (5) are: T = 70 °K, E = 183.4 atm, c* = 31.9 mol/L, r ≈ 1, n = 9, σ = 0.003 atm, intercept = 0.0002 atm; T = 80 °K, E = 342.2, c* = 52.2, r = 0.99999997, n = 9, σ = 0.002, intercept = 0.002; T = 100 °K, E = 1797, c* = 219, r = 0.99999996, n = 9, σ = 0.002, intercept = 0.001; T = 120 °K, E = 870700000, c* = 87080000, r = 0.999998, n = 9, σ = 0.02, intercept = −0.01.
Liquids 05 00002 g005
Figure 6. Linear correlation between the pressure p of helium in atm at 4.245 K and the concentration-derived Equation (5): c ≤ 1.51 mol/L: E= 1.30 atm, c* = 3.44 mol/L, r = 0.99997, r2 = 0.999943, n = 11, σ = 0.0009, intercept = −0.009; c ≤ 3.82 mol/L: r = 0.99993, r2 = 0.9999, n =17, σ = 0.003.
Liquids 05 00002 g006
Figure 7. Diagram of state for Helium at 4.245 K for concentrations c < 4 mol·L−1. The discontinuous measurements were taken from [24,25,26] and shown as filled circles. The curves were calculated using Equation (5) and applying the least squares method to fit c* to the experimental data; c ≤ 1.51 mol/L: E= 1.30 atm, c* = 3.44 mol/L, r = 0.99997, r2 = 0.999943, n = 11, σ = 0.0009, intercept = −0.009; c ≤ 3.82 mol/L: r = 0.99993, r2 = 0.9999, n =17, σ = 0.003. Inset: measurements and calculation according to Equation (5) for various temperatures. From top to bottom: T = 3.721 °K, E = 1.009 at, c* = 3.059 mol/L, r = 0.999996, n = 7, σ = 0.0005 atm, intercept = −0.0069 atm; T = 3.105 °K, E = 0.788, c* = 2.99, r = 0.99999997, n = 5, σ = 0.00006, intercept = 0.002; T = 2.610 °K, E = 0.585 atm, c* = 2.67, r = 0.999992, n = 12, σ = 0.0009, intercept = −0.0005.
Liquids 05 00002 g007
Figure 8. Diagram of state for argon at 25 °C up to pressure of more than 1500 atm; measurements are shown as filled circles, calculated values as solid curves (Equations (5) and (8), respectively). (i) Equation (5) is used for high dilution up to c ≤ 8.6 mol/L in the most left branch: E = 565 atm, c* = 21.8 mol/L, po = 0.93 atm (extrapolated to c = 0), r = 0.9998, n = 9, σ =1.4 atm; dotted curve for extrapolation to higher concentration. (ii) Equation (5) for mean concentration 8.6 mol/L ≤ c ≤ 18 mol/L: E = 9.08 · 109 atm, c* = 2.84 · 1010 mol/L, po = −79.2 atm, r = 0.993, n = 7, σ = 16 atm; dashed curve for extrapolation to higher concentration. (iii) Equation (8) is used for c ≥ 18 mol/L: po = 43.3 atm, E = 0.123 L/mol, p* = 121.4 atm, r = 0.9999998, n = 5, σ = 0.19 atm. Inset: overview with isotherms of argon at various temperatures T in °C. From top to bottom: 25, 0, −25, −50, −70, −85, −100, −110, −120, −122.5, −125, −130, −135, −140. For detailed information about the parameters of Equations (5) and (8) and statistical data see Table 1.
Liquids 05 00002 g008
Figure 9. Isotherm of argon at −120 °C. Filled circles: experimental data. Solid curves calculated by Equation (5) (region i and ii) and (8) (region iii). Dashed curve calculated by the van der Waals equation; parameters obtained by the least squares method: a = 1.08 atm, b = 0.0246 L/mol; R = 0.0820 atm·L·mol−1·K−1; σ = 3.2 atm corresponds to 5.4% deviation at 8.9 mol/L.
Liquids 05 00002 g009
Figure 10. Linear correlation between the relative volume of the elementary cell of crystalline noble gases, indicated by the relative reciprocal of the cubic lattice constant (rel. 1/a3) and the relative concentrations (rel. ck(i–ii)) of the transitions between region (i) and (ii), from left to right: filled circles for xenon, krypton, argon, and neon. Slope of the regression line 1.35, intercept 0.42, correlation number 0.998 for four points, coefficient of determination 0.996. Inset: the critical concentration ck(i-ii) in mol/L of argon at various temperatures.
Liquids 05 00002 g010
Figure 11. Temperature dependence of the quotient E/c* in region (i) for the noble gases. Diamonds for He and line of linear regression: slope 1.007, intercept −2.46, correlation number 0.99994 for seven points, number of determinations R2 = 0.999. Squares for Ne: slope 1.011, intercept −2.55, correlation number 0.99994 for four points, r2 = 0.9994. Circles for Ar above the critical point: slope 0.939, intercept −2.15, correlation number 0.99 for eight points, coefficient of determination r2 = 0.979. Crosses for Kr: slope 1.022, intercept −2.68, correlation number 0.9991 for 13 points, R2 = 0.998. Triangles for Xe: slope 0.922, intercept −2.55, correlation number 0.9994 for nine points, R2 = 0.999.
Liquids 05 00002 g011
Figure 12. Temperature dependence (T) of the parameter c* in mol/L obtained by an Arrhenius plot (a·e-b/T + c). Circles for Ar: slope 0.9853, intercept 1.34 mol/L, correlation number r = 0.9997 for 14 points, r2 = 0.9993, σ = 1.4 mol/L, a = 19,700 mol/L, b = 1674 K, c = 3.13 mol/L. Triangles Xe: slope 1.02, intercept −0.64 mol/L, correlation number 0.996 for 13 points, r2 = 0.992, σ = 1.2 mol/L, a = 25,860 mol/L, b = 3715 K, c= 2.81 mol/L. Dashes for Kr: slope 0.829, intercept 3.15 mol/L, correlation number 0.998 for seven points, r2 = 0.997, σ = 0.94 mol/L, a = 36,960 mol/L, b = 2879 K, c = 6.88 mol/L. Squares for Ne: slope 0.9853, intercept 1.34 mol/L, three points, a = 534,000 mol/L, b = 792 K, c= 25.4 mol/L. Diamonds for He: slope 0.9999, intercept 0.002 mol/L, correlation number 0.99994 for seven points, r2 = 0.99987, σ = 0.2 mol/L, a = 32.63 mol/L, b = 15.36 K, c= 2.61 mol/L. Inset upper left: extended region for small c* values. Inset lower right: activation energies Ea in kJ/mol obtained from Figure 11 versus the volume (Vol. in Å3) of the elementary cells of crystalline noble gases (as circles from bottom to top for He, Ne, Ar, Kr and Xe); line for linear correlation; slope 0.0023 kJ·mol−13, intercept −0.108 kJ/mol, correlation number 0.995 for five points, r2 = 0.990, σ = 0.002.
Liquids 05 00002 g012
Table 1. Parameters of Equation (5) (region i and ii) and Equation (8) (region iii) for argon. E, po, p* and σ in atm, c* in mol/L. Nine points for the correlation numbers r in region (i) except six for −135 °C and seven for −140 °C; seven points for the correlation numbers r in region (ii) and (iii). E and c* were divided by 10 000 000 for better visualization.
Region (i) Region (ii) Region (iii)
T in °CEc*porsEc*porsEp*pors
25564.921.8−0.9310.99976451.42907.928.4−79.20.99315.643.350.123121.40.99999980.2
0791.335.80.0550.99999800.08795.629.9−57.50.99312.929.750.131126.410.1
−25439.221.80.0370.99999870.06601.028.4−35.60.99310.318.320.142127.00.99999990.1
−50250.713.70.0120.99999970.02445.628.4−13.50.9947.59.790.156119.00.99999990.1
−70158.79.45−0.0170.99999970.02321.028.44.10.9945.35.020.172105.30.99999930.2
−85110.16.97−0.0490.99999580.07240.029.917.10.9943.72.450.19092.00.99999740.4
−10074.14.98−0.0920.99997730.14143.129.929.40.9952.10.880.21773.60.99999040.6
−11055.53.86−0.1290.99993990.2180.729.936.90.9941.20.410.23754.40.99995291.3
−12040.32.88−0.1780.99983870.3022.530.843.00.9700.80.110.27535.60.99986461.8
−122.536.92.65−0.1930.99979090.339.430.843.50.9150.90.070.28730.40.99981582.0
−12533.82.43−0.2090.99972820.36 0.040.30225.10.99973352.2
−13027.92.00−0.2460.99952540.44 0.050.296−2.10.99993510.9
−13519.51.67−0.0050.99999010.02 0.040.301−27.00.99999230.3
−14036.33.25−0.0150.99999580.02 0.030.300−57.510.0
Disclaimer/Publisher’s Note: The statements, opinions and data contained in all publications are solely those of the individual author(s) and contributor(s) and not of MDPI and/or the editor(s). MDPI and/or the editor(s) disclaim responsibility for any injury to people or property resulting from any ideas, methods, instructions or products referred to in the content.