Article

Transplantation of Fecal Flora from Patients with Atherosclerosis to Mice Can Increase Serum Low-Density Lipoprotein Cholesterol and Affect Intestinal Flora and Its Metabolites

1
School of Basic Medical Sciences, Xinjiang Second Medical College, Karamay 834000, China
2
College of Life Sciences, Shihezi University, Shihezi 832003, China
*
Authors to whom correspondence should be addressed.
These authors contributed equally to this work.
Appl. Microbiol. 2025, 5(1), 29; https://doi.org/10.3390/applmicrobiol5010029
Submission received: 26 February 2025 / Revised: 6 March 2025 / Accepted: 10 March 2025 / Published: 13 March 2025

Abstract

:
Atherosclerosis (AS) is emerging as a major global public health problem. Researchers are developing and implementing various anti-AS strategies. This study aimed to investigate gut microbiota and metabolite changes associated with elevated serum low-density lipoprotein cholesterol (LDL-c). Mice were divided into two equal groups: Group C (mice with gut microbiota from healthy subjects) and Group B (mice with gut microbiota from AS). At the end of the 8-week study, blood samples were collected for blood lipid analysis; rectal feces were collected for microbial 16S rRNA sequencing analysis and metabolomics analysis. Our results showed that the B group significantly increased serum lipid levels of LDL-c. However, no statistically significant differences were observed in the richness and diversity of the gut microbiota, but we observed an increase in the ratio of Firmicutes to Bacteroidetes and an increase in the abundance of Parabacteroides Goldstein. In addition, untargeted metabolomic analysis of fecal samples revealed 128 metabolites that were differentially expressed between groups C and B. Notably, group B was found to have significantly increased levels of metabolites involved in lipid metabolism pathways, such as estrogen glucuronide, ginsenoside f1, Pe (16:1e/14,15-epete), and prostaglandin E1. Those data highlight the importance of understanding AS from the gut microbiota perspective and establish a foundation for future research on AS.

1. Introduction

Cardiovascular disease (CVD) is the leading cause of mortality worldwide [1]. CVD encompasses a wide range of disorders that affect the heart and blood vessels, of which atherosclerosis (AS) is a major contributory factor. AS is a chronic condition characterized by developing lipid-laden atheromatous plaques in large and middle-sized arteries. Lipid-lowering therapies are the cornerstone of treatment, as dyslipidemia is a significant risk factor for AS [2]. Low-density lipoprotein (LDL-c) plaques and vascular cell dysfunction occur in patients with AS. Statins, which inhibit enzymes, have been shown to prevent AS events by lowering LDL-c and reducing inflammation and are widely prescribed for cholesterol management to prevent AS [3]. However, statins have been associated with a variety of adverse effects, including myotoxicity, myopathy, renal impairment, and hepatotoxicity. Despite significant advances in medical treatment, there is still a need for innovative therapeutic approaches to combat AS. Recent research has highlighted the gastrointestinal tract as a central organ in the CVD relationship, including AS, and the role of gut microbe-derived metabolites in the development of AS remains unclear [4,5]. Specifically, gut microbiota (GM) have emerged as potential mediators for influencing AS progression [6].
The GM is a complex organ that coexists with the host. The GM continuously produces metabolites, such as short-chain fatty acids and secondary bile acids, which confer cardiovascular benefits [7]. The vast array of microbial genes and associated functions is called the microbiome, which quantitatively dwarfs the human genome. Recent studies suggest that GM and its metabolites may play a critical role in preventing or aggravating AS and related conditions by modulating host metabolism and inflammation [8,9]. Bacterial DNA has been found in AS plaques [10,11], and symptomatic AS is associated with an altered gut metagenome in the human population. Furthermore, gut microbial biomarkers are promising therapeutic targets for patients with AS. Using metabolomics, one of the omics techniques allows the detection of variations in the fingerprint and metabolite profile of the GM, which can be instrumental in analyzing metabolic-related pathophysiological conditions [12]. Therefore, the use of metabolomics and microbiome technologies may uncover novel regulatory mechanisms that are involved in the progression of AS. Previous research has shown that GM dysbiosis and its metabolites are associated with AS-related inflammation and disease progression [13].
Recognizing the crucial role of GM balance in maintaining overall health, there has been significant interest in developing innovative therapeutic strategies to restore GM. One prominent approach is fecal microbiota transplantation (FMT), which serves as a comprehensive “whole gut microbiome replacement” strategy [14]. FMT has gained popularity in recent years due to its potential to cure various conditions with high success rates, ranging from 80% to 90% [15]. FMT has been incorporated into clinical practice guidelines for the treatment of recurrent Clostridioides difficile infection. Although there is substantial evidence supporting its therapeutic benefits and its role in enhancing our understanding of the microbiome, FMT still encounters several regulatory and safety challenges [16]. FMT, a proven technique for restoring the overall gut microbiota in patients, has been shown to increase the microbiota from a diseased donor in the gut of recipient mice [17]. Therefore, this study used liquid chromatography–mass spectrometry (LC-MS)-based metabolomics with 16S rRNA gene sequencing to investigate microbiome-related metabolic changes in AS-FMT mice. The second aim was to investigate the microbial factors responsible for disorders in LDL-c metabolism and to explore potential novel therapeutic targets for atherosclerosis, focusing on mechanisms, efficacy, and safety.

2. Materials and Methods

2.1. Preparation and Transplantation of FMT Microbiota

Fresh fecal samples were obtained from three patients with AS at Karamay People’s Hospital in May 2023, alongside three healthy volunteers serving as a control group. This study was approved by the Biology Ethics Committee of Shihezi University (Approval Number: SUACUC-08032). All participants had no history of gastrointestinal disorders and had not taken antimicrobials or other medications in the three months leading up to the study. Fecal samples were collected immediately after defecation in sterile centrifuge tubes. The samples were labeled and stored in a portable refrigerator for transport to our laboratory. The procedure for preparing the FMT microbiota was conducted as previously described [18]. In summary, 30 g of feces (10 g from each patient) was mixed with 150 mL Ringer’s solution to produce a homogeneous fecal suspension. Following microfiltration, the fecal supernatant was centrifuged at 7104 g for 3 min at room temperature. The supernatant obtained post-centrifugation was discarded. The microbiota pellet was resuspended in Ringer’s solution, followed by additional centrifugation and resuspension. In the final resuspension, an equal volume of 50% glycerol was incorporated, and aliquots were stored at −80 °C until required.

2.2. Animals

Male adult C57BL/6 mice, approximately six weeks old (±1 week; weighing 18 ± 2 g), were acquired from the Experimental Animal Center in the Huishi District of Xi’an City, China. All mice were maintained in the Animal Genetic Engineering Laboratory at Shihezi University. The C57BL/6J mice were housed in specific pathogen-free (SPF) individually ventilated cages, with a maximum of 5 mice per cage, under controlled environmental conditions of room temperature (23 ± 3 °C) and relative humidity (60 ± 10%), following a reverse light–dark cycle (12:12). They had unrestricted access to food and water. All mice were provided with a uniform (laboratory mice) diet to eliminate any potential influence of dietary variations on the gut microbiota. After a 1-week acclimatization period, the C57BL/6J mice were randomly assigned to two groups at the commencement of the experiment. The animals underwent oral gavage with fecal samples from healthy controls (n = 30) or patients with AS (n = 30). This procedure was conducted over a continuous period of 8 weeks. During the trial period, the mice were treated daily by oral gavage to enhance the donor microbiota phenotype. After 8 weeks, the mice were euthanized, and samples of feces and serum were collected. This study was approved by Xinjiang Medical University (Approval Number: IACUC-20240515-164).

2.3. Blood Lipid Analysis

At the end of the 8-week study, blood samples were collected and stored in a refrigerator at 4 °C for 8 h. Subsequently, the samples were centrifuged at 7104 g for 15 min. The serum levels of total cholesterol (TC), triglycerides (TG), low-density lipoprotein cholesterol (LDL-c), and high-density lipoprotein cholesterol (HDL-C) in the mice were quantified using an automatic biochemical analyzer (Roche Cabas 8000 C702, Basel, Switzerland), following the manufacturer’s protocol for the assay kits.

2.4. DNA Extraction and 16S rRNA Gene Sequencing

We employed the CTAB method to isolate microbial DNA from fecal specimens. The procedure was conducted as previously outlined with minor adjustments [19]. In summary, 0.8 mL of CTAB buffer, 16 mL of lysozyme, and 100 mg of fecal matter were thoroughly mixed in an EP tube and incubated for 3 h. Following incubation, 900 mL of supernatant and 900 mL of a phenol-chloroform-isoamyl alcohol (25:24:1) solution were collected, mixed uniformly in an EP tube, and centrifuged at 13,400 g for 10 min. The supernatant was then collected and combined with an equal volume of isoamyl chloroform (24:1) in an EP tube, followed by another centrifugation at 13,400 g for 10 min. The supernatant was collected again, and 3/4 volume of isopropyl alcohol was added before centrifugation at 13,400 g for 10 min. The DNA was reconstituted in 0.3 mL of sterile water, and RNase A was utilized to eliminate RNA. The purity of the DNA samples was assessed via agarose gel electrophoresis (1%), and the concentration was adjusted to 1 ng/µL using sterile water. Using the extracted DNA as a template, the V4 region was amplified through PCR with PrimeStar HS DNA Polymerase, consistent with 16S full-length protocols, and the PCR products were analyzed using 2% agarose gel electrophoresis. Target bands were extracted using a gel recovery kit (Qiagen, Hilden, Germany). Sequencing libraries were constructed utilizing the NEBNext UltraTM II DNA Library Prep Kit (Illumina, San Diego, CA, USA) based on the manufacturer’s guidelines, and index codes were incorporated. Once the libraries were validated, sequencing was performed using the NovaSeq6000 platform. Subsequently, fastp software (version: 0.23.1) was employed to control the quality of the raw tags to yield high-quality clean tags with default parameters. To derive the final amplicon sequence variants (ASVs), the effective tags were processed using the DADA2 module within the QIIME2 software (202202) to minimize noise and filter out fragments shorter than 5. The classification sklearn module in QIIME2 was utilized to annotate species information. The alpha diversity index was computed using QIIME2 software to evaluate microbial diversity within the samples. UniFrac distances were calculated using QIIME2, and PCoA plots were generated using R software (version: 4.0.3) to compare microbial diversity across different samples.

2.5. UHPLC QE MS-Based Untargeted Metabolomics Analysis

Untargeted metabolomics analyses were conducted on fecal samples utilizing liquid chromatography–tandem mass spectrometry (LC-MS/MS). After the sample was thawed slowly at 4 °C, 80 mg of the sample was added to 1 mL of pre-cooled methanol/carbonitrile/water solution (2:2:1, v/v), vortexed and mixed, sonicated at low temperature for 30 min, left at −20 °C for 10 min, and left at 14,000 g at 4 °C for 20 min. The supernatant was vacuum-dried, then dissolved in 100 μL of carbonitrile–water solution (carbonitrile–water = 1:1, v/v) for mass spectrometry. After 14,000 g was centrifuged for 15 min at 4 °C, the supernatant was taken into the sample for analysis.
The raw data were converted into mzXML format using ProteoWizard (3.0.9134), followed by peak alignment executed through XCMS software (3.5.1). This process included retention time correction and extraction of peak areas. The data extracted via XCMS underwent metabolite structure identification and data preprocessing, which involved null filtering (removing ion peaks with >50% missing values), KNN imputation for null fill, and data filtering to eliminate features with RSD > 50%. Subsequently, the quality of the experimental data was evaluated, and the data were analyzed.

2.6. Statistical Analysis

All data are presented as mean ± standard error of the mean (SEM). Statistical analyses were performed using SPSS 19.0 (SPSS, Inc., Armonk, New York, NY, USA). Differences between groups were assessed using analysis of t-test, with p < 0.05 deemed statistically significant.

3. Results

3.1. The Serum Lipid Profiles Were Analyzed Between the Two Groups

As illustrated in Figure 1, the serum LDL-c levels in the dyslipidemia group were significantly elevated compared to the healthy control group (Figure 1d, p < 0.05). However, the two groups had no notable differences in triglycerides, total cholesterol, and high-density lipoprotein cholesterol levels.

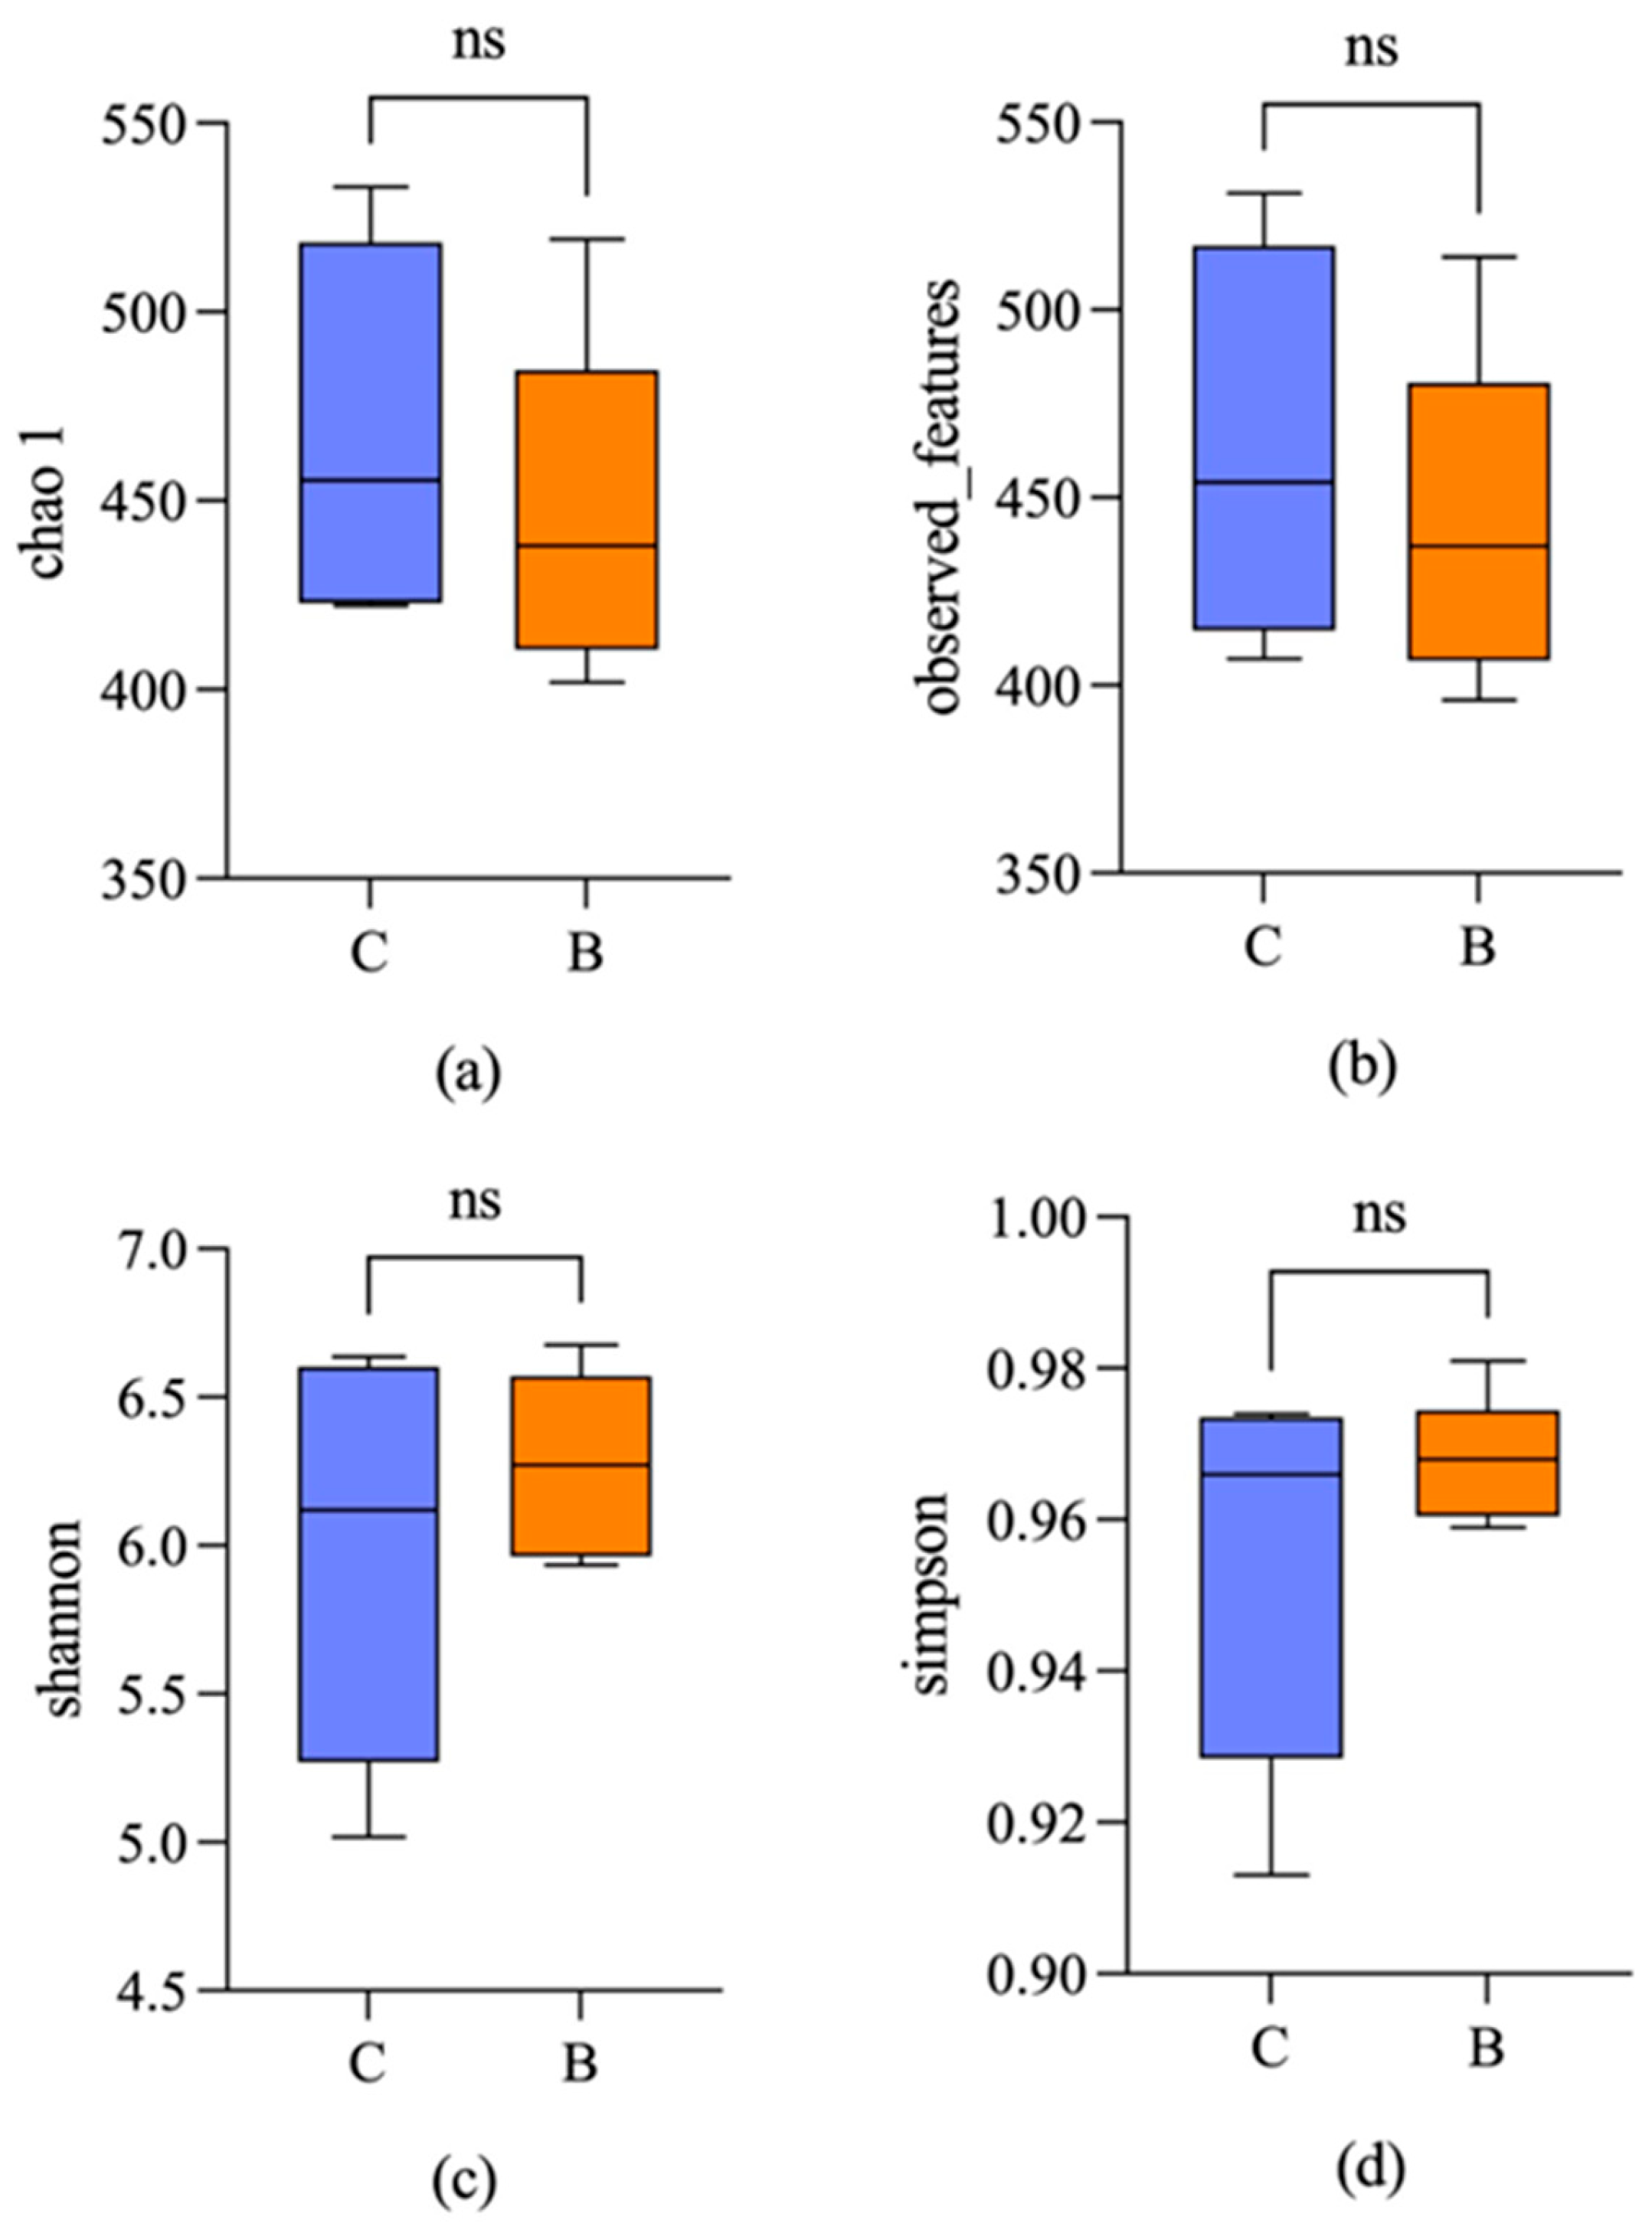
3.2. Microbial Diversity

To evaluate and contrast the composition of GM between FMT mice derived from healthy donors and those from patients with AS, the alpha diversity index was employed to assess the diversity differences between the groups. The Chao1 and ACE indices were utilized to estimate the actual species count within the samples, with elevated Chao1 and ACE values signifying a more significant number of species and enhanced richness within the community. The Shannon index reflects species richness and the evenness of species distribution within a sample; thus, a higher species diversity correlates with a more uniform species distribution and an increased index value. The Simpson index represents the likelihood that two randomly selected individuals belong to different species, with a higher index value indicating greater species diversity within the sample. The findings suggested that the species diversity of intestinal microbiota in both groups was comparable, with no statistically significant differences observed across the indices (p > 0.05) (Figure 2).
Beta diversity was assessed using the Bray–Curtis distance algorithm through NMDS analysis, comparing microbial community structures across various groups. This statistical method calculated the distances between sample pairs, resulting in a distance matrix that reflects the differences in microbial community composition among the samples. The NMDS representation, based on species abundance data from the samples, is depicted as points within a multidimensional space. The results indicate that in the PCoA, the first principal component explained 17.42% of the variance observed in the samples, while the second principal component accounted for 16.63% of the variation. Additionally, NMDS analysis showed no significant differences between the samples from the two groups (Figure 3).

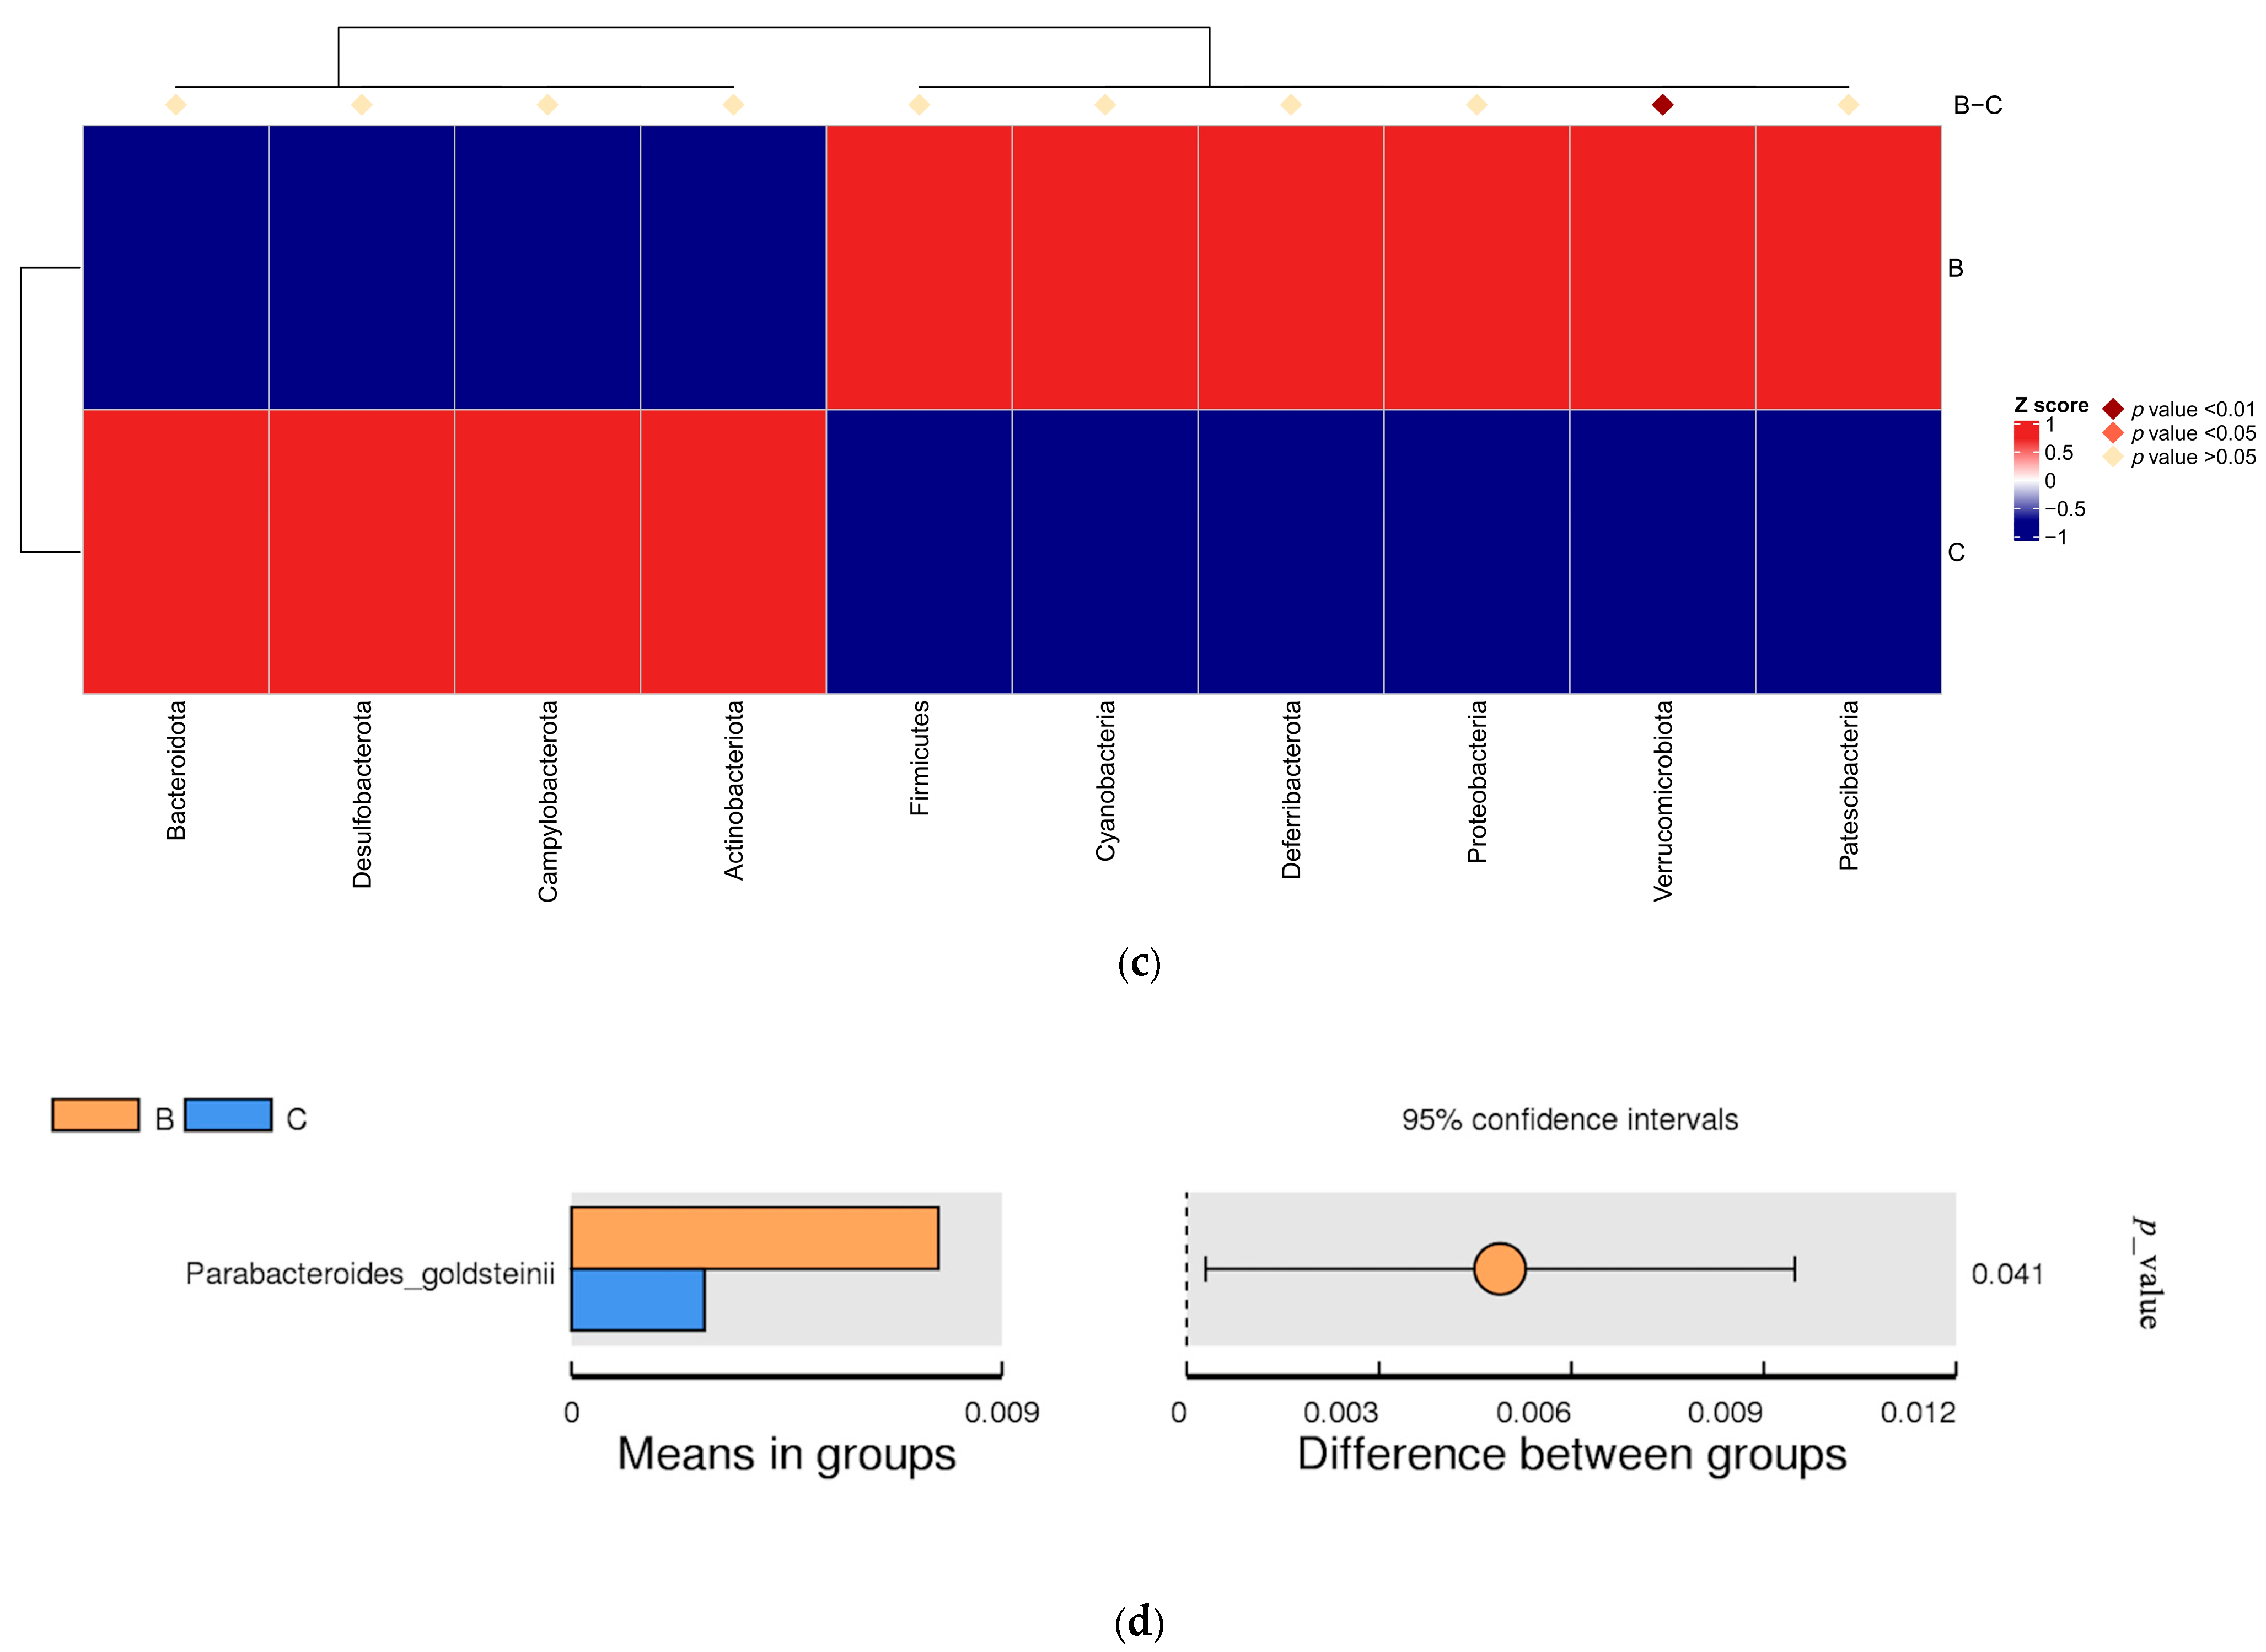
3.3. Differences in Intestinal Microbial Community Structure

For our histogram analysis, we identified the ten most abundant taxa at both the phylum and class levels. The dominant bacterial phyla detected in both groups B and C were Firmicutes, followed by Bacteroidota, Campylobacterota, Patescibacteria, Desulfobacterota, Actinobacteriota, Deferribacterota, Cyanobacteria, Proteobacteria, and Verrucomicrobiota (see Figure 4a). The species that were most frequently identified included Helicobacter ganmani, Lactobacillus intestinalis, Bacteroides sartorii, Clostridiales bacterium CIEAF 020, Parabacteroides goldsteinii, Bacteroides caecimuris, Lachnospiraceae bacterium COE1, Lachnospiraceae bacterium 28-4, and Mucispirillum schaedleri (see Figure 4b).
We employed relative abundance datasets of species classified at the phylum and species levels to calculate P values using the Wilcoxon rank sum test to pinpoint species that exhibited significant differences across groups. At the phylum level, we observed significant variations in relative abundance for Verrucomicrobiota between the groups (p < 0.01, see Figure 4c). At the species level, significant differences in relative abundance were noted for Parabacteroides goldsteinii between the groups (p < 0.05; see Figure 4d).

3.4. Annotation and Analysis of KEGG Functional Database

We annotated the KEGG database, revealing that the primary predicted functions of the KEGG pathways were primarily linked to metabolism, genetic information processing, environmental information processing, cellular processes, unclassified functions, human diseases, and organismal systems. To investigate the metabolic functions that exhibited significant differences between the groups, we analyzed the reaction networks related to biological metabolic pathways within the K layer of the pathway. We utilized the Metastats method to evaluate the hypothesis concerning the functional abundance of the metabolic pathways across the groups and to calculate the P value. The results demonstrate that two sets of six distinct metabolic pathways displayed significant differences (p < 0.05, Figure 5a). Precisely, the pathways k01476, k02461, k03264, k05922, k11934, and k13693 correspond to the arginase pathway, general secretion pathway protein L, translation initiation factor 6 pathway, quinone-reactive Ni/Fe-hydrogenase significant subunit pathway, outer membrane protein X, and glucosyl-3-phosphoglycerate synthase pathway (Figure 5b).

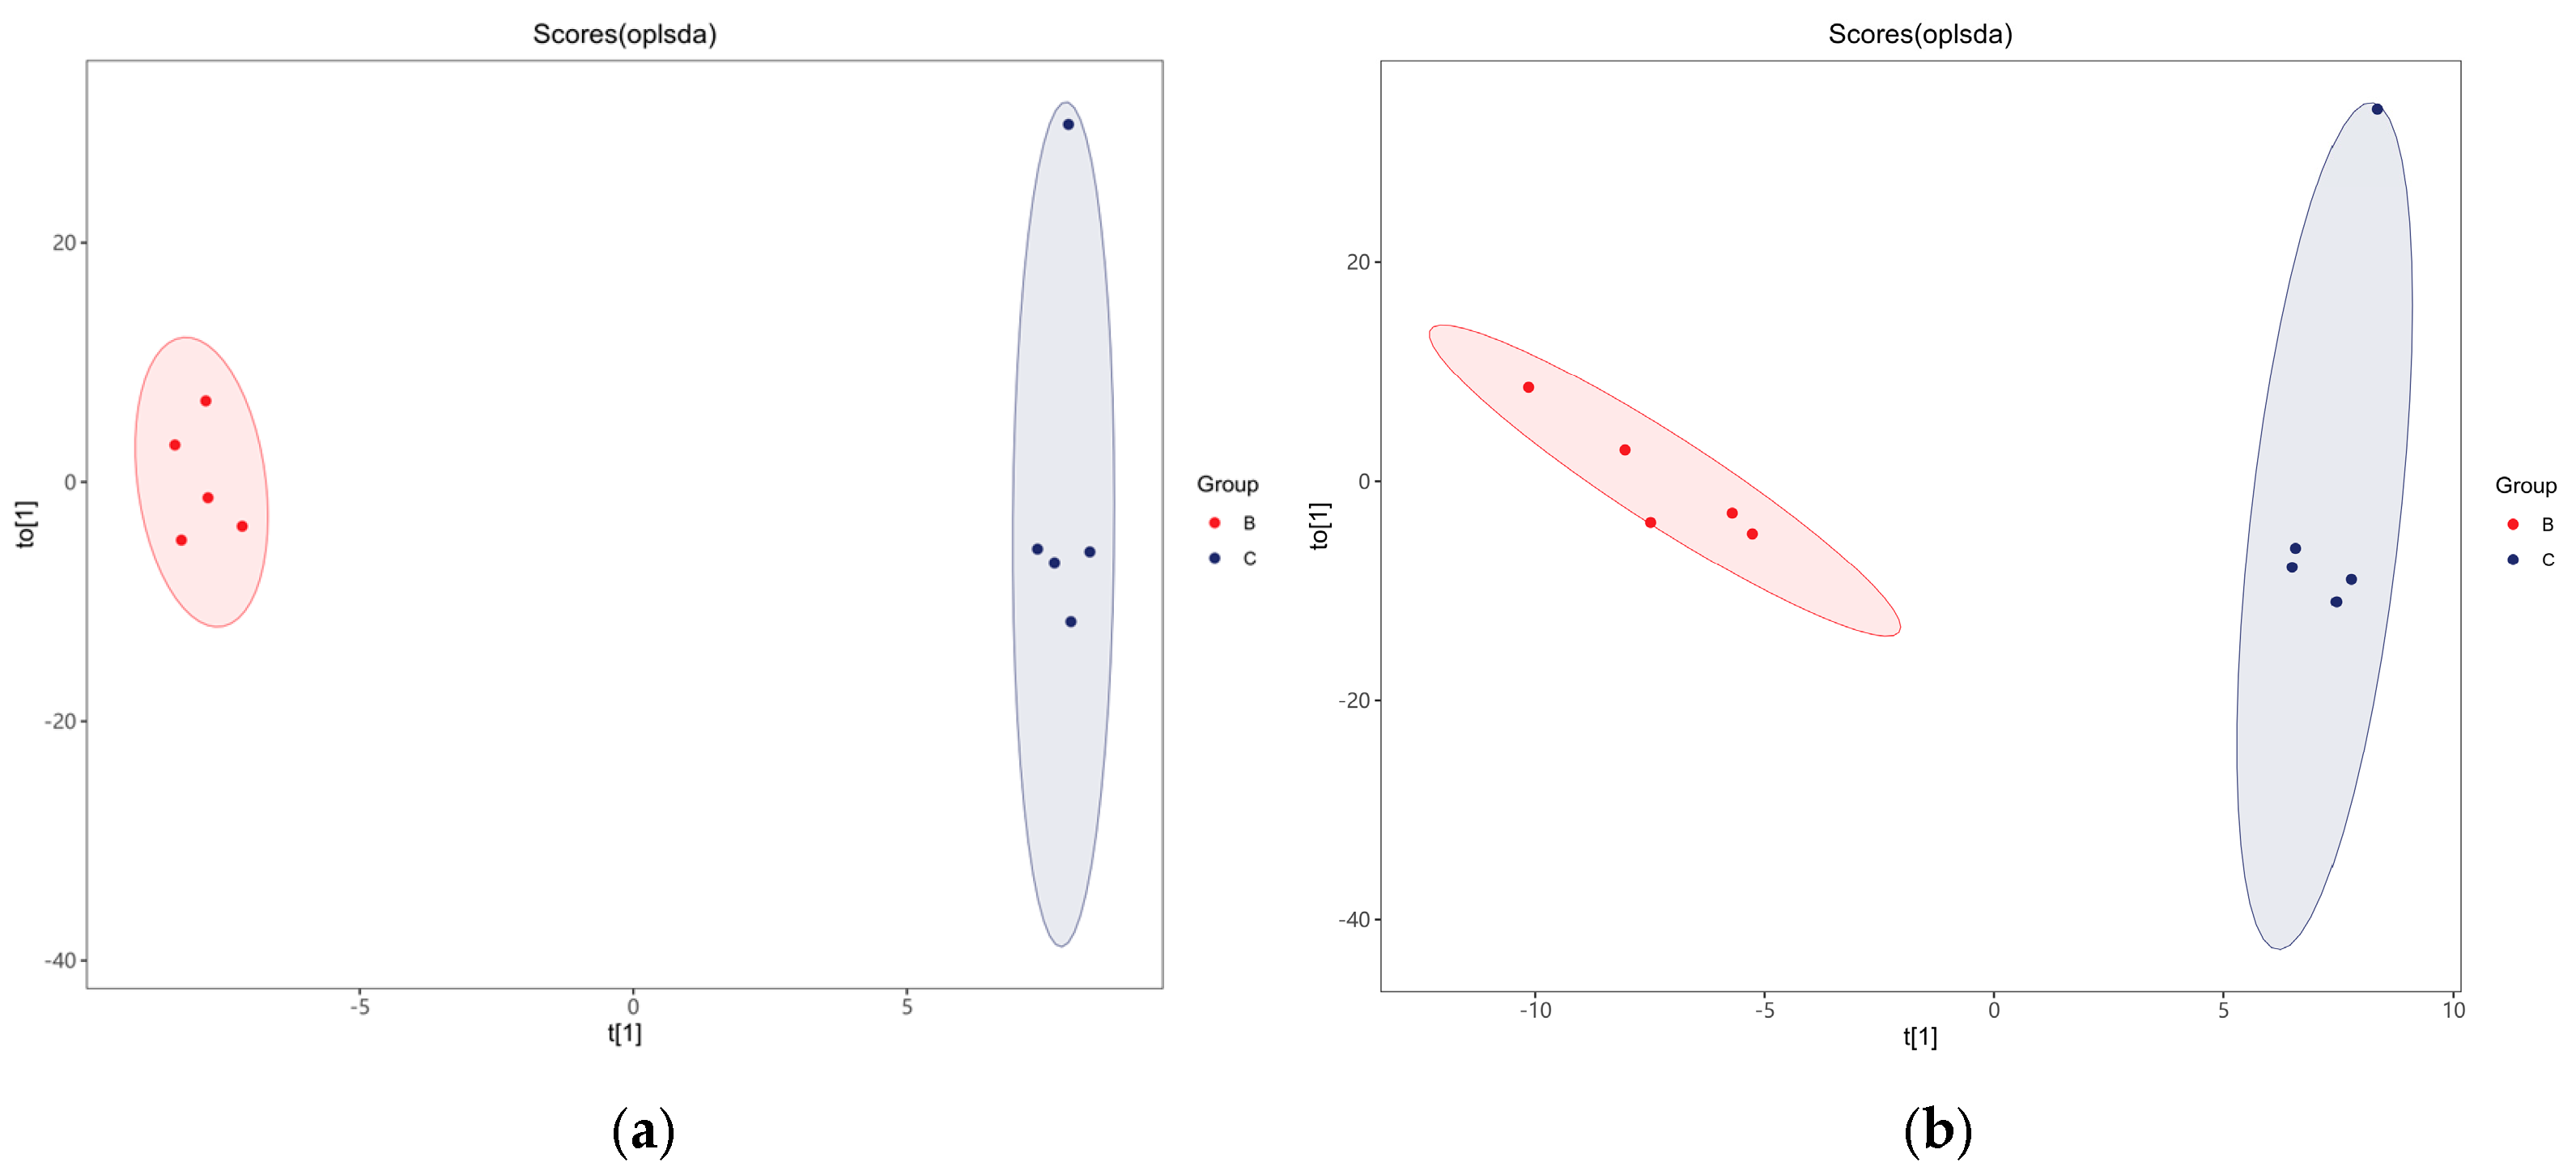
3.5. Multivariate Statistical Analysis of Fecal Metabolites

The OPLS-DA model was employed to discern the metabolites present in the two groups of mice under both positive and negative mass spectrometry ionization modes. The findings revealed a distinct disparity between the two groups (Figure 6a,b). In total, 2231 metabolites were identified, with 1539 and 692 metabolites detected in the positive and negative ion modes, respectively. We identified 27 differential metabolites, 16 in the positive and 11 in the negative ion modes, between the two groups (Figure 6c,d).

4. Discussion

LDL-c is a key driver of AS risk. So, LDL-c has been the most widely used clinical lipid measure for the prevention of AS. One of the objectives of this research is to examine the alterations in serum lipid profiles of mice following transplants from patients with AS. Hyperlipidemia is recognized as a significant risk factor for the development of AS [20]. Previous studies have reported decreased serum HDL-c and increased LDL-c in rats fed a high-fat diet [21]. Elevated HDL-c levels reduce the risk of cardiovascular disease by inhibiting the formation of atherosclerotic plaques. In contrast, elevated LDL-c levels are associated with significant complications of AS, including cerebrovascular disease, coronary heart disease, and peripheral vascular disease [22]. Our results show a significant increase in serum LDL-c levels in mice after transplantation with AS feces. This is consistent with findings from prior studies; increased LDL-c is a major risk factor for atherosclerotic cardiovascular disease. Serum lipid lowering facilitates AS initiation and progression [23]. However, no significant changes in TC, TG, or HDL-c were observed. This is likely due to the small sample size of this experiment. To obtain more robust results, future research should consider larger sample sizes.
Growing evidence suggests that changes in the GM are associated with various disease states, including CVD. It has been documented that a decrease in the diversity and abundance of GM species is related to an increase in the risk of the development of CVD [24]. In addition, the altered composition of the bacterial communities of different specific microbial species at different taxonomic levels was strongly correlated with the CVDs [25]. A cross-sectional study conducted in Salamanca found no differences in the overall GM composition between the two groups when evaluating the alpha and beta diversity [26]. Our results also showed no significant differences in GM diversity and richness.
Firmicutes and Bacteroidetes are the two dominant species within the human GM. Firmicutes exacerbate metabolic endotoxins and inflammation, increasing obesity and CVD risk, whereas Bacteroidetes have opposite effects [27]. Using 16S rRNA analysis, we observed increased abundance of the phylum Verrucomicrobiota and the species Parabacteroides goldsteini in mice that received fecal transplants from patients with AS. Our results are consistent with the notion that the differential microbial flora has significant potential to guide healthcare professionals towards more judicious use of medications, ultimately facilitating the precise management of blood lipid levels.
Metabolomics has become a standard approach for identifying biomarkers, assessing system-wide effects of metabolites, and detecting subtle changes in biological pathways that can shed light on the mechanisms behind various diseases. There is growing evidence of a strong association between GM metabolites and CVD. A high-fat diet alters the GM composition, function, and metabolite profiles and leads to elevated uric acid and adenine [28]. In our study, we used PLS-DA and OPLS-DA analyses. Among these metabolites, we found significant differences in fecal metabolic phenotypes between mice receiving fecal transplants from patients with AS and healthy donors.
One study investigated the protective effects of ginsenoside F1 (GF1) on AS and the potential molecular mechanisms of ox-LDL-induced endothelial injury [29]. GF1 was enriched in fecal transplants from patients with AS in this experiment. Some reports suggest that porphyrin and chlorophyll metabolism, photosynthesis, and the bacterial secretion system are associated with reduced AS [30]. We did not observe this change, possibly due to the various sources used for sampling.
Research has shown that supplementation with conjugated linoleic acid (CLA) can reduce the size of atherosclerotic lesions in the aorta [31]. However, some studies suggest that CLA supplementation has minimal impact on AS [32]. Studies indicate that dietary gamma-linolenic acid can suppress diet-induced AS in mice of apolipoprotein E (apoE) genetic knockout [33]. We found that levels of linoleic acid and gamma-linolenic acid decreased in mice after they received fecal transplants from AS donors. There is still no consensus on the effects of CLA on AS, and further research is needed to understand how linoleic acid influences this condition. In a rabbit model, researchers discovered that a high dose of prostaglandin E1 (PGE1) can enhance the stability of AS plaques [34]. The current study found that PGE1 levels increased after the transplantation of AS feces, indicating that the role of PGE1 may vary across different animal models.

5. Conclusions

LDL-c has a certain value in AS. In this study, we investigated the effects and potential mechanisms of changes in serum lipids, GM composition, fecal metabolites, and KEGG enrichment pathways following treatment with fecal transplantation from patients with AS. This study offers valuable insights into the structure and function of the GM in AS. Our findings suggest that FMT from patients with AS can elevate levels of LDL-c in mice, which warrants further investigation. The major limitation of this study is the small sample size for AS. Further investigation will try to identify which bacterial genus may be the primary contributor to AS.

Author Contributions

Conceptualization, L.F. and S.W.; methodology, L.F., J.F., and S.W.; software, L.F. and L.H.; validation, L.F. and S.W.; formal analysis, L.F. and J.F.; investigation, L.F., J.F., F.C., and X.F.; resources, L.F. and S.W.; data curation, L.F.; writing—original draft preparation, L.F. and J.F.; writing—review and editing, S.W.; visualization, L.F.; supervision, S.W.; project administration, L.F.; funding acquisition, L.F. All authors have read and agreed to the published version of the manuscript.

Funding

This research was funded by the projects of Xinjiang Second Medical College (grant number MS202302); the projects of Shihezi University (grant number ZZZC202023A); and the State Key Laboratory of Pathogenesis, Prevention, and Treatment of High Incidence Diseases in Central Asia (KF202404).

Institutional Review Board Statement

All experimental protocols were carried out in accordance with the requirements of the applicable national legislation and were approved by the Biology Ethics Committee of Shihezi University (approve code SUACUC-08032, Date 3 August 2022) and Xinjiang Medical University (approve code IACUC-20240514-164, Date 14 May 2024).

Informed Consent Statement

Informed consent was obtained from all subjects involved in the study.

Data Availability Statement

All the data are also available from the corresponding author on reasonable request.

Acknowledgments

Thanks to all the contributors to this work.

Conflicts of Interest

The authors declare no conflicts of interest.

References

  1. Tessler, J.; Bordoni, B. Cardiac Rehabilitation. In StatPearls; StatPearls Publishing: Tampa, FL, USA, 2023. [Google Scholar]
  2. Rus, M.; Ardelean, A.I.; Crisan, S.; Marian, P.; Pobirci, O.L.; Huplea, V.; Judea, P.C.; Osiceanu, G.A.; Stanis, C.E.; Andronie-Cioara, F.L. Optimizing Atrial Fibrillation Care: Comparative Assessment of Anticoagulant Therapies and Risk Factors. Clin. Pract. 2024, 14, 344–360. [Google Scholar] [CrossRef]
  3. Koushki, K.; Shahbaz, S.K.; Mashayekhi, K.; Sadeghi, M.; Zayeri, Z.D.; Taba, M.Y.; Banach, M.; Al-Rasadi, K.; Johnston, T.P.; Sahebkar, A. Anti-inflammatory Action of Statins in Cardiovascular Disease: The Role of Inflammasome and Toll-Like Receptor Pathways. Clin. Rev. Allergy Immunol. 2021, 60, 175–199. [Google Scholar] [CrossRef] [PubMed]
  4. Cainzos-Achirica, M.; Glassner, K.; Zawahir, H.S.; Dey, A.K.; Agrawal, T.; Quigley, E.M.; Abraham, B.P.; Acquah, I.; Yahya, T.; Mehta, N.N.; et al. Inflammatory Bowel Disease and Atherosclerotic Cardiovascular Disease: JACC Review Topic of the Week. J. Am. Coll. Cardiol. 2020, 76, 2895–2905. [Google Scholar] [CrossRef] [PubMed]
  5. Mirzaei, S.; DeVon, H.A.; Cantor, R.M.; Cupido, A.J.; Pan, C.; Ha, S.M.; Fernandes Silva, L.; Hilser, J.R.; Hartiala, J.; Allayee, H.; et al. Relationships and Mendelian Randomization of Gut Microbe-Derived Metabolites with Metabolic Syndrome Traits in the METSIM Cohort. Metabolites 2024, 14, 174. [Google Scholar] [CrossRef]
  6. Masse, K.E.; Lu, V.B. Short-chain fatty acids, secondary bile acids and indoles: Gut microbial metabolites with effects on enteroendocrine cell function and their potential as therapies for metabolic disease. Front. Endocrinol. 2023, 14, 1169624. [Google Scholar] [CrossRef]
  7. Yang, Z.; Wang, Q.; Liu, Y.; Wang, L.; Ge, Z.; Li, Z.; Feng, S.; Wu, C. Gut microbiota and hypertension: Association, mechanisms, and treatment. Clin. Exp. Hypertens. 2023, 45, 2195135. [Google Scholar] [CrossRef]
  8. Tilg, H.; Zmora, N.; Adolph, T.E.; Elinav, E. The intestinal microbiota fuelling metabolic inflammation. Nat. Rev. Immunol. 2020, 20, 40–54. [Google Scholar] [CrossRef]
  9. Zhang, Z.; Lv, T.; Wang, X.; Wu, M.; Zhang, R.; Yang, X.; Fu, Y.; Liu, Z. Role of the microbiota-gut-heart axis between bile acids and cardiovascular disease. Biomed. Pharmacother. 2024, 174, 116567. [Google Scholar] [CrossRef]
  10. Jie, Z.; Xia, H.; Zhong, S.L.; Feng, Q.; Li, S.; Liang, S.; Zhong, H.; Liu, Z.; Gao, Y.; Zhao, H.; et al. The gut microbiome in atherosclerotic cardiovascular disease. Nat. Commun. 2017, 8, 845. [Google Scholar] [CrossRef]
  11. Luo, P.; Yin, P.; Hua, R.; Tan, Y.; Li, Z.; Qiu, G.; Yin, Z.; Xie, X.; Wang, X.; Chen, W.; et al. A Large-scale, multicenter serum metabolite biomarker identification study for the early detection of hepatocellular carcinoma. Hepatology 2018, 67, 662–675. [Google Scholar] [CrossRef]
  12. Nesci, A.; Carnuccio, C.; Ruggieri, V.; D’Alessandro, A.; Di Giorgio, A.; Santoro, L.; Gasbarrini, A.; Santoliquido, A.; Ponziani, F.R. Gut Microbiota and Cardiovascular Disease: Evidence on the Metabolic and Inflammatory Background of a Complex Relationship. Int. J. Mol. Sci. 2023, 24, 9087. [Google Scholar] [CrossRef] [PubMed]
  13. Karlsson, F.H.; Fak, F.; Nookaew, I.; Tremaroli, V.; Fagerberg, B.; Petranovic, D.; Bäckhed, F.; Nielsen, J. Symptomatic atherosclerosis is associated with an altered gut metagenome. Nat. Commun. 2012, 3, 1245. [Google Scholar] [CrossRef]
  14. Lee, J.Y.; Kim, Y.; Kim, J.; Kim, J.K. Fecal Microbiota Transplantation: Indications, Methods, and Challenges. J. Microbiol. 2024, 62, 1057–1074. [Google Scholar] [CrossRef] [PubMed]
  15. Oliva-Hemker, M.; Kahn, S.A.; Steinbach, W.J.; Section on Gastroenteroloy, Hepatology, and Nutrition; Committee on Infectious Diseases. Fecal Microbiota Transplantation: Information for the Pediatrician. Pediatrics 2023, 152, e2023062922. [Google Scholar] [CrossRef]
  16. Karimi, M.; Shirsalimi, N.; Hashempour, Z.; Salehi Omran, H.; Sedighi, E.; Beigi, F.; Mortezazadeh, M. Safety and efficacy of fecal microbiota transplantation (FMT) as a modern adjuvant therapy in various diseases and disorders: A comprehensive literature review. Front. Immunol. 2024, 15, 1439176. [Google Scholar] [CrossRef]
  17. Yadegar, A.; Bar-Yoseph, H.; Monaghan, T.M.; Pakpour, S.; Severino, A.; Kuijper, E.J.; Smits, W.K.; Terveer, E.M.; Neupane, S.; Nabavi-Rad, A.; et al. Fecal microbiota transplantation: Current challenges and future landscapes. Clin. Microbiol. Rev. 2024, 37, e0006022. [Google Scholar] [CrossRef]
  18. Zhang, T.; Lu, G.; Zhao, Z.; Liu, Y.; Shen, Q.; Li, P.; Chen, Y.; Yin, H.; Wang, H.; Marcella, C.; et al. Washed microbiota transplantation vs. manual fecal microbiota transplantation: Clinical findings, animal studies and in vitro screening. Protein Cell 2020, 11, 251–266. [Google Scholar] [CrossRef]
  19. Tang, J.N.; Zeng, Z.G.; Wang, H.N.; Yang, T.; Zhang, P.J.; Li, Y.L.; Zhang, A.Y.; Fan, W.Q.; Zhang, Y.; Yang, X.; et al. An effective method for isolation of DNA from pig faeces and comparison of five different methods. J. Microbiol. Methods 2008, 75, 432–436. [Google Scholar] [CrossRef]
  20. Beverly, J.K.; Budoff, M.J. Atherosclerosis: Pathophysiology of insulin resistance, hyperglycemia, hyperlipidemia, and inflammation. J. Diabetes 2020, 12, 102–104. [Google Scholar] [CrossRef]
  21. Gobalakrishnan, S.; Asirvatham, S.S.; Janarthanam, V. Effect of Silybin on Lipid Profile in Hypercholesterolaemic Rats. J. Clin. Diagn. Res. 2016, 10, FF01–FF05. [Google Scholar] [CrossRef]
  22. Khatana, C.; Saini, N.K.; Chakrabarti, S.; Saini, V.; Sharma, A.; Saini, R.V.; Saini, A.K. Mechanistic Insights into the Oxidized Low-Density Lipoprotein-Induced Atherosclerosis. Oxidative Med. Cell. Longev. 2020, 2020, 5245308. [Google Scholar] [CrossRef] [PubMed]
  23. González-Navarro, B.; Segura-Egea, J.J.; Estrugo-Devesa, A.; Pintó-Sala, X.; Jane-Salas, E.; Jiménez-Sánchez, M.C.; Cabanillas-Balsera, D.; López-López, J. Relationship between Apical Periodontitis and Metabolic Syndrome and Cardiovascular Events: A Cross-Sectional Study. J. Clin. Med. 2020, 9, 3205. [Google Scholar] [CrossRef] [PubMed]
  24. Menni, C.; Lin, C.; Cecelja, M.; Mangino, M.; Matey-Hernandez, M.L.; Keehn, L.; Mohney, R.P.; Steves, C.J.; Spector, T.D.; Kuo, C.F.; et al. Gut microbial diversity is associated with lower arterial stiffness in women. Eur. Heart J. 2018, 39, 2390–2397. [Google Scholar] [CrossRef] [PubMed]
  25. Giakomidi, D.; Ishola, A.; Nus, M. Targeting gut microbiota to regulate the adaptive immune response in atherosclerosis. Front. Cardiovasc. Med. 2025, 12, 1502124. [Google Scholar] [CrossRef] [PubMed]
  26. Salvado, R.; Santos-Minguez, S.; Lugones-Sánchez, C.; Gonzalez-Sánchez, S.; Tamayo-Morales, O.; Quesada-Rico, J.A.; Benito, R.; Rodríguez-Sánchez, E.; Gómez-Marcos, M.A.; Casado-Vicente, V.; et al. Gut microbiota and its relationship with early vascular ageing in a Spanish population (MIVAS study). Eur. J. Clin. Investig. 2024, 54, e14228. [Google Scholar] [CrossRef]
  27. Dong, Y.; Cheng, H.; Liu, Y.; Xue, M.; Liang, H. Red yeast rice ameliorates high-fat diet-induced atherosclerosis in Apoe-/- mice in association with improved inflammation and altered gut microbiota composition. Food Funct. 2019, 10, 3880–3889. [Google Scholar] [CrossRef]
  28. Xie, B.; Zu, X.; Wang, Z.; Xu, X.; Liu, G.; Liu, R. Ginsenoside Rc ameliorated atherosclerosis via regulating gut microbiota and fecal metabolites. Front. Pharmacol. 2022, 13, 990476. [Google Scholar] [CrossRef]
  29. Qin, M.; Luo, Y.; Lu, S.; Sun, J.; Yang, K.; Sun, G.; Sun, X. Ginsenoside F1 Ameliorates Endothelial Cell Inflammatory Injury and Prevents Atherosclerosis in Mice through A20-Mediated Suppression of NF-kB Signaling. Front. Pharmacol. 2017, 8, 953. [Google Scholar] [CrossRef]
  30. Tryfonos, A.; Mills, J.; Green, D.J.; Wagenmakers, A.J.; Dawson, E.A.; Cocks, M. Association between atherogenic risk-modulating proteins and endothelium-dependent flow-mediated dilation in coronary artery disease patients. Eur. J. Appl. Physiol. 2023, 123, 367–380. [Google Scholar] [CrossRef]
  31. Toomey, S.; Harhen, B.; Roche, H.M.; Fitzgerald, D.; Belton, O. Profound resolution of early atherosclerosis with conjugated linoleic acid. Atherosclerosis. 2006, 187, 40–49. [Google Scholar] [CrossRef]
  32. Kostogrys, R.B.; Franczyk, M.; Maslak, E.; Gajda, M.; Mateuszuk, L.; Chłopicki, S. Effects of margarine supplemented with t10c12 and C9T11 CLA on atherosclerosis and steatosis in apoE/LDLR -/- mice. J. Nutr. Health Aging. 2012, 16, 482–490. [Google Scholar] [CrossRef] [PubMed]
  33. Fan, Y.Y.; Ramos, K.S.; Chapkin, R.S. Dietary gamma-linolenic acid suppresses aortic smooth muscle cell proliferation and modifies atherosclerotic lesions in apolipoprotein E knockout mice. J. Nutr. 2001, 131, 1675–1681. [Google Scholar] [CrossRef] [PubMed]
  34. Bai, W.; Zheng, X.; Zhou, L.; Li, H. Prostaglandin E1 dose-dependently promotes stability of atherosclerotic plaque in a rabbit model. Can. J. Physiol. Pharmacol. 2012, 90, 131–139. [Google Scholar] [CrossRef] [PubMed]
Figure 1. Serum lipid concentrations in healthy controls compared to individuals with dyslipidemia. B denotes mice receiving gut microbiota from patients with AS, while C represents mice given gut microbiota from healthy donors. (a) Comparison of the serum TG levels between groups B and C; (b) Comparison of the serum HDL-c levels between groups B and C; (c) Comparison of the serum TC levels between groups B and C; (d) Comparison of the serum LDL-c levels between groups B and C. An asterisk (*) signifies p < 0.05; whereas the absence of labeling indicates p > 0.05; ns, no significance.
Applmicrobiol 05 00029 g001
Figure 2. The alpha-diversity metrics of the fecal microbiome in the C and B cohorts. Box plots illustrate the variations in fecal microbiome diversity metrics between the C and B cohorts based on the Chao 1 index (a), observed species index (b), Shannon index (c), and Simpson index (d). ns, no significance.
Applmicrobiol 05 00029 g002
Figure 3. The beta-diversity indices of the fecal microbiome in the C and B cohorts. The PCoA plots depict bacterial beta diversity (a), utilizing the weighted UniFrac distance and Bray–Curtis’s dissimilarity (b). The B and C groups are represented in green and red, respectively.
Applmicrobiol 05 00029 g003
Figure 4. Relative abundance map of species taxonomy at the phylum and species levels: (a) phylum level; (b) species level. Microbial communities have significant differences in relative abundance between the B and C groups at the genus and species level: (c) phylum level; (d) species level.
Applmicrobiol 05 00029 g004aApplmicrobiol 05 00029 g004b
Figure 5. Bar graphs show the presence of KEGG pathways at level 1 (a) and significant differences in level k relative to abundance (b) between B and C groups.
Applmicrobiol 05 00029 g005
Figure 6. The OPLS–DA maps and differential metabolites. (a) OPLS–DA score plot representing the positive scores; (b) OPLS–DA score plot representing the negative scores; (c) Differential metabolites identified in the positive ion mode; (d) Differential metabolites identified in the negative ion mode.
Applmicrobiol 05 00029 g006aApplmicrobiol 05 00029 g006b
Disclaimer/Publisher’s Note: The statements, opinions and data contained in all publications are solely those of the individual author(s) and contributor(s) and not of MDPI and/or the editor(s). MDPI and/or the editor(s) disclaim responsibility for any injury to people or property resulting from any ideas, methods, instructions or products referred to in the content.

