Article

The Impact of Lytic Viruses on Bacterial Carbon Metabolism in a Temperate Freshwater Reservoir (Naussac, France)

by
Angia Sriram Pradeep Ram
1,*,
Marie-Eve Mauduit
2,
Jonathan Colombet
1,
Fanny Perriere
1,
Antoine Thouvenot
2 and
Télesphore Sime-Ngando
1
1
Laboratoire Microorganismes, Génome et Environnement, UMR CNRS 6023, Université Clermont-Auvergne, 63000 Clermont Ferrand, France
2
Athos Environnement, 112 Avenue du Brézet, 63100 Clermont Ferrand, France
*
Author to whom correspondence should be addressed.
Appl. Microbiol. 2023, 3(4), 1407-1423; https://doi.org/10.3390/applmicrobiol3040095
Submission received: 29 November 2023 / Revised: 12 December 2023 / Accepted: 12 December 2023 / Published: 15 December 2023

Abstract

:
In aquatic systems, the impact of the viral regulation of bacterial carbon metabolism (BCM) is often overlooked compared with nutrient supply. To address this gap, an investigation was conducted in the euphotic and aphotic zones of a mesotrophic freshwater reservoir (Naussac, France) to assess the relative influence of lytic viral infection on key bacterial metabolic parameters, specifically bacterial production (BP) and respiration (BR), as indicators of BCM. Measured using flow cytometry, the abundance of viral sub-groups (V1–V3) exhibited a consistent pattern in tandem with their bacterial hosts across both time and space. A more significant relationship between bacterial and viral parameters than between physicochemical factors suggested a prevailing internal control mechanism that was potentially driven by viral lysis. Viral-mediated bacterial mortality up to 65% was evident in the euphotic zone. The observed variation in BCM (ranging from 7% to 32%) was explained by an uncoupling between BR and BP. Notably, BR was significantly higher (three-fold) than BP in bacterial communities subjected to low in situ phosphate concentrations (<0.5 µM P) and high nutrient stoichiometric ratios (N:P > 60, C:P > 900). An antagonistic relationship between lytic viruses and BCM, whereby the repression of bacterial growth results in elevated respiratory demands, could potentially be attributed to substrate availability constraints.

1. Introduction

In the past three decades, viruses have gained recognition as the most abundant, active and diverse biological entities in both freshwater and marine systems [1]. Their interactions with all components of the microbial food web have profound implications for ecosystem function and structure, including host mortality, population dynamics, species succession, biodiversity and global biogeochemical cycles [2,3]. In freshwater systems, heterotrophic prokaryotes, particularly bacteria, are the predominant host for viruses, indicating their substantial contribution to bacterial community losses, which is comparable to the grazing impacts exerted by protozoans [4,5,6,7]. Studies have shown that phages are responsible for killing 20–60% of bacterial populations in lacustrine systems, making them the main agents of bacterial mortality [8,9,10]. The virulent lytic infection cycle, characterized by frequent interactions between viral and bacterial communities leading to immediate host lysis, can have a substantial impact on the flow of organic carbon and nutrient fluxes through bacteria.
In aquatic systems, bacteria play a crucial role in organic matter consumption through the synthesis of new biomass (bacterial production, BP) and remineralization of organic carbon to CO2 (bacterial respiration, BR). The relationship between these two processes, known as bacterial carbon metabolism (BCM), is essential for assessing the flow of organic matter and energy to higher trophic levels, making it a vital process for carbon cycling in aquatic systems [11]. BCM in marine and freshwater systems exhibits a significant range of variability, ranging from 5 to 80% [11]. Among aquatic habitats, freshwater environments experience more dynamic and ever-changing environmental conditions (both abiotic and biotic) over time, leading to spatiotemporal variability in BCM [12,13]. The adaptability of bacterial communities with diverse metabolic activities to environmental changes occurring throughout the seasonal cycle is primarily attributed to fluctuations in BCM [14]. Factors such as temperature, availability of inorganic nutrients, quality of dissolved organic matter and grazing pressure can potentially control BCM. However, the importance of these factors in influencing BCM may vary across different climate zones [15]. Although variability in BCM is often attributed to environmental constraints, such as nutrient availability, the influence of viruses through the specific lysis of active bacterial cells can also impact BCM. Unfortunately, the effect of viruses on BCM in freshwater systems has often been overlooked compared with nutrient availability. Studies conducted in marine and freshwater systems have yielded contrasting and mixed results regarding the viral control of BCM [16,17,18]. Viral lysis can directly influence BCM by altering bacterial community dynamics through the selective lysis of dominant bacterial populations. Indirectly, viral lysis can impact BCM by releasing regenerated nutrients that provide resources for non-targeted bacterial populations to support their growth and activity. This dual role of viruses as both top-down agents (via cell lysis) and bottom-up forces (through nutrient regeneration) complicates the understanding of the viral control of BCM in aquatic environments [19].
Among aquatic habitats, freshwater reservoirs pose a particular challenge as they are complex systems affected by hydrological features, catchments, outflows, replenishments and fluctuations in nutrient and organic carbon concentrations. Bacterial communities in these artificial systems exhibit high diversity in response to spatiotemporal environmental variations and anthropogenic activities. Despite the understanding of bacterial community structures and their ecological drivers, such as nutrients, there is still a lack of knowledge regarding the impact of viruses on BCM, although its importance has been acknowledged by aquatic microbial ecologists. Only a few studies have addressed the influence of viral regulation on BCM [9,20], even though numerous publications have separately focused on BCM and virioplankton in lakes.
Because reservoirs are generally characterized by high bacterial abundance and production rates, we hypothesis that virulent viral infection should impact community BCM through its parameters, specifically production and respiration. However, it remains to be determined whether the impact of viruses on bacterial metabolic activity is primarily dependent on their role in mortality or nutrient regenerators. In this study, our objective was to investigate the top-down control exerted by viruses on BCM in a selected temperate reservoir ecosystem (Naussac, France). We evaluated data on viral and bacterial groups using flow cytometry, as well as viral infection and bacterial metabolic parameters in the upper euphotic and bottom aphotic regions of the reservoir. The findings from this study aim to contribute valuable insights into bacteria–virus interactions in freshwater environments. This study is part of a larger research effort aimed at understanding the impact of viruses on BCM.

2. Materials and Methods

2.1. Study Site and Sampling Procedure

In France, Naussac reservoir was created from a dam constructed in 1983 across the upper reaches of the Allier river in the Lozere department. The reservoir is located in a conifer-type forest environment on a granite bedrock. Its primary purpose is to provide a vital supply for the cooling of nuclear power plants (Belville and Dampierre) during the summer months. Additionally, during periods of drought, the reservoir also plays a role in satisfying local agricultural needs. At a full supply level, the reservoir holds approximately 190 × 106 m3 of water, covers a surface area of 33 hectares and reaches a maximum depth of 50 m. The reservoir encompasses a total surface area of 10.8 km2 and is situated within a watershed spanning 52.2 km2. The reservoir measures approximately 8 km in length and 2.7 km in width.
For the investigation, water samples were taken from a designated deepest part of the lake (44°75′ N, 3°82′ E) that included the euphotic (EUP, vertical integrated samples) and aphotic zones (APH, 1 m above the lake bottom) by using a hose pipe sampler and 10 L Van Dorn bottle, respectively. The euphotic depth (Zeu) was determined from Secchi disc (ZSD) measurements and calculated from using the relationship Zeu = 2.42 ZSD, with an assumption that the Secchi depth is the 15% light penetration depth [21]. The sampling event was carried out in April, June, July, August, September and November for two consecutive years (i.e., 2017 and 2018). During the collection process, lake water was pre-sieved through a 150 µ nylon mesh to prevent the capture of larger particles. These samples were then stored in clean receptacles, kept cold (4 °C) and shielded from light during its transportation to the laboratory. Upon arrival, the samples were immediately processed for water chemistry, chlorophyll-a and microbiological parameters. At each sampling event, samples were collected in triplicate through three separate sampling operations.

2.2. Limnological Variables

Vertical profiles of the in situ temperature, pH, conductivity and dissolved oxygen concentration along the water column were measured using a submersible WTW-OX-320 water quality probe (Harfsen, The Netherlands). Turbidity measurements were performed using a turbidity meter (Seapoint Sensor Inc., Exeter, NH, USA). Ammonium (NH4-N) and ortho-phosphate (PO4-P) total phosphate (TP) concentrations were determined spectrophotometrically [22]. Concentrations of nitrate (NO3-N) and nitrite (NO2-N) were determined photometrically by continuous flow analysis [23]. Measurements of organic carbon such as the total (TOC, lake water passed through a 150 µ nylon mesh) and dissolved fractions (lake water filtered through a pre-combusted 0.7 µ pore size GF/F filter), together with the total dissolved nitrogen (TDN) were analyzed using a Shimadzu TOC-VCPN analyzer [24]. The concentration of dissolved inorganic nitrogen (DIN) is the sum of NH4 + NO3 + NO2. For chlorophyll-a determination, water samples with a volume of 400–500 mL were filtered through 47 mm Whatman GF/F filters. The pigments retained on the filters were then extracted by adding 10 mL of 90% (v/v) acetone and the extraction was performed overnight in the dark at 4 °C. Following this, the samples were subjected to centrifugation at 3000 rpm for 30 min. The resulting supernatant, containing the pigment concentration, was measured spectrophotometrically using a Cecil CE2021 UV-Visible spectrophotometer (Cambridge, England) [22].

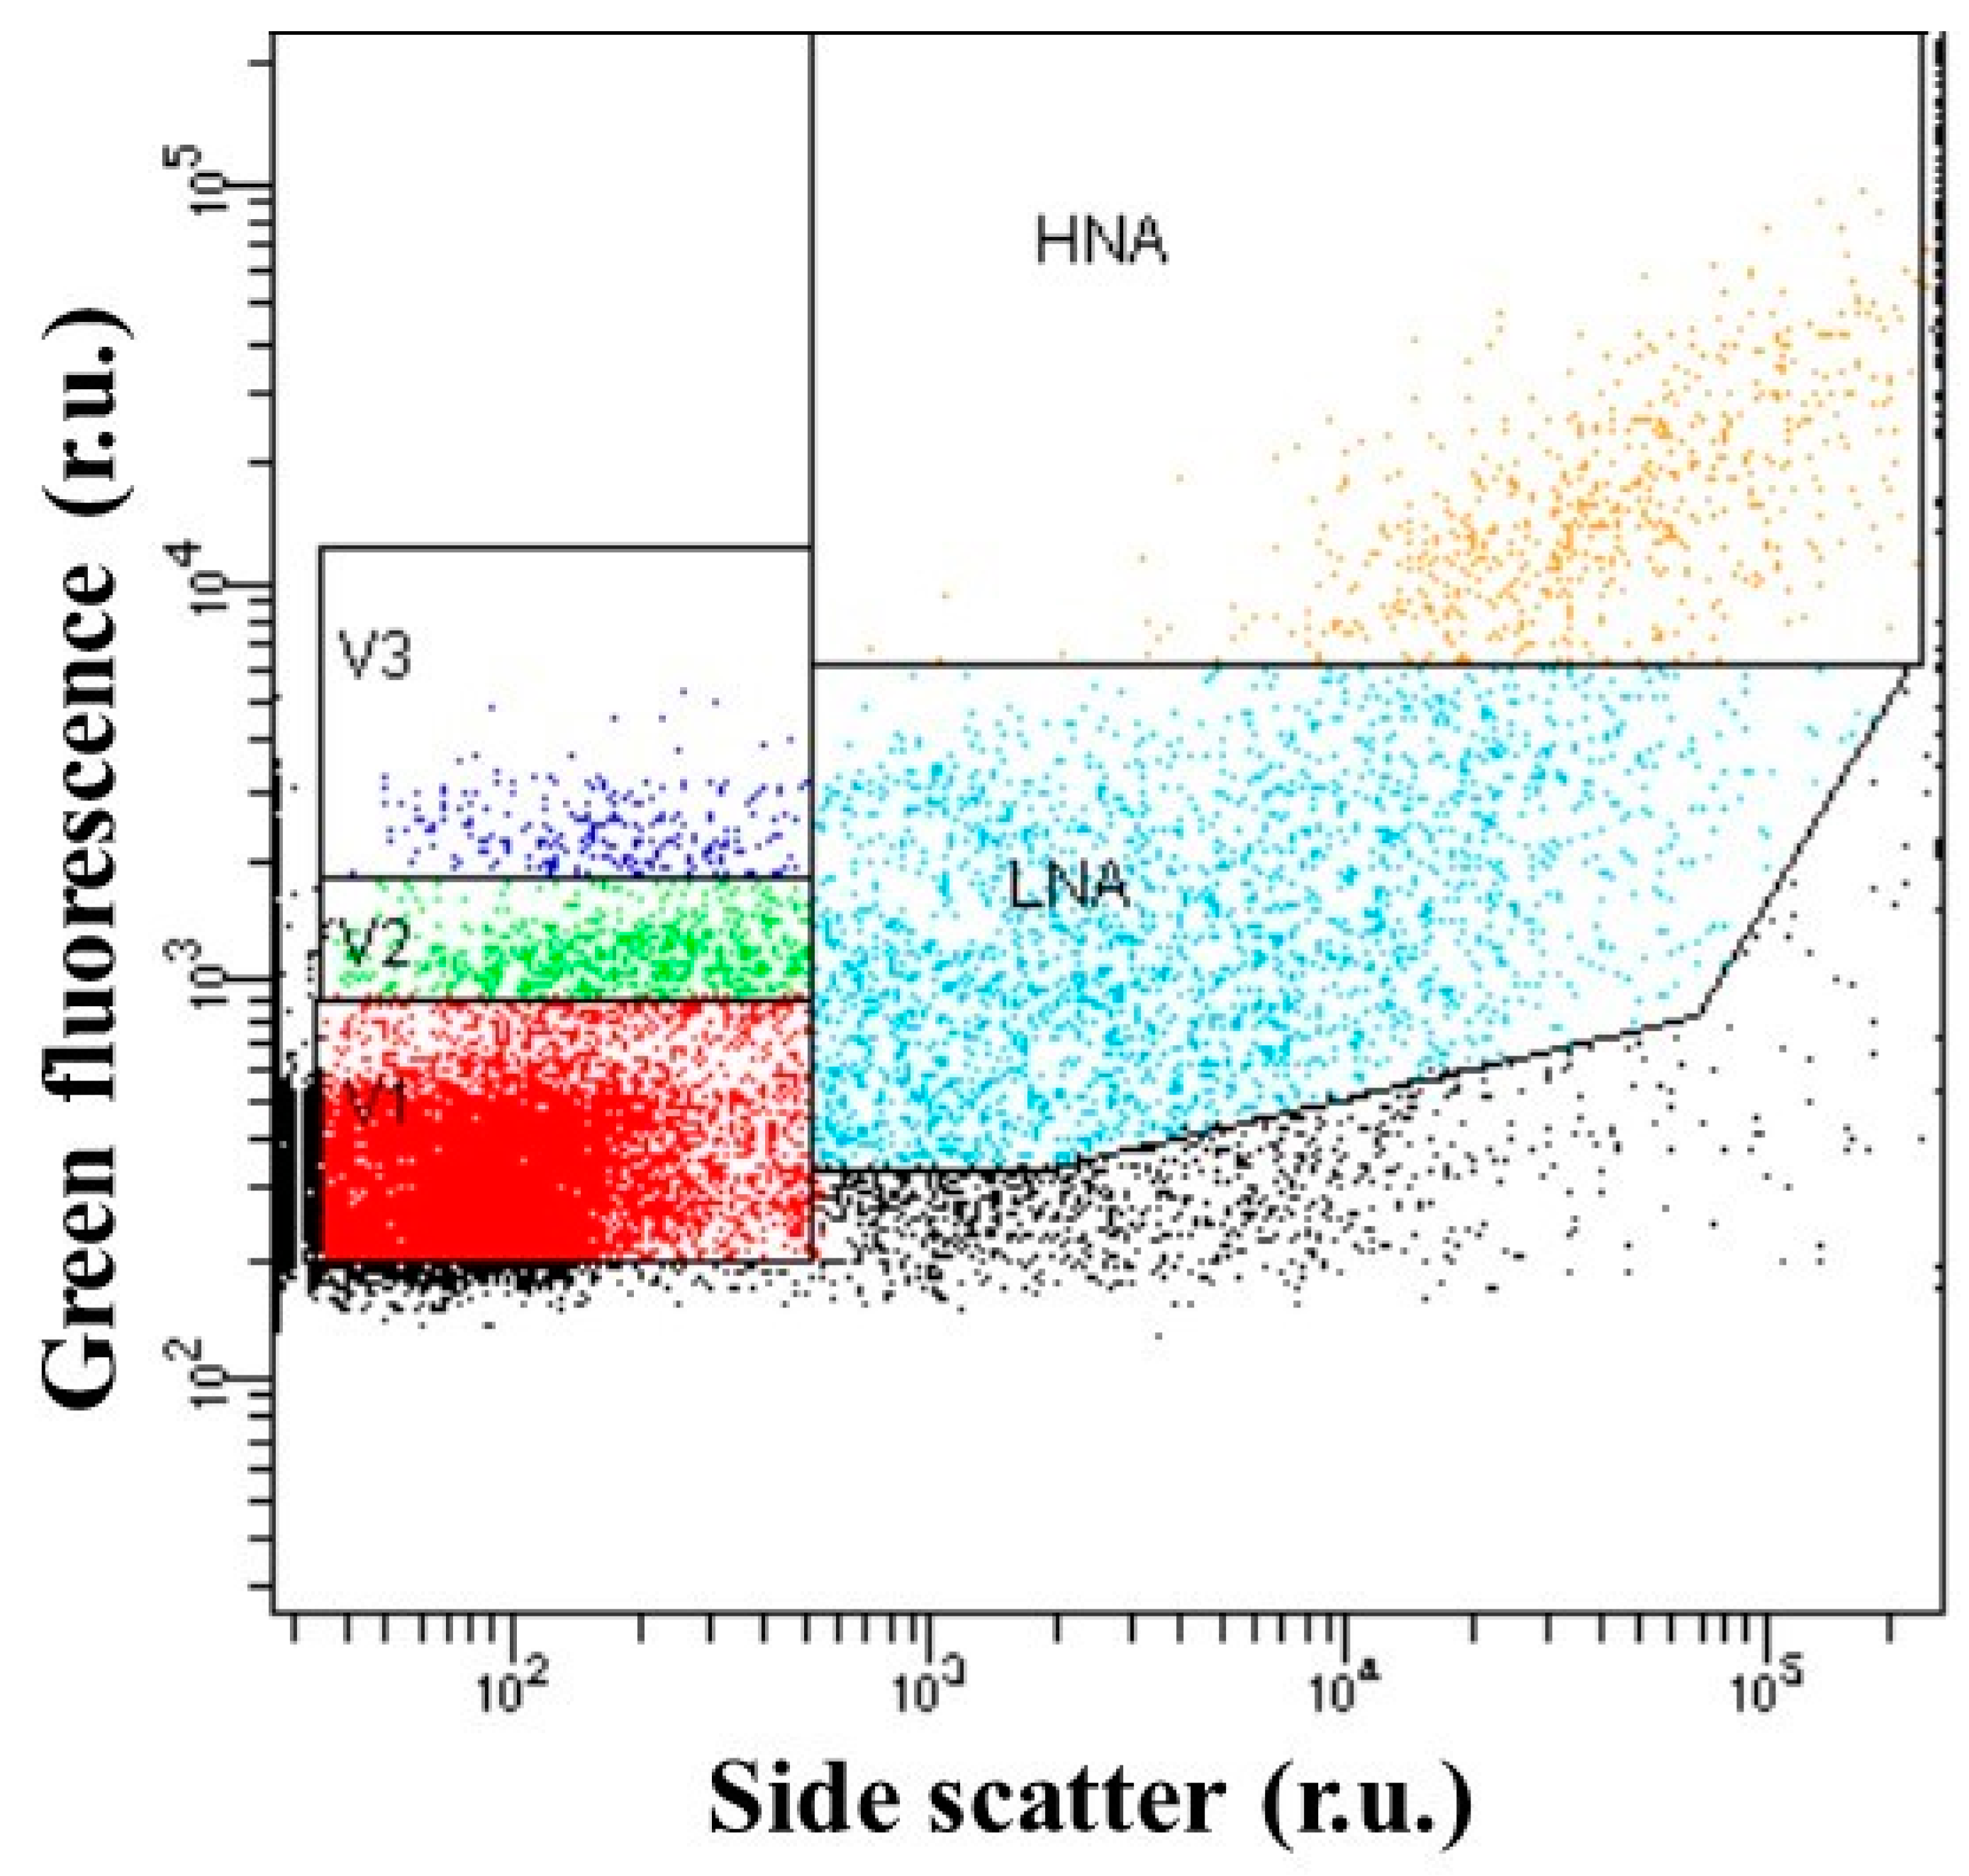
2.3. Flow Cytometry Enumeration of Viral and Bacterial Population

For enumeration of viral (expressed as virus-like particles, VLPs) and bacterial abundances (BA), 2 mL aliquots of formaldehyde-fixed water samples (0.5% final concentration) were diluted with Tris-EDTA buffer (pH: 8.2) and stained with SYBR Green I (final concentration of 1 × 10⁻⁴ of commercial stock, Molecular Probes) for 15 min in the dark at room temperature for bacteria and 10 min at 80 °C in a water bath for viruses [25]. Subsequently, the viral samples were allowed to cool down for about 5 min at room temperature in the dark prior to analysis. The samples were run instantly on a FACS Aria Fusion SORP flow cytometer (BD Sciences, San Jose, CA, USA) equipped with an air-cooled laser providing 50 mW at 488 nm with a 502 long pass and 530/30 band pass filter set-up. Distinct virus groups (V1, V2 and V3) and heterotrophic bacterial cells with high (HNA) and low (LNA) nucleic acid contents were detected, identified and quantified based on their signatures in a plot of side scatter (X-axis, related by size) versus green fluorescence (Y-axis, green fluorescence from SYBR Green I related to nucleic acid content). The output data were obtained and analyzed using the Cell Quest Pro software package (BD Biosciences, San Jose, CA, USA, version 4.0). Control blanks (Tris-EDTA buffer and autoclaved samples) that were processed identically to the samples were checked for very low coincidence and background fluorescence levels prior to sample analysis.

2.4. Bacterial Carbon Metabolism

Bacterial carbon metabolism (BCM) was estimated by measuring bacterial production (BP) and respiration (BR) in water samples that were gently gravity filtered through 1.0 µm polycarbonate (47 mm) filters (Whatman, UK). This filtration step was crucial to eliminate larger organisms such as protists and flagellates that could potentially interfere with the measurements. FCM analysis indicated that the chosen filter effectively allowed the majority of free-living bacteria (85–93%) to pass through.
Bacterial secondary production (BP) was determined from the specific growth rate (µ) by following a modified dilution approach [26]. For each sample, one part of 1µm filtrate was diluted with 4 parts of 0.02 µm filtered lake water and the batch cultures were incubated in the dark for a 24 h period at in situ temperature conditions. The bacterial abundance was monitored over time and BP was calculated from the increase in the number of cells produced (BA24) during the time interval (T) and cell concentration at the beginning (BA0) as:
BP (µ) = ln(BA24/BA0)/T
BP (cells l−1 d−1) was obtained by multiplying µ with the initial BA and then converted to C units using a conversion factor of 20 fg C cell−1 [27]. BCM (%) was calculated as follows: BP/(BP + BR) × 100 [11].
Bacterial community respiration (BR) was measured using the Winkler method, which quantifies the consumption rate of dissolved oxygen in 1 μm filtered lake water in BOD bottles after a dark incubation [28]. The filtrate was carefully transferred to calibrated borosilicate glass BOD bottles (125 mL capacity) using a sipper system to avoid the formation of air bubbles up to the brim and gravity stoppered. For each sample, four out of eight bottles were immediately fixed with Winkler reagents to determine the initial oxygen concentration (time T0), whereas the remaining were incubated in the dark at in situ temperature for 24 h (T24) in parallel with the BP samples before fixing. The oxygen concentration was determined via a Winkler titration technique using a potentiometric endpoint detection. BR was calculated from the rate of oxygen consumption concentration from T0 to T24 h and converted into a CO2 production rate by assuming a respiratory quotient of 1.

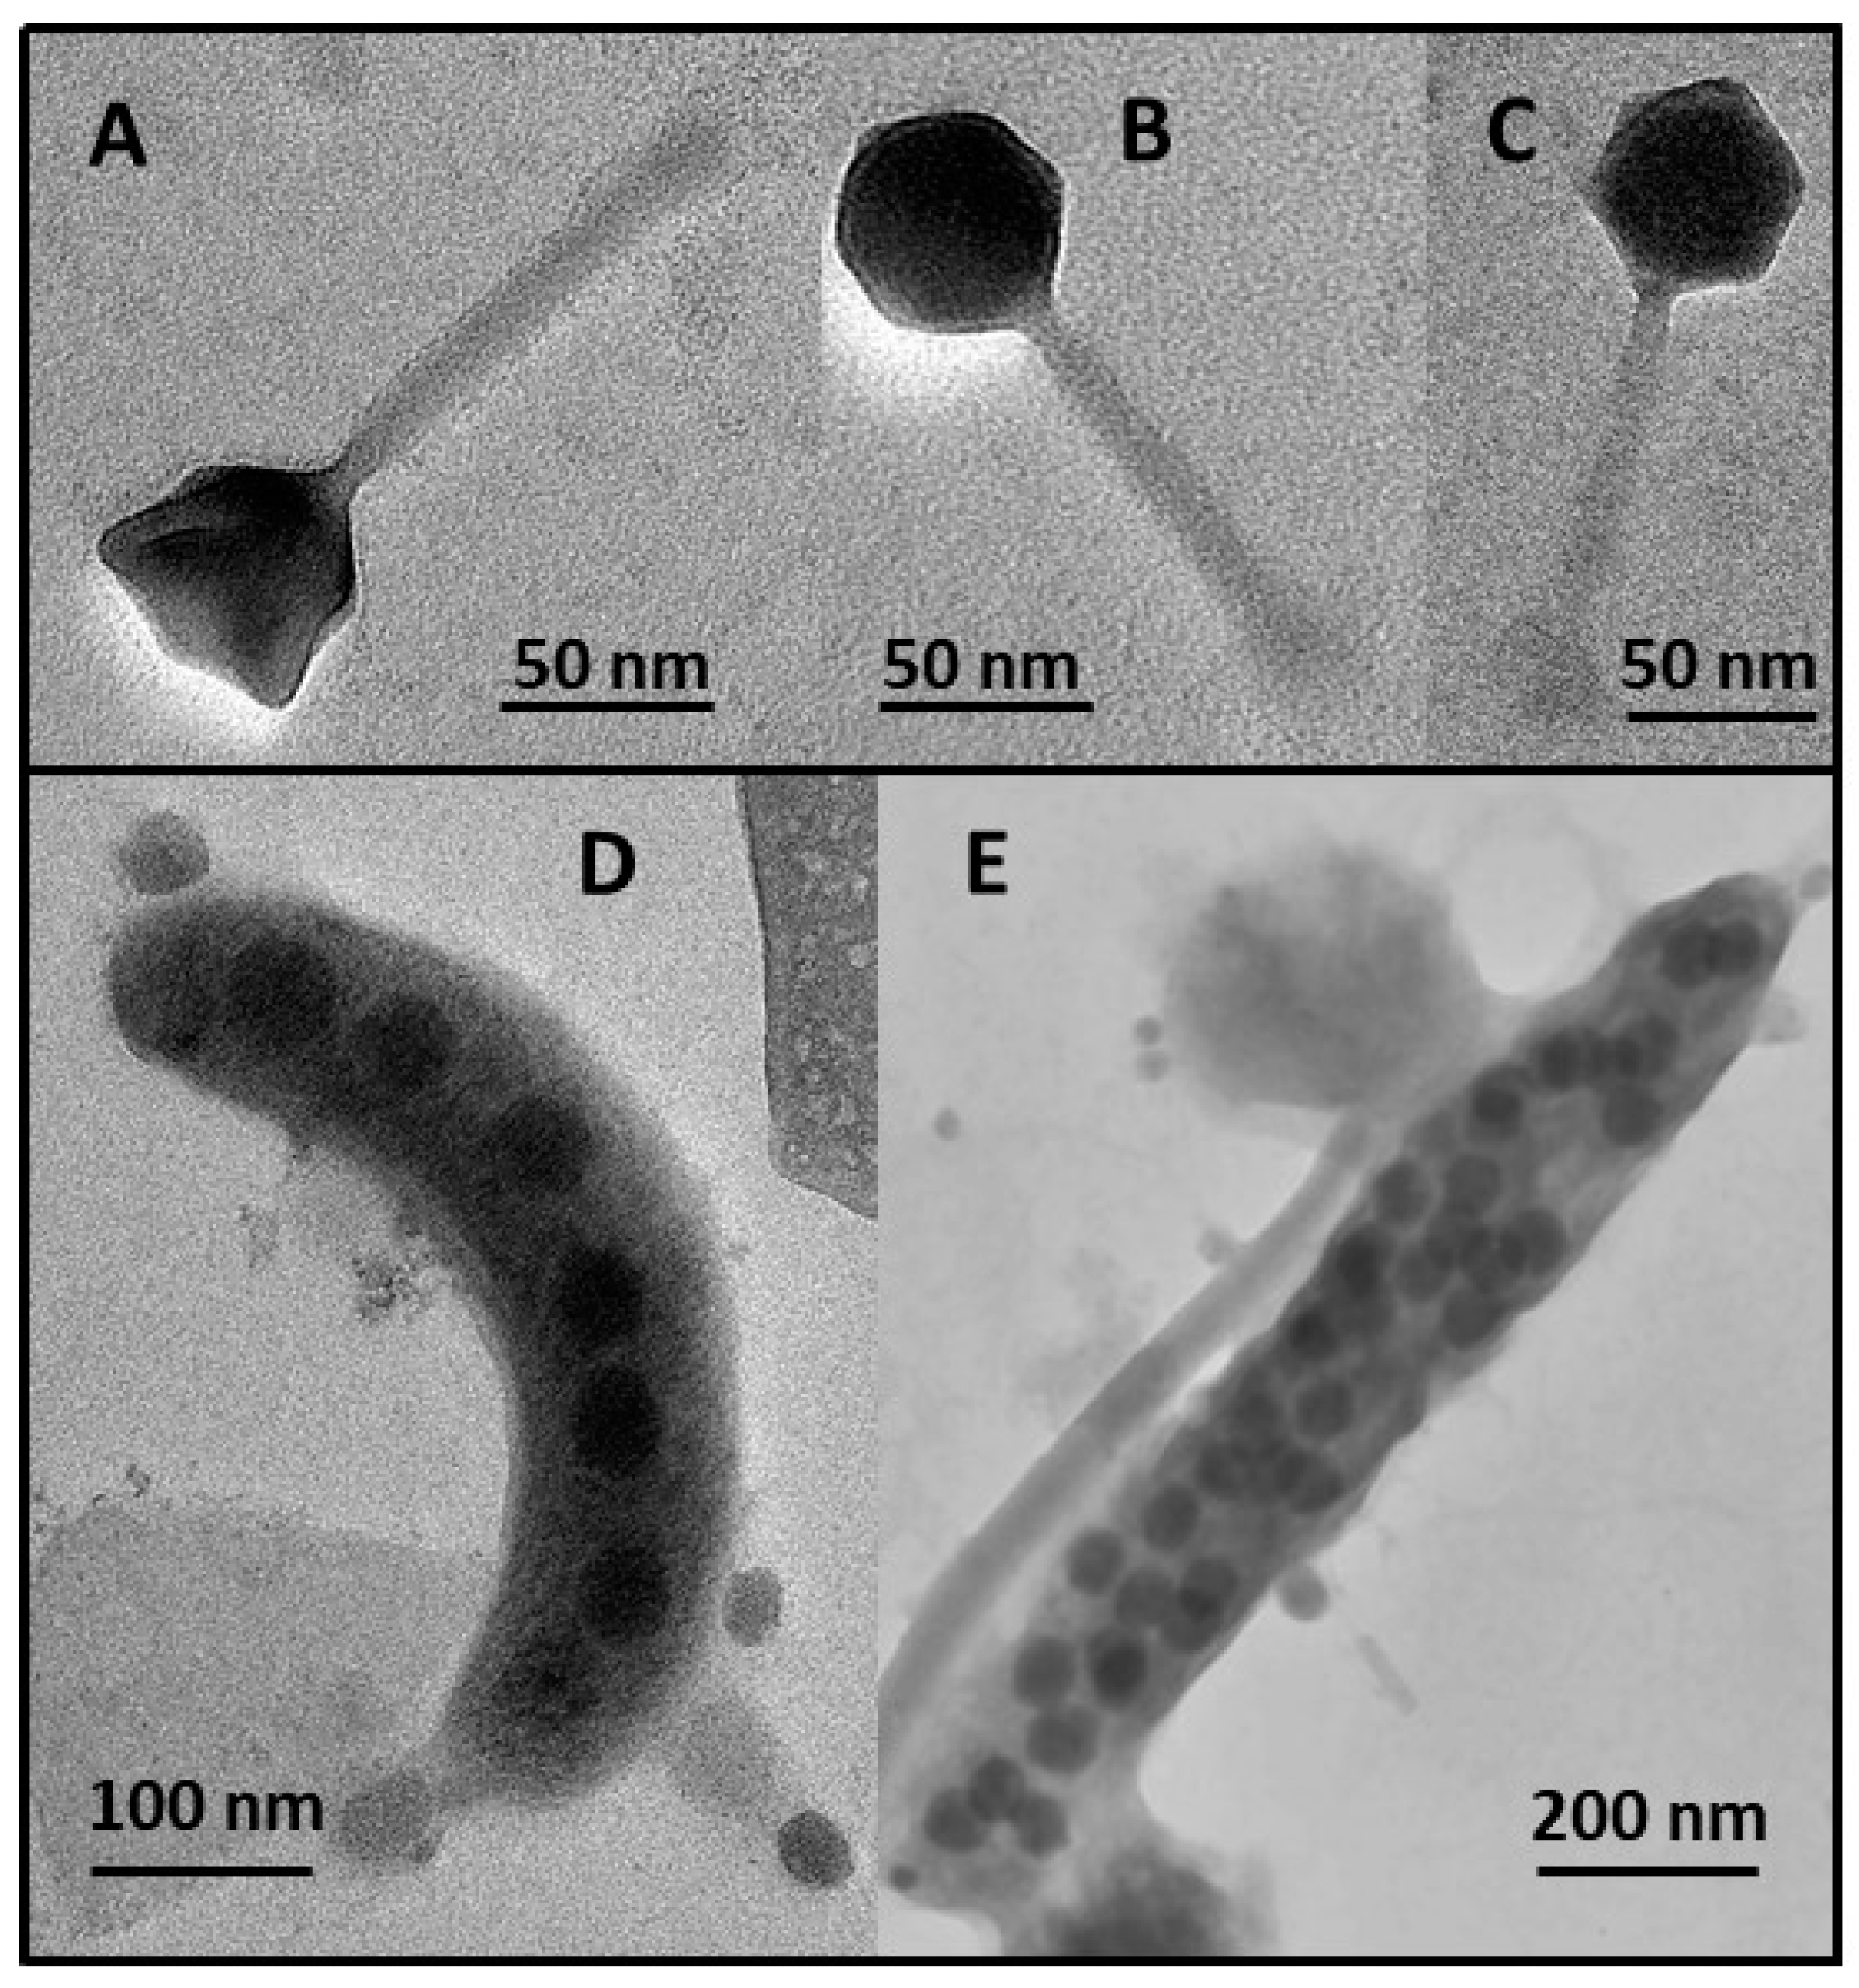
2.5. Phage Bacteriolysis, Burst Size Estimates and Morphometric Characteristics

Viral-mediated bacterial mortality was determined from the whole-cell frequency of visibly infected cells (FVIC, percentage of total bacterial abundance) using a transmission electron microscope (TEM) according to the approach from Pradeep Ram et al. [9]. Bacterial cells contained in 8 mL aliquots of formalin-fixed samples (1% final concentration) were directly harvested onto electron microscopic grids (Cu 400 mesh, carbon-coated formvar film) by ultracentrifugation (Optima LE-80K, Beckman Coulter SW40 Ti, swing out rotor at 70,000× g for 20 min at 4 °C). Each grid was negatively stained with uranyl acetate (2% wt/vol, pH = 4) at room temperature (~20 °C) for about 30 s, after which they were rinsed with ultrapure water. The excess liquid was immediately wicked away with absorbent paper. Grids were examined at ×6000–40,000 magnification with a TEM (JEM-2100 Plus TEM, Tokyo, Japan) operated at 80K accelerating voltage to distinguish between phage-infected and uninfected bacteria. FVIC estimates were determined based on the minimum observation of 400 bacterial cells for each grid. A cell was considered infected when matured phage particles, based on their shape and size, were clearly visible inside the host prior to cell lysis. FVIC counts were converted to the frequency of infected cells (FIC) and viral-induced bacterial mortality (VIBM) using the empirical equations of Weinbauer et al. [29] (FIC = 9.524 FVIC − 3.256) and Binder [30] (VIBM = (FIC + 0.6FIC2)/(1 − 1.2FIC), which relate to the bacteriophage infection cycle.
In parallel, burst size (BS) was estimated for every individual host cell from the number of fully matured phages. Different types of viral particles were identified and grouped as myoviruses, podoviruses, siphoviruses and non-tailed viruses on the basis of size, head morphology and tail characteristics (if present).

2.6. Data Analyses

Minitab 17 (Minitab Inc., State College, PA, USA) was used for statistical analysis. To determine the correlation between variables, we employed potential product moment analysis. Additionally, to understand the interactions between various environmental variables and phage infection as well as viral abundance, we conducted a multiple linear regression test. Comparisons of multiple mean values were performed using an analysis of variance (ANOVA). Statistical significance was considered at a p-value of less than 0.05.

3. Results

3.1. Water Quality Characteristics

The euphotic depth, as assessed by light penetration in the water column, ranged between 3.0 m and 11.3 m, with an average value of 7.8 m (Supplementary Figure S1). Water transparency was supported by low turbidity readings of <3 FNU along the euphotic zone. The mean concentration and range of different water quality parameters measured at the EUP and APH zones in Naussac reservoir are listed in Table 1. The water temperature varied more substantially in the EUP zone (CV = 40%) than in the APH zone (CV = 21%) within the sampled months. The maximum value recorded in the EUP zone in August 2018 (24.9 °C) was 3-fold higher when compared with its corresponding APH zone (8.0 °C). The vertical temperature structure of Naussac reservoir correspond to holomictic lakes, presenting thermal stratification from April to early September (Supplementary Figure S2). The pH always remained higher (p < 0.03) in the EUP zone than in the APH zone. Lake conductivity, which is a measure of water quality and an indicator of saline conditions, was in a lower range (41–66 µS/cm) and correlated strongly with water temperature (p < 0.001). Oxygenic conditions (oxygen contents of >8 mg L−1) prevailed in the EUP zone during the entire study period, whereas anoxic or hypoxic conditions (0.3–1.7 mg L−1) occurred in the bottom waters during the August–September period (Supplementary Figure S2). Among inorganic nutrients, the total and ortho-phosphate concentrations were significantly lower (p < 0.001) than dissolved nitrogen species (DIN = NH4+ NO2+ NO3). The low phosphate concentrations that resulted in a high N:P ratio in the EUP (mean ± SD = 82.1 ± 32.5) and APH (mean ± SD = 60.6 ± 54.5) zones were indicative of strong P limitation (Table 1). Total and dissolved organic carbon concentrations did not vary with depths and months. Overall, dissolved organic carbon represented about 90% of the total fraction, suggesting the low presence of particulate organic matter that mainly arrives through high phytoplankton biomass and/or external inputs. The C:P ratio of the dissolved organic matter, which ranged from 70 to 1440 (mean ± SD = 914 ± 377), was well above the resource threshold concentration (250) to limit microbial activity. The chlorophyll-a concentration, an indicator of algal biomass, ranged between 1.0 and 9.1 µg L−1 (mean ± SD = 3.2 ± 2.3 µg L−1) in the EUP zone and was correlated (p < 0.01) with dissolved organic carbon. Based on the Secchi disc transparency and the Chl-a and total phosphate concentrations, Naussac reservoir was designated as a mesotrophic lake, as computed from the Trophic State Index [31].

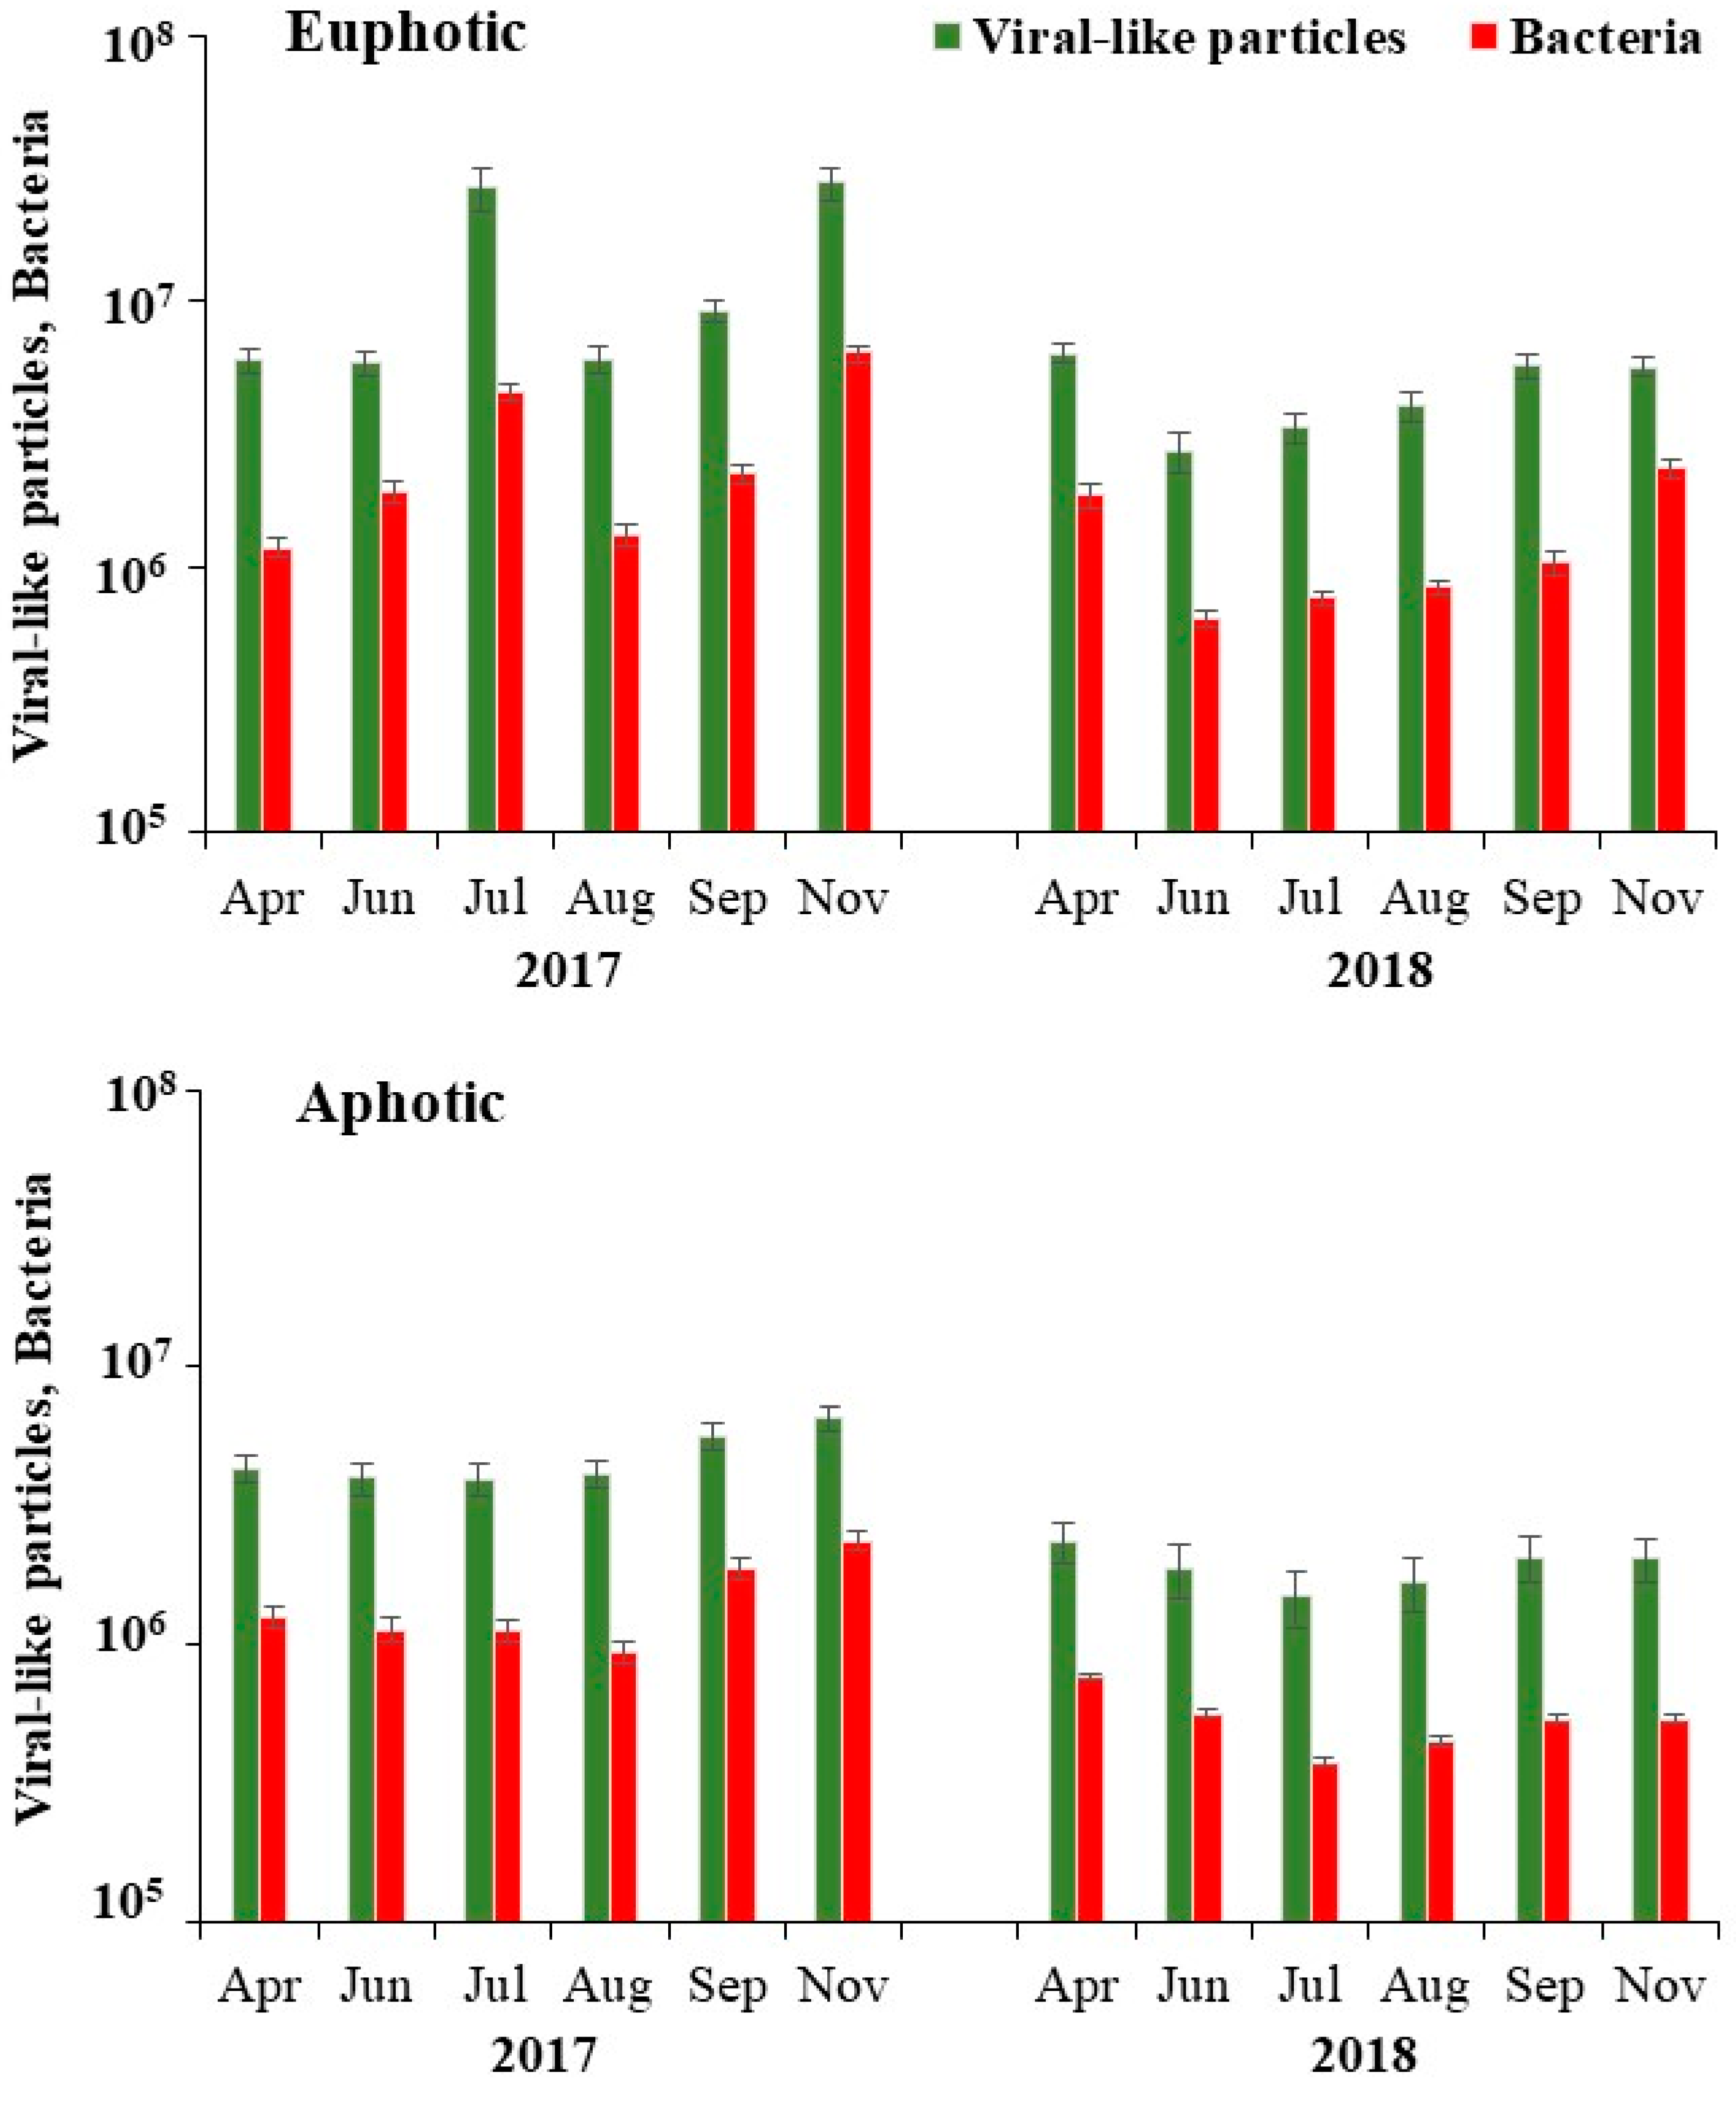
3.2. Flow Cytometry Counts of Viruses and Bacteria

Viral-like particles (VLPs), i.e., the sum of the V1, V2 and V3 subgroups, in Naussac reservoir ranged from 1.5 to 28.7 VLPs × 106 mL−1. Their mean abundance in the EUP zone (mean = 9.2 ± 8.7 VLPs × 106 mL−1) was about 2.8-fold higher when compared with counts in the APH zone (mean = 3.3 ± 1.7 VLPs × 106 mL−1) (Table 2). Fluctuations in the amount of VLPs were more significant in terms of depth (p < 0.03) than between the studied years. The maximum concentration of VLPs at both depths was found to occur during the same sampling period, i.e., November 2017 (Figure 1). Overall, the water temperature and dissolved oxygen had little influence on the total viral community dynamics.
Three separate groups of free virus particles (V1, V2 and V3) were consistently distinguished in our samples using flow cytometry based on a nucleic-acid-specific fluorescence signal (Figure 2). Following the usual coding [25], V1 corresponds to the lowest nucleic acid content, V2 to the medium and V3 to the highest. The V1, V2 and V3 groups represented, on average, 82%, 14.7% and 2.5% of the total viral abundance, respectively. V1 particles, which represents the group with the smallest particle size (low fluorescent group), were the most abundant at both depths and are generally considered the type that infect bacteria. In the EUP zone, V1 abundance was 6- and 39-fold higher than V2 and V3 abundance, respectively, whereas in the APH zone it was 10- and 65-fold more abundant, respectively (Table 2).
The total abundance of heterotrophic bacteria (BA) ranged from 0.4 to 6.4 × 10⁶ cells mL−1, with significant differences based on the depth. On an average, BA was 2-fold higher with significantly (p < 0.05) higher densities in the EUP zone (mean = 2.1 ± 1.7 × 10⁶ cells mL−1) compared with the APH zone (mean = 1.0 ± 0.6 × 10⁶ cells mL−1) (Table 2). The distribution patterns of bacteria and viruses at both sampled depths during the studied period exhibited similarities, ultimately resulting in a noteworthy relationship between the two communities. Their highest densities occurred in the same sampled month (Figure 1). Among the bacterial subgroups, the LNA population was always dominant throughout the study period at both depths and prevailed over the HNA population by an average of 3-fold (Table 2). On an average, the LNA population represented 76% and 75% of the total BA in the EUP and APH zones, respectively.
The virus-to-bacteria ratio (VBR), which is a proxy of viral activity or the balance between viral decay and production, varied narrowly between 2.4 and 6.0, with mean values of 4.3 ± 1 and 3.5 ± 0.4 in the EUP and APH zones, respectively. The variations in both the viral and bacterial abundances, along with their distinguished sub-groups, were always larger in the EUP zone than in the APH zone (Table 2). The relationships between viral and bacterial densities, together with phytoplankton biomass, were tested using a Model II linear regression. The steeper slope of the Model II indicates that the viruses were more dependent on bacterial than on phytoplanktonic abundance, which reflects the importance of bacteria in host–phage interactions in Naussac reservoir. BA accounted for 90% of the variation in VA; the regression equation that relates BA and VA is as follows: VA = 4.70 + 0.99BA (adjust r2 = 0.91, p < 0.001, n = 24, Supplementary Figure S3).

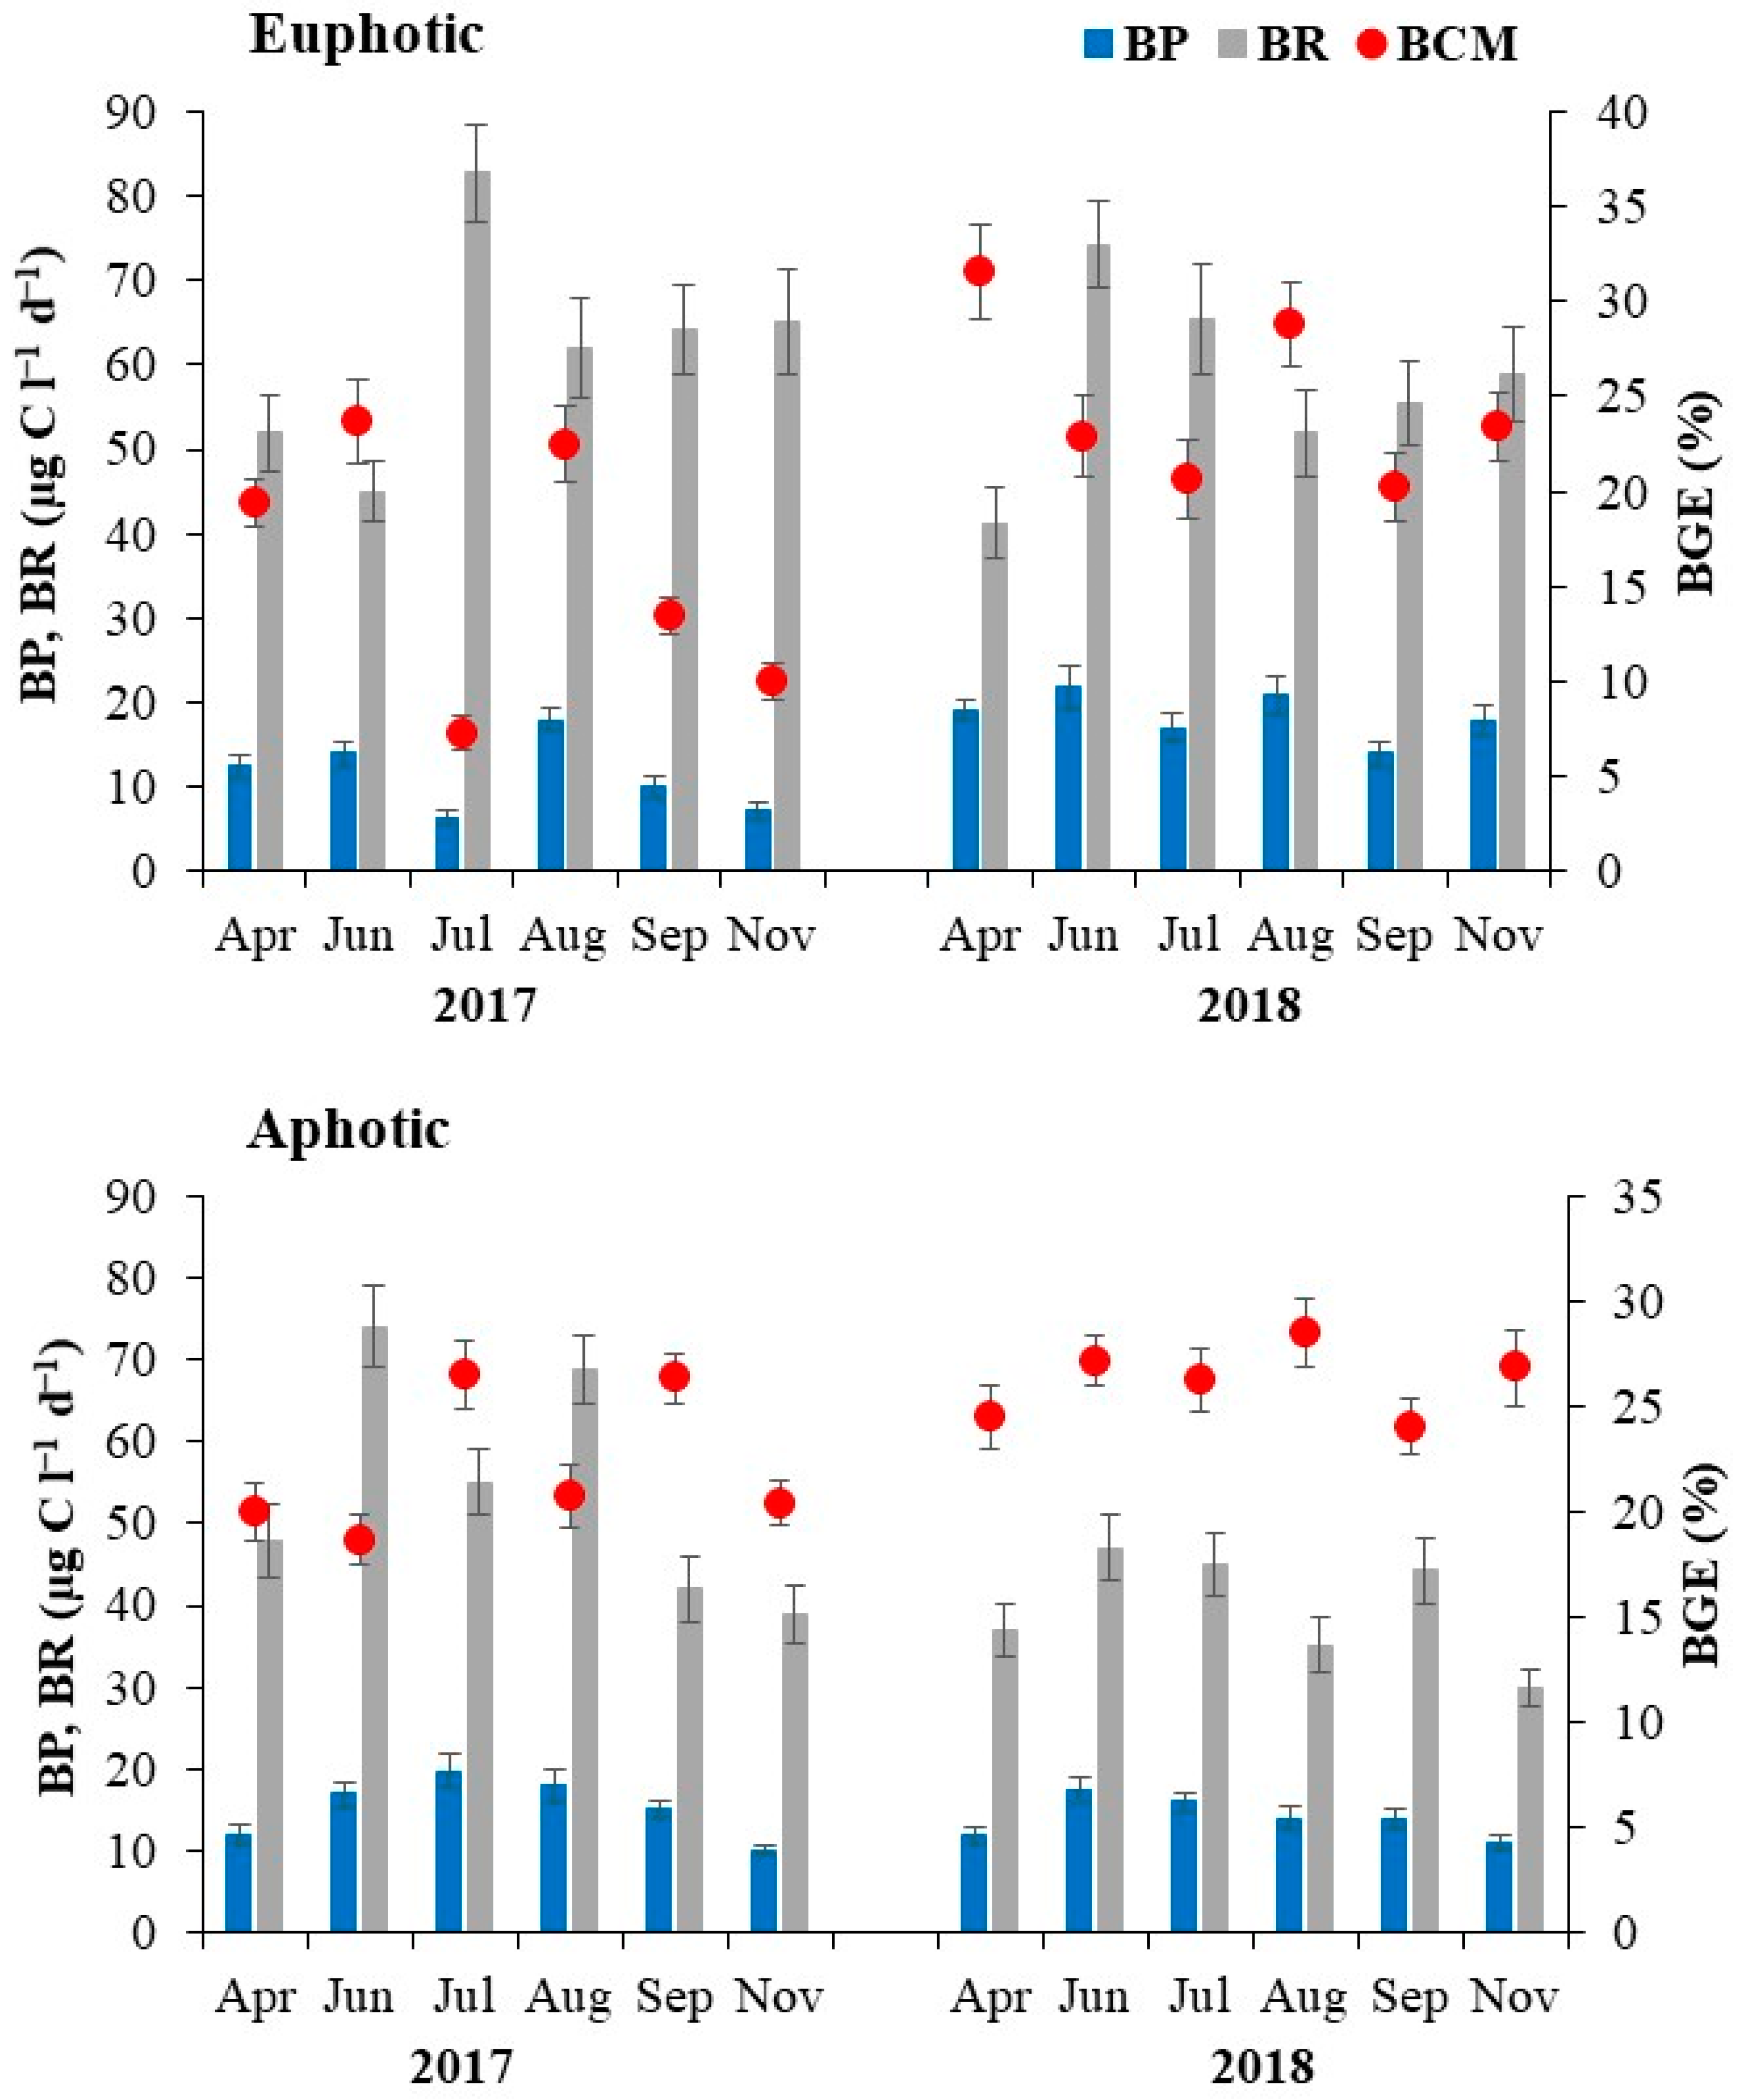
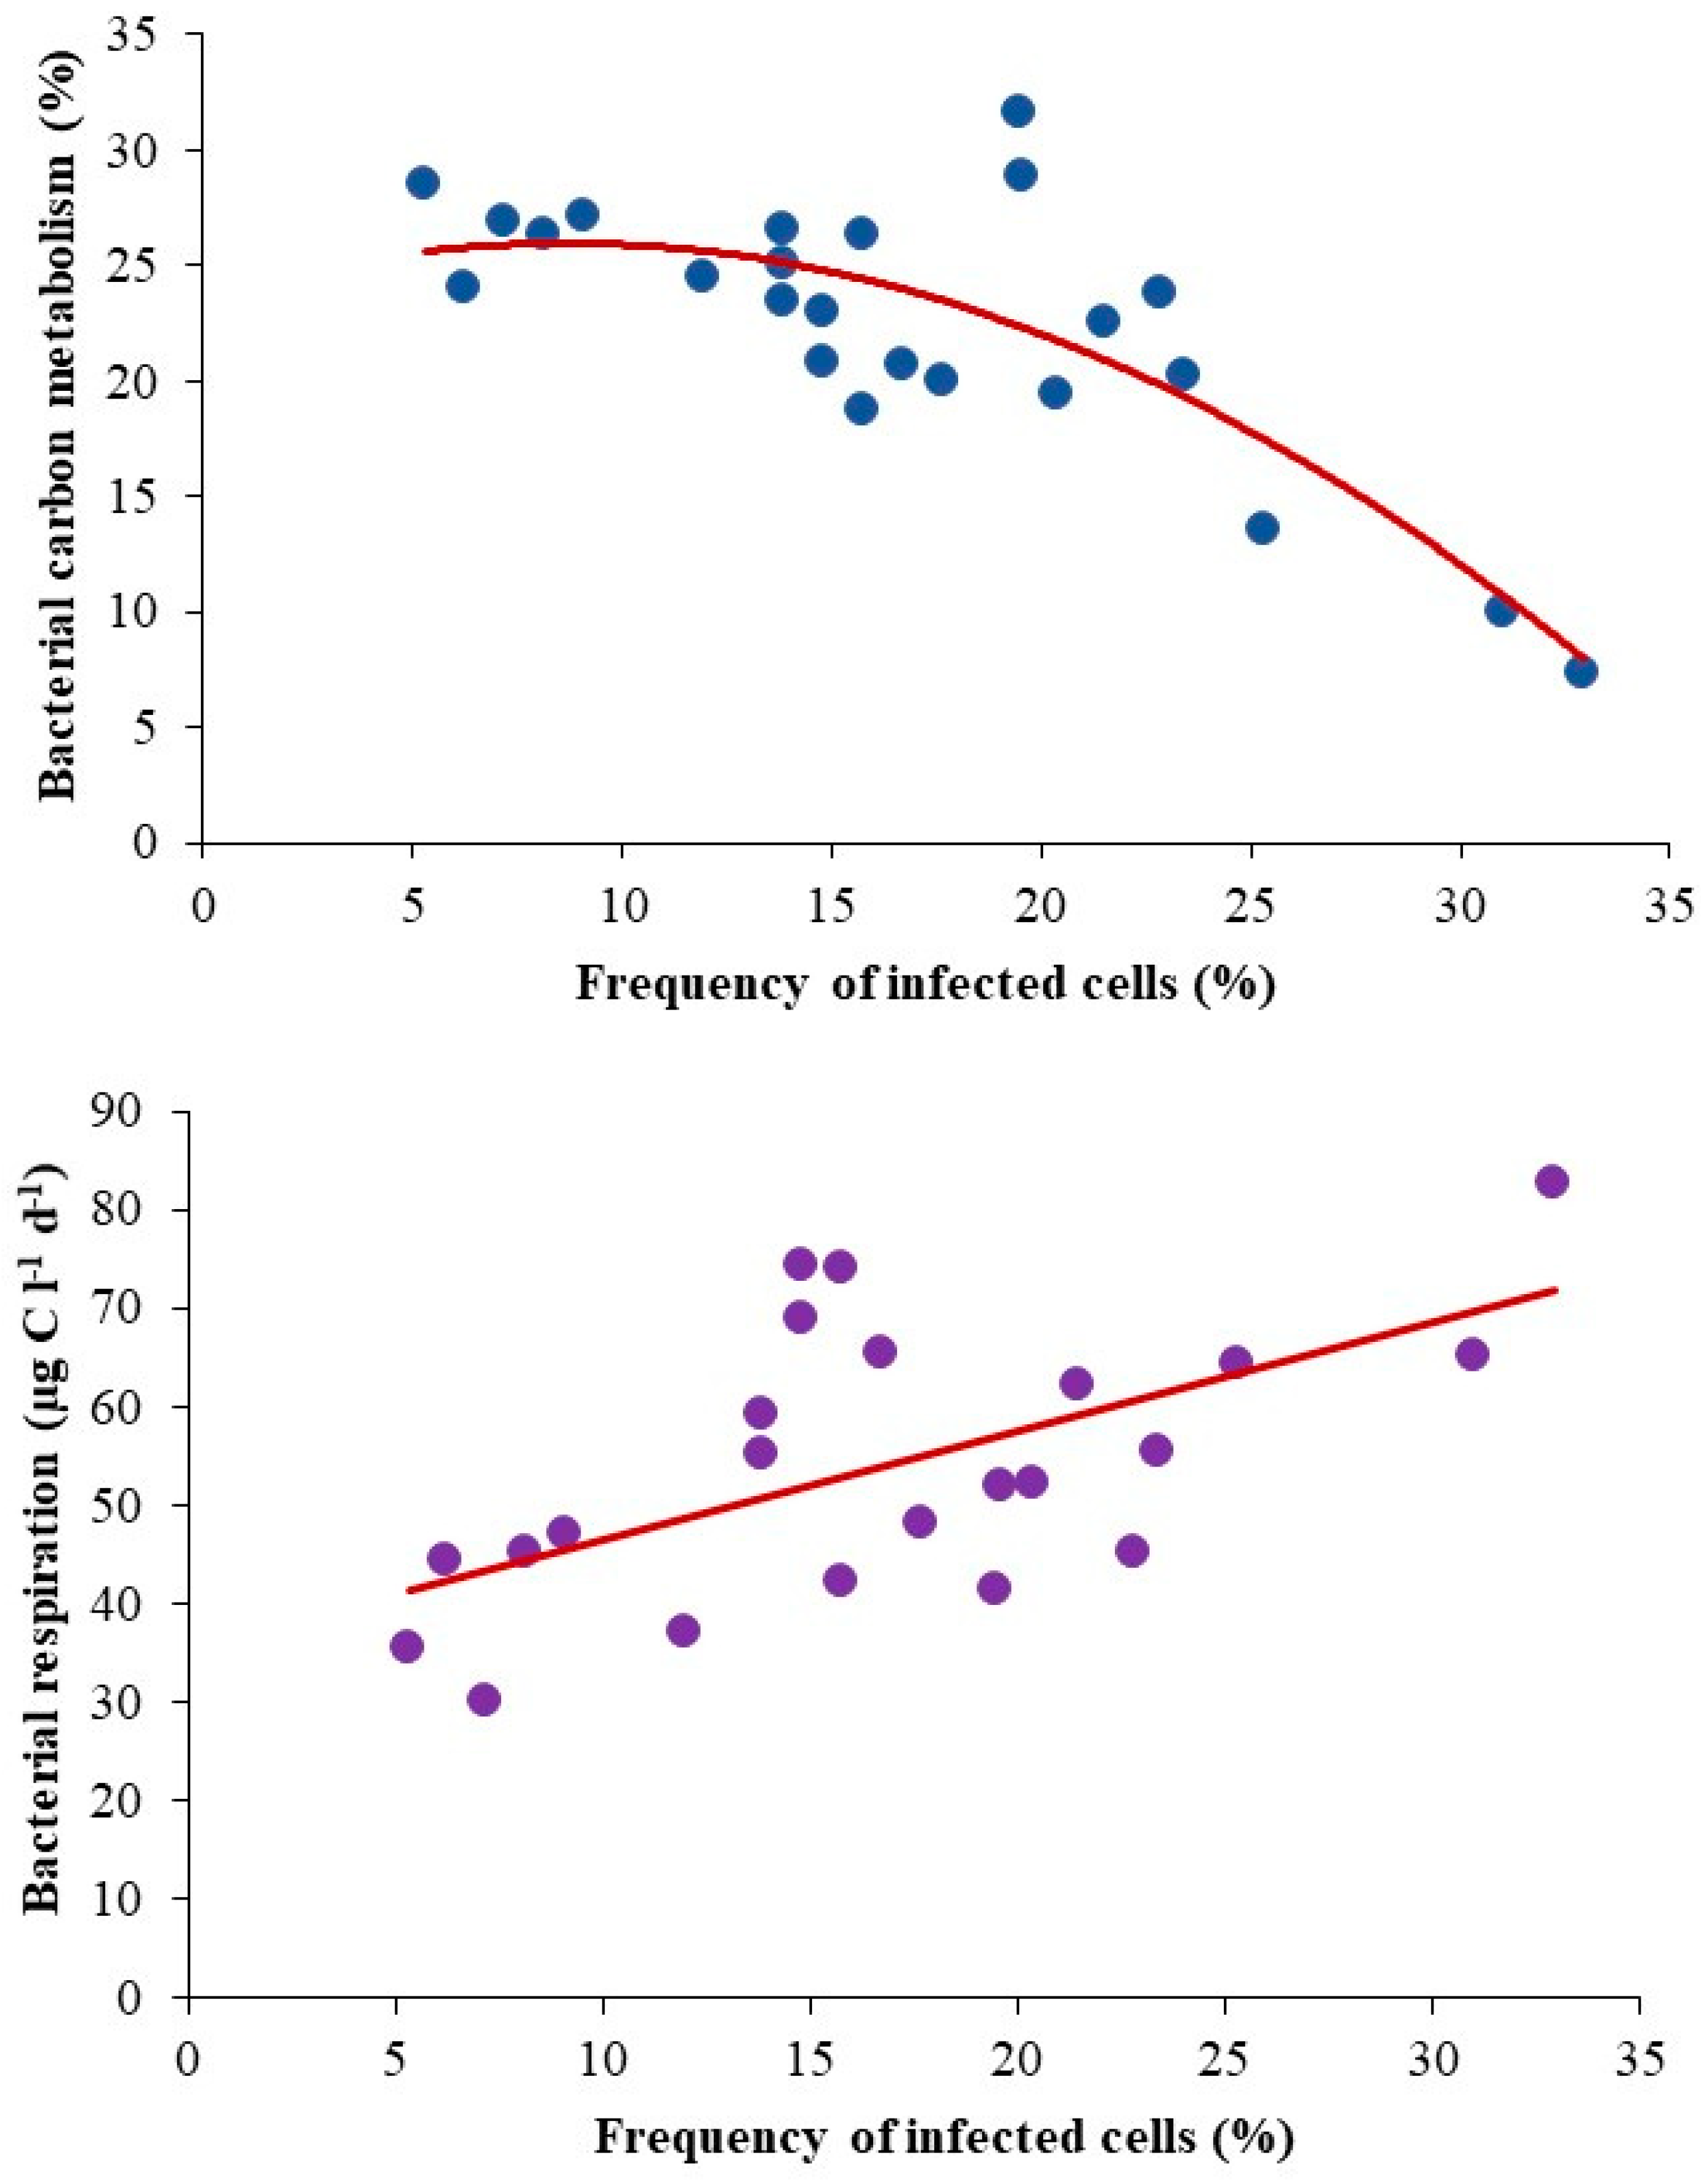
3.3. Bacterial Production (BP), Respiration (BR) and Carbon Metabolism (BCM)

The relationship of two metabolic parameters, namely BP and BR, that defines the variability in BCM is a very important characterization of the ecosystem function(ing). Overall, BP ranged between 6.5 and 22.0 µg C L−1 d−1 (Figure 3), with an average of 14.9 ± 5.1 µg C L−1 d−1 and 15.1 ± 2.8 µg C L−1 d−1 in the EUP and APH zones, respectively. BR ranged between 30.0 and 82.7 µg C L−1 d−1 (Figure 3) and, unlike BP, the respiration rates in the EUP zone (mean = 59.8 ± 12 µg C L−1 d−1) were significantly higher (p < 0.01) than in the APH zone (mean = 47.8 ± 13.5 µg C L−1 d−1) (Table 2). BR was apparently higher than BP by 4- and 3-fold in the EUP and APH zones, respectively. The large degree of uncoupling between the simultaneous measurements of BP and BR (Table 3) resulted in the observed range of calculated BCM (7 to 32%, Figure 3), with no significant differences of these parameters between the depths (Table 2). BR was related to temperature (p < 0.05) but was generally independent of inorganic or organic nutrient concentrations, suggesting that this is a rather resilient ecosystem function. A high BR rather than BP indicated greater catabolism of DOC under P-nutrient-limiting conditions in order to balance the elemental requirement of the cell. BP showed a nonlinear relationship (power function) to BCM (y= 2.04x0.87, r2 = 0.68, p < 0.001), which eventually resulted in a significant negative relationship (p < 0.001) between BCM and BR (Table 3). BCM was negatively related (p < 0.001) to the C:P ratio, suggesting that the availability of P was important in sustaining bacterial metabolism (Supplementary Figure S4).

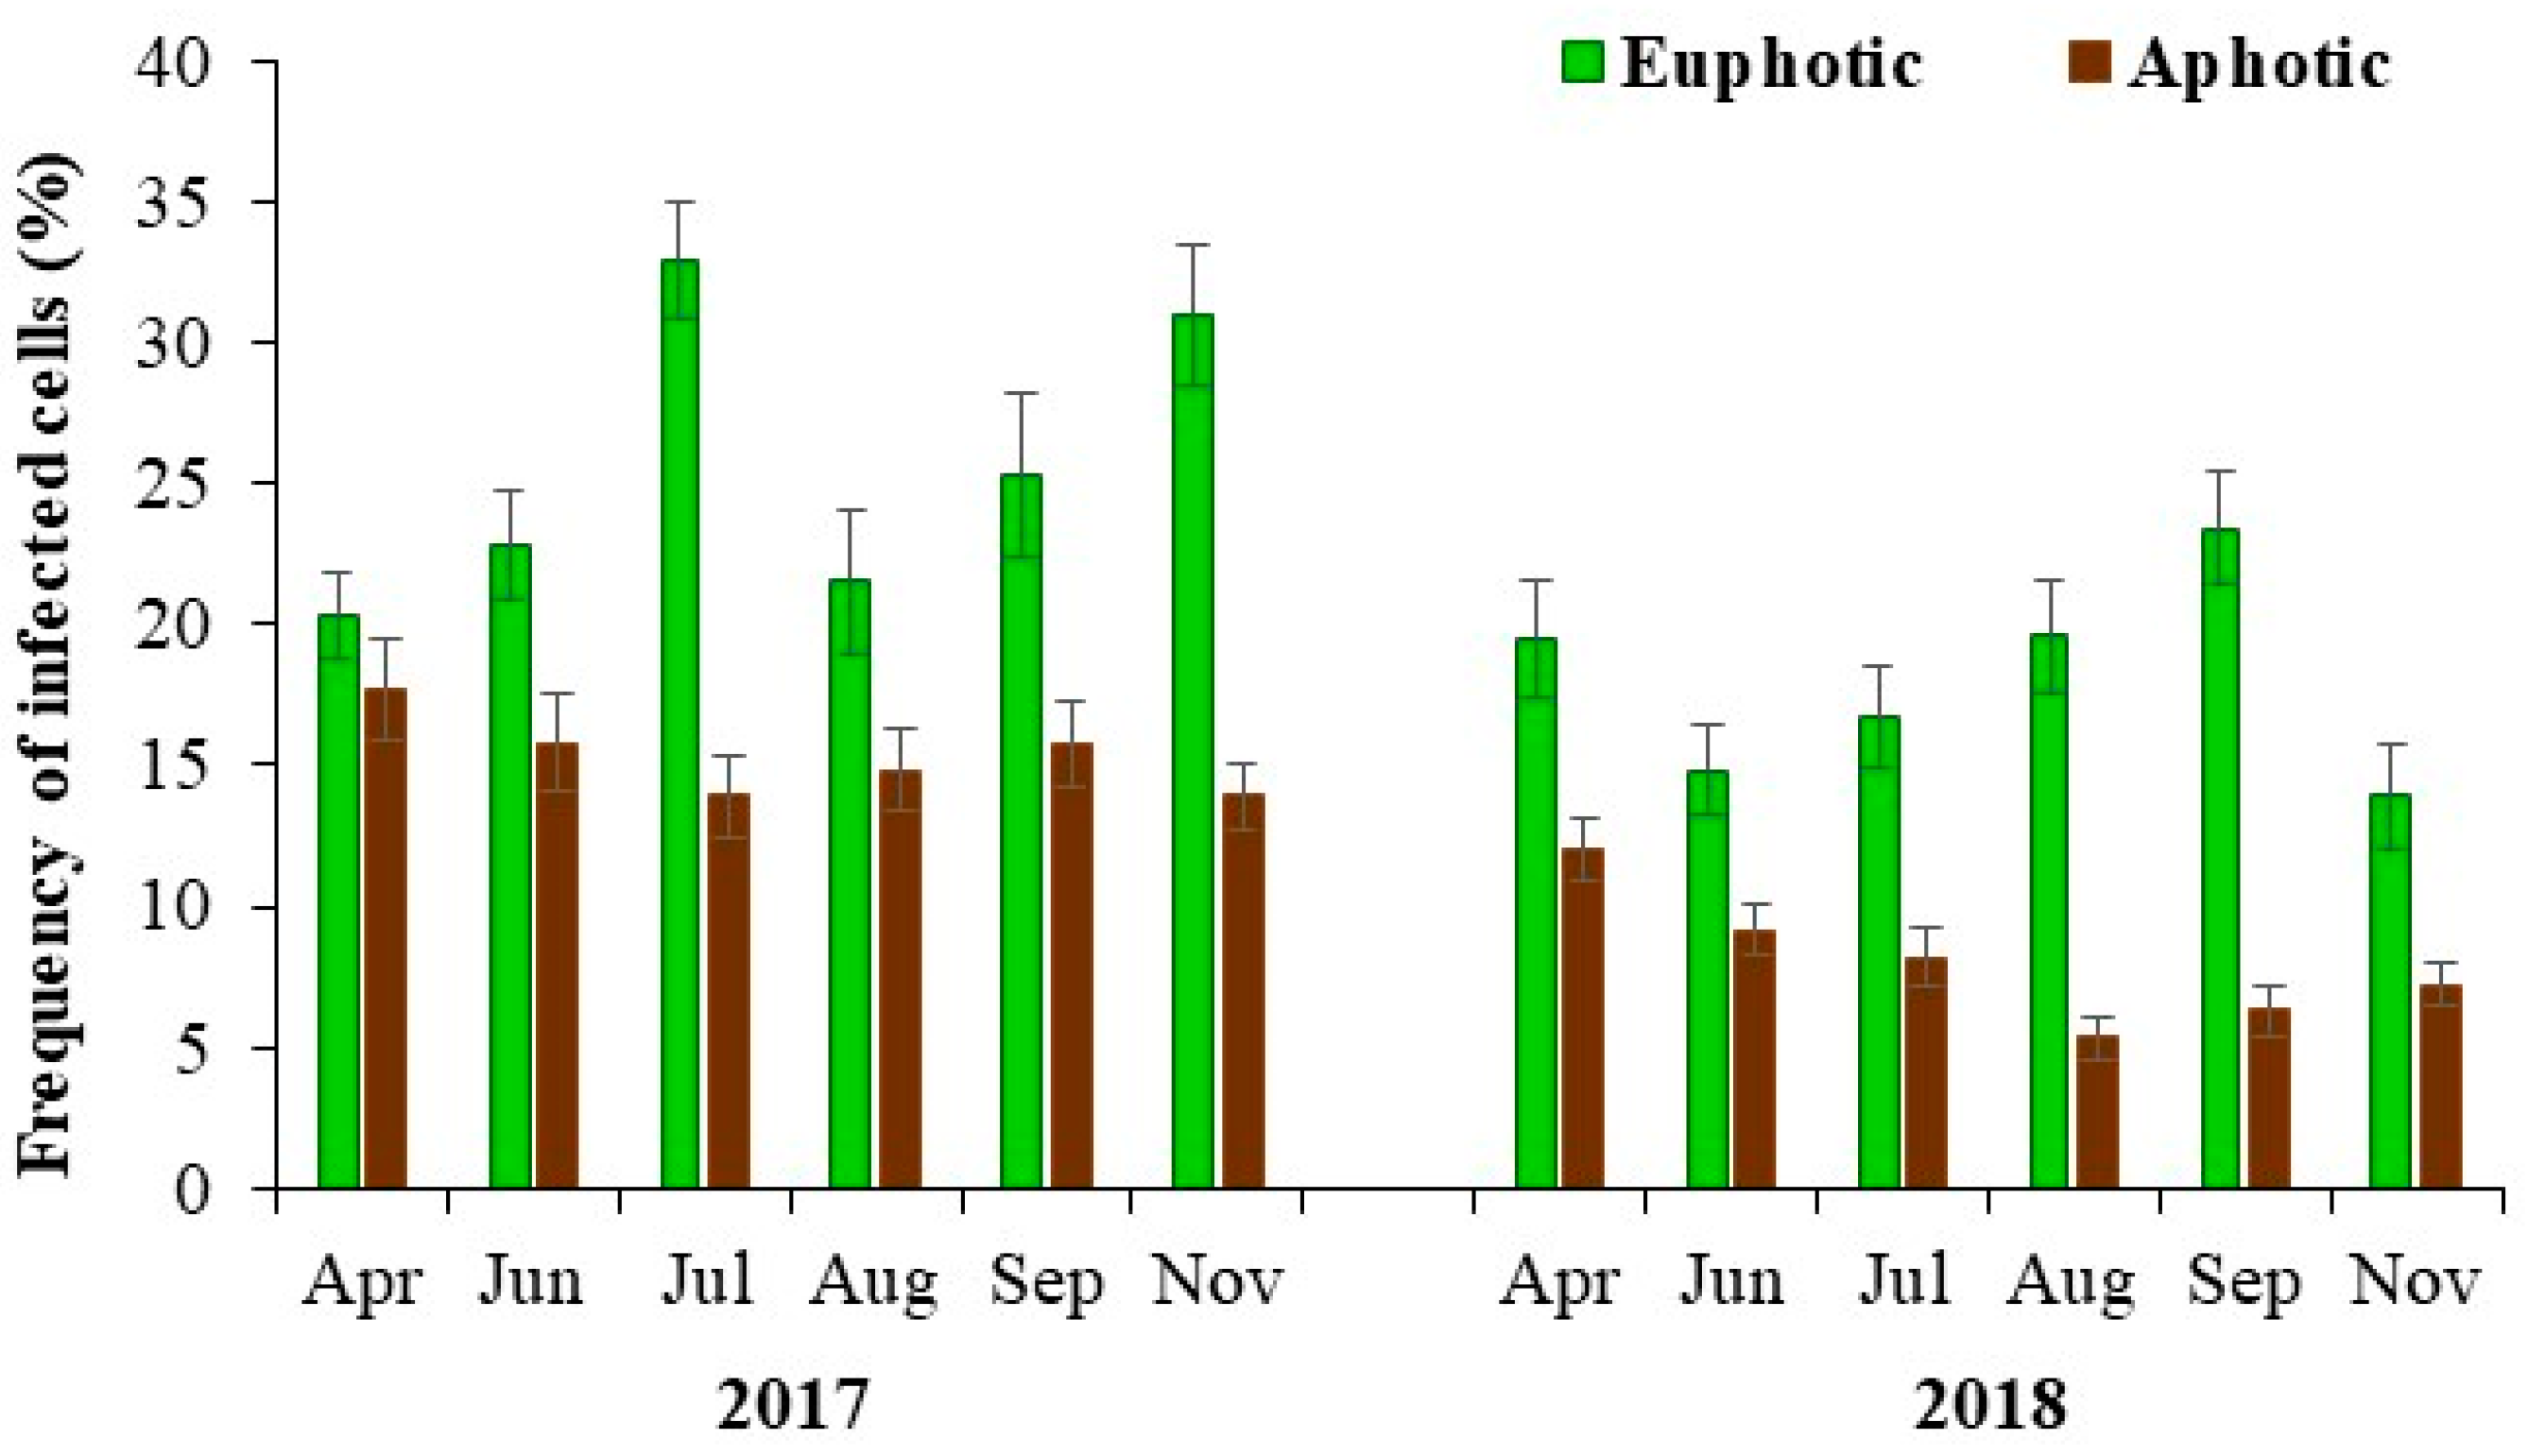
3.4. Lytic Viral Infection and Mortality

Viral lytic infection, as evaluated from the direct visualization of intracellular phage particles (FVIC) using TEM, ranged between 0.9 and 3.8%, which corresponded to 5.0 and 32.9%, respectively, of the total bacterial community infected by viruses at the given time (Figure 4). High viral lysis of up to 60% of the bacterial community occurred during the sampling event when both the bacterial and viral densities were at their highest levels. On average, the frequency of infected cells (FIC) in the EUP zone was 2-fold higher than in the APH zone (Table 2). Among the abiotic parameters, the FIC was significantly correlated with temperature (p < 0.01). In spite of moderate infection rates, the BS estimates (enumeration of intracellular phage particles in an infected bacterium) were significantly higher (p < 0.001) at the EUP than at the APH depth (Table 2). Overall, the viral capsid diameter ranged from 30 to 160 nm, with more than 80% belonging to the less than 60 nm group (range: 30–60 nm), which was mainly comprised of myoviruses (contractile tail), as observed by TEM (Figure 5). Most of the observed infected bacteria belonged to the rod morphotype (short and elongated) (Figure 5). The FIC was negatively correlated with the inorganic nitrogen species (p < 0.02) and total phosphate (p < 0.02) concentrations and positively with organic carbon concentration (p < 0.02), suggesting that viral lysates could be richer in elemental C rather than in N and P. Regression analysis suggested that for the FIC, a combination of chlorophyll, VA and temperature (FIC = 0.63Temp −0.37Chl + 0.31VA + 1.96, r2 = 0.81, p < 0.001, n = 15) were the main correlates in the EUP and APH zones. The FIC was related to viral density, indicating density-dependent regulation of the host population (Table 3). Viral lysis showed no preferences between the LNA and HNA populations.

3.5. Viral Impact on Bacterial Population and Carbon Metabolism

Among the studied physicochemical and biological factors, only viral parameters had a significant influence on the bacterial abundance. However, in order to assess the role of top-down factors in regulating bacterial biomass, we conducted a linear regression analysis between biomass and production. Accordingly, the significant negative relationship (p < 0.001) that was observed between bacterial production and abundance indicated the presence of top-down control on the bacterial population (Table 3). Additionally, both viral abundance and lytic infection were found to have detrimental effects (p < 0.001) on BP and BCM (Table 3). The differential relationship between viral infection and BCM was best described using a concave quadratic regression model (Figure 6). The negative relationship between BCM and viral infection exhibited a greater strength and significance when the proportion of infected cells surpassed the 10% threshold. Furthermore, the respiratory rates of the non-targeted bacterial population were found to be stimulated by viral infection, as depicted in Figure 6. The highest bacteriolysis rate, which was observed in July 2017, coincided with the lowest estimated BCM value of 7%.

4. Discussion

Limited research has been conducted on the impact of viruses on carbon-based BCM in freshwater systems, despite their increasing role in host mortality processes. The Naussac reservoir study provided multiple indications of the significance of mortality factors in influencing bacterial communities and carbon flux through bacteria. For instance, the uncoupling between bacterial production and abundance, as well as the lack of correlation between bacterial parameters (abundance and activity) and nutrient levels, suggested the influence of mortality factors. The strong correlation between viral and bacterial parameters, in contrast to their weaker association with physicochemical factors, further indicated an internal control mechanism that was likely driven by viral lysis [32]. In the studied freshwater system, viral lysis exhibited an antagonistic relationship with BCM. This antagonism could be attributed to the repression of bacterial production along with increased rates of bacterial respiration. Additionally, the absence of a relationship between BCM and the C:N ratio of organic matter indicated that substrate quality had a lesser impact on bacterial-mediated carbon flux. The findings emphasize the importance of considering viral influence in elucidating the dynamics of bacterial carbon metabolism in aquatic ecosystems, particularly in reservoirs where virus–bacteria interactions can be complex due to various prevailing factors.
In Naussac reservoir, the presence of low turbidity levels and a high percentage of dissolved organic carbon to total fraction (>90%) indicated a significant absence of particulate material that could originate from high phytoplankton biomass, bloom formation or allochthonous inputs from water shed area [33]. Furthermore, low levels of phosphate (P) concentration (<0.5 µM P), especially in the EUP zone, resulted in high N:P (>60) and C:P (>913) ratios, exceeding the reported threshold levels of N:P (>20) and C:P (>258) described by Guildford and Hecky [34]. These unusual ratios indicate a potential limitation of P, which could significantly impact microbial activity within the reservoir [35]. Similar observations of low in situ concentrations, coupled with high stoichiometric ratios that exert control over microbial growth and activity, have been previously reported in freshwater systems [36,37].
The flow cytometric abundances of bacteria and viruses were within the reported range of values for mesotrophic reservoir systems [38,39,40]. Viral diversity has been linked to flow cytometry subgroups [41]. Accordingly, three groups of low-fluorescence free viral particles, namely V1, V2 and V3, which comprise mostly of bacteriophages that are largely represented by the Myoviridae and Podoviridae families, were clearly distinguished in our samples [25]. Among the viruses, the V1 group, which comprised the smallest particle sizes and genomes, were dominant throughout the study and contributed to more than 80% of the total viral counts. The abundance of all viral groups followed the same dynamics/pattern with time and space. Viral abundance was linearly related to bacterial abundance rather than to phytoplankton abundance. The bacterial abundance explained about 90% of the variation in viral abundance, which suggests that bacteria serve as the major hosts and drivers of viruses and their dynamics, although in situ molecular approaches are key to understand and identify specific host–virus relationships.
The prevalence of P limitation throughout the study period perhaps led to the observed dominance of low-nucleic-acid bacterial subgroups, surpassing their high-nucleic-acid counterparts by approximately two orders of magnitude. Their small size and less flexible genomes offer a competitive advantage to harness nutrients at low concentrations (k strategist) for their survival in oligotrophic/nutrient-limited aquatic environments [42]. The higher proportion of heterotrophic activity ascribed to the low-nucleic-acid bacterial community has been reported in freshwater [43] and marine systems [44]. The virus-to-bacterium ratio (VBR) provides insight on the interactions between bacteria and viruses. Despite the presence of high viral abundances (>109 VLP L−1), the low VBR observed, coupled with its lack of variation over time and space, suggests a stable state for the community. This stability may be attributed to the presence of dormant bacterial communities with low metabolic activity, which in turn promote the growth of strains that are not recognized by phages [45]. Other factors such as viral decay rates, non-specific adsorption of viruses to particles or phage resistance strains could also contribute to the low VBR [46].
Our primary focus was on viral lytic infections, specifically excluding dormant lysogeny, as this directly relates to the viral shunt phenomenon. By utilizing the FVIC estimates, we determined that viral infections affected approximately 6% to 33% of the bacterial standing stocks. Notably, we observed high levels of cell infection in the euphotic zone, which aligned with the estimates of bacterial and viral abundance [10,47,48]. On average, viruses accounted for approximately 35% of bacterial mortality, with peak destruction rates reaching up to 65% in the euphotic zone, which is consistent with reports from meso-eutrophic systems [49,50]. We observed evidence of the density-dependent regulation of viral infection that was consistent with the “killing the winner” hypothesis, rather than the lysis of susceptible communities. This was supported by a significant relationship between viral abundance and infection, indicating that higher viral densities were associated with increased rates of infection. Assuming that it is the host density that triggers viral activity [51], the correlations of viral-induced mortality with viral abundance and bacterial carrying capacities indicates that viruses have greater effects once bacteria reach high abundances. Group-specific activities of a virus sub-population were never associated with a particular bacterial population. A significant relationship between viral infection and the C:P ratio indicated that P availability was a crucial for viral growth that is closely linked to host productivity [16].
BCM plays a crucial role in the functioning of aquatic ecosystems as it influences the remineralization of nutrients and the flow of carbon. In Naussac reservoir, there is evidence of an uncoupling between the two bacterial processes (bacterial respiration and bacterial production), leading to variability in BCM (ranging from 7% to 32%) [18,52,53]. This variability could be attributed to shifts in bacterial activity (cell maintenance versus biomass production) or changes in the bacterial community composition driven by seasonal fluctuations in nutrient regimes, which are common in freshwater systems. Among the environmental factors that regulate bacterial carbon metabolism (BCM), the availability of dissolved organic matter (DOM) has received more emphasis, as has temperature to a certain extent [54,55]. Previous studies comparing lakes of different trophic statuses have shown that eutrophic systems tend to have higher BCM values than oligotrophic systems [56]. This is attributed to the higher availability of organic substrates, which support bacterial growth and activity [57]. However, our investigation revealed a strong correlation between viral parameters and bacterial metabolic parameters, whereas a weaker association was observed between these parameters and abiotic factors such as DOM and temperature. These results indicate the possible role of mortality agents such as viruses in the regulation of BCM.
Viral infections had antagonistic relationship with BCM, primarily through their negative correlation with bacterial production. This negative correlation was accompanied by a significant increase, up to three-fold, in respiration rates compared with production, since the processing of viral lysates by non-targeted bacterial communities requires a high energy expenditure. Consequently, the natural bacterial community channeled the assimilated organic matter towards cell maintenance rather than biomass synthesis. The reduction in BCM mediated by viral activity has been reported in both marine [58,59] and freshwater systems [20,60]. Experimental studies conducted in pelagic environments have also demonstrated a decrease in BCM with an increase in viral shunt [16]. These findings hold true even under severe phosphate limitation, where viral lysis products failed to stimulate bacterial production and hence BCM, instead leading to an increase in respiration rates [58]. In such scenarios, viruses enhance the role of bacteria as oxidizers of organic matter and producers of CO2 [61].
In Naussac reservoir, the high bacterial respiration rate amidst the high viral infection resulting in low BCM, could be due to the poor quality of DOM, which is due to insufficient P levels. Cellular debris that is released following lysis stimulates the growth of non-targeted cells and may be a source of refractory matter that is relatively low in phosphorus and is not repurposed for viral production. The importance of P in stimulating viral production has been experimentally highlighted [16,62]. Bacteria are a rich source of N and P; however, the quality and quantity of P released from infected bacterial cells following lysis are poor due to the packing of P in new viral progeny. The elemental stoichiometry in viral lysis products is poor in P compared with uninfected bacterial cells. Unlike C and N, which are released as cellular debris, phosphorus was predicted to be mostly bound within virus particles. In such a scenario of strong inorganic nutrient limitation, heterotrophic nanoflagellate grazing generates growth resources for bacteria via the effective release of labile substrates rich in N and P that can stimulate viral production. The existence of synergy between grazer, bacterial and viral activities has been reported in freshwater systems, especially during periods of nutrient limitation [38,63]. In most sampling occasions, the percentage of virally infected bacterial communities exceeded a threshold of 10%. This finding is consistent with our previous research conducted by Keshri et al. [64], which demonstrated that such high infection rates can significantly impact the structure of bacterial communities, potentially influencing BCM. Therefore, viruses can have an indirect influence on BCM through elicited higher respiratory demands that could eventually be linked to substrate supply.
The findings of this study underscore the notable antagonistic relationship between lytic viruses and BCM in a temperate freshwater reservoir. The study revealed that the inhibition of bacterial growth by viruses led to heightened respiratory activity in the studied phosphate-limited system. To further explore the role of phosphate in influencing virus–bacteria interactions, it is recommended to conduct experimental laboratory investigations. These experiments could involve enriching water samples with phosphate to track changes in viral and bacterial metabolic parameters while considering bacterial diversity and community composition. This approach would provide valuable insights to better understand the dynamics of lytic viruses and their impact on BCM in freshwater reservoirs.

Supplementary Materials

The following supporting information can be downloaded at: https://www.mdpi.com/article/10.3390/applmicrobiol3040095/s1, Figure S1: Variation in euphotic depth in Naussac reservoir during the studied period. Figure S2: Vertical column profiles of water temperature and dissolved oxygen concentration at Naussac reservoir during the study period (2017 and 2018). Figure S3: Regression analyses between bacterial and viral abundances in Naussac reservoir. Figure S4: Regression analyses between C:P ratio and estimates of bacterial carbon metabolism (BCM %) in Naussac reservoir.

Author Contributions

Conceptualization, A.S.P.R. and T.S.-N.; methodology, A.S.P.R., J.C. and F.P.; writing and editing: A.S.P.R. and T.S.-N.; coordination of sampling and chemical data analyses: M.-E.M. and A.T.; data analyses, A.S.P.R. All authors actively participated in the writing and revision of the manuscript. All authors have read and agreed to the published version of the manuscript.

Funding

This research received no external funding.

Institutional Review Board Statement

Not applicable.

Informed Consent Statement

Not applicable.

Data Availability Statement

Data is contained within the article or Supplementary Materials.

Acknowledgments

We are grateful to the personnel of ATHOS Environnement (Clermont Ferrand, France) for their technical support and participation in this study. We thank the technological platform CYSTEM platform UCA-PARTNER at Laboratoire Microorganismes: Génome et Environnement (University Clermont Auvergne, UCA, France) for their expertise in flow cytometry and transmission electron microscopy analyses. We appreciate the reviewers for their time, effort and valuable contributions to this manuscript.

Conflicts of Interest

The authors declare no conflict of interest.

References

  1. Schweichhart, J.S. Prokaryotic viruses: Intriguing players in the aquatic stream. In Reference Module in Earth Systems and Environmental Sciences; Elsevier: Oxford, UK, 2021. [Google Scholar] [CrossRef]
  2. Jacquet, S.; Zhong, X.; Peduzzi, P.; Thingstad, T.F.; Parikka, K.J.; Weinbauer, M.G. Virus interactions in the aquatic world. In Viruses of Microorganisms; Hylan, P., Abedon, S.T., Eds.; Caister Academic Press: Poole, UK, 2018; Chapter 6; pp. 115–142. [Google Scholar]
  3. Zhang, Q.Y.; Gui, J.F. Diversity, evolutionary contribution and ecological roles of aquatic viruses. Sci. China Life Sci. 2018, 61, 1486–1502. [Google Scholar] [CrossRef] [PubMed]
  4. Weinbauer, M.G.; Höfle, M.G. Significance of viral lysis and flagellate grazing as factors controlling bacterioplankton production in a eutrophic lake. Appl. Environ. Microbiol. 1998, 64, 431–438. [Google Scholar] [CrossRef] [PubMed]
  5. Pradeep Ram, A.S.; Palesse, S.; Colombet, J.; Thouvenot, A.; Sime-Ngando, T. The relative importance of viral lysis and nanoflagellate grazing for prokaryote mortality in temperate lakes. Freshw. Biol. 2014, 59, 300–311. [Google Scholar]
  6. Berdjeb, L.; Pollet, T.; Domaizon, I.; Jacquet, S. Effect of grazers and viruses on bacterial community structure and production in two contrasting trophic lakes. BMC Microbiol. 2011, 11, 88. [Google Scholar] [CrossRef] [PubMed]
  7. Tsai, A.-Y.; Gong, G.-C.; Sanders, R.W.; Huang, J.-K. Contribution of viral lysis and nanoflagellate grazing to bacterial mortality in the inner and outer regions of the Changjiang river plume during summer. J. Plankt. Res. 2013, 35, 1283–1293. [Google Scholar] [CrossRef]
  8. Fischer, U.; Velimirov, B. High control of bacterial production by viruses in a eutrophic oxbow lake. Aquat. Microb. Ecol. 2002, 27, 1–12. [Google Scholar] [CrossRef]
  9. Pradeep Ram, A.S.; Colombet, J.; Perriere, F.; Thouvenot, A.; Sime-Ngando, T. Viral regulation of prokaryotic carbon metabolism in a hypereutrophic freshwater reservoir ecosystem (Villerest, France). Front. Microbiol. 2016, 7, 81. [Google Scholar] [CrossRef]
  10. Shen, S.; Shimizu, Y. Seasonal variation in viral infection rates and cell sizes of infected prokaryotes in a large and deep freshwater lake (Lake Biwa, Japan). Front. Microbiol. 2021, 12, 624980. [Google Scholar] [CrossRef]
  11. del Giorgio, P.A.; Cole, J.J. Bacterial growth efficiency in natural aquatic ecosystems. Annu. Rev. Ecol. Syst. 1998, 29, 503–541. [Google Scholar] [CrossRef]
  12. Kritzberg, E.S.; Langenheder, S.; Lindstrom, E.S. Influence of dissolved organic matter source on lake bacterioplankton structure and function-implications for seasonal dynamics of community composition. FEMS Microb. Ecol. 2006, 56, 406–417. [Google Scholar] [CrossRef]
  13. Berman, T.; Yacobi, Y.Z.; Parparov, A.; Gal, G. Estimation of long-term respiration and growth efficiency in Lake Kinneret. FEMS Microbiol. Ecol. 2010, 71, 351–363. [Google Scholar] [CrossRef] [PubMed]
  14. Comte, J.; del Giorgio, P.A. Links between resources, C metabolism and the major components of bacterioplankton community structure across a range of freshwater systems. Environ. Microbiol. 2009, 11, 1704–1706. [Google Scholar] [CrossRef]
  15. Amado, A.M.; Meirelles-Pereira, F.; Vidal, L.O.; Sarmento, H.; Suhett, A.L.; Farjalla, V.F.; Cotner, J.B.; Roland, F. Tropical freshwater ecosystems have lower growth efficiency than temperate ones. Front. Microbiol. 2013, 4, 167. [Google Scholar] [CrossRef] [PubMed]
  16. Motegi, C.; Nagata, T.; Miki, T.; Weinbauer, M.G.; Legendre, L.; Rassoulzadegan, F. Viral control of bacterial growth efficiency in marine pelagic environments. Limnol. Oceanogr. 2009, 54, 1901–1910. [Google Scholar] [CrossRef]
  17. Xu, J.; Jing, H.; Sun, M.; Harrison, P.J.; Liu, H. Regulation of bacterial metabolic activity by dissolved organic carbon and viruses. J. Geophys. Res. Biogeosci. 2013, 118, 1573–1583. [Google Scholar] [CrossRef]
  18. Pradeep Ram, A.S.; Sime-Ngando, T. Differential effects of viruses on growth efficiency of freshwater bacterioplankton in eutrophic relative to non-eutrophic lakes. Microorganisms 2023, 11, 384. [Google Scholar] [CrossRef] [PubMed]
  19. Zhang, R.; Wei, W.; Cai, L. The fate and biogeochemical cycling of viral elements. Nat. Rev. Microbiol. 2014, 12, 850–851. [Google Scholar] [CrossRef]
  20. Maurice, C.F.; Bouvier, T.; Comte, J.; Guillemette, F.; del Giorgio, P.A. Seasonal variation of phage life strategies and bacterial physiological states in the three northern temperate lakes. Environ. Microbiol. 2010, 12, 628–641. [Google Scholar] [CrossRef]
  21. Wetzel, R.G.; Likens, G.E. Limnological Analysis, 2nd ed.; Springer: New York, NY, USA, 1995. [Google Scholar]
  22. APHA. Standard Methods for the Examination of Water and Wastewater, 20th ed.; American Public Health Association: Washington DC, USA, 1998. [Google Scholar]
  23. Kosten, S.; Huszar, V.L.M.; Mazzeo, N.; Scheffer, M.; Sternberg, L.S.L.; Jeppesen, E. Lake and water shed characteristics rather than climate influence nutrient limitation in shallow lakes. Ecol. Appl. 2009, 19, 1791–1804. [Google Scholar] [CrossRef]
  24. Davis, C.E.; Blackbird, S.; Wolff, G.; Woodward, M.; Mahaffey, C. Seasonal organic matter dynamics in a temperate shelf sea. Prog. Oceanogr. 2019, 177, 101925. [Google Scholar] [CrossRef]
  25. Brussaard, C.; Payet, J.P.; Winter, C.; Weinbauer, M. Quantification of aquatic viruses by flow cytometry. In Manual of Aquatic Viral Ecology; Wilhelm, S.W., Weinbauer, M.G., Suttle, C.A., Eds.; ASLO: San Antonio, TX, USA, 2010; Chapter 11; pp. 102–109. [Google Scholar]
  26. Kirchman, D.L. Calculating microbial growth rates from data on production and standing stocks. Mar. Ecol. Prog. Ser. 2002, 233, 303–306. [Google Scholar] [CrossRef]
  27. Jugnia, L.B.; Tadonléké, R.D.; Sime-Ngando, T.; Devaux, J. The microbial food web in the recently flooded reservoir: Diel fluctuations in bacterial biomass and metabolic activity in relation to phytoplankton and flagellate grazers. Microb. Ecol. 2000, 40, 317–329. [Google Scholar] [CrossRef] [PubMed]
  28. Carignan, R.; Blais, A.M.; Vis, C. Measurement of primary production and community respiration in oligotrophic lakes using the Winkler method. Can. J. Fish. Aquat. Sci. 1998, 55, 1078–1084. [Google Scholar] [CrossRef]
  29. Weinbauer, M.G.; Winter, C.; Höfle, M.G. Reconsidering transmission electron microscopy-based estimates of viral infection of bacterioplankton using conversion factors derived from natural communities. Aquat. Microb. Ecol. 2002, 27, 103–110. [Google Scholar] [CrossRef]
  30. Binder, B. Reconsidering the relationship between virally induced bacterial mortality and frequency of infected cells. Aquat. Microb. Ecol. 1999, 18, 207–215. [Google Scholar] [CrossRef]
  31. Carlson, R. A trophic state index for lakes. Limnol. Oceanogr. 1977, 22, 361–369. [Google Scholar] [CrossRef]
  32. Kalinowska, K.; Guspiel, A.; Kiersztyn, B.; Chrost, R.J. Factors controlling bacteria and protists in selected Mazurian eutrophic lakes (North-eastern Poland) during spring. Aquat. Biosys. 2013, 9, 9. [Google Scholar] [CrossRef]
  33. Wetzel, R.G. Limnology: Lake and River Ecosystems, 3rd ed.; Academic Press: San Diego, TX, USA, 2001; 1006p. [Google Scholar]
  34. Guildford, S.J.; Hecky, R.E. Total nitrogen, total phosphorus, and nutrient limitation in lakes and oceans: Is there a common relationship? Limnol. Oceanogr. 2000, 45, 1213–1223. [Google Scholar] [CrossRef]
  35. Allesson, L.; Andersen, T.; Dorsch, P.; Eiler, A.; Wei, J.; Hessen, D.O. Phosphorous availability promotes bacterial DOC-mineralisation, but not cumulative CO2-production. Front. Microbiol. 2020, 11, 569879. [Google Scholar]
  36. Makino, W.; Cotner, J.B. Elemental stoichiometry of a heterotrophic bacterial community in a freshwater lake: Implications for growth- and resource-dependent variations. Aquat. Microb. Ecol. 2004, 34, 33–41. [Google Scholar] [CrossRef]
  37. Scott, J.T.; Cotner, J.B.; LaPara, T.M. Variable stoichiometry and homeostatic regulation of bacterial biomass elemental composition. Front. Microbiol. 2012, 3, 42. [Google Scholar] [CrossRef] [PubMed]
  38. Šimek, K.; Pernthaler, J.; Weinbauer, M.G.; Hornak, K.; Dolan, J.R.; Nedoma, J.; Mašín, M.; Amann, R. Changes in bacterial community composition, dynamics and viral mortality rates associated with enhanced flagellate grazing in a meso-eutrophic reservoir. Appl. Environ. Microbiol. 2001, 67, 2723–2733. [Google Scholar] [CrossRef] [PubMed]
  39. Yang, Y.; Gu, X.; Te, S.H.; Goh, S.G.; Mani, K.; He, Y.; Gin, K.Y.H. Occurrence and distribution of viruses and picoplankton in tropical freshwater bodies determined by flow cytometry. Water Res. 2019, 149, 342–350. [Google Scholar] [CrossRef] [PubMed]
  40. Kopylov, A.I.; Zabotkina, Z.A. Virioplankton as an important component of plankton in the Volga reservoirs. Biosyst. Divers. 2021, 29, 151–159. [Google Scholar] [CrossRef]
  41. Martínez Martínez, J.; Swan, B.K.; Wilson, W.H. Marine viruses, a genetic reservoir revealed by targeted viromics. ISME J. 2014, 8, 1079–1088. [Google Scholar] [CrossRef] [PubMed]
  42. Schattenhofer, M.; Wulf, J.; Kostadinov, I.; Glöckner, F.O.; Zubkov, M.V.; Fuchs, B.M. Phylogenetic characterization of picoplanktonic populations with high and low nucleic acid content in the North Atlantic Ocean. Syst. Appl. Microbiol. 2011, 34, 470–475. [Google Scholar] [CrossRef] [PubMed]
  43. Proctor, C.R.; Besmer, M.D.; Langenegger, T.; Beck, K.; Walser, J.-C.; Ackermann, M.; Burgmann, H.; Hammes, F. Phylogenetic clustering of small low nucleic acid content bacteria across diverse freshwater ecosystems. ISME J. 2018, 12, 1344–1359. [Google Scholar] [CrossRef] [PubMed]
  44. Hu, C.; Chen, X.; Yu, L.; Xu, D.; Jiao, N. Elevated contribution of low nucleic acid prokaryotes and viral lysis to the prokaryotic community along the nutrient gradient from an estuary to open ocean transect. Front. Microbiol. 2020, 11, 612053. [Google Scholar] [CrossRef]
  45. Thingstad, T.F.; Vage, S.; Storesund, J.E.; Sandaa, R.A.; Giske, J. A theoretical analysis of how strain-specific viruses can control microbial species diversity. Proc. Natl. Acad. Sci. USA 2014, 111, 7813–7818. [Google Scholar] [CrossRef]
  46. Parikka, K.J.; Le Romancer, M.; Wauters, N.; Jacquet, S. Deciphering the virus-to-prokaryote ratio (VPR): Insights into virus-host relationships in a variety of ecosystems. Biol. Rev. 2017, 92, 1081–1100. [Google Scholar] [CrossRef]
  47. Peduzzi, P.; Shiemer, F. Bacteria and viruses in the water column of a tropical freshwater reservoirs. Environ. Microbiol. 2004, 6, 707–715. [Google Scholar] [CrossRef] [PubMed]
  48. Pradeep Ram, A.S.; Palesse, S.; Colombet, J.; Sabart, M.; Perriere, F.; Sime Ngando, T. Variable viral and grazer control of prokaryotic growth efficiency in temperate freshwater lakes (French Massif Central). Microbiol. Ecol. 2013, 66, 906–916. [Google Scholar]
  49. Kopylov, A.I.; Kosolapov, D.B.; Zabotkina, Z.A. Virus impact on heterotrophic bacterioplankton of water reservoirs. Microbiology 2011, 80, 228–236. [Google Scholar] [CrossRef]
  50. Parvathi, A.; Zhong, X.; Pradeep Ram, A.S.; Jacquet, S. Dynamics of auto- and heterotrophic picoplankton and associated viruses in Lake Geneva. Hydrol. Earth Syst. Sci. 2014, 18, 1073–1087. [Google Scholar] [CrossRef]
  51. Parsons, R.J.; Breitbart, M.; Lomas, M.W.; Carlson, C.A. Ocean time-series reveals recurring seasonal patterns of virioplankton dynamics in the northwestern Sargasso Sea. ISME J. 2012, 6, 273–284. [Google Scholar] [CrossRef] [PubMed]
  52. Smith, E.M.; Prairie, Y.T. Bacterial metabolism and growth efficiency in lakes: The importance of phosphorus availability. Limnol. Oceanogr. 2004, 49, 137–147. [Google Scholar] [CrossRef]
  53. Garcia-Martin, E.E.; Daniels, C.J.; Davidson, K.; Lozano, J.; Mayers, K.M.J.; McNeill, S.; Mitchell, E.; Poulton, A.J.; Purdie, D.A.; Tarran, G.A.; et al. Plankton community respiration and bacterial metabolism in a north Atlantic shelf sea during spring bloom development (April 2015). Prog. Oceanogr. 2019, 177, 101873. [Google Scholar] [CrossRef]
  54. Apple, J.K.; del Giorgio, P.A. Organic substrate quality as the link between bacterioplankton carbon demand and growth efficiency in a temperate salt-marsh estuary. ISME J. 2007, 1, 729–742. [Google Scholar] [CrossRef]
  55. Vidal, L.O.; Graneli, W.; Daniel, C.B.; Heiberg, L.; Roland, F. Carbon and phosphorus regulating bacterial metabolism in oligotrophic boreal lakes. J. Plank. Res. 2011, 33, 1747–1756. [Google Scholar] [CrossRef]
  56. Biddanda, B.; Ogdahl, M.; Cotner, J. Dominance of bacterial metabolism in oligotrophic relative to eutrophic waters. Limnol. Oceanogr. 2001, 46, 730–739. [Google Scholar] [CrossRef]
  57. Eiler, A.; Langenheder, S.; Bertilsson, S.; Tranvik, L.J. Heterotrophic bacterial growth efficiency and community structure at different natural organic carbon concentrations. Appl. Environ. Microbiol. 2003, 69, 3701–3709. [Google Scholar] [CrossRef] [PubMed]
  58. Bonilla-Findji, O.; Maltis, A.; Lefèvre, D.; Rochelle-Newall, E.; Lemée, R.; Weinbauer, M.; Gattuso, J.-P. Viral effects on bacterial respiration, production and growth efficiency: Consistent trends in the Southern Ocean and the Mediterranean Sea. Deep Sea Res. Part II 2008, 55, 790–800. [Google Scholar] [CrossRef]
  59. Jasna, V.; Pradeep Ram, A.S.; Pravathi, A.; Sime-Ngando, T. Differential impact of lytic viruses on prokaryotic morphopopulations in a tropical estuarine system (Cochin estuary, India). PLoS ONE 2018, 13, e0194020. [Google Scholar] [CrossRef] [PubMed]
  60. Pradeep Ram, A.S.; Colombet, J.; Perriere, F.; Thouvenot, A.; Sime-Ngando, T. Viral and grazer regulation of prokaryotic growth efficiency in temperate freshwater pelagic environments. FEMS Microb. Ecol. 2015, 91, 1–12. [Google Scholar] [CrossRef]
  61. Wilhelm, S.W.; Suttle, C.A. Viruses and nutrient cycles in the sea. Bioscience 1999, 49, 781–788. [Google Scholar] [CrossRef]
  62. Thingstad, T.F.; Øvreas, L.; Egge, J.K.; Lovdal, T.; Heldal, M. Use of non-limiting substrates to increase size; a generic strategy to simultaneously optimize uptake and minimize predation in pelagic osmotrophs? Ecol. Lett. 2005, 8, 675–682. [Google Scholar] [CrossRef]
  63. Weinbauer, M.G.; Hornak, K.; Jezbera, J.; Nedoma, J.; Dolan, J.R.; Simek, K. Synergistic and antagonistic effects of viral lysis and protistan grazing on bacterial biomass, production and diversity. Environ. Microbiol. 2007, 9, 777–788. [Google Scholar] [CrossRef]
  64. Keshri, J.; Pradeep Ram, A.S.; Colombet, J.; Perriere, F.; Thouvenot, A.; Sime-Ngando, T. Differential impact of lytic viruses on the taxonomic resolution of freshwater bacterioplankton community structure. Wat. Res. 2017, 124, 129–138. [Google Scholar] [CrossRef]
Figure 1. Abundances of viral-like particles (green bars) and bacteria (red bars) distinguished by flow cytometry at the sampled depths in Naussac reservoir. Vertical error bars indicate SD (n = 3).
Applmicrobiol 03 00095 g001
Figure 2. Flow cytometry signature of the viral and bacterial populations discriminated by green fluorescence versus side scatter (relative units, r.u.) in a water sample obtained from Naussac reservoir. Viruses were distinguished into three sub-groups, namely V1, V2 and V3, and bacteria into high-nucleic-acid (HNA) and low-nucleic-acid (LNA) sub-populations.
Applmicrobiol 03 00095 g002
Figure 3. Estimates of bacterial production (BP, blue bars), respiration (BR, grey bars) and calculated carbon metabolism (BCM, red circles) at the sampled depths of Naussac reservoir. Vertical error bars indicate SD (n = 3).
Applmicrobiol 03 00095 g003
Figure 4. Transmission-electron-microscopy-based estimates of the frequency of virally infected bacterial cells at the sampled depths of Naussac reservoir. Vertical error bars indicate SD (n = 3).
Applmicrobiol 03 00095 g004
Figure 5. Transmission electron micrographs of myoviruses (AC) and the virally infected bacterial cell morphotype ((D) short rod, (E) elongate rod) from Naussac reservoir.
Applmicrobiol 03 00095 g005
Figure 6. Scatter plot of percentage of virally infected cells with estimates of bacterial carbon metabolism (y = −0.03x2 + 0.53x + 23.66, r = 0.81, p < 0.001) and bacterial respiration (y = 1.11x + 35.39, r = 0.59, p < 0.01).
Applmicrobiol 03 00095 g006
Table 1. Physicochemical characteristics of Naussac reservoir at the studied depths.
ParametersMean (Range) ap Value b
Euphotic (EUP)Aphotic (APH)
Water temperature (°C)15.7 (7.2–24.9)8.1 (4.8–10.2)0.001
pH7.9 (7.5–9.0)7.4 (6.2–7.8)0.003
Turbidity (FNU)1.1 (0.1–3.3)3.7 (0.5–9.0)0.05
Conductivity (µs cm−1)55.7 (43.3–65.9)46.2 (40.7–52.0)0.001
Dissolved oxygen (mg L−1)9.5 (8.1–12.0)6.5 (0.3–11.4)0.02
Ammonium (µmol L−1)4.6 (2.8–11.7)3.4 (2.8–5.0)NS
Nitrate + Nitrite (µmol L−1) 27.1 (14.8–42.4)31.4 (9.9–47.5)NS
Total phosphate (µmol L−1) 0.4 (0.3–0.8)1.6 (0.3–5.2)0.03
Orthophosphate (µmol L−1)0.1 (0.1–0.2)0.8 (0.1–4.8)0.05
Total organic carbon (µmol L−1)447.7 (360.0–525.5)436.2 (370.3–493.9)NS
Dissolved organic carbon (µmol L−1)411.5 (333.6–496.1)400.0 (343.0–472.6)NS
Total dissolved nitrogen (µmol L−1)74.7 (37.5–186.9)59.5 (52.8–77.1)NS
C:N ratio6.8 (2.1–12.9)7.2 (5.4–8.7)NS
N:P ratio82.1 (37.9–139.2)60.6 (4.7–157.3)NS
C:P ratio1127 (524–1440)701 (70–1393)0.05
Chlorophyll-a (µg L−1)3.2 (1.0–9.1)Not determinedNS
a n = 12 for each sampled layer. b Significance level between euphotic and aphotic zone. NS denotes p-values not significant.
Table 2. Microbial characteristics of Naussac reservoir at the studied depths.
ParametersMean (Range) ap Value b
Euphotic (EUP)Aphotic (APH)
Viral abundance (106 VLPs mL−1)9.2 (2.7–28.7)3.3 (1.5–6.5)0.03
V1 viral group (106 VLPs mL−1)7.8 (2.3–22.7)2.6 (1.3–5.2)0.05
V2 viral group (106 VLPs mL−1)1.4 (0.1–5.8)0.2 (0.04–0.7)NS
V3 viral group (106 VLPs mL−1)0.2 (0.04–1.0)0.04 (0.01–0.06)NS
Bacterial abundance (106 cells mL−1)2.1 (0.6–6.4)1.0 (0.4–2.4)0.05
Low-nucleic-acid bacteria (106 cells mL−1)1.6 (0.6–4.7)0.6 (0.4–1.1)NS
High-nucleic-acid bacteria (106 cells mL−1)0.5 (0.003–1.7)0.2 (0.003–0.8)NS
Virus-to-bacteria ratio4.3 (2.4–5.9)3.5 (2.8–4.3)0.02
Bacterial production (µg C L−1 d−1)14.9 (6.5–22.0)15.1 (11.0–19.8)NS
Bacterial respiration (µg C L−1 d−1)59.8 (41.3–82.7)47.8 (30.0–74.1)0.03
Bacterial carbon metabolism (%)20.2 (7.0–31.5)24.5 (18.7–28.5)NS
Frequency of infected cells (%)21.8 (13.9–32.9)11.7 (5.3–17.7)0.001
Burst size (virus cell−1)34.2 (12.0–79.0)18.4 (6.0–43.0)0.001
a n = 12 for each sampled layer. b Significance level between euphotic and aphotic zone. NS denotes p-values not significant.
Table 3. Pearson’s correlation coefficient (r) among microbial parameters (n = 24).
VABAFICBPBR
BA0.95 ***
FIC0.80 ***0.75 ***
BP−0.64 ***−0.58 **−0.75 ***
BR0.51 **0.43 *0.59 **NS
BCM−0.79 ***−0.72 ***−0.81 ***0.67 **−0.71 ***
VA: viral abundance, BA: bacterial abundance, FIC: frequency of infected cells, BP: bacterial production, BR: bacterial respiration, BCM: bacterial carbon metabolism. Level of significance: * p < 0.05, ** p < 0.01, *** p < 0.001. NS = not significant.
Disclaimer/Publisher’s Note: The statements, opinions and data contained in all publications are solely those of the individual author(s) and contributor(s) and not of MDPI and/or the editor(s). MDPI and/or the editor(s) disclaim responsibility for any injury to people or property resulting from any ideas, methods, instructions or products referred to in the content.

