Article

Response of Hypolimnetic Water and Bottom Sediment Microbial Communities to Freshwater Salinization—A Microcosm Experiment

by
Jean-Christophe Gagnon
1,2,
Valérie Turcotte Blais
1 and
Cassandre Sara Lazar
1,2,*
1
Department of Biological Sciences, University of Québec at Montréal, Montreal, QC H3C 3P8, Canada
2
Interuniversity Research Group in Limnology/Groupe de Recherche Interuniversitaire en Limnologie (GRIL), Montreal, QC H3C 3P8, Canada
*
Author to whom correspondence should be addressed.
Appl. Microbiol. 2023, 3(3), 915-934; https://doi.org/10.3390/applmicrobiol3030063
Submission received: 26 June 2023 / Revised: 4 August 2023 / Accepted: 16 August 2023 / Published: 19 August 2023

Abstract

:
The introduction of NaCl in freshwater caused by winter runoffs is a problem whose consequences are still little understood. We sought to analyze the effect of NaCl addition on microbial communities of the hypolimnion and bottom sediments of a Canadian lake. Using microcosms comprising a salinity gradient varying between 0.01 and 3.22 ppt (10–3220 mg/L−1) NaCl, we investigated the effect of salinity on prokaryotic absolute abundance and diversity, following a three- and six-week exposure, and detected the presence of a salinity threshold for microbial communities’ differentiation. We observed a significant decline of bacterial diversity after six weeks in hypolimnetic samples. In the sediments, no clear effect of NaCl was observed on abundance or diversity, despite the presence of variations throughout the salinity gradient. The implication of nutrient fluctuations as well as the co-occurrence of species and inter-domain interactions is likely and would strongly contribute to the development of salt-exposed prokaryotic communities. In hypolimnetic water and sediments, the archaeal and eukaryotic communities differed significantly from 0.93 ppt (930 mg/L−1), while only conclusive at 1.9 ppt (1900 mg/L−1) NaCl in bacteria, meaning that the regulations in place are possibly suitable for the protection of the microbial communities in the hypolimnion and sediment lake layers.

1. Introduction

The salinization of freshwater is a problem that is growing with human development and is increasingly being promoted in research, with studies attempting to detect its short- and long-term effects, such as the freshwater salinization syndrome [1]. While freshwater habitats possess a plethora of different species that can vary from one region to another, what defines and unites them is the salinity level of their environment (1 ppt [2]). Many studies have focused on prokaryotic communities in estuaries [3,4,5,6], and these habitats benefit from a salinity gradient that allows species to gradually acclimate and settle in areas that are adequate to their survival. As a general trend, part of the transition in estuaries is driven by the change in dominance of Betaproteobacteria in freshwater to Alphaproteobacteria as salinity increases. But community composition is not the only factor affected by salinity. While transitions occur along estuarine salinity gradients, a study by Webster et al. [4] reported higher archaeal 16S rRNA abundance in low-salinity brackish sediments than in higher-salinity samples, while representing a larger proportion of the prokaryotic communities at higher salinity. Also, while some lineages proved to be found in a wide array of salinity, some methanogens and ammonia oxidizers were more localized, showing a need for a more specific niches, of which salinity played an important role.
Freshwater lake communities, on the other hand, are accustomed to very little variation in salinity, and a change in ion concentration can trigger an environmental stress that can be hard to overcome, especially in lakes with longer residency time [7]. The response of epilimnion procaryotic communities exposed to sodium chloride (NaCl) intrusion, the most-used deicing salt, has been previously explored [8]. However, hypolimnetic prokaryotes are not safe from the adverse effects of a salinity rise. Being major contributors to nutrient cycling (e.g., nitrogen, methane, carbon dioxide, phosphorus; [9,10,11]), as well as being involved in various food webs, procaryotic communities present in hypolimnetic water and sediments constitute key players of any freshwater habitat. A study by Edmonds et al. [12] on the effect of seawater intrusion on freshwater sediment community structure concluded that salinity had an effect on gene expression and metabolic activity rather than on the general community composition, stating that it did not become “marine-like” over time. However, other studies [13,14,15,16] showed that changes in community composition and richness can occur following salinization of freshwater, but also important loss of taxa, and that long periods of time could be necessary for ecosystemic function equilibration. This disparity in results goes to show that more intensive efforts are necessary to understand the effect of NaCl introduction in freshwater.
Now, as deicing in northern latitudes promotes salt use that leads to a rise to its drainage into nearby habitats [17], freshwater communities are facing seasonal salt intrusion pulses [18]. But, as the effect of a rise in salinity is well documented for eukaryotes [19], its impact on prokaryotic species remains unclear. It is therefore essential to understand the effect generated by NaCl on hypolimnetic and sedimentary bacteria and archaea in a freshwater Laurentian lake, as the loss of α-diversity and/or abundance could have an effect on other species that depend on procaryote grazing and/or on nutrients made bioavailable by microbial communities. Thus, through a microcosm setup, sequencing of bacterial and archaeal 16S and eukaryotic 18S rRNA genes, and digital polymerase chain reactions (dPCR), we aimed to investigate the effect of increasing salinities (0.01–3.22 ppt/10–3220 mg/L−1 NaCl) on the abundance and α- and β-diversity of benthic sedimentary and hypolimnetic archaea and bacteria after three and six weeks of exposure. The duration of the experiment was determined based on a similar experiment with epilimnetic prokaryotic communities [8], as well as to limit biases brought on by long-term conservation in microcosm. To better consider the biotic influences, and to obtain a better global view of hypolimnetic and sedimentary microbial communities’ sensitivity to NaCl, we considered eukaryotic diversity and community composition as an explanatory variable. We also sought to determine if a salinity threshold could be determined, from which a significant transition of the communities can be observed, for comparison purposes with the regulations in place regarding the introduction of NaCl into freshwaters. Transitional salinity values for eukaryotes were assessed as well, to verify and compare their sensitivity to NaCl to prokaryotic communities and see if a domain showed a high level of sensitivity, which would require more monitoring efforts.
We hypothesized that bacterial abundance and diversity would be affected at salinity levels lower than archaea, and that a partial recovery of both abundances and diversities would be possible for both prokaryotic domains after a six-week incubation compared to values observed after a three-week incubation, both in sediments and hypolimnetic water samples. We also hypothesized that a significant transition of bacterial communities would be seen at salinity levels lower than for archaea, for both sampling media, but that the eukaryotic community’s transitional threshold will be lower than both prokaryotic domains. Combined with the previously observed effect on the epilimnion, understanding the impact of NaCl on bacterial and archaeal communities in the hypolimnion and sediments following exposure for up to six weeks will allow us to understand the possible long-term repercussions of its intrusion into freshwater lake habitats.

2. Materials and Methods

2.1. Experimental Setup

During the spring of 2019, sampling was carried out at Lac Croche (Saint-Hippolyte, Quebec, Canada—45°59′17.34″ N/74°0′20.75″ W; May 2019) to collect sediments from the lake, as well as water from the hypolimnion. We first established the depth of the lake to be at 6.3 m. Subsequently, a Van-Dorn-type sampler (Forestry Suppliers Inc., Jackson, MS, USA) was used and submerged to a depth of 5.5 m in order to triple-rinse it and collect hypolimnetic water, which was then poured into 1.14 L glass bottles that were previously autoclaved. Then, a YSI multiparameter probe (model 10102030; Yellow Springs Inc., Yellow Springs, OH, USA) was used to measure initial conductivity, pH, and temperature in the hypolimnion. Finally, a corer was used to extract sedimentary sludge from the lake, resulting in three cores approximately 30 cm deep, topped with water from the hypolimnion. The water and the harvested cores were collected and divided in the laboratory.
In five autoclaved 1.14 L glass bottles, a 300 mL volume of sediment was transferred from the core, divided into 250 mL of compact muddy sediment (composing the mass present in the deeper part of the core) deposited at the bottom of the microcosms and 50 mL of muddy sediment (present in the top layer of cores) deposited on top of the compacted sediments in the microcosms. Subsequently, an 814 mL volume of water from the collected hypolimnion was introduced into the bottles, taking care to limit the mixing of the sediments and making sure not to leave air at the level of the neck. A waiting period of two hours was then applied to allow the sediments which had been suspended to descend to limit a possible bias caused by the binding of the sodium or chloride to the particles in suspension and, therefore, its precipitated sedimentation. Following the waiting period, the sodium chloride concentrations corresponding to a previously carried out mesocosm experiment using water from the epilimnion of Lac Croche [20]—S0 (control treatment with no salt addition; 0.01 ppt or 10 mg/L−1), S5 (0.16 ppt or 160 mg/L−1), S11 (0.93 ppt or 930 mg/L−1), S15 (1.93 ppt or 1930 mg/L−1), and S20 (3.22 ppt or 3220 mg/L−1)—were introduced into the different microcosms. Finally, the bottles were wrapped with aluminum foil to reproduce the absence of light characterizing the hypolimnion and were placed at a temperature of 4 °C to reproduce the temperature of 4.5 °C measured at the sampling site. Salinities and sample names were selected in association with a mesocosm experiment within the same lake (see Gagnon et al. [8] and Astorg et al. [20]) in relation to short- and long-term water quality guidelines in Canada and the US and investigating the effect of NaCl on epilimnion procaryotic and eukaryotic communities and, thus, consolidating the effect of NaCl within the different stratified layers of the lake environment.

2.2. DNA Extraction

Sediment (~10 g) and water (100 mL) samples were extracted from each microcosm using sterile serological pipettes (sediment) and 0.2 µm filter syringes (water) after 3- and 6-week exposure to the NaCl. However, a first sampling of water and sediments was made from the S0 treatment following the creation of the microcosms, thus representing the initial sampling control (T0). The volumes of water extracted from the microcosms were replaced with 100 mL of ultrapure water with adequately adapted salinity to not disturb the incubations from 3 to 6 weeks. DNA was extracted from the collected sediment samples using the DNeasy PowerMax® kit (Qiagen, Hilden, Germany) [21], while water samples were processed using the DNeasy PowerWater® kit by Qiagen ™ [22]. All DNA samples were stored at −20 °C.

2.3. 16S and 18S rRNA Gene Sequencing and dPCR

Sequencing of 16S and 18S rRNA was performed using the Illumina Miseq platform of the Center of Excellence in Research on Orphan Diseases (CERMO, Department of Biological Sciences, UQAM). Primers A340F (5′-CCCTAYGGGGYGCASCAG-3′) and A915R (5′-GTGCTCCCCCGCCAATTCCT-3′) [23] were used for archaeal amplification, while primers B341F (5′-CCTACGGGIGGCIG-3′) and B785R (5′-GACTACHVGGGTATCTAATCC-3′) [24] were used for bacteria. Finally, primers E960Fc (3′-RYRGGCTTAATTTGACTCAACRCG-5′) and NSR1438 (5′-GGGCATCACAG ACCTGTTAT-3′) [25] were used to amplify the 18S eukaryotic genes. The raw sequence data was deposited in NCBI Sequence Read Archive (https://www.ncbi.nlm.nih.gov/sra (accessed on 18 August 2023), under BioProject ID number PRJNA701941 accession numbers SAMN17917569 to SAMN17917634.
The absolute abundance, determined by measuring the copy numbers of the archaeal and bacterial 16S rRNA genes in the different samples, was measured by digital polymerase chain reaction (dPCR) (ThermoFisher, Waltham, MA, USA), with a QuantStudio ™ 3D device [26] using SYBR® Green dye, with a volume of 1 µL DNA sample per chip, following the manufacturer’s instructions [27]. Dilutions (1/10, 1/50) were carried out for certain samples whose absolute abundance was greater than the reading capacity of the device. The final number of 16S rRNA gene copies was then adjusted to represent the number of copies present per liter for water samples and per gram of humid soil for sediment samples. The pairs of bacterial and archaeal primers used in the dPCR were the same as those used for sequencing (B341F–B785R; A340F–A915R). Details about chip loading mixture, primers, and cycle steps are provided in Supplemental Material Tables S1 and S2.

2.4. Bioinformatic and Statistical Analyses

The obtained sequences were processed using the mothur software v.1.44.3 [28]. Archaeal sequences were taxonomically identified using the SILVA v.138 database (Glöckner, Bremen, Germany), to which reference sequences were supplemented to refine the classification (see Liu et al. [29] and Zhou et al. [30]), while bacterial and eukaryotic sequences were associated using the SILVA v.138 database. During the rarefaction process, samples with sequence counts too low (≤500) were removed (archaeal initial water sample; T0_Wat). Other sequences were then grouped by Operational Taxonomic Units (OTUs) using a 97% similarity threshold. The OTU tables were ultimately processed using RStudio [31] and PAST 4.03 software [32].
Raw OTU tables were used to obtain bacterial, archaea, and eukaryotic α-diversity indices (Shannon H) using the phyloseq package in R [33] (Bioconductor v3.12). The obtained α diversities, as well as absolute abundance, were used as the dependent variable in linear regressions, with the NaCl concentrations as the independent variable, and a regression was carried out using the lm function. A rarefaction (0.9 × min) as well as a transformation (Hellinger) were performed on the raw OTU tables, using the vegan (v2.5-7, [34]) and phyloseq packages. The tables thus obtained were used to produce the Principal Coordinate Analysis (PCoA) of bacterial, archaeal, and eukaryotic communities, using a Bray–Curtis dissimilarity index. The two first axes from the PCoAs (Table S3) were then used as a variable for further analysis as a proxy for community structure. Distance-based redundancy analysis (db-RDA) was applied to the distance matrices using the capscale function from the vegan package, with explanatory variables (salinity, bacterial and archaeal abundance, archaeal, bacterial, and eukaryotic diversity) and the addition of the two first PCoA axes from the other domains, following a normalization on all variables to approach normal distribution. The significance of constraints was assessed using the anova function from the vegan package, with 200 permutations. The most significant variables were then used as an input within the framework of a variance partitioning analysis (varpart function, vegan package) to assess their unique and shared contributions to the different communities’ compositional changes. The significant variables obtained within the db-RDA were also used to produce a linkage tree analysis (LINKTREE), using the PRIMER v.6 software package [35] to associate thresholds of imputed significant variables with the differentiation of communities.
Clusters of samples were created based on β-diversity’s repartition obtained within the framework of the PCoA and LINKTREE analysis and were subjected to a one-way permutational analysis of variance (one-way PERMANOVA), using normalized and transformed tables, the Bray–Curtis dissimilarity index, and 9999 permutations on the PAST4.03 software (https://www.nhm.uio.no/english/research/resources/past/, accessed 18 August 2023). A similarity percentage analysis (SIMPER) between the different clusters, with Bray–Curtis for dissimilarity index, paired with a Kruskal–Wallis test, were performed on rarefied and transformed OTU tables, using the vegan package and the Simper_pretty and R_krusk functions [36]. The SIMPER aimed at identifying the OTUs that differed significantly between clusters. Finally, correlations (Spearman) between the most abundant classes and orders and the salinity values were carried out using the Phylosmith function [37].

3. Results

3.1. Absolute Abundance and Correlation with Salinity Concentrations

Planktonic archaea (Table 1, Supplemental Material Figure S1a) showed an increase across the salinity gradient after three weeks at salinity up to 1.9 ppt NaCl, varying between 4 × 10⁶ and 63 × 106 gene copies/L−1, followed by a decrease to 23 × 106 gene copies/L−1 at 3.22 ppt NaCl. After six weeks, the S0 sample showed an absolute abundance of 14 × 106 gene copies/L−1, while the other samples fluctuated between 587.25 and 17 × 105 gene copies/L−1. For sedimentary archaea, the absolute abundance decreased from 63 × 104 to 21 × 104 gene copies/g−1 across the salinity gradient at T3, while at T6 it varied between 16 × 104 and 40 × 104 gene copies/g−1 between 0.01 and 1.9 ppt NaCl, with 10 × 105 gene copies/g−1 at 3.22 ppt NaCl (Table 1, Supplemental Material Figure S1b). No relationship proved to be significant. All absolute abundance raw values are available in Supplemental Material Table S4.
For the planktonic bacteria, after three weeks the abundances varied between 36 × 106 and 21 × 107 gene copies/L−1 between 0.01 and 1.9 ppt NaCl, and 13 × 108 gene copies/L−1 at 3.22 ppt, while absolute abundances varied from 25 × 106 to 13 × 108 gene copies/L−1 after six weeks. (Table 1, Supplemental Material Figure S2a,). No significant relation was found for water or sedimentary bacteria (Table 1, Supplemental Material Figure S2a,b), with the lowest absolute abundance in sediments being 13 × 104 gene copies/g−1 at 0.16 ppt NaCl exposure, and the highest point at 51 × 105 gene copies/g−1 at 1.9 ppt NaCl, both after a three-week exposure.

3.2. Alpha Diversity Indices and Correlation with Salinity Concentrations

After three weeks, the lowest diversity for planktonic archaeal indices (2.86) was at 0.01 ppt NaCl and was then followed by fluctuations from 2.96 to 3.05, the highest point being at 1.9 ppt NaCl. Values after six weeks were consistently lower than at T3 across the salinity gradient except for the sample at 0.01 ppt NaCl, where it reached its highest diversity (3.09) with the lowest diversity index being 2.74 (0.93 ppt NaCl). After three weeks, sedimental archaeal diversity varied from 2.68 (0.01 ppt NaCl) to 2.29 (0.93 ppt NaCl), but the achievement of the lowest point was followed by a rise to indices of 2.45 at 1.9 ppt NaCl and 2.61 at 3.22 ppt NaCl. At T6, the diversity indices were consistently higher than at T3 from 0.01 ppt NaCl to 1.9 ppt NaCl, with H diversity values located between 2.45 and 2.83. At 3.22 ppt, however, diversity was lower than after three weeks for the same salinity, with a value of 2.44. The relationship between NaCl concentrations and planktonic archaeal α-diversity (Table 2, Supplemental Material Figure S3a) was not significant after three or six weeks. In sediments (Table 2, Supplemental Material Figure S3b), all relationships were not found to be significant as well. All calculated Shannon’s H values are made available in Supplemental Material Table S4.
Planktonic bacterial diversity showed low levels of variations throughout the salinity gradient after three weeks, with the highest value at 0.93 ppt NaCl (3.99), while a gradual diversity loss was present after six weeks, from 4.05 to 3, at salinities ranging from 0.16 to 3.22 ppt NaCl. In sediment, bacterial diversity was at its highest at 0.01 ppt NaCl at both sampling times. Diversity values ranged between 5.97 and 5.66 after three weeks, with the lowest value observed at 1.9 ppt NaCl. After six weeks, diversity values were between 6.08 and 5.71, with the lowest value at 1.9 ppt NaCl as well. For planktonic bacteria (Table 2, Supplemental Material Figure S4a), relationships were significant after six weeks (positive) but not in sediments (Table 2, Supplemental Material Figure S4b). These results demonstrate the effect that the presence of NaCl may have on bacterial α-diversity in the lacustrine hypolimnion.

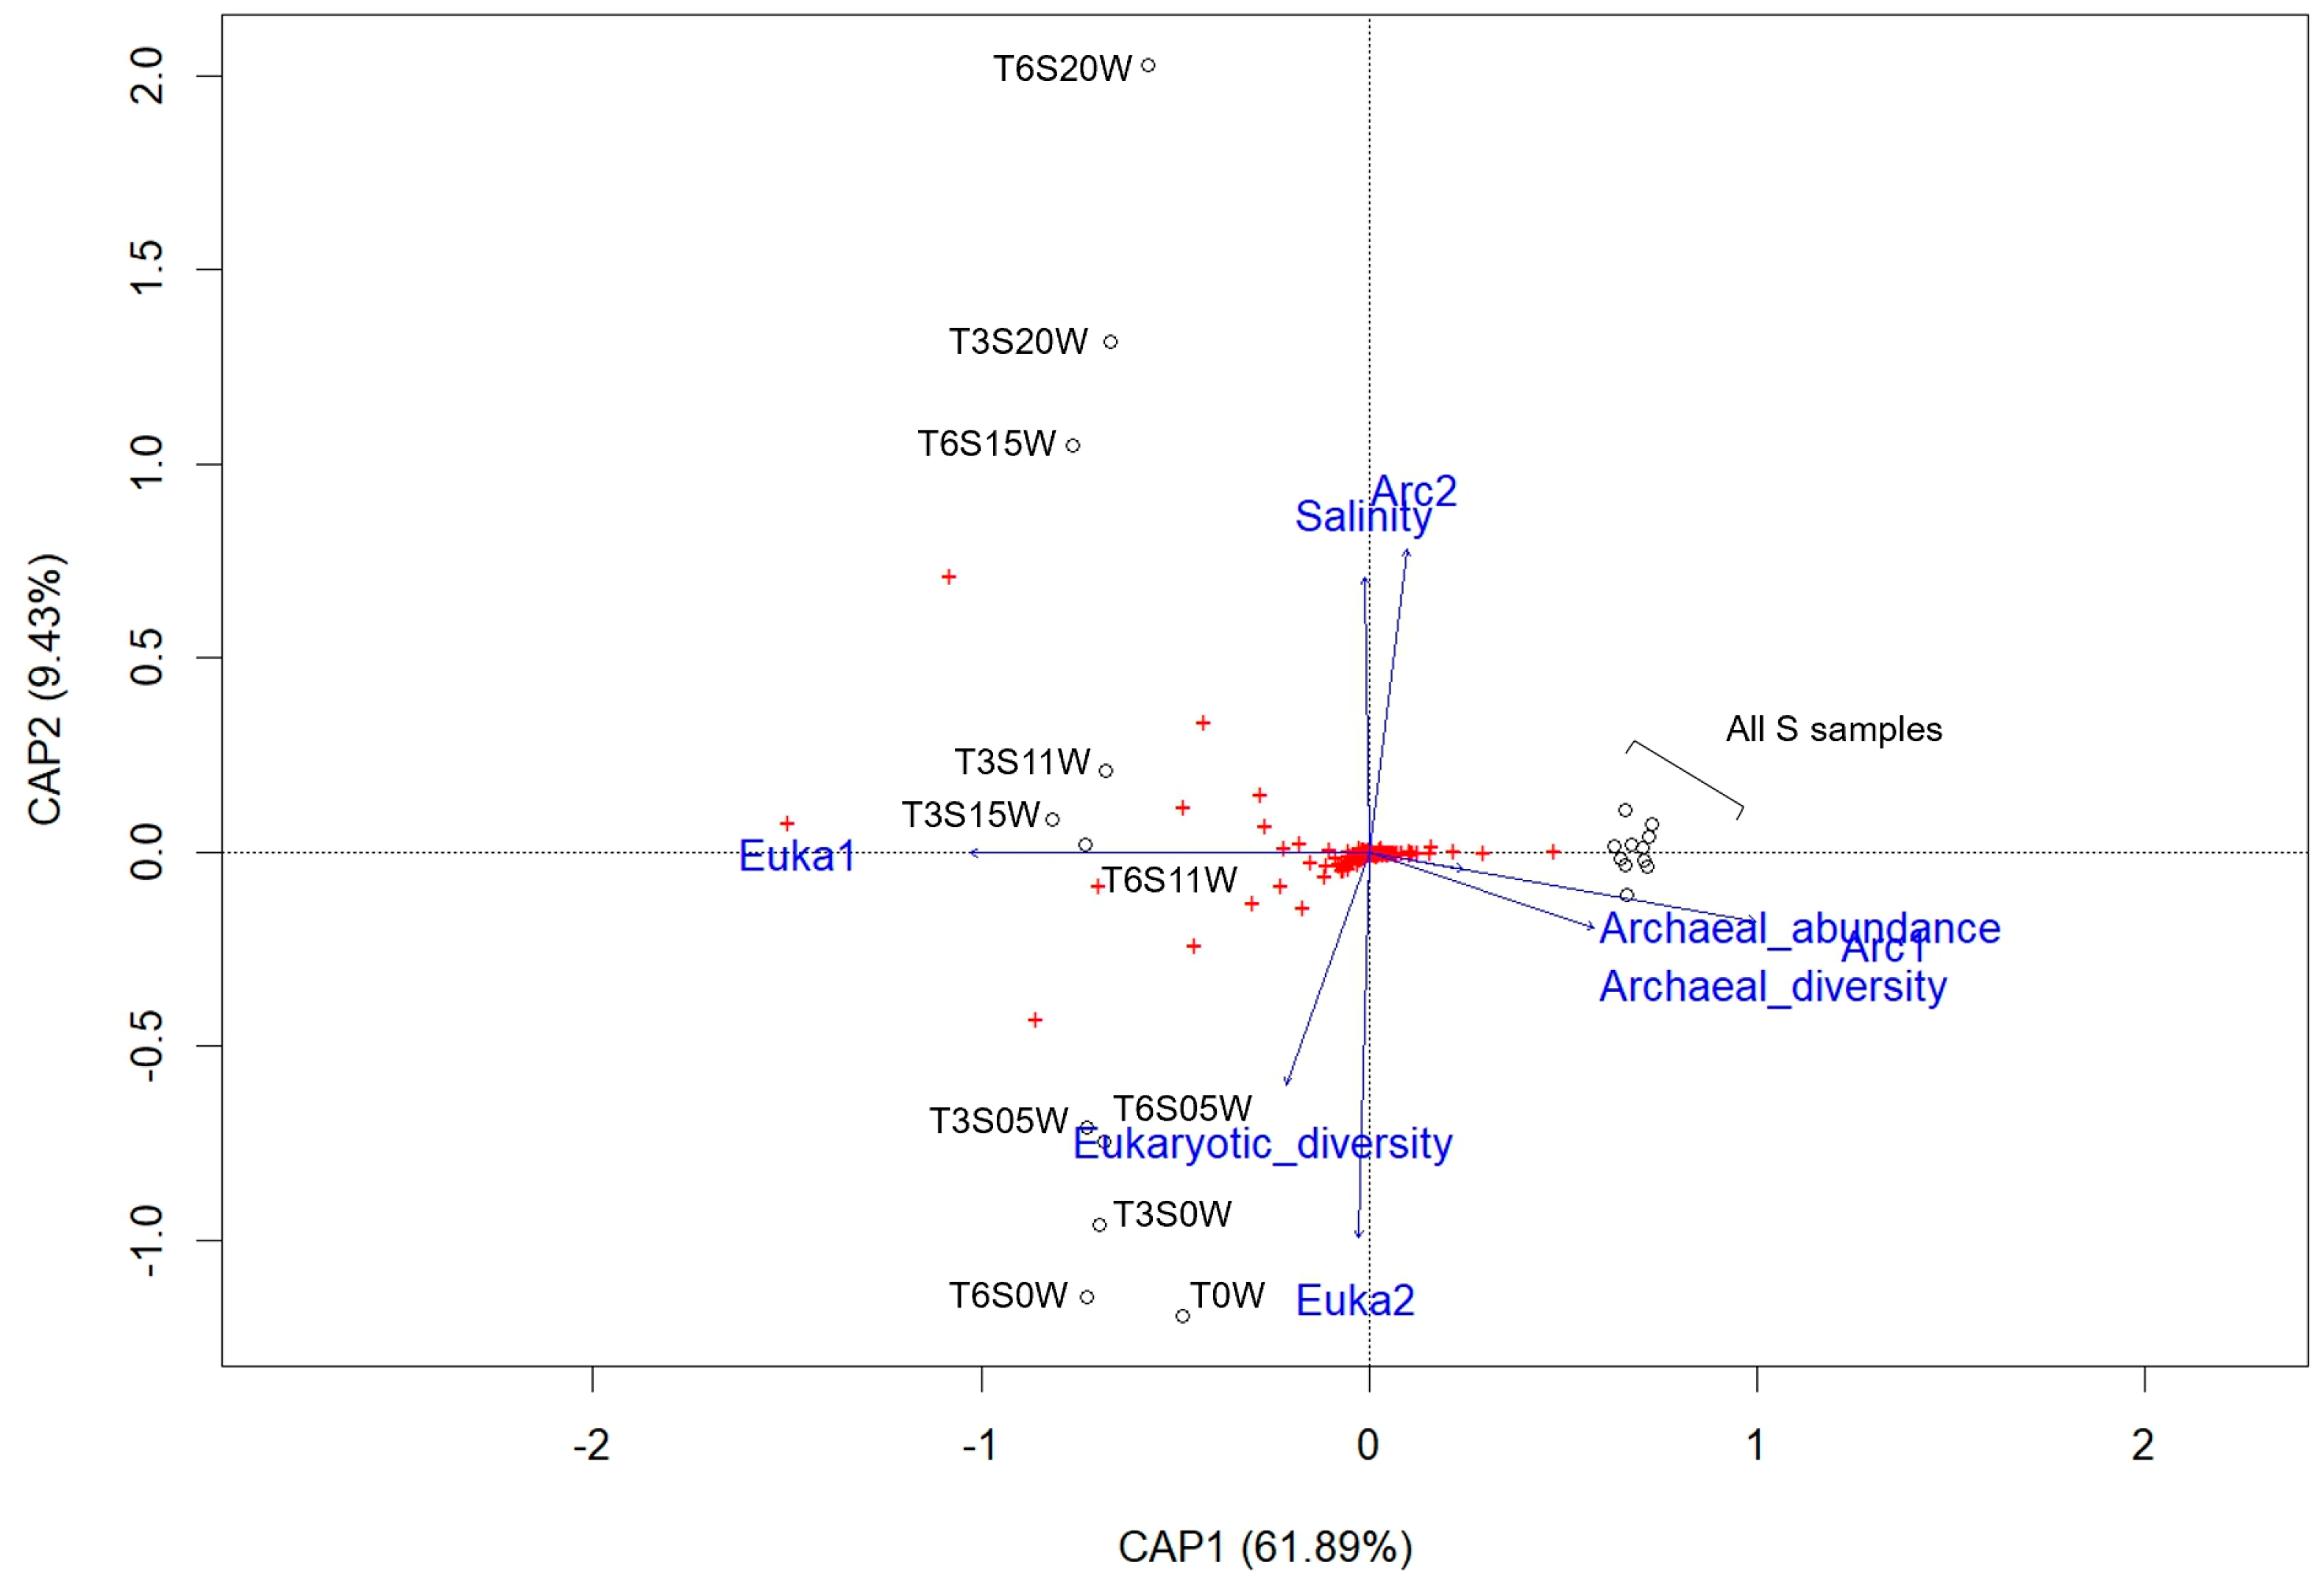
3.3. β-Diversity and Correlation with Environmental Variables

3.3.1. Archaea

The db-RDA plot (Figure 1) shows that the spatial distribution of samples was divided between water and sediment samples on the first axis, while salinity was an important factor influencing the β-diversity for both the water and sediment samples on the second axis. The ANOVA (Supplemental Material Table S5) showed that salinity, bacterial absolute abundances, bacterial α-diversity, and bacterial β-diversity were significant variables explaining archaeal variance, with salinity explaining 3.7% of the variance, and bacterial abundance and bacterial β-diversity taken together explaining 48.2% (Supplemental Material Figure S5a).
Within the archaeal LINKTREE (Supplemental Material Figure S6), node A separates the archaeal water from sediment samples. In the water samples, a first division (H) separates samples S0/S05 from S11-S20 for both T3 and T6, with salinity as the main explanatory variable. Lower salinity samples (S0/S05) were further subdivided (I) with salinity, bacterial abundance, and β-diversity explaining the differentiation. S11, S15, and S20 samples for both times were distinct (J and K). In the sediment samples, a first node (B) separates S0 and S05 of all sampling times from the S11, S15, and S20 samples, with salinity as the main driver. At higher salinities, sample S20 at T3 was separated from all S11, S15, and S20 (T6) samples (E), explained by bacterial β-diversity, while S11 from T6 was split from other samples (F), also explained by bacterial β-diversity. Finally, split G divided S11 and S15 of T3 from S15 and S20 from T6, with the bacterial abundance as the main explanatory variable.

3.3.2. Bacteria

The db-RDA plot (Figure 2) shows a separation of the sediment and water samples on the first axis. While there was little to no spatial distribution along any explanatory variables for the sediment samples, the plot shows a linear repartition of water samples following the salinity gradient on the second axis. The ANOVA (Supplemental Material Table S5) showed that salinity, bacterial absolute abundance, archaeal α-diversity, eukaryotic α-diversity, archaeal β-diversity, and eukaryotic β-diversity were significant variables explaining bacterial variance. Salinity, eukaryotic α-diversity and archaeal β-diversity were selected for variance partitioning, globally explaining 56% of the bacterial variance (Supplemental Material Figure S5b). By itself, the archaeal β-diversity explained 54% of the variance.
Within the LINKTREE analysis (Supplemental Material Figure S7), a first division (A) separated water and sediment samples. A first division within the water samples (B) separated the initial water sample (T0) from all other samples, with the archaeal and eukaryotic α-diversity, as well as archaeal β-diversity, as the main explanatory variables. The S0 and S05 at T3 and T6 were shown to be separated from S11 and S15 at both sampling times, as well as S20 at T3 (D), with the salinity and eukaryotic and archaeal β-diversity as the main drivers. Finally, both S11 were separated from both S15 and S20 at T3 (F), with the salinity and bacterial α-diversity as the main explanatory variables. For the sediment samples, S0 at T3 and T6 as well as S05 at T3 were grouped (H), with the archaeal α-diversity as the main variable. Both S15 and the S20 samples at T6 were separated (I), with eukaryotic α- and β-diversity for explanatory variables. Finally, a last division separated S20 at T3 from both S11 and T05 at T6 (J), explained by salinity, eukaryotic α- and β-diversity, and archaeal α- and β-diversity.

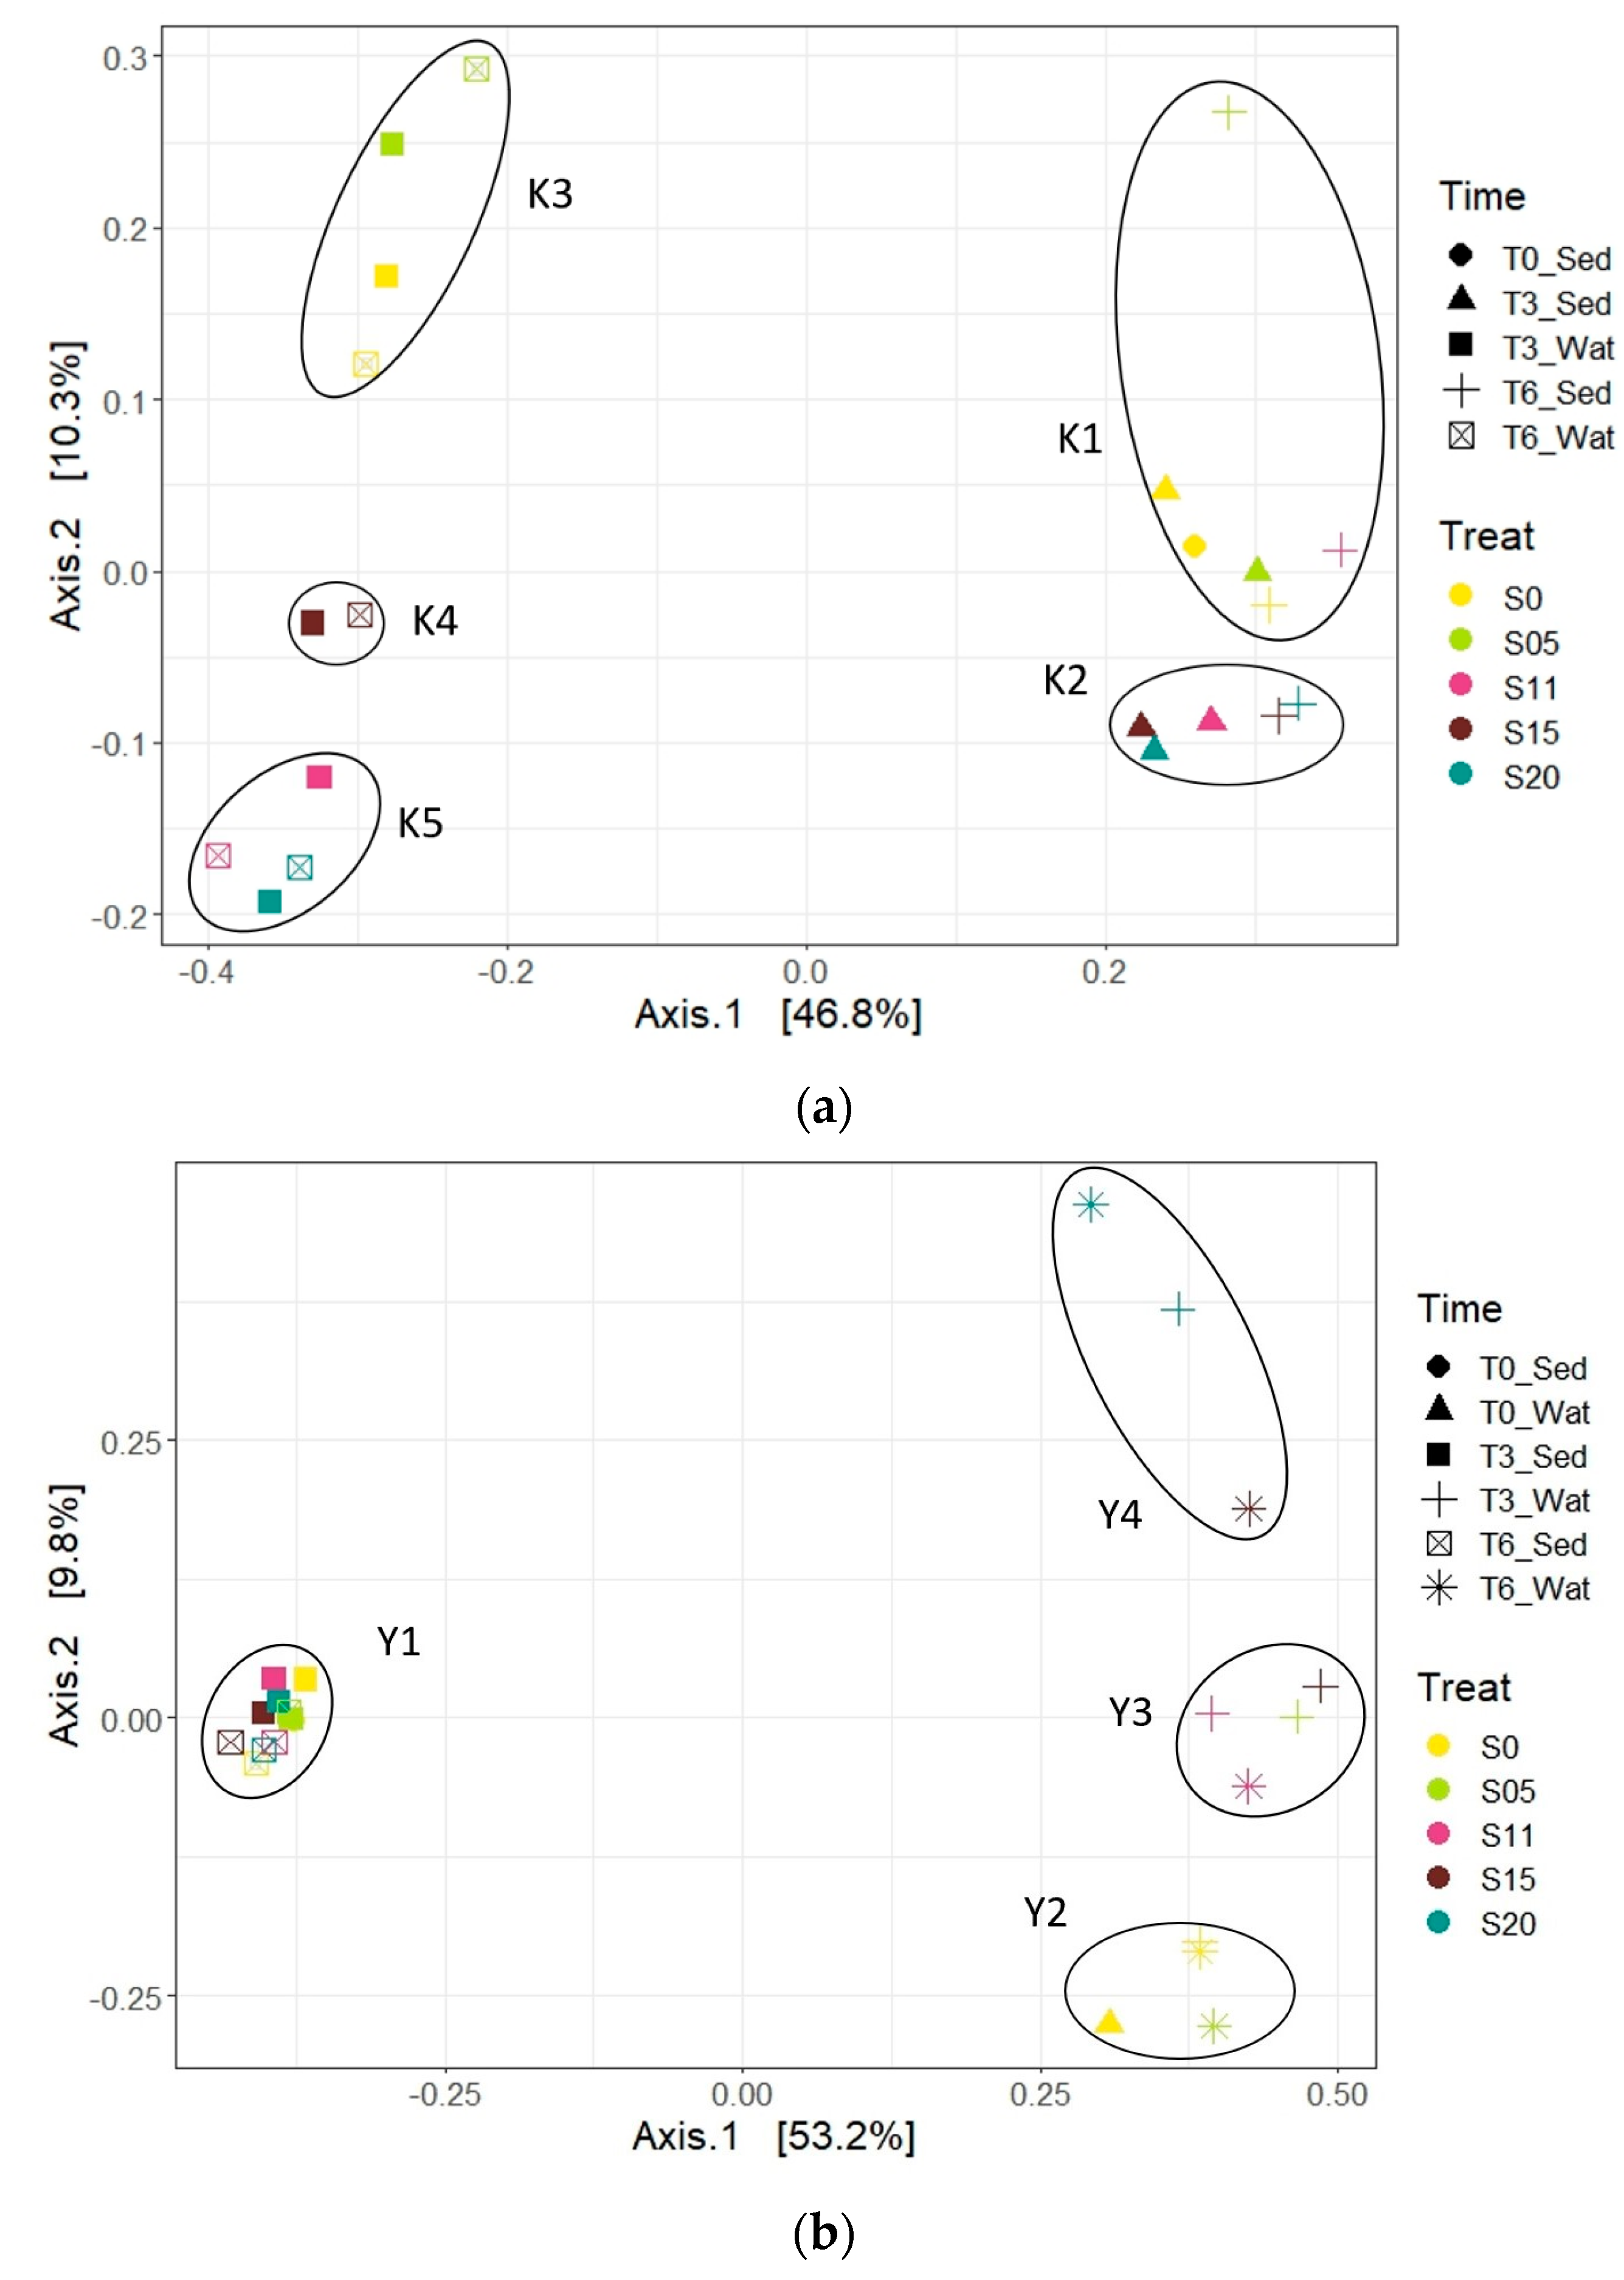
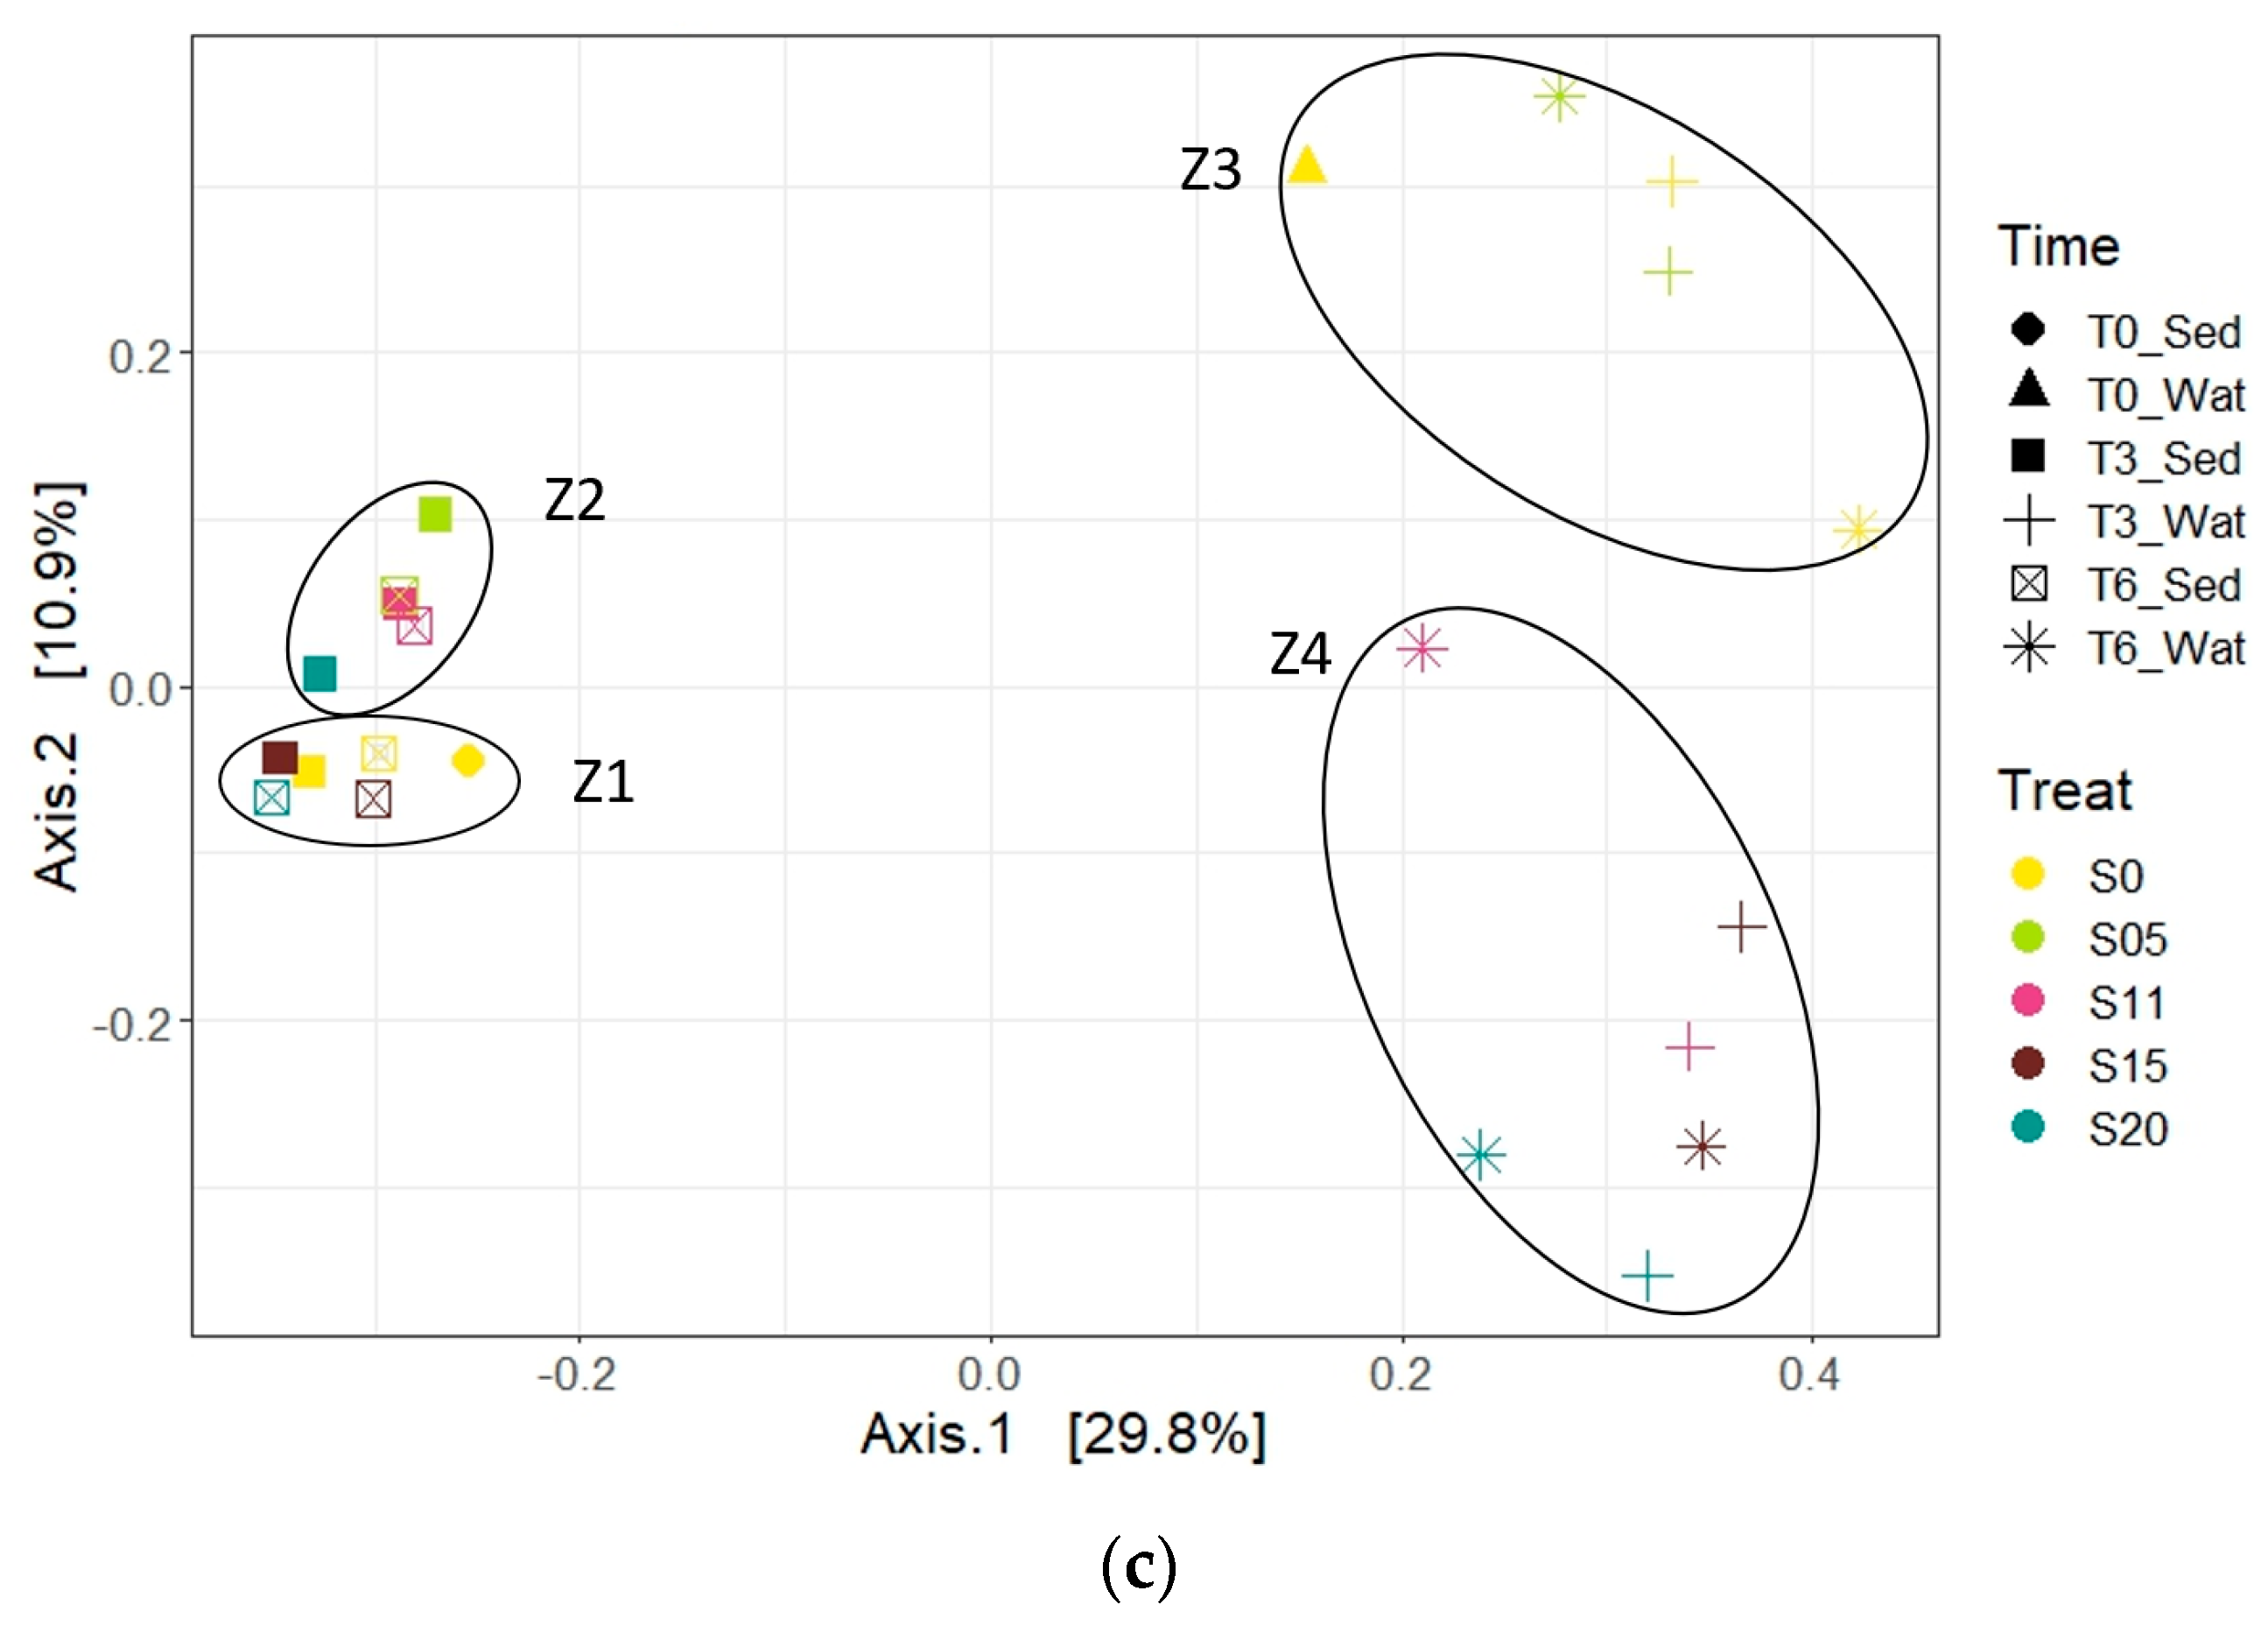
3.4. Microbial Community Structures (β-Diversity)

For the archaeal communities (Figure 3a), we observed five main clusters on the PCoA plot. Clusters K1 (S0–S05, and S11 at T6) and K2 (S11 at T3, and S15–S20) comprised sedimentary samples, while clusters K3 (S0/S05), K4 (S15), and K5 (S11 and S20) consisted of the aquatic samples.
For the bacterial communities (Figure 3b), we identified four clusters. The first cluster (Y1) grouped together all the sediment samples. Clusters Y2 (S0 at T0/T3/T6 and S05 at T6), Y3 (S11, S05, and S15 at T3), and Y4 (S15 at T6 and S20) contained all the water samples.
Finally, for the eukaryotic communities (Figure 3c), we identified four clusters. The first two Z1 (S0, S15, and S20 at T3) and Z2 (S05, S11, and S20 at T3) were composed of sediment samples, while Z3 (S0 and S05) and Z4 (S11-S20) contained the water samples.
All the clusters obtained on the PCoA graph, both in archaea and bacteria as well as in eukaryotes, underwent permutational analysis of variance (PERMNOVA). The results thus obtained are presented in Supplemental Material Table S6, demonstrating that, in archaea, only the fourth cluster (K4) was not significantly different compared to the other clusters. In bacteria, however, all clusters were significantly different.

3.5. Correlations between the Most Abundant Taxa and NaCl Concentrations

Correlation analyses (Spearman) between the 500 most abundant taxa within the archaeal (Supplemental Material Figure S8) and bacterial (Supplemental Material Figure S9) OTU matrices and salinity levels were performed at the class and order levels. Several classes within archaeal communities (Supplemental Material Figure S8a) demonstrated a significant correlation with NaCl concentrations. In sediments, Methanosarcinia was positively correlated (p ≤ 0.05), while Methanomethylicia was negatively correlated (p ≤ 0.05), after three weeks. After six weeks, however, only the Woesearchaeota subgroup 5a was negatively correlated (p ≤ 0.05). In the water samples, Woesearchaeota 22b (p ≤ 0.001) and Woesearchaeota 24 (p ≤ 0.05) showed a positive correlation after three weeks, while the Bathyarchaeota subgroup 18, Bathyarchaeota 5bb, Methanosarcinia, and Woesearchaeota 5b classes showed a negative correlation (p ≤ 0.05) after three weeks. After six weeks, only the Micrarchaeia and Woesearchaeota 22a classes showed significant negative correlations (p ≤ 0.05).
In sedimentary bacteria (Supplemental Material Figure S9), the Bacteroidia and Cyanobacteria classes showed significant positive correlations with the NaCl concentrations (p ≤ 0.05), and Dehalococcoidia a negative correlation (p ≤ 0.05), after three weeks. After six weeks, however, the uncultured TA06 class was positively correlated (p ≤ 0.05) while Spirochaetia was negatively correlated. In the hypolimnetic water, the Gammaproteobacteria and Alphaproteobacteria showed a negative relationship with NaCl (p ≤ 0.001). After six weeks, Desulfobacteria and Gammaproteobacteria exhibited a negative relationship (p ≤ 0.05), while Kryptonia and Syntrophia had a positive relationship (p ≤ 0.05).

3.6. Differential Significance of Microbial Taxa

The juxtaposed SIMPER and Kruskal–Wallis analyzes carried out on archaeal and bacterial matrices are presented in Table S7, showing which taxa best explained the differences in community structure observed on the PCoA plot (clusters). Only the water–water and sediment–sediment cluster analysis were kept, to emphasize the differences brought by salinity rather than by the difference in environment. In the sedimentary archaeal samples, 12 OTUs presented a p-value below the threshold (p = 0.05), with four of them belonging to the Thermoplasmatota phylum (all Thermoplasmata), three being from the Halobacterota phylum (Methanomicrobia and Methanosarcinia), four from the Woesearchaeota phylum (Woese-24 and Woese-5b), and one unclassified. In the water samples, the comparison of cluster K3 and K5 showed seven OTUs as significatively varying, with three being from the Bathyarchaeota phylum (Bathy-5b, Bathy 18, and Bathy-5bb), two from Woesarchaeota (Woese-24 and Woese-5a), one from the Halobacterota phylum (Methanosarcinia), and one being unclassified archaea. The K3 and K4 clusters showed two OTUs, both being from the Woesearchaeota class (both Woese-24). Finally, the SIMPER for clusters K5 and K4 showed three OTUs affiliated with unclassified archaea, three as Woesearchaeota (Woese-13, Woese-24, and Woese-5a), two as Halobacterota (Methanosarcinia, Methanomicrobia) and one Iainarchaeota (Iainarchaeia).
As for the bacterial clusters, only one sedimental cluster was created and thus no comparison could be made. However, from the Y2 and Y3 water sample clusters, four were of the Proteobacteria phylum (all being Gammaproteobacteria, three of them Burkholderiales), one being from the Bacteroidota phylum (Bacteroidia), and one being from the Sva0485 phylum. Clusters Y2 and Y4 showed three Bacteroidota (Bacteroidia and Kryptonia), one Actinobacteriota (Actinobacteria), one Proteobacteria (Gammaproteobacteria and Burkholderiales), and one of the Desulfobacterota phylum (Syntrophia). Finally, the SIMPER on clusters Y3 and Y4 showed four OTUs from the Actinobacteriota phylum (Actinobacteria and Acidimicrobiia), two Bacteroidota (Bacteroidia and Kryptonia), and two Proteobacteria (Methylococcales and Burkholderiales). These results demonstrate that, overall, a differentiation took place between the compared clusters, particularly in water samples.

4. Discussion

In spring 2018, we carried out a study on the effect generated by the introduction of NaCl on the abundance and α- and β-diversities of prokaryotic communities in the freshwater epilimnion of Lac Croche [8,20]. However, as it is also crucial to understand how the introduction of salt affects the hypolimnion and benthic communities in the same lake, we explored in this study the effect generated on the absolute and relative abundance of archaeal and bacterial 16S rRNA genes in hypolimnetic water and sediments from the same lake. As a whole, this study, combined with those produced on the epilimnion, aims to see the effect produced by the intrusion of NaCl in the Laurentian lacustrine systems, which are prey to salinization. Taking into consideration the extent of the impact produced will make it possible to see whether remedial measures are necessary to undertake in order to ensure the well-being of these habitats.

4.1. Aquatic Procaryotic Abundance and Diversity

In aquatic archaea, we did not observe a significant effect of salinity on absolute abundance. However, a decrease was seen at 3.22 ppt (3220 mg/L−1) NaCl, the saltiest environment applied in our study, indicating the possible existence of a limit to their resilience. After six weeks of incubation, the supplemented microcosms all had extremely low absolute abundance values compared to three weeks of exposure. While our results could indicate an effect generated by the incubations in a closed environment, the presence of a relatively high abundance in the microcosm without NaCl supplementation suggests a drastic effect of NaCl on the archaeal biomass.
A similar effect was observed with archaeal α-diversity indices. The observed decrease in α-diversity between the two exposure times implies that the introduction of even a low level of NaCl influenced archaeal α-diversity after a six-week incubation. Other factors such as viral predation (lysis, lysogeny [38]) cannot be ruled out, as these can influence prokaryotic [39] and eukaryotic α-diversity [40]. However, the variance partitioning analysis highlighted the bacterial community’s composition and absolute abundance as important explanatory variables in the general archaeal community composition transition, and consequently its diversity. Indeed, when combined with salinity, the α-diversity and composition of bacterial communities explained 56.66% of archaeal variation seen through the salinity gradient. Such an influence of the interaction between the two domains is not surprising considering that the bacteria–archaea co-occurrence is an important element shaping the structure of planktonic prokaryotic communities [41], even more so than salinity, although the latter may constitute the main environmental variable of this effect. Through the LINKTREE analysis, we observed a major separation between aquatic samples with low salinity (<0.93 ppt/930 mg/L−1) and those with higher salinity (≥0.93 ppt/930 mg/L−1), which was explained by salinity thresholds. Nevertheless, in addition to salinity, bacterial composition, α-diversity, and abundance also explained these subdivisions. Subsequent analysis would be necessary to see the instances of co-occurrence, particularly within the dominating archaeal groups in the hypolimnion.
As for bacteria, an increase in absolute abundance in water samples was observed across the salinity gradient after six weeks compared with results after three weeks in all NaCl-supplemented samples, with the exception of samples at 3.22 ppt (3220 mg/L−1) NaCl, where abundances at both sampling times were very high, suggesting the capacity of some taxa to cope with higher levels of salinity. Although it would be possible for autochthonous hypolimnetic species to show plasticity towards higher ion concentration in their environment, samples dispersion on the second axis of the db-RDA as well as the overall composition would be indicative of a transition effect rather than a simple change in relative abundance. Some species, previously shown to be halotolerant, are only present in water samples at higher salinity, such as Syntrophia [42] and Desulfosporosinus [43,44], implying that changes in environmental conditions led to the creation of new niches.
Despite there being taxa to substitute the loss of indigenous freshwater bacteria, the increase in salinity resulted in a significant detrimental effect on planktonic bacterial α-diversity after 6 weeks. Our results agree with those obtained by Vidal-Durà et al. [45], reporting similar results to those obtained by Campbell and Kirchman [46] and Liu et al. [47], and may attribute the variation in diversity to the influence of riparian inputs in estuaries. However, our study in microcosms did not have any freshwater intrusion and would therefore limit the variations to a few possible causes. Among these could be the direct effect of NaCl on abundant and rare taxa (<2%), the lack of potential metabolic pathways needed to cope with this environmental change [48], or changes in the bioavailability of certain nutrients brought about by the increase in salinity [49].
In addition, and as highlighted previously, microbial interrelations should be considered. By combining salinity with the matrix of archaeal communities as well as eukaryotic α-diversity to measure variance partitioning, it was possible to explain 56% of the bacterial communities’ variance. The bacteria–archaea relationship seems most important for the former, since the archaeal community matrix alone explained 54% of the variance in bacterial communities. Moreover, the LINKTREE analysis presented salinity as a dividing factor between the major division, with archaeal and eukaryotic β-diversity as essential drivers for bacterial β-diversity through the salinity gradient. The loss of certain archaeal groups could have an influence on nutrients cycling and availability (e.g., Bathyarchaeota; nitrogen and sulfur [50]), and the Bathy-6 subgroup, one of the most common taxa in our samples, was shown to be sensitive to salinity when in a freshwater environment [51]. Additionally, the Bathy-6 subgroup contributed to the biosynthesis of cobalamin (vitamin B12) [52], as well as the presence of rocF genes (nitrogen metabolism) in Bathy-6 and Bathy-15, both subgroups present in our study. The drop in the relative abundance of these two subgroups in the water samples, although not significant, could have had an unfavorable effect on the maintenance of bacterial α-diversity. Similarly, the significant decrease in the methanogenic Methanomicrobia in sediments and Methanosarciniales in the water column, despite a significant increase in Methanosarcinia in sediments, may have affected carbon recycling in the microcosms [53], an element that is also essential for bacterial metabolism [54,55]. Our results on the effect of NaCl on the hypolimnetic water microbial communities show that, overall, an effect is present on the bacterial α-diversity, although possibly more intricate than a simple physiological effect. Considering nutrient fluctuations and microbial co-occurrence networks in subsequent studies could shed light on the dynamics at play in archaeal and bacterial α-diversity variations.

4.2. Sedimentary Procaryotic Abundance and Diversity

No clear effect of NaCl on the archaeal abundance in the sediments was seen within our study. Such an effect was not surprising since the introduction of sodium chloride into the sediments would be limited. Indeed, only 1 to 2% of the chloride and sodium dissolved in water typically penetrates sediments [56], usually remaining in solution in water and thus limiting the effect that can be achieved on sedimentary organisms. Many of the most abundant classes and orders in sediment samples, including Methanosarcinia, Methanomicrobia, and Thermoplasmata, exhibit high plasticity with respect to the presence of NaCl in their environment. Methanosaeta (Methanosarcinia) can adapt to salinities up to 1.2 M NaCl (70 ppt/70,000 mg/L−1 NaCl) and are able to produce biofilms [57,58,59]. Methanomicrobiaceae (Methanomicrobiales), as well as Thermoplasmata and Woese-5b, are found in a variety of sediments, whether in freshwater, estuarine, or even saline environments [29,60,61]. However, despite their ability to be halotolerant, salinity is an important regulator of certain archaeal groups, particularly methanogens [62]. With many archaeal taxa being tolerant to salinity, and the low penetration potential of NaCl in sediments, archaea remain sensitive to potential fluctuations in nutrient availability, as well as bacterial community variations (diversity, abundance, and composition), as shown by the LINKTREE. Factors external to salinity should be considered as influential in our study, rather than a single impact of NaCl on archaeal absolute abundance, particularly in view of absolute abundance variations.
Another aspect to consider is the phenomenon of endosymbiosis with eukaryotes, such as protists producing H2 in freshwater sediments. This is the case for some Methanomicrobials [63], including Methanoregula [64] previously shown to associate with Intramacronucleata (Ciliophora), both coincidentally found in all the sediment samples, but which would be most found in tripartite symbiosis with Holosporaceae, a family found in the water sample at T0, and of which several members are endosymbiotic. Although only a small portion of the NaCl would be able to reach the sediments, it can reach the pore waters of surface sediments [65] and thus affect benthic eukaryotes, which are generally more sensitive, particularly micro-invertebrates [66], although organisms inhabiting environments with fluctuating salinity (e.g., estuaries) are capable of greater resistance [67]. Hence, endosymbiosis with sensitive sedimental eukaryotic species would likely have an influence on archaeal communities upon NaCl intrusion in the environment.
There was no significant relation between salinity and sedimentary bacterial abundance. Only a slight increase in absolute abundance between 0.93 and 1.9 ppt (930–1900 mg/L−1) NaCl was noticeable after three weeks; thus, it was not a clear indicator of an effect of salinity. The distribution of the samples on the second axis of the db-RDA suggested the absence of differentiation, without a clear distinction of the effect of NaCl in the dissimilarity. Its effect on sedimental bacterial α-diversity also remains elusive, showing no clear relation with salinity, despite α-diversity values lower than the microcosm without NaCl supplementation in all the microcosms with addition. Although several studies demonstrate a negative effect of salinity on bacterial α-diversity in freshwater sediment [68], estuaries [45], and saline [69] and hypersaline lakes [70], some studies have observed an increase [71] or the absence of an effect [49,72,73] in freshwater and estuarine environments. Overall, our results show that, despite there being variation in archaeal and bacterial α-diversity and absolute abundance throughout the NaCl gradient in sediments, those variations could not be directly linked to NaCl. It would be interesting to see if a higher salinity range could induce more variations in further studies.

4.3. Salinity Threshold for Microbial Community Transition

As diversity and abundance were investigated, we also we tested if certain salinity levels induced significant transitions in microbial community composition, to determine potential salinity thresholds and if one of the microbial domains was more sensitive to NaCl intrusion in sediment and hypolimnetic water. We observed a difference between sediment and water samples. Such a distinction can be explained by several factors, including the difference in environment [74] and the limited capacity of chloride to penetrate the sediments. The oxygen levels, the available nutrients, the associated metabolic pathways, the presence of phytoplankton, and the favored osmoregulatory pathways [48] could have led to the creation of niches within which organisms were adapted [45]. Thus, it was not so surprising to observe such levels of variation within the framework of the PCoA, showing a first axis explaining as much as 53.2% of the variation in bacteria, and up to 46.8% in archaea, indicating the disparity between planktonic microbial communities and the underlying benthic communities.
For aquatic microbial communities, differentiation appeared to be present in all kingdoms at salinities of 0.93 ppt (930 mg/L−1) NaCl and above. The effect achieved on the bacterial communities showed an initial differentiation of samples ranging from 0.93 to 1.9 ppt (930 to 1900 mg/L−1) NaCl. A PERMANOVA performed between clusters, however, did not conclude to a significative differentiation. Seeing that there was graduality to the sample differentiation throughout the salinity gradient that was reflected by the β-diversity, such results demonstrate that despite their level of dissimilarity part of the community remained and tolerated NaCl intrusion. Eukaryotes in water samples showed a sensitivity similar than that of archaea, with a significant transition seen at 0.93 ppt (930 mg/L−1) NaCl. Further analysis would be necessary to determine exactly where the transitional threshold is between 0.16 ppt (0.160 mg/L−1) and 0.93 ppt (930 mg/L−1) NaCl.
Located in-between, organisms present in the sediment–water interface are subject to a higher osmotic pressure than sedimentary organisms [66], and these can therefore affect the results seen in sediment samples, despite a low chloride penetration potential. Thus, although the sedimentary samples have a proximal distribution, variations were present, particularly for archaeal and eukaryotic communities. In addition, while eukaryotes, even fungi [75], are more sensitive to chloride than prokaryotes, studies have shown that bacteria are more sensitive to chlorides [76] and to environmental variations [77] than archaea. Thus, a small proportion of the chloride entering the sediment would have a stronger effect on these domains than on the archaea. However, our results demonstrate that sedimentary archaeal communities differentiated as early as 0.93 ppt (930 mg/L−1) NaCl after three weeks of exposure, while very little variation was observed in bacteria. This effect could be mediated by a lower archaeal richness, which would limit the possibility of intolerant species to remain above a certain salinity threshold [78] and for “seed banks” taxa [79] to thrive in the available niche. Nonetheless, an effect was observed in archaea leading to a significant differentiation of communities, and the LINKTREE analysis for archaeal communities intrinsically links this transition to salinity. While there was little variation in β-diversity in bacteria, the clustering observed within the bacterial LINKTREE does, however, impute the presented shift to other factors, such as archaeal and eukaryotic α-diversity, thus emphasizing the fragile balance between species dynamics and co-occurrences.
Taken together, these results demonstrate that, in hypolimnion and freshwater sediments, archaeal communities could prove be more sensitive than the bacterial communities in freshwater sediments, and that the introduction of sodium chloride at concentrations as low as 0.93 ppt (930 mg/L−1) NaCl would have the potential to lead to a differentiation of microbial communities, particularly in the hypolimnetic layer in the context of our study. Such concentrations would correspond to an approximate introduction of 564.13 mg/L−1 Cl, which is above chronic exposure regulations. Established at 120 mg/L−1 Cl in Canada and 230 mg/L−1 Cl in the United States [66], compliance with regulations regarding chronic exposure to Cl should ensure the sustainability of microbial communities in freshwater hypolimnion and sediments.

4.4. Contributors to the Transition

As we have seen that a transition occurs, different species are at play in this dynamic. Certain archaeal classes appeared only after 6 weeks of incubation (e.g., Woese-8, Woese-22b, Micrarchaeia), and could be a demonstration of the sustainability of said class within the environment provided in the microcosm. However, the negative relationship that these classes have with salinity is a good representation of the multiplicity of factors influencing their establishment. Other species, like Woese-5a, show that not only the level of salinity is to be considered to understand its effect but also the exposition time. If, after three weeks, only a negative relationship was present between Woese-5a and salinity, that relationship turns significant after six weeks. Orders such as the Methanomicrobial showed a significant decline throughout the salinity gradient after three weeks but ended up having a positive relationship after six weeks, and could then demonstrate either the order’s long-term resilience to NaCl introduction, or the substitution to different families within the same order. Many taxa contributed to the observed significant differentiation starting at 0.93 ppt (930 mg/L−1) NaCl in sedimental archaea communities. The SIMPER uncovered a significant shift of relative abundance for Methanomicrobia, decreasing as the salinity rose, while Methanosarcinia’s abundance increased with salinity. These results were surprising, considering that Methanomicrobiaceae, the concerned Methanomicrobia, is known to be a salt-tolerant methanogen [60] that can be found in estuarine mixing zones. While competition for nutrients could occur between dominant methanogenic subpopulation, the incapacity of Methanomicrobiales to use acetate as a carbon source [80], while such is dominant in Methanosaetaceae (Methanosarcinia) [81,82], could be an influential factor, especially the level of acetate bioavailable for methanogenic pathways. As acetoclastic methanogenesis is a dominating pathway in freshwater sediments, composing up to two-thirds of the methane formed [83], a rise in acetate brought on by the fermentation of particulate organic carbon (POC) by bacteria [84] is possible, following eukaryotic, bacterial, and archaeal salt-induced death and lysis [85]. While the decaying process could bring higher levels of acetate, taxa like Methanosarcina would be predominant in high-acetate environments [86] and are shown to be present in all salt-supplemented sedimental samples but are absent from the microcosms without NaCl addition at all sampling times. Conversely, the Methanosaeta taxa is present in all sample and has been shown to benefit from lower acetate bioavailability [87,88,89]. As Methanosarcinia was shown to be correlated with salinity in our experiment, these results highlight the importance of nutrients analysis in further studies. The loss of eukaryotic species could be an important driver for taxa such as Methanomassilicocales, which was shown to contribute to community transition and is dependent on methanol production by phytoplankton [90] but also contributes to aerobic and anoxic microbial demethoxylation of pectin, lignin, and galactans from which phytoplankton assimilate their carbon.
Conversely, as highlighted by the SIMPER analysis, whether for the Methylophilaceae or the Oxalobacteraceae family, the Burkholderiales order was very strongly and negatively correlated with the salinity gradient in the water samples after three weeks. As those results go hand in hand with those of the study carried out on epilimnion communities [8], even more similarities were present. The increase in Bacteroidia at higher salinity, also observed in mesocosms, was reminiscent of that observed in estuaries [4,61]. In the epilimnion, the observed variations could have been influenced by the increase in NaCl concentration but also by the reduction in predation pressure, the eukaryotic α-diversity loss, and the associated decomposition. Although the composition of the bacterial communities between the upper and lower strata of the freshwater environment that makes up Lac Croche may vary, the similarity of variation between some of the major groups composing them suggests that they could be subjected to similar influences, despite lower predation pressure in the anoxic layer [91].

5. Conclusions

The effect of sodium chloride introduction in freshwater on microbial communities is a growing area of research. Our study provided an insight on the effect generated on prokaryotic α-diversity and abundance by different NaCl concentrations. The introduction of NaCl was shown to have a negative effect on hypolimnetic bacterial α-diversity after six weeks. However, the archaeal community’s composition was seen to be an important driving factor in the variation encountered.
In sediments, our results indicated that, despite a weak penetration potential of NaCl, variations occurred for archaeal communities’ absolute abundance after three weeks (66% loss) and for α-diversity after six weeks (2.83 at its highest point to 2.44 at its lowest), despite no direct linearity with NaCl. Analysis of major taxa suggested a high level of tolerance for salinity that was reflected in low β-diversity values, represented by a low spatial distribution along the PCoA axes. In subsequential experiments, nutrient analysis as well as a deeper analysis of rare taxa and a co-occurrence network would provide a better understanding of the dynamics at play.
We also sought to find if a salinity threshold leading to a significant microbial community differentiation was present within the salinity limits of our experiments—for bacteria and archaea, but also for eukaryotes—to check if a domain exhibited a higher level of sensitivity towards salinity. In hypolimnetic water samples, our results indicate that the lowest salinity threshold encountered for microbial communities was 0.93 ppt (930 mg/L−1) NaCl. As this would represent an approximate introduction of 564.13 mg/L−1 Cl, and that the chronic exposure regulations limits are set to 120 mg/L−1 Cl in Canada and 230 mg/L−1 Cl in the United States, compliance with regulations should suffice to protect significant hypolimnetic freshwater archaeal, bacterial, or eukaryotic communities from a dire and potentially irreversible transition. Overall, more environmental practices, such as the use of abrasives as an alternative to de-icing salt and the popularization of white roads [92] in less populated and traveled areas, should help alleviate the introduction of NaCl in freshwater ecosystems and their sediment, and reduce its impact on local fauna and flora.

Supplementary Materials

The following supporting information can be downloaded at: https://www.mdpi.com/article/10.3390/applmicrobiol3030063/s1, Figure S1. (a) Planktonic and (b) sedimentary archaeal absolute abundance regression analysis, with salinity as the independent variable. Figure S2. (a) Planktonic and (b) sedimentary bacterial absolute abundance regression analysis, with salinity as the independent variable. Figure S3. (a) Regression for archaeal α-diversity (Shannon’s H) in water samples and salinity after a three- and six-week incubation in microcosms. (b) Regression for archaeal α-diversity in sediment samples and salinity after a three- and six-week incubation in microcosms. Figure S4. (a) Regression for bacterial α-diversity (Shannon’s H) in water samples, with salinity as the independent variable after a three- and six-week incubation in microcosms. (b) Regression for bacterial α-diversity in sediment samples and salinity after a three- and six-week incubation in microcosms. Figure S5. Variance partitioning analysis explaining variation in archaeal communities for three explanatory factors, separately and together: salinity, bacterial abundance, and the bacterial community composition’s first PCoA axis (Bac1). (b) Variance partitioning analysis explaining variation in bacterial communities for three explanatory factors, separately and together: salinity, archaeal community composition’s first PCoA axis (Arc1), and eukaryotic diversity. Figure S6: Linkage tree (LINKTREE) analysis showing the clustering of archaeal samples constrained by explanatory factors. Figure S7: Linkage tree (LINKTREE) analysis showing the clustering of bacterial microcosm samples constrained by explanatory factors. Figure S8: Correlation (Spearman) between the 500 most abundant archaeal taxa present in the microcosm samples and the salinity values. Figure S9: Correlation (Spearman) between the 500 most abundant bacterial taxa present in the microcosm samples and the salinity values. Table S1: Reaction mixture used for each chip in the context of dPCR. Table S2: Steps carried out during dPCR, depending on the primers used. Table S3: Principal coordinate analysis (PCoA) values for the two first axes of bacterial, archaeal, and eukaryotic OTU tables. Table S4: All abiotic and biotic values used for multivariate analyses, for all samples at all sampling time in the microcosms. Table S5: ANOVA table for explanatory variables used in archaeal, bacterial, and eukaryotic db-RDA. Table S6: PERMANOVA realized on the different archaeal, bacterial, and eukaryotic clusters. Table S7: Results of the similarity percentage (SIMPER) analysis and Kruskal–Wallis tests on the different clusters obtained by the PCoA for the archaeal, bacterial, and eukaryotic communities.

Author Contributions

Conceptualization, J.-C.G. and C.S.L.; methodology, J.-C.G. and C.S.L.; software, C.S.L.; validation, C.S.L.; formal analysis, J.-C.G.; investigation, J.-C.G. and V.T.B.; resources, C.S.L.; data curation, J.-C.G. and C.S.L.; writing—original draft, J.-C.G.; writing—review and editing, J.-C.G. and C.S.L.; visualization, J.-C.G.; supervision, C.S.L.; project administration, C.S.L.; funding acquisition, C.S.L. All authors have read and agreed to the published version of the manuscript.

Funding

This research was supported by a Canada Research Chair (Aquatic Environmental Genomics) and an NSERC Discovery Grant RGPIN-2019-06670 awarded to CSL. We thank the Interuniversity Research Group in Limnology (Groupe de Recherche Interuniversitaire en Limnologie) and their funders, the Fonds de Recherche—Nature et Technologie (FRQNT, Québec).

Data Availability Statement

Sequence data are available on the NCBI Sequence Read Archive (https://www.ncbi.nlm.nih.gov/sra, accessed on 20 January 2019), under BioProject ID number PRJNA701941, under accession numbers SAMN17917569 to SAMN17917634.

Acknowledgments

Thanks to Geneviève Bourret and Cindy Paquette for their incredible help, as well as Steven Kembel, and Catherine Laprise from CERMO.

Conflicts of Interest

The authors declare no conflict of interest.

References

  1. Kaushal, S.; Likens, G.; Pace, M.; Haq, S.; Wood, K.L.; Galella, J.G.; Morel, C.; Doody, T.; Wessel, B.; Kortelainen, P.; et al. Freshwater Salinization Syndrome: Causes, Consequences, and Management. AGU Fall Meet. Abstr. 2018, 2018, H23E-10. [Google Scholar] [CrossRef]
  2. USGS. WSS—Water Science School, 2018. Saline Water and Salinity. Available online: https://www.usgs.gov/special-topics/water-science-school/science/saline-water-and-salinity#overview (accessed on 7 November 2022).
  3. Herlemann, D.P.R.; Labrenz, M.; Jürgens, K.; Bertilsson, S.; Waniek, J.J.; Andersson, A.F. Transitions in bacterial communities along the 2000 km salinity gradient of the Baltic Sea. ISME J. 2011, 5, 1571–1579. [Google Scholar] [CrossRef] [PubMed]
  4. Webster, G.; O’Sullivan, L.A.; Meng, Y.; Williams, A.S.; Sass, A.M.; Watkins, A.J.; Parkes, R.J.; Weightman, A.J. Archaeal community diversity and abundance changes along a natural salinity gradient in estuarine sediments. FEMS Microbiol. Ecol. 2015, 91, 1–18. [Google Scholar] [CrossRef]
  5. Gao, J.; Hou, L.; Zheng, Y.; Liu, M.; Yin, G.; Yu, C.; Gao, D. Shifts in the Community Dynamics and Activity of Ammonia-Oxidizing Prokaryotes Along the Yangtze Estuarine Salinity Gradient. J. Geophys. Res. Biogeosci. 2018, 123, 3458–3469. [Google Scholar] [CrossRef]
  6. Paver, S.F.; Muratore, D.; Newton, R.J.; Coleman, M.L. Reevaluating the Salty Divide: Phylogenetic Specificity of Transitions between Marine and Freshwater Systems. Msystems 2018, 3, e00232-18. [Google Scholar] [CrossRef]
  7. Chapra, S.C.; Dove, A.; Warren, G.J. Long-term trends of Great Lakes major ion chemistry. J. Great Lakes Res. 2012, 38, 550–560. [Google Scholar] [CrossRef]
  8. Gagnon, J.-C.; Astorg, L.; Derry, A.M.; Lazar, C.S. Response of Prokaryotic Communities to Freshwater Salinization. Appl. Microbiol. 2022, 2, 330–346. [Google Scholar] [CrossRef]
  9. Santoro, A.E. Microbial nitrogen cycling at the saltwater–freshwater interface. Hydrogeol. J. 2010, 18, 187–202. [Google Scholar] [CrossRef]
  10. Pernthaler, J.; Rosenberg, E.; DeLong, E.; Lory, S. Freshwater Microbial Communities; Springer: Berlin, Germany, 2013. [Google Scholar] [CrossRef]
  11. Anderson, O.R. Evidence for Coupling of the Carbon and Phosphorus Biogeochemical Cycles in Freshwater Microbial Communities. Front. Mar. Sci. 2018, 5, 20. [Google Scholar] [CrossRef]
  12. Edmonds, J.W.; Weston, N.B.; Joye, S.B.; Mou, X.; Moran, M.A. Microbial Community Response to Seawater Amendment in Low-Salinity Tidal Sediments. Microb. Ecol. 2009, 58, 558–568. [Google Scholar] [CrossRef] [PubMed]
  13. Dang, C.; Morrissey, E.M.; Neubauer, S.C.; Franklin, R.B. Novel microbial community composition and carbon biogeochemistry emerge over time following saltwater intrusion in wetlands. Glob. Chang. Biol. 2019, 25, 549–561. [Google Scholar] [CrossRef] [PubMed]
  14. Zhang, L.; Gao, G.; Tang, X.; Shao, K. Can the freshwater bacterial communities shift to the “marine-like” taxa? J. Basic Microbiol. 2014, 54, 1264–1272. [Google Scholar] [CrossRef] [PubMed]
  15. DeVilbiss, S.E.; Steele, M.K.; Brown, B.L.; Badgley, B.D. Stream bacterial diversity peaks at intermediate freshwater salinity and varies by salt type. Sci. Total. Environ. 2022, 840, 156690. [Google Scholar] [CrossRef] [PubMed]
  16. Rocca, J.D.; Simonin, M.; Wright, J.P.; Washburne, A.; Bernhardt, E. Rare microbial taxa emerge when communities collide: Freshwater and marine microbiome responses to experimental seawater intrusion. bioRxiv 2019, 550756. [Google Scholar] [CrossRef]
  17. Kaushal, S.S.; Groffman, P.M.; Likens, G.E.; Belt, K.T.; Stack, W.P.; Kelly, V.R.; Band, L.E.; Fisher, G.T. Increased salinization of fresh water in the northeastern United States. Proc. Natl. Acad. Sci. USA 2005, 102, 13517–13520. [Google Scholar] [CrossRef]
  18. Kaushal, S.S. Increased Salinization Decreases Safe Drinking Water. Environ. Sci. Technol. 2016, 50, 2765–2766. [Google Scholar] [CrossRef]
  19. Environment Canada. Priority Substances List Assessment Report: Road Salts. In Canadian Environmental Protection Act; Environment Canada: Toronto, AB, Canada, 1999; ISBN 0-662-31018-7. [Google Scholar]
  20. Astorg, L.; Gagnon, J.; Lazar, C.S.; Derry, A.M. Effects of freshwater salinization on a salt-naïve planktonic eukaryote community. Limnol. Oceanogr. Lett. 2022, 8, 38–47. [Google Scholar] [CrossRef]
  21. Qiagen. DNeasy® PowerMax® Soil Kit Handbook; HB-2267-001 © 2023 QIAGEN, All Rights Reserved; Qiagen: Venlo, The Netherlands, 2018. [Google Scholar]
  22. Qiagen. DNeasy® PowerWater® Kit Handbook; HB-2267-001 © 2023 QIAGEN, All Rights Reserved; Qiagen: Venlo, The Netherlands, 2017. [Google Scholar]
  23. Lazar, C.S.; Stoll, W.; Lehmann, R.; Herrmann, M.; Schwab, V.F.; Akob, D.M.; Nawaz, A.; Wubet, T.; Buscot, F.; Totsche, K.-U.; et al. Archaeal Diversity and CO2 Fixers in Carbonate-/Siliciclastic-Rock Groundwater Ecosystems. Archaea 2017, 2017, 213628. [Google Scholar] [CrossRef]
  24. Sun, Y.; Zhong, S.; Deng, B.; Jin, Q.; Wu, J.; Huo, J.; Zhu, J.; Zhang, C.; Li, Y. Impact of Phellinus gilvus mycelia on growth, immunity and fecal microbiota in weaned piglets. PeerJ 2020, 8, e9067. [Google Scholar] [CrossRef]
  25. Capo, E.; Debroas, D.; Arnaud, F.; Guillemot, T.; Bichet, V.; Millet, L.; Gauthier, E.; Massa, C.; Develle, A.-L.; Pignol, C.; et al. Long-term dynamics in microbial eukaryotes communities: A palaeolimnological view based on sedimentary DNA. Mol. Ecol. 2016, 25, 5925–5943. [Google Scholar] [CrossRef]
  26. ThermoFisher Scientific. QuantStudio™ 3D Digital PCR System User Manual, PN MAN0007720; ThermoFisher Scientific: Waltham, MA, USA, 2015. [Google Scholar]
  27. ThermoFisher Scientific. Target Quantification Using SYBR® Green I Dye on the QuantStudio™ 3D Digital PCR System; Demonstrated Protocol; Applied Biosystem; CO35063 0414; ThermoFisher Scientific: Waltham, MA, USA, 2014. [Google Scholar]
  28. Schloss, P.D.; Westcott, S.L.; Ryabin, T.; Hall, J.R.; Hartmann, M.; Hollister, E.B.; Lesniewski, R.A.; Oakley, B.B.; Parks, D.H.; Robinson, C.J.; et al. Introducing mothur: Open-Source, Platform-Independent, Community-Supported Software for Describing and Comparing Microbial Communities. Appl. Environ. Microbiol. 2009, 75, 7537–7541. [Google Scholar] [CrossRef] [PubMed]
  29. Liu, X.; Li, M.; Castelle, C.J.; Probst, A.J.; Zhou, Z.; Pan, J.; Liu, Y.; Banfield, J.F.; Gu, J.-D. Insights into the ecology, evolution, and metabolism of the widespread Woesearchaeotal lineages. Microbiome 2018, 6, 102. [Google Scholar] [CrossRef] [PubMed]
  30. Zhou, Z.; Pan, J.; Wang, F.; Gu, J.-D.; Li, M. Bathyarchaeota: Globally distributed metabolic generalists in anoxic environments. FEMS Microbiol. Rev. 2018, 42, 639–655. [Google Scholar] [CrossRef] [PubMed]
  31. R Core Team. RStudio: Integrated Development for R; RStudio, Inc.: Boston, MA, USA, 2020; Available online: http://www.rstudio.com (accessed on 18 August 2023).
  32. Hammer, Ø. PAST PAleontological STatistics ver. 4.03—Reference Manual. Natural History Museum. University of Oslo. 2020. Available online: https://www.nhm.uio.no/english/research/infraestructure/past (accessed on 18 August 2023).
  33. McMurdie, P.J.; Holmes, S. phyloseq: An R package for reproducible interactive analysis and graphics of microbiome census data. PLoS ONE 2013, 8, e61217. [Google Scholar] [CrossRef] [PubMed]
  34. Oksanen, J.; Blanchet, F.G.; Kindt, R.; Legendre, P.; Minchin, P.R.; O’hara, R.B.; Wagner, H. Community Ecology Package; R Package Version, 2-0; Scientific Research Publishing: Wuhan, China, 2013. [Google Scholar]
  35. Clarke, K.R.; Gorley, R.N. PRIMER v6. User Manual/Tutorial. Plymouth Routine in Mulitvariate Ecological Research; Plymouth Marine Laboratory: Plymouth, UK, 2006. [Google Scholar]
  36. Asteinberger9. asteinberger9/seq_scripts v1.1 (Version v1.1). Zenodo. 12 November 2020. Available online: https://zenodo.org/record/4270481 (accessed on 18 August 2023). [CrossRef]
  37. Smith, S. phylosmith: An R-package for reproducible and efficient microbiome analysis with phyloseq-objects. J. Open Source Softw. 2019, 4, 1442. [Google Scholar] [CrossRef]
  38. Cooper, J.I. Viruses and the Environment. Science & Business Media; Springer: Berlin/Heidelberg, Germany, 2012; ISBN 978-94-015-7701-4. [Google Scholar]
  39. Tang, B.-L.; Yang, J.; Chen, X.-L.; Wang, P.; Zhao, H.-L.; Su, H.-N.; Li, C.-Y.; Yu, Y.; Zhong, S.; Wang, L.; et al. A predator-prey interaction between a marine Pseudoalteromonas sp. and Gram-positive bacteria. Nat. Commun. 2020, 11, 285. [Google Scholar] [CrossRef] [PubMed]
  40. Weynberg, K.D. Viruses in Marine Ecosystems: From Open Waters to Coral Reefs. Adv. Virus Res. 2018, 101, 1–38. [Google Scholar] [CrossRef]
  41. Wang, B.; Liu, N.; Yang, M.; Wang, L.; Liang, X.; Liu, C.-Q. Co-occurrence of planktonic bacteria and archaea affects their biogeographic patterns in China’s coastal wetlands. Environ. Microbiome 2021, 16, 19. [Google Scholar] [CrossRef] [PubMed]
  42. Ma, X.-C.; Li, X.-K.; Wang, X.-W.; Liu, G.-G.; Zuo, J.-L.; Wang, S.-T.; Wang, K. Impact of salinity on anaerobic microbial community structure in high organic loading purified terephthalic acid wastewater treatment system. J. Hazard. Mater. 2020, 383, 121132. [Google Scholar] [CrossRef] [PubMed]
  43. Thajudeen, J.; Yousuf, J.; Veetil, V.P.; Varghese, S.; Singh, A.; Abdulla, M.H. Nitrogen fixing bacterial diversity in a tropical estuarine sediments. World J. Microbiol. Biotechnol. 2017, 33, 41. [Google Scholar] [CrossRef] [PubMed]
  44. Pester, M.; Bittner, N.; Deevong, P.; Wagner, M.; Loy, A. A ‘rare biosphere’ microorganism contributes to sulfate reduction in a peatland. ISME J. 2010, 4, 1591–1602. [Google Scholar] [CrossRef] [PubMed]
  45. Vidal-Durà, A.; Burke, I.; Mortimer, R.; Stewart, D. Diversity patterns of benthic bacterial communities along the salinity continuum of the Humber estuary (UK). Aquat. Microb. Ecol. 2018, 81, 277–291. [Google Scholar] [CrossRef]
  46. Campbell, B.J.; Kirchman, D.L. Bacterial diversity, community structure and potential growth rates along an estuarine salinity gradient. ISME J. 2013, 7, 210–220. [Google Scholar] [CrossRef]
  47. Liu, J.; Yang, H.; Zhao, M.; Zhang, X.-H. Spatial distribution patterns of benthic microbial communities along the Pearl Estuary, China. Syst. Appl. Microbiol. 2014, 37, 578–589. [Google Scholar] [CrossRef]
  48. Tee, H.S.; Waite, D.; Lear, G.; Handley, K.M. Microbial river-to-sea continuum: Gradients in benthic and planktonic diversity, osmoregulation and nutrient cycling. Microbiome 2021, 9, 190. [Google Scholar] [CrossRef] [PubMed]
  49. Nielsen, D.L.; Brock, M.A.; Rees, G.N.; Baldwin, D.S. Effects of increasing salinity on freshwater ecosystems in Australia. Aust. J. Bot. 2003, 51, 655–665. [Google Scholar] [CrossRef]
  50. Pan, J.; Zhou, Z.; Béjà, O.; Cai, M.; Yang, Y.; Liu, Y.; Gu, J.-D.; Li, M. Genomic and transcriptomic evidence of light-sensing, porphyrin biosynthesis, Calvin-Benson-Bassham cycle, and urea production in Bathyarchaeota. Microbiome 2020, 8, 43. [Google Scholar] [CrossRef]
  51. Zou, D.; Liu, H.; Li, M. Community, Distribution, and Ecological Roles of Estuarine Archaea. Front. Microbiol. 2020, 11, 2060. [Google Scholar] [CrossRef]
  52. Zou, D.; Pan, J.; Liu, Z.; Zhang, C.; Liu, H.; Li, M. The Distribution of Bathyarchaeota in Surface Sediments of the Pearl River Estuary Along Salinity Gradient. Front. Microbiol. 2020, 11, 285. [Google Scholar] [CrossRef] [PubMed]
  53. Ling, Z.; Thakur, N.; El-Dalatony, M.M.; Salama, E.-S.; Li, X. Protein biomethanation: Insight into the microbial nexus. Trends Microbiol. 2022, 30, 69–78. [Google Scholar] [CrossRef]
  54. Laskar, F.; Das Purkayastha, S.; Sen, A.; Bhattacharya, M.K.; Misra, B.B. Diversity of methanogenic archaea in freshwater sediments of lacustrine ecosystems. J. Basic Microbiol. 2018, 58, 101–119. [Google Scholar] [CrossRef] [PubMed]
  55. Wang, X.; Xia, K.; Yang, X.; Tang, C. Growth strategy of microbes on mixed carbon sources. Nat. Commun. 2019, 10, 1279. [Google Scholar] [CrossRef]
  56. Lerman, A.; Weiler, R.R. Diffusion and accumulation of chloride and sodium in Lake Ontario sediment. Earth Planet. Sci. Lett. 1970, 10, 150–156. [Google Scholar] [CrossRef]
  57. Gagliano, M.; Ismail, S.; Stams, A.; Plugge, C.; Temmink, H.; Van Lier, J. Biofilm formation and granule properties in anaerobic digestion at high salinity. Water Res. 2017, 121, 61–71. [Google Scholar] [CrossRef] [PubMed]
  58. Sudmalis, D.; Gagliano, M.C.; Pei, R.; Grolle, K.; Plugge, C.M.; Rijnaarts, H.H.M.; Zeeman, G.; Temmink, H. Fast anaerobic sludge granulation at elevated salinity. Water Res. 2018, 128, 293–303. [Google Scholar] [CrossRef] [PubMed]
  59. Gagliano, M.C.; Sudmalis, D.; Pei, R.; Temmink, H.; Plugge, C.M. Microbial Community Drivers in Anaerobic Granulation at High Salinity. Front. Microbiol. 2020, 11, 235. [Google Scholar] [CrossRef]
  60. Chen, S.; Wang, P.; Liu, H.; Xie, W.; Wan, X.S.; Kao, S.-J.; Phelps, T.J.; Zhang, C. Population dynamics of methanogens and methanotrophs along the salinity gradient in Pearl River Estuary: Implications for methane metabolism. Appl. Microbiol. Biotechnol. 2020, 104, 1331–1346. [Google Scholar] [CrossRef]
  61. Liu, Y.; Priscu, J.C.; Xiong, J.; Conrad, R.; Vick-Majors, T.; Chu, H.; Hou, J. Salinity drives archaeal distribution patterns in high altitude lake sediments on the Tibetan Plateau. FEMS Microbiol. Ecol. 2016, 92, fiw033. [Google Scholar] [CrossRef]
  62. Tong, C.; Cadillo-Quiroz, H.; Zeng, Z.; She, C.; Yang, P.; Huang, J. Changes of community structure and abundance of methanogens in soils along a freshwater–brackish water gradient in subtropical estuarine marshes. Geoderma 2017, 299, 101–110. [Google Scholar] [CrossRef]
  63. Bertrand, J.C.; Caumette, P.; Lebaron, P.; Matheron, R.; Normand, P.; Ngando, T.S. (Eds.) Environmental Microbiology: Fundamentals and Applications; Springer: Dordrecht, The Netherlands, 2015; pp. 3–7. ISBN 9789401791182. [Google Scholar]
  64. Takeshita, K.; Yamada, T.; Kawahara, Y.; Narihiro, T.; Ito, M.; Kamagata, Y.; Shinzato, N. Tripartite Symbiosis of an Anaerobic Scuticociliate with Two Hydrogenosome-Associated Endosymbionts, a Holospora—Related Alphaproteobacterium and a Methanogenic Archaeon. Appl. Environ. Microbiol. 2019, 85, e00854-19. [Google Scholar] [CrossRef] [PubMed]
  65. CCME—Canadian Council of Ministers of the Environment. Scientific Criteria Document for the Development of the Canadian Water Quality Guidelines for the Protection of Aquatic Life: Chloride ion; Canadian Council of Ministers of the Environment: Winnepeg, MB, Canada, 2011; PN 1460; ISBN 9781-896997-77-3. [Google Scholar]
  66. Schuler, M.S.; Cañedo-Argüelles, M.; Hintz, W.D.; Dyack, B.; Birk, S.; Relyea, R.A. Regulations are needed to protect freshwater ecosystems from salinization. Philos. Trans. R. Soc. B Biol. Sci. 2019, 374, 20180019. [Google Scholar] [CrossRef] [PubMed]
  67. Stefanidou, N.; Genitsaris, S.; Lopez-Bautista, J.; Sommer, U.; Moustaka-Gouni, M. Unicellular Eukaryotic Community Response to Temperature and Salinity Variation in Mesocosm Experiments. Front. Microbiol. 2018, 9, 2444. [Google Scholar] [CrossRef] [PubMed]
  68. Baldwin, D.S.; Rees, G.N.; Mitchell, A.M.; Watson, G.; Williams, J. The short-term effects of salinization on anaerobic nutrient cycling and microbial community structure in sediment from a freshwater wetland. Wetlands 2006, 26, 455–464. [Google Scholar] [CrossRef]
  69. Yang, J.; Ma, L.; Jiang, H.; Wu, G.; Dong, H. Salinity shapes microbial diversity and community structure in surface sediments of the Qinghai-Tibetan Lakes. Sci. Rep. 2016, 6, 25078. [Google Scholar] [CrossRef] [PubMed]
  70. Jiang, H.; Dong, H.; Zhang, G.; Yu, B.; Chapman, L.R.; Fields, M.W. Microbial Diversity in Water and Sediment of Lake Chaka, an Athalassohaline Lake in Northwestern China. Appl. Environ. Microbiol. 2006, 72, 3832–3845. [Google Scholar] [CrossRef] [PubMed]
  71. Jackson, C.R.; Vallaire, S.C. Effects of salinity and nutrients on microbial assemblages in Louisiana wetland sediments. Wetlands 2009, 29, 277–287. [Google Scholar] [CrossRef]
  72. Ikenaga, M.; Guevara, R.; Dean, A.L.; Pisani, C.; Boyer, J.N. Changes in Community Structure of Sediment Bacteria Along the Florida Coastal Everglades Marsh–Mangrove–Seagrass Salinity Gradient. Microb. Ecol. 2010, 59, 284–295. [Google Scholar] [CrossRef] [PubMed]
  73. Freitag, T.E.; Chang, L.; Prosser, J.I. Changes in the community structure and activity of betaproteobacterial ammonia-oxidizing sediment bacteria along a freshwater-marine gradient. Environ. Microbiol. 2006, 8, 684–696. [Google Scholar] [CrossRef]
  74. Walsh, E.A.; Kirkpatrick, J.B.; Rutherford, S.D.; Smith, D.C.; Sogin, M.; D’Hondt, S. Bacterial diversity and community composition from seasurface to subseafloor. ISME J. 2016, 10, 979–989. [Google Scholar] [CrossRef]
  75. Yan, N.; Marschner, P.; Cao, W.; Zuo, C.; Qin, W. Influence of salinity and water content on soil microorganisms. Int. Soil Water Conserv. Res. 2015, 3, 316–323. [Google Scholar] [CrossRef]
  76. Mani, K.; Taib, N.; Hugoni, M.; Bronner, G.; Bragança, J.M.; Debroas, D. Transient Dynamics of Archaea and Bacteria in Sediments and Brine Across a Salinity Gradient in a Solar Saltern of Goa, India. Front. Microbiol. 2020, 11, 1891. [Google Scholar] [CrossRef]
  77. Lv, J.; Niu, Y.; Yuan, R.; Wang, S. Different Responses of Bacterial and Archaeal Communities in River Sediments to Water Diversion and Seasonal Changes. Microorganisms 2021, 9, 782. [Google Scholar] [CrossRef] [PubMed]
  78. Elliott, M.; Whitfield, A. Challenging paradigms in estuarine ecology and management. Estuar. Coast. Shelf Sci. 2011, 94, 306–314. [Google Scholar] [CrossRef]
  79. Wisnoski, N.I.; Lennon, J.T. Stabilising role of seed banks and the maintenance of bacterial diversity. Ecol. Lett. 2021, 24, 2328–2338. [Google Scholar] [CrossRef] [PubMed]
  80. Herrmann, A.; Rath, J. Methods in Methane Metabolism, Part A. In Methods in Enzymology; Academic Press: Cambridge, MA, USA, 2011; Volume 494, pp. 338–339. [Google Scholar] [CrossRef]
  81. Karakashev, D.; Batstone, D.J.; Trably, E.; Angelidaki, I. Acetate Oxidation Is the Dominant Methanogenic Pathway from Acetate in the Absence of Methanosaetaceae. Appl. Environ. Microbiol. 2006, 72, 5138–5141. [Google Scholar] [CrossRef] [PubMed]
  82. Tian, H.; Fotidis, I.A.; Kissas, K.; Angelidaki, I. Effect of different ammonia sources on aceticlastic and hydrogenotrophic methanogens. Bioresour. Technol. 2018, 250, 390–397. [Google Scholar] [CrossRef]
  83. Fenchel, T.; King, G.; Blackburn, T. Aquatic Sediments. In Bacterial Biogeochemistry, 3rd ed.; Academic Press: Boston, MA, USA, 2012; pp. 121–142. ISBN 978-0-12-415836-8. [Google Scholar]
  84. Zheng, P.-F.; Wei, Z.; Zhou, Y.; Li, Q.; Qi, Z.; Diao, X.; Wang, Y. Genomic Evidence for the Recycling of Complex Organic Carbon by Novel Thermoplasmatota Clades in Deep-Sea Sediments. mSystems 2022, 7, e0007722. [Google Scholar] [CrossRef]
  85. Bianchi, T.S.; Bauer, J.E. 5.03–Particulate Organic Carbon Cycling and Transformation. Treatise Estuar. Coast. Sci. 2011, 5, 69–117. [Google Scholar] [CrossRef]
  86. Pavlostathis, S.G. Environmental Biotechnology and Safety. In Comprehensive Biotechnology, 2nd ed.; Elsevier: Amsterdam, The Netherlands, 2011; ISBN 9780080885049. [Google Scholar]
  87. Smith, K.S.; Ingram-Smith, C. Methanosaeta, the forgotten methanogen? Trends Microbiol. 2007, 15, 150–155. [Google Scholar] [CrossRef]
  88. Chen, S.; He, Q. Persistence of Methanosaeta populations in anaerobic digestion during process instability. J. Ind. Microbiol. Biotechnol. 2015, 42, 1129–1137. [Google Scholar] [CrossRef] [PubMed]
  89. Pierangeli, G.M.F.; Domingues, M.R.; de Jesus, T.A.; Coelho, L.H.G.; Hanisch, W.S.; Pompêo, M.L.M.; Saia, F.T.; Gregoracci, G.B.; Benassi, R.F. Higher Abundance of Sediment Methanogens and Methanotrophs Do Not Predict the Atmospheric Methane and Carbon Dioxide Flows in Eutrophic Tropical Freshwater Reservoirs. Front. Microbiol. 2021, 12, 647921. [Google Scholar] [CrossRef] [PubMed]
  90. Fischer, P.Q.; Sánchez-Andrea, I.; Stams, A.J.M.; Villanueva, L.; Sousa, D.Z. Anaerobic microbial methanol conversion in marine sediments. Environ. Microbiol. 2021, 23, 1348–1362. [Google Scholar] [CrossRef] [PubMed]
  91. Pedrós-Alió, C.; Calderón-Paz, J.I.; Gasol, J.M. Comparative analysis shows that bacterivory, not viral lysis, controls the abundance of heterotrophic prokaryotic plankton. FEMS Microbiol. Ecol. 2000, 32, 157–165. [Google Scholar] [CrossRef] [PubMed]
  92. Robitaille, J.P. Les Sels de Voirie au Québec: Proposition D’une Démarche de Gestion Environnementale Spécifique aux Zones Vulnérables. Doctoral Dissertation, Université de Sherbrooke, Sherbrooke, QC, Canada, 2011. [Google Scholar]
Figure 1. Distance-based redundancy analysis (db-RDA) used to correlate archaeal communities from water and sediment samples with explanatory factors. OTUs are represented as red points. T3, samples taken after a three-week incubation; T6, samples taken after a six-week incubation; S, sedimentary samples; W, water samples; Bac1, bacterial community composition represented by the first axis of a PCoA (see Table S3 for PCoA axes values); Bac2, bacterial community composition represented by the second axis of a PCoA; Euka1, eukaryotic community composition represented by the first axis of a PCoA; Euka2, eukaryotic community composition represented by the second axis of a PCoA; Bacterial_abund, bacterial absolute abundance.
Applmicrobiol 03 00063 g001
Figure 2. Distance-based redundancy analysis (db-RDA) used to correlate bacterial communities from water and sediment samples with explanatory factors. OTUs are represented as red points. T3, samples taken after a three-week incubation in microcosms; T6, samples taken after a six-week incubation; S, sedimentary samples; W, water samples; Arc1, archaeal community composition represented by the first axis of a PCoA (see Table S3 for PCoA axes values); Arc2, archaeal community composition represented by the second axis of a PCoA; Euka1, eukaryotic community composition represented by the first axis of a PCoA; Euka2, eukaryotic community composition represented by the second axis of a PCoA.
Applmicrobiol 03 00063 g002
Figure 3. Principal coordinate analysis based on dissimilarity matrices (Bray–Curtis) for the microcosm’s communities. (a) Archaeal communities. (b) Bacterial communities. (c) Eukaryotic communities. For each PCoA, the two first axes of variance are shown. The different type of medium and sampling times are shown within the “Time” section. Treatments are shown under “Treat”. The different microcosm treatments represent salinities as follows: S0 (0.01 ppt or 10 mg/L−1), S5 (0.16 ppt or 160 mg/L−1), S11 (0.93 ppt or 930 mg/L−1), S15 (1.93 ppt or 1930 mg/L−1), and S20 (3.22 ppt or 3220 mg/L−1). Clusters created for further analysis are shown (circles) and identified.
Applmicrobiol 03 00063 g003aApplmicrobiol 03 00063 g003b
Table 1. Values associated with regression between salinity and archaeal and bacterial absolute abundance in water and sediment samples. Sampling times, R2, and p values are shown. Visual representations are available in Supplemental Material Figures S1 and S2.
VariablesTimeR2p Value
Water archaea absolute abundance
×
Salinity
T30.23420.4088
T60.18310.4723
Sediment archaea absolute abundance
×
Salinity
T30.67030.09011
T60.55890.1463
Water bacterial absolute abundance
×
Salinity
T30.55550.1482
T60.40640.2473
Sediment bacterial absolute abundance
×
Salinity
T30.03360.0768
T60.06130.688
Table 2. Values associated with regression between salinity and archaeal or bacterial α-diversity (Shannon’s H) in water and sediment samples. Sampling times, R2, and p values are shown. Significant results are highlighted with an **. Visual representations are available in Supplemental Material Figures S3 and S4.
VariablesTimeR2p Value
Water archaeal α-diversity
×
Salinity
T30.26370.3762
T60.26050.3796
Sediment archaeal α-diversity
×
Salinity
T30.00880.8808
T60.51860.1701
Water bacterial α-diversity
×
Salinity
T30.04180.7414
T60.91960.00992 **
Sediment bacterial α-diversity
×
Salinity
T30.08930.62525
T60.00040.97385
Disclaimer/Publisher’s Note: The statements, opinions and data contained in all publications are solely those of the individual author(s) and contributor(s) and not of MDPI and/or the editor(s). MDPI and/or the editor(s) disclaim responsibility for any injury to people or property resulting from any ideas, methods, instructions or products referred to in the content.

