Article

Recombinant Protein Production with Escherichia coli in Glucose and Glycerol Limited Chemostats

by
Anca Manuela Mitchell
1,†,
Valentina Gogulancea
2,†,
Wendy Smith
3,
Anil Wipat
3 and
Irina Dana Ofiţeru
1,*
1
School of Engineering, Newcastle University, Newcastle upon Tyne NE1 7RU, UK
2
Centre for Sustainable Technologies, Ulster University, Newtownabbey BT37 0QB, UK
3
School of Computing, Newcastle University, Newcastle upon Tyne NE1 7RU, UK
*
Author to whom correspondence should be addressed.
Equal contribution.
Appl. Microbiol. 2021, 1(2), 239-254; https://doi.org/10.3390/applmicrobiol1020018
Submission received: 31 May 2021 / Revised: 8 July 2021 / Accepted: 13 July 2021 / Published: 16 July 2021

Abstract

:
Recently, there has been a resurgence of interest in continuous bioprocessing as a cost-optimised production strategy, driven by a rising global requirement for recombinant proteins used as biological drugs. This strategy could provide several benefits over traditional batch processing, including smaller bioreactors, smaller facilities, and overall reduced plant footprints and investment costs. Continuous processes may also offer improved product quality and minimise heterogeneity, both in the culture and in the product. In this paper, a model protein, green fluorescent protein (GFP) mut3*, was used to test the recombinant protein expression in an Escherichia coli strain with industrial relevance grown in chemostat. An important factor in enabling stable productivity in continuous cultures is the carbon source. We have studied the viability and heterogeneity of the chemostat cultures using a chemically defined medium based on glucose or glycerol as the single carbon source. As a by-product of biodiesel production, glycerol is expected to become a sustainable alternative substrate to glucose. We have found that although glycerol gives a higher cell density, it also generates higher heterogeneity in the culture and a less stable recombinant protein production. We suggest that manipulating the balance between different subpopulations to increase the proportion of productive cells may be a possible solution for making glycerol a successful alternative to glucose.

1. Introduction

Recombinant protein production (RPP) has been steadily increasing since the 1980s, becoming a multi-billion dollar industry, with white and red biotechnology accounting for most of the market [1]. Bacterial expression systems are an attractive alternative to the more expensive or slow growing yeast or mammalian cell culture systems. Escherichia coli alone accounts for the production of 30–40% of proteins approved for therapeutic use [2]. Its well-characterised genome, the existence of many commercially available strains and their relatively low price, the high protein expression rates and the ease of performing genomic modifications to ensure high quality products explain the E. coli dominance amongst other microorganisms [1,3,4].
The switch from batch to continuous operation was also expected in, red biotechnology, to increase productivity, operational flexibility and the response to high market demands, following the trend demonstrated in the food, chemical and petrochemical industries. However, there was no such trend, and currently there are only a few continuous processes implemented using mammalian cells [3]. The use of microbial cells in continuous production modes at industrial scale remains uncommon, except for insulin production with Saccharomyces cerevisiae [5].
The most attractive characteristics of using continuous bioreactors (chemostats) are their high space–time yield, increased productivity, reduced protein production costs and lower space requirements. Moreover, in continuous bioreactors, the microorganisms’ growth rate and the media composition (on which the protein production rate depends) are controlled to achieved “balanced growth” [6]. Thus, the optimisation of continuous cultures for RPP requires careful consideration of these two issues: the nutrient that limits growth and the microbial growth rate.
Continuous cultures should theoretically obtain products of more consistent quality than fed-batch processes [7]. Whereas in batch processing, product quality and productivity might be a trade-off, continuous biomanufacturing gives favourable recombinant protein characteristics [8]. In addition, chemostats allow for direct comparison between different experimental set-ups and eliminate some of the scale-up issues common for batch and fed-batch processes [9]. Nevertheless, most continuous culture studies have focused on the physiology of wild-type cells or low-stakes products such as ethanol. So far, no reports of industrial-scale continuous production of biopharmaceuticals using bacterial expression systems exist. The most-often-cited reasons for this are the genetic instabilities of the bacterial strains and recombinant plasmid leading to higher cell heterogeneity, the formation of inclusion bodies, and the increased acetate toxicity through overflow metabolism. Additionally, an increased metabolic burden which leads to lower growth rates and protein yield, and eventually increased cell death, as well as challenges of maintaining sterility, are also reported [10].
Previous studies have focused on quantifying the metabolic load associated with recombinant protein production [11,12] and determining the growth and protein production kinetics to optimise operating conditions and devise control strategies for the bioreactor [9]. High throughput techniques, including miniaturisation and parallelisation of bioreactors are used in both industry and research. Cascade operation and multistage culture that decouples the growth from the protein production stage have been investigated with promising results, combined with adequate induction strategies for protein expression [13,14].
The advances in continuous protein production using E. coli were recently summarised in [15], focusing on the knowledge transfer opportunities from fed-batch to continuous operation. One exciting development is using glycerol, a by-product of biodiesel production, as a substrate to make the RPP more sustainable [16,17,18]. Although there is an increased interest in the transition from fed-batch to continuous processing with E coli, the heterogeneity of the culture and the lack of stable production are considered obstacles [15,19]. High-throughput single-cell expressions studies are required for understanding the dynamics and performance of heterogenous cell populations [20].
This work uses a model protein, green fluorescent protein (GFP) mut3*, to test the recombinant protein expression in an E. coli strain with industrial relevance in glucose and glycerol-limited chemostats. A high throughput batch microbioreactor was used to select the best conditions for growth and protein production in the chemostat system. A chemically defined medium, with glucose or glycerol as the sole carbon source, was used as a feed solution and optimised for chemostat operation. We monitored the protein production and the heterogeneity of the cultures through flow-cytometry to compare the performance of the two carbon sources.

2. Materials and Methods

2.1. Strains

Two E. coli strains were used in this study: W3110 (F– mcrA mcrB IN(rrnD- rrnE)1 λ–), a wild-type strain with industrial applications; and CLD1301, which is derived from W3110 by transformation with the plasmid vector pD441-SR (containing the GFP-A gene). The vector has the following characteristics: a pUC ori allows autonomous replication in E. coli at a high copy number (500–700 plasmid copies per cell), which gives a high expression of the recombinant product; a kanamycin resistance cassette allows selection; and an isopropyl β-d-1-thiogalactopyranoside (IPTG)-T5 inducible promoter allows modulating protein expression by varying the concentration of IPTG. We selected a wild strain and a recombinant one derived from it to have a baseline reference for the heterogeneity observed in chemostats. Easy quantification of the recombinant product was possible because of the high-level expression from the T5 promoter and reduced leakiness under the lac repressor. The strains were obtained from FUJIFILM Diosynth Biotechnologies (Billingham, UK) and are part of their culture collection used to explore basal expression and induction kinetics.

2.2. Growth Media and Culture Conditions

2.2.1. Growth Media

All cultures used the mineral medium reported in [21] supplemented with 20 µg L−1 biotin and 50 µg/L thiamine. In addition, 100 µL/L Antifoam Y-30 (Sigma Life Sciences, St. Louis, MO), diluted 1/10 in deionised water, was added to prevent foaming. Kanamycin, in a final concentration of 50 µg/mL, was added for the growth of E. coli CLD1301 to select for plasmids.
The batch medium composition was well buffered with the phosphate salts, maintaining a pH of about 6.8 (starting value pH = 7) during fermentation. For the chemostat cultures the basal salts solution contained, per litre: 2.72 g KH2PO4, 2.3 g NH4Cl, 1.4 g (NH4)2SO4, and 0.1 mL concentrated H2SO4. The addition of concentrated H2SO4 lowered the pH to 3.5, allowing autoclaving at 121 °C for 30 min without forming derivatives from glucose or precipitations from phosphate salts. The vitamins and the antibiotic (for E. coli CLD1301) were added after autoclaving once the feed carboy cooled to room temperature.
In batch culture, different concentrations of glucose and glycerol were tested, while in continuous culture, the initial and the feed concentration of the carbon source were 4 g/L.

2.2.2. Culture Conditions

Batch cultures were performed in the BioLector® (m2p-labs, Baesweiler, Germany) microbioreactor, in 48-well FlowerPlates, operated as per the manufacturer’s instructions. The experiments were run in triplicate and each run had one well with medium as internal plate standard negative control [14]. The FlowerPlate was covered with a gas-permeable sealing foil (F-GPR48-10, m2p-labs) to ensure aseptic conditions and reduced evaporation.
The following were maintained constant in all BioLector® fermentations: initial OD600~0.05, 800 µL filling volume, 1500 min−1 shaking frequency, 3 mm shaking diameter and 37 °C. The inoculation was made with cell stocks in the mid-exponential growth phase (OD600~2).
Biomass was measured as scattered light using an optical measuring unit (Fluostar, BMG Lab Technologies) with 620 nm excitation and no emission filter, located underneath the clear base of the FlowerPlate. Maximum growth rate µmax was determined during the exponential phase, knowing its dependence on the natural logarithm of the biomass (A.U.). To investigate RPP in E. coli CLD1301, induction profiling was conducted with six different concentrations of IPTG (0, 0.05, 0.1, 0.25, 0.5 and 1 mM), added at the mid-exponential point of growth, at OD600 of 2. GFP concentration (A.U.) was measured online via fluorescence, with a 488 nm excitation and a 520 nm emission.
The average of 6–10 initial measurements for each biomass and fluorescence was subtracted from the totals to account for the signal originating from the medium background. Data were imported into Microsoft Excel for analysis. Gains were maintained constant across experiments, with a gain of 20 for biomass and a gain of 50 for GFP fluorescence. In the initial stages of fermentation at low biomass concentrations, few wells presented values smaller than the background; these were not removed from the data set.
Continuous cultures were performed in triplicate in 3 L computer-controlled jacketed bioreactors (eZ-Control, Applikon Biotechnology B.V.) with a 1.5 L working volume. The culture regime comprised of an initial batch phase, followed by a second chemostat phase. When OD600~2, at the mid-exponential point, the chemostat phase was initiated by activating the inlet and outlet peristaltic pumps. The inlet peristaltic pump, calibrated to operate at a set flow rate (½ µmax), controlled the specific growth rate in the chemostat.
The following parameters were maintained constant during bioreactor cultures: initial OD600~0.05, 1.5 L working volume, pH of 7, 37 °C temperature, 1 vvm air flow, 50 % dissolved oxygen saturation. A peristaltic pump dosing system with base mix (1M NaOH/1M KOH) and acid (1M HCl) maintained the pH at 7. The data were recorded with BioExpert software.
Chemostat conditions were reached after five volume changes and confirmed by constant biomass, a constant DO around set point and constant metabolic activity, evidenced by a constant alkali addition. The sampling times during the chemostat phase were every 2 h for the cultures on glucose and every 3 h for the cultures on glycerol. For inducing protein expression, IPTG was added in both the feed carboy and fermenter (concomitantly with switching from batch to continuous culture) to maintain a constant optimum inducer concentration during fermentation.

2.3. Sample Analysis

2.3.1. Biomass

Biomass was measured as OD600 (Jenway 6705 Spectrophotometer at 600 nm fixed wavelength) and total cell count (TCC) through flow cytometry (Attune Nxt Acoustic Focusing Cytometer, Life Technologies, Carlsbad, CA, USA). OD600 was calibrated against the cell dry weight (six calibration points between 0.25 and 2.5), but for this work we report the cell density as OD600 across all experiments [22].

2.3.2. Substrate Measurements

Glucose and glycerol concentrations in the filtered fermentation broth were determined using enzyme-based test kits (Megazyme International, Bray, Ireland) according to manufacturer’s protocol. For the initial batch phase, the supernatant was diluted 1/10 in PBS before spectrophotometer measurements, while the steady-state supernatant obtained during the chemostat phase was not diluted.

2.3.3. Volatile Fatty Acids

Organic acids (formic, acetic and propionic) were quantified using an Dionex ICS-2100 ion chromatography system (Thermo Fisher Scientific, Sunnyvale, CA, USA) with a Dionex IonPac™ AG11-HC anion protection column. The reactor samples were filtered (Millex-GS syringe filter with 0.22 µm pore size) in the first two minutes after sampling to stop the bacterial activity and frozen immediately to −20 °C until further analysis.

2.3.4. Flow Cytometry

TCC, single-cell analysis of membrane integrity and RPP were assessed with Attune Nxt Acoustic Focusing Cytometer (Life Technologies, Carlsbad, CA, USA), equipped with a 488 nm laser. The SSC and FSC detectors were used to gate the population of interest. The green and red fluorescence were detected in the BL1 (BP 530/30) and BL2 channel (BP 574/26), respectively.
For membrane integrity the cells were stained with the cell-permeant thiazole orange (TO; fluorescence emission at 525 nm) and the cell-impermeant propidium iodide (PI; fluorescence emission at 623 nm) (final concentrations of 420 nmol/L and 43 µmol/L for TO and PI, respectively) [23,24]. The percentage of cells that stain with either dye plotted as green over red fluorescence shows the number of viable (live) and dead cells.
In the presence of IPTG, the green fluorescence of the recombinant protein GFP mut3* replaces the TO staining. The strength of GFP mut3* lies in that the fluorophore forms from moieties from its polypeptide chain, requiring no co-factors for maturation other than oxygen and a 37 °C temperature. We confirmed through microscopy that the GFP-expressing cells displayed a single type of fluorescence and did not have the morphological aggregates encountered in inclusion bodies, showing that at 37 °C the protein was soluble in the cytoplasm (Supplementary Materials, Figure S1). Therefore, the emitted fluorescence intensity was a direct readout of recombinant protein production. Dead cells and debris were eliminated from analysis using gating on FSC and SSC.
Single-cell analysis of changes in membrane potential indicative of bacterial stress was studied using a triple dye combination: bis-(1,3-dibarbituric acid)-trimethine oxonol (DIBAC4(3); fluorescence emission at 525 nm), ethidium bromide (EB; fluorescence emission at 575 nm) and propidium iodide (PI; fluorescence emission above 630 nm), based on the method reported in [25]. The dyes were added to a final concentration of 10 μg/mL DIBAC4(3), 10 μg/mL EB and 5 μg/mL PI. Stained cells were incubated for 30 min at 37 °C, in the dark, before flow cytometry analysis. Compensation was used to minimise fluorescence spill-over. The population was gated as active pumping cells that stained with neither of the dyes (DIBAC4(3)−, EtBr−, PI−), de-energised cells (DIBAC4(3)−, EtBr+, PI−), depolarised cells (DIBAC4(3)+, EtBr+, PI−) and dead cells (DIBAC4(3)+, EtBr−, PI+).

2.3.5. Data Acquisition and Analysis

All samples for flow cytometry analysis were diluted in PBS buffer to a final OD600 ~ 0.25 before analysis. The sheath flow rate was 25 µL/min, 5 µL sample volume was selected as a stop for the assessment of viability (TO/PI) and protein production (GFP/PI) and 30 µL as a stop for membrane potential assessment (DIBAC4(3)/EB/PI). The flow cytometry data were recorded with Attune Cytometric Software v 3.1 and saved as Flow Cytometry Standard (.fcs) files, which were exported, gated and read at single-cell level with Matlab R2019b, using the fca-readfcs.m function, available on Matlab’s File Exchange. Data were gated using an in-house written routine and exported to Excel, with flow cytometry readings expressed in arbitrary units (A.U.) and live/dead counts as percentages (%).The non-parametric Mann–Whitney U test was used for assessing the significance of the observed variation between the results obtained in different chemostat conditions (comparing OD600, total cell count, and fractions of live, dead, depolarised and de-energised cells). Statistical analysis was performed with Minitab 18.

3. Results and Discussions

We first pre-screened the wild and recombinant strains in a high-throughput microbioreactor, testing various glucose/glycerol concentrations to determine the maximum concentration at which the carbon source limited bacterial growth. A single factor limitation in the medium allows for balanced growth (when cells attain the maximum growth rate possible for that particular medium) and is the only readily reproducible growth condition [26], which is a prerequisite for comparing the two substrates. The results, presented in Figure 1, indicated that for both glucose and glycerol, for this defined medium formulation, the limiting concentration for the carbon source was 4 g/L [21]. Exceeding this value, other components of the medium also became limiting.
To select the dilution rate for chemostat operation, we computed each bacterial strain’s maximum growth rate for each substrate. The results and the ensuing sampling strategies are presented in Table 1. For E. coli CLD1301 grown on glucose as the sole carbon source, the batch fermentations in BioLector® showed a μmax of 0.37 h−1 but a growth rate recovery was observed in the continuous experiments, with a μmax of 0.67 h−1. Dilution rates, corresponding to ½ µmax were 0.3 h−1 for glucose (residence time 3.33 h) and 0.25 h−1 for glycerol (residence time 3.96 h). Steady state was assumed after five residence times, when the culture optical density OD600 was constant, which is more conservative than the usual three residence times reported in the literature [20]. Based on induction profiling in BioLector® with different IPTG concentration (see Section 2.2.2), we selected 1mM as the optimum inducer concentration in the chemostat (Supplementary Materials, Figure S2).
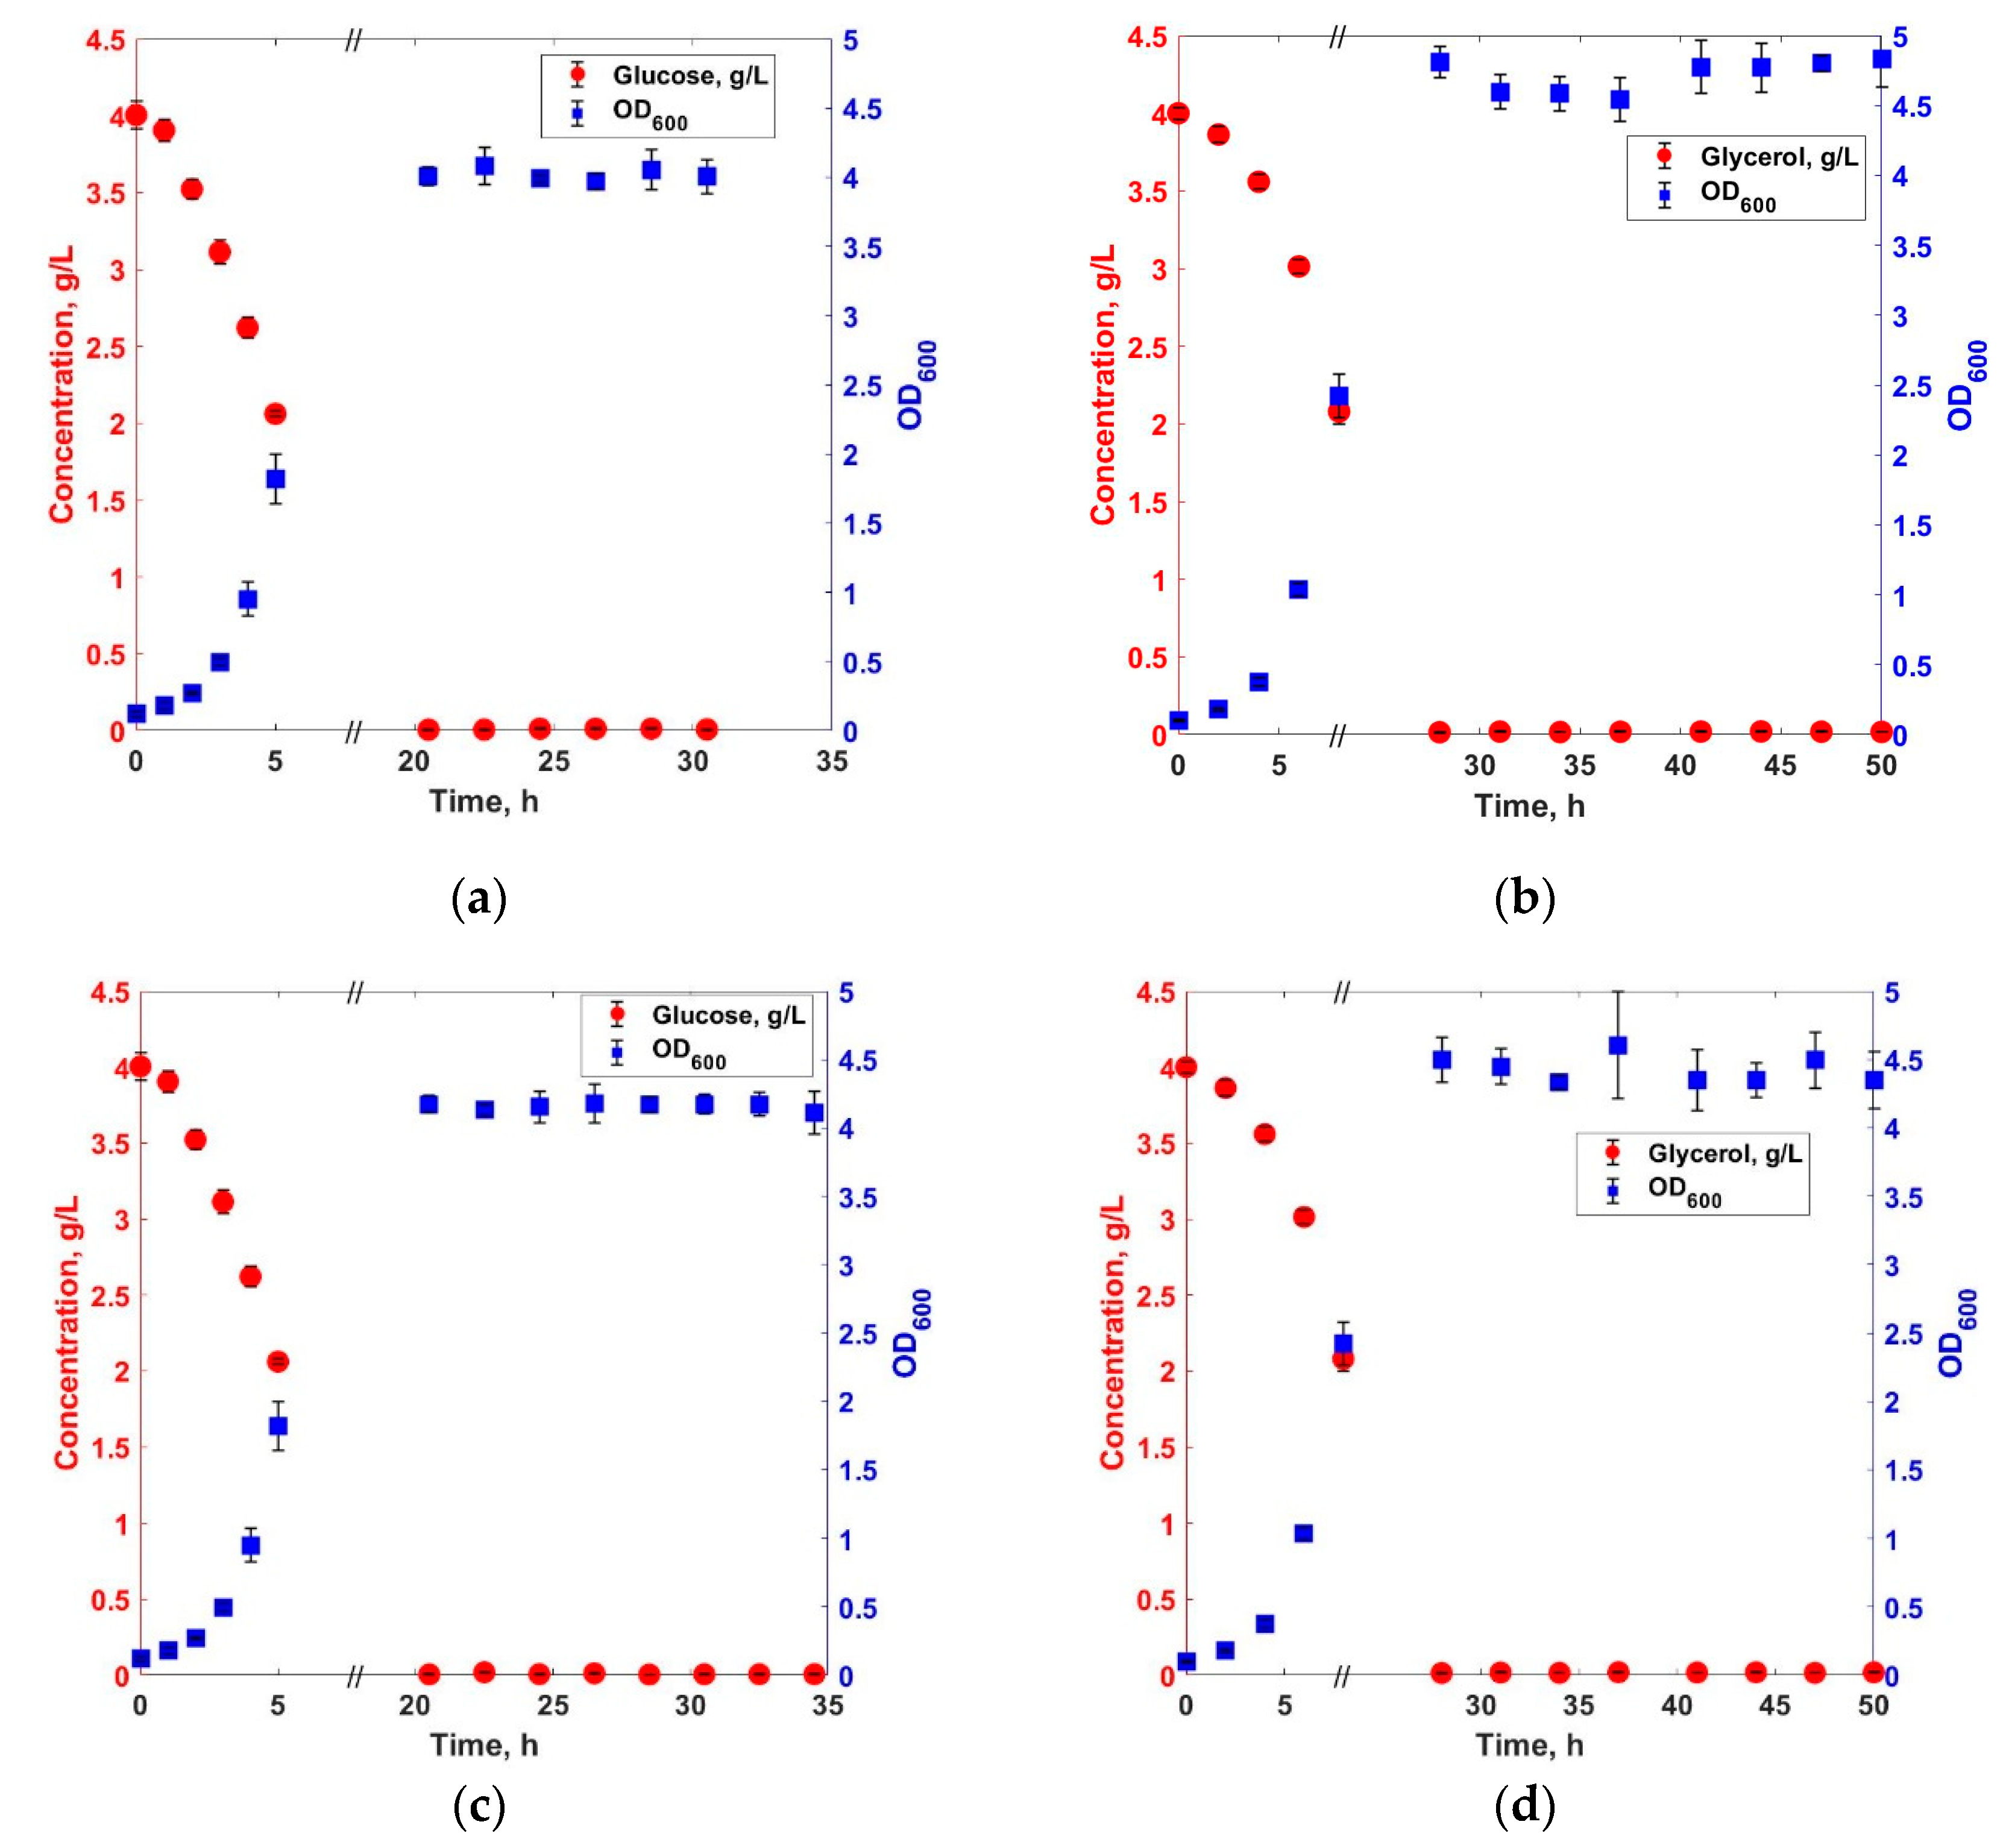
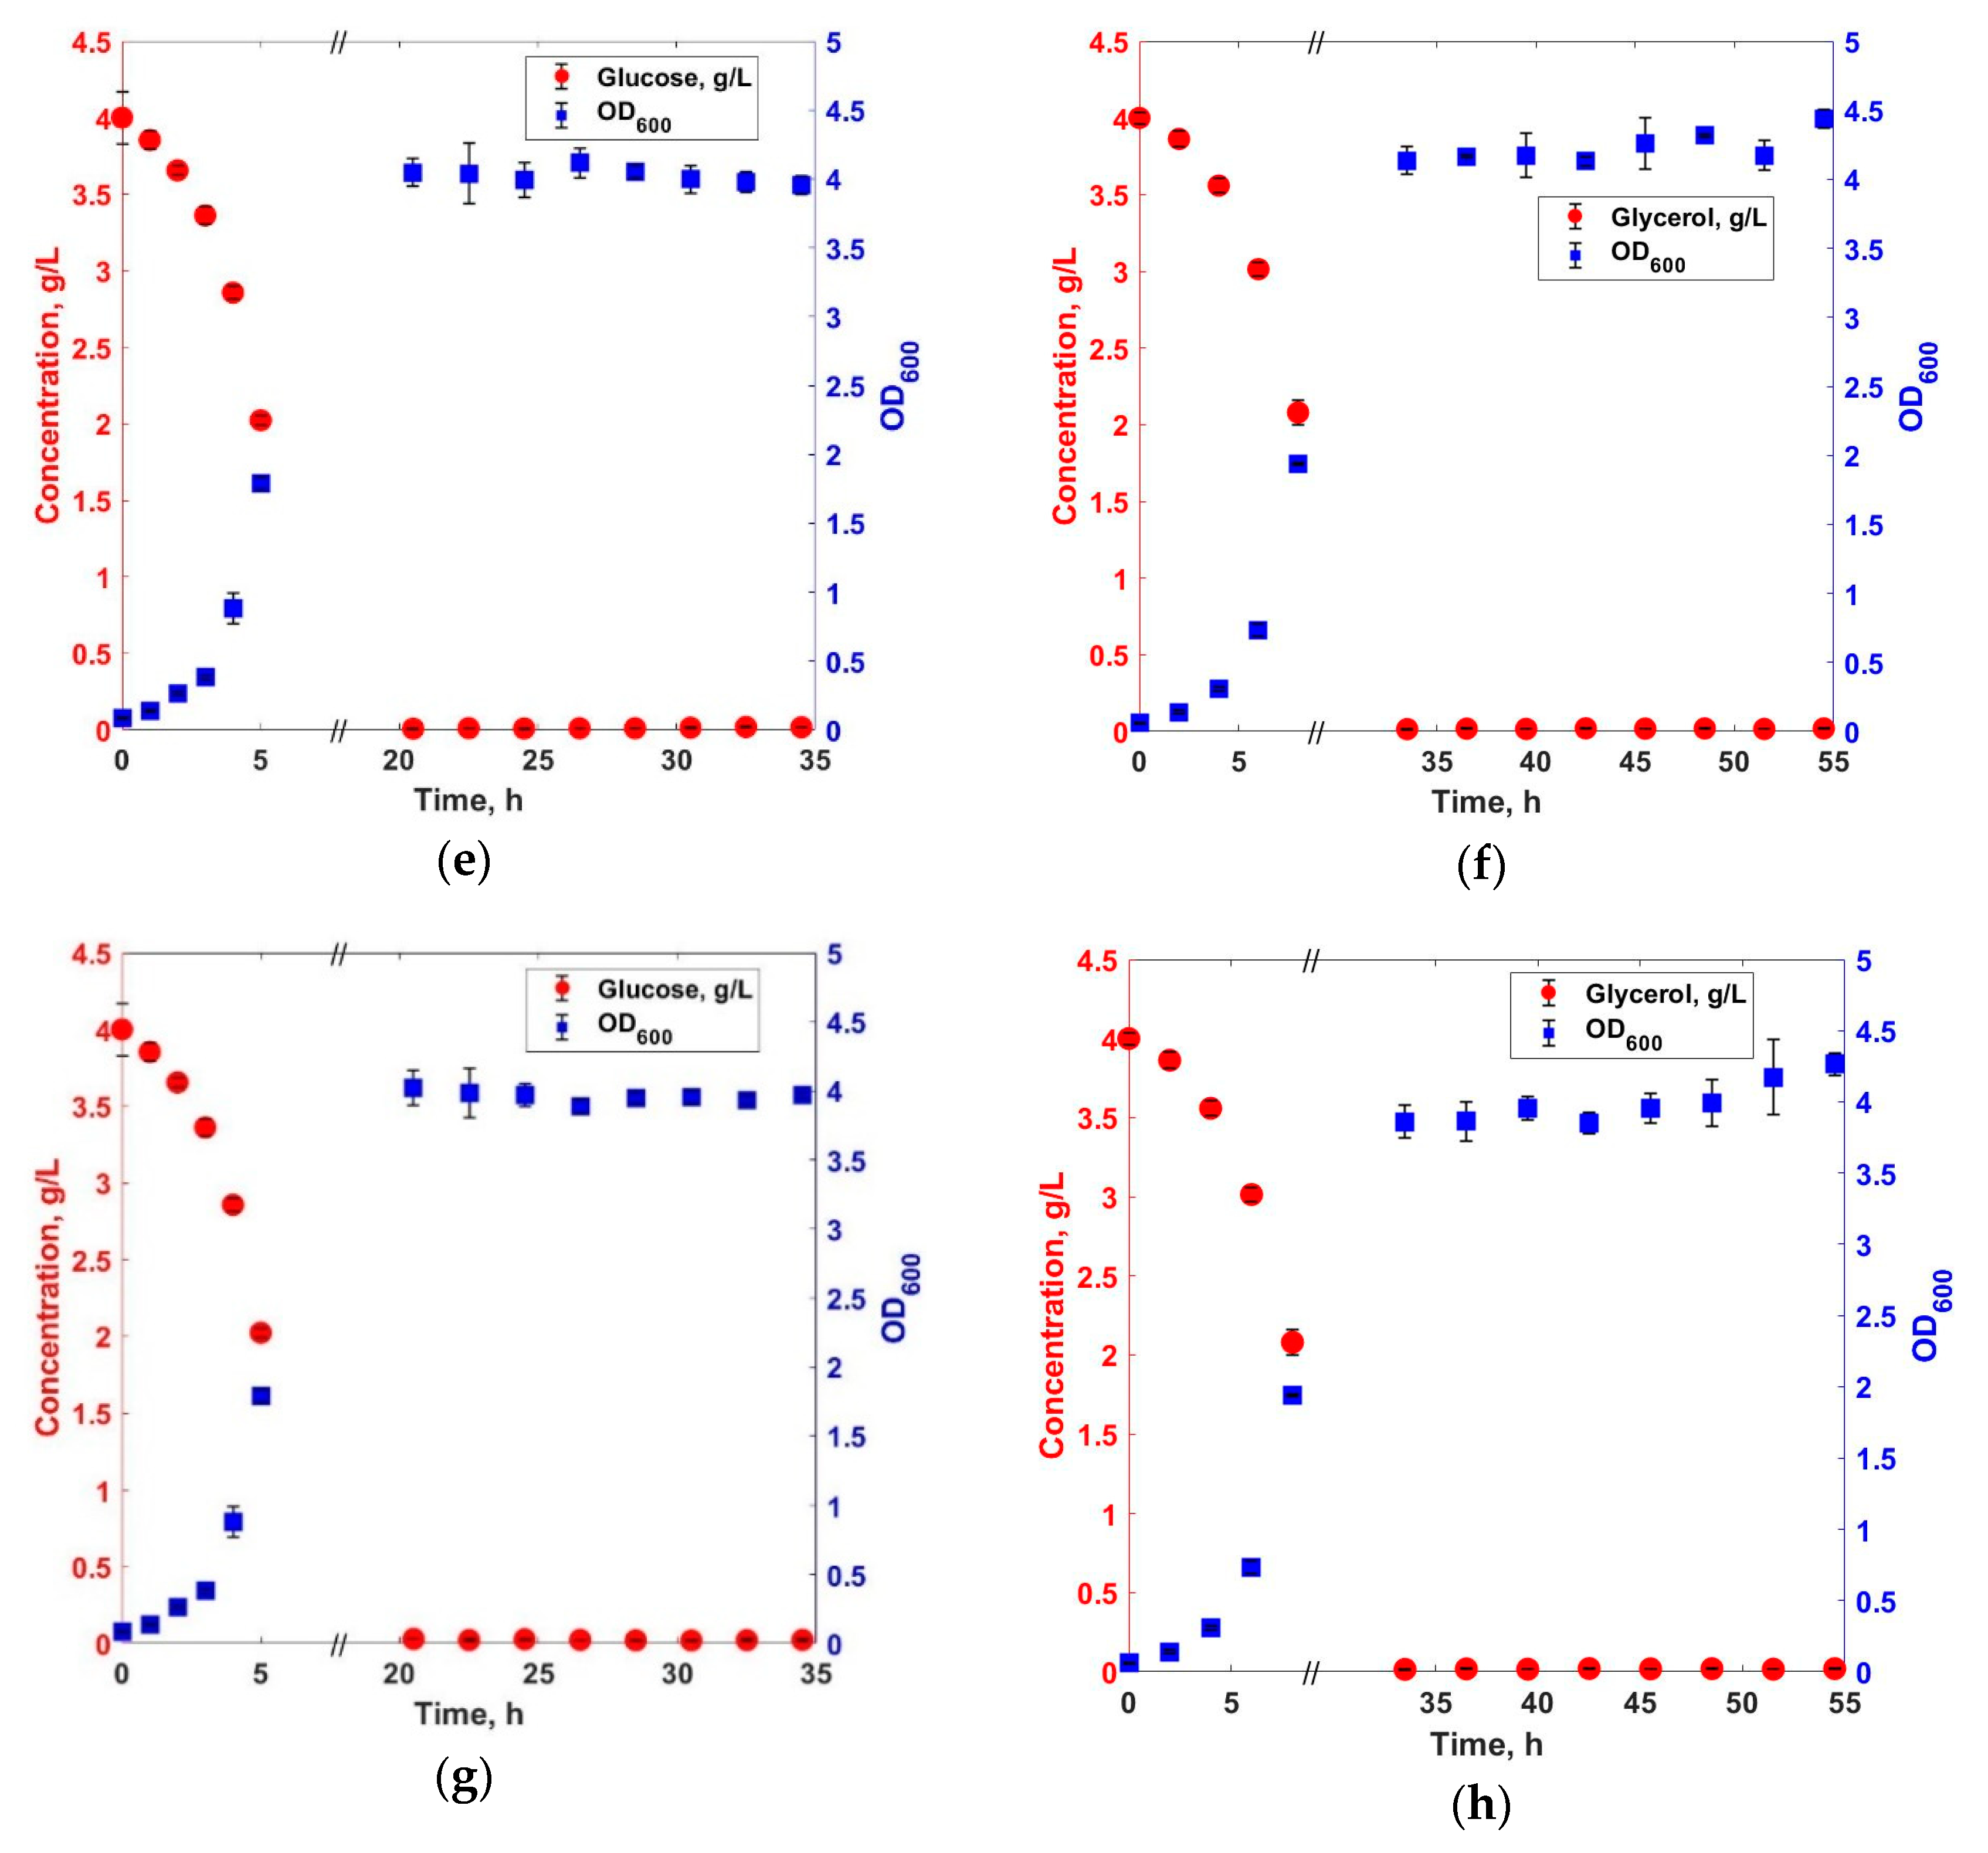
To verify the suitability of glycerol compared to glucose for continuous RRP, we first analysed the performance of E. coli W3110 grown with and without IPTG addition. As expected from the BioLector® experiments, the optical density of the glycerol cultures was slightly higher compared with that for the glucose cultures (Figure 2a,b,e,f). However, this difference was not statistically significant for any of the two conditions studied (Mann–Whitney U test, p > 0.05). Previous reports indicated that glycerol has beneficial effects on the viability of cells compared to glucose [27]. Our results suggest that once steady state is reached glucose and glycerol are similar for biomass production, despite the longer culture time for the latter.
Volatile fatty acids (formic, acetic and propionic), which are known to have negative effects on growth and to inhibit recombinant protein formation [28], had low concentrations in all cultures (Supplementary Materials, Figure S3). This confirms that the substrate concentrations and dilution rates were properly selected to prevent byproduct accumulation, which further shows the advantage of a chemostat system for recombinant protein production.
The addition of IPTG had no significant influence on the cell density (measured as OD600) of E. coli CLD1301 grown on glucose or glycerol (Figure 2a,c,e,g for glucose; Figure 2b,d,f,h for glycerol). IPTG is known to be detrimental to cell growth and cellular viability of E. coli suspended cultures [29,30,31,32]. The chemostat runs results confirmed that the 1mM concentration selected for induction did not significantly influence cell growth (Mann–Whitney U test, p > 0.05).
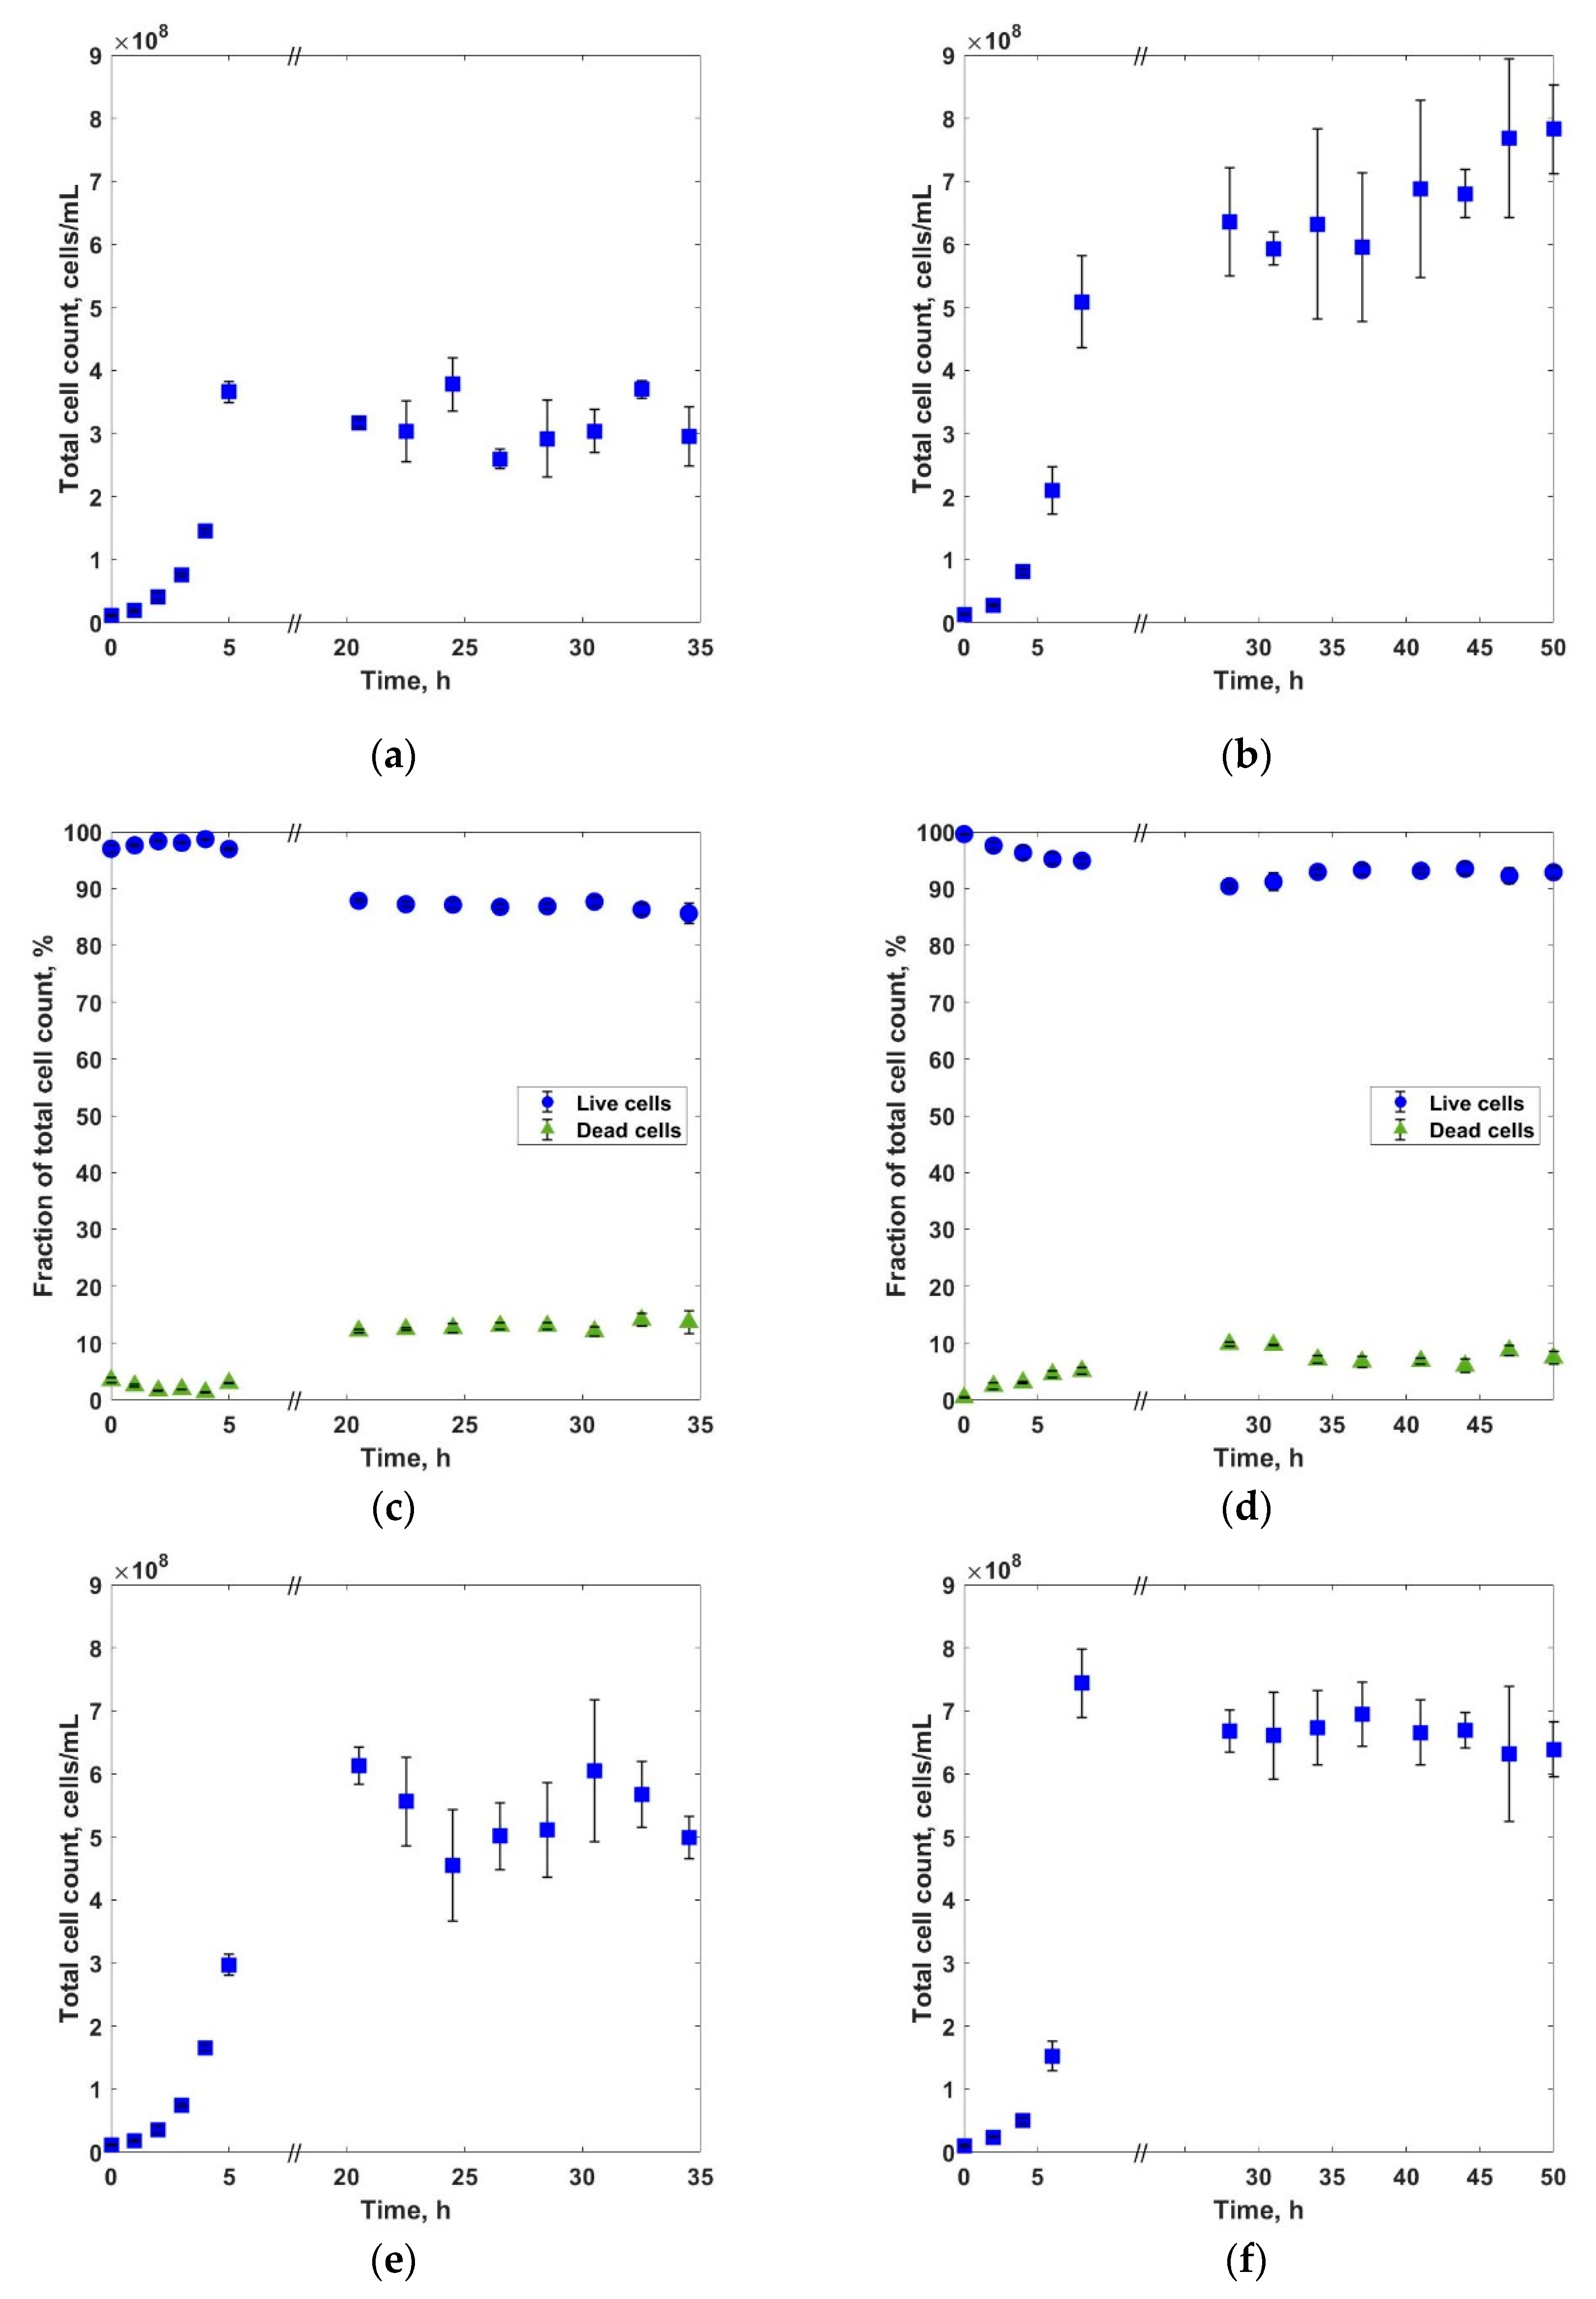
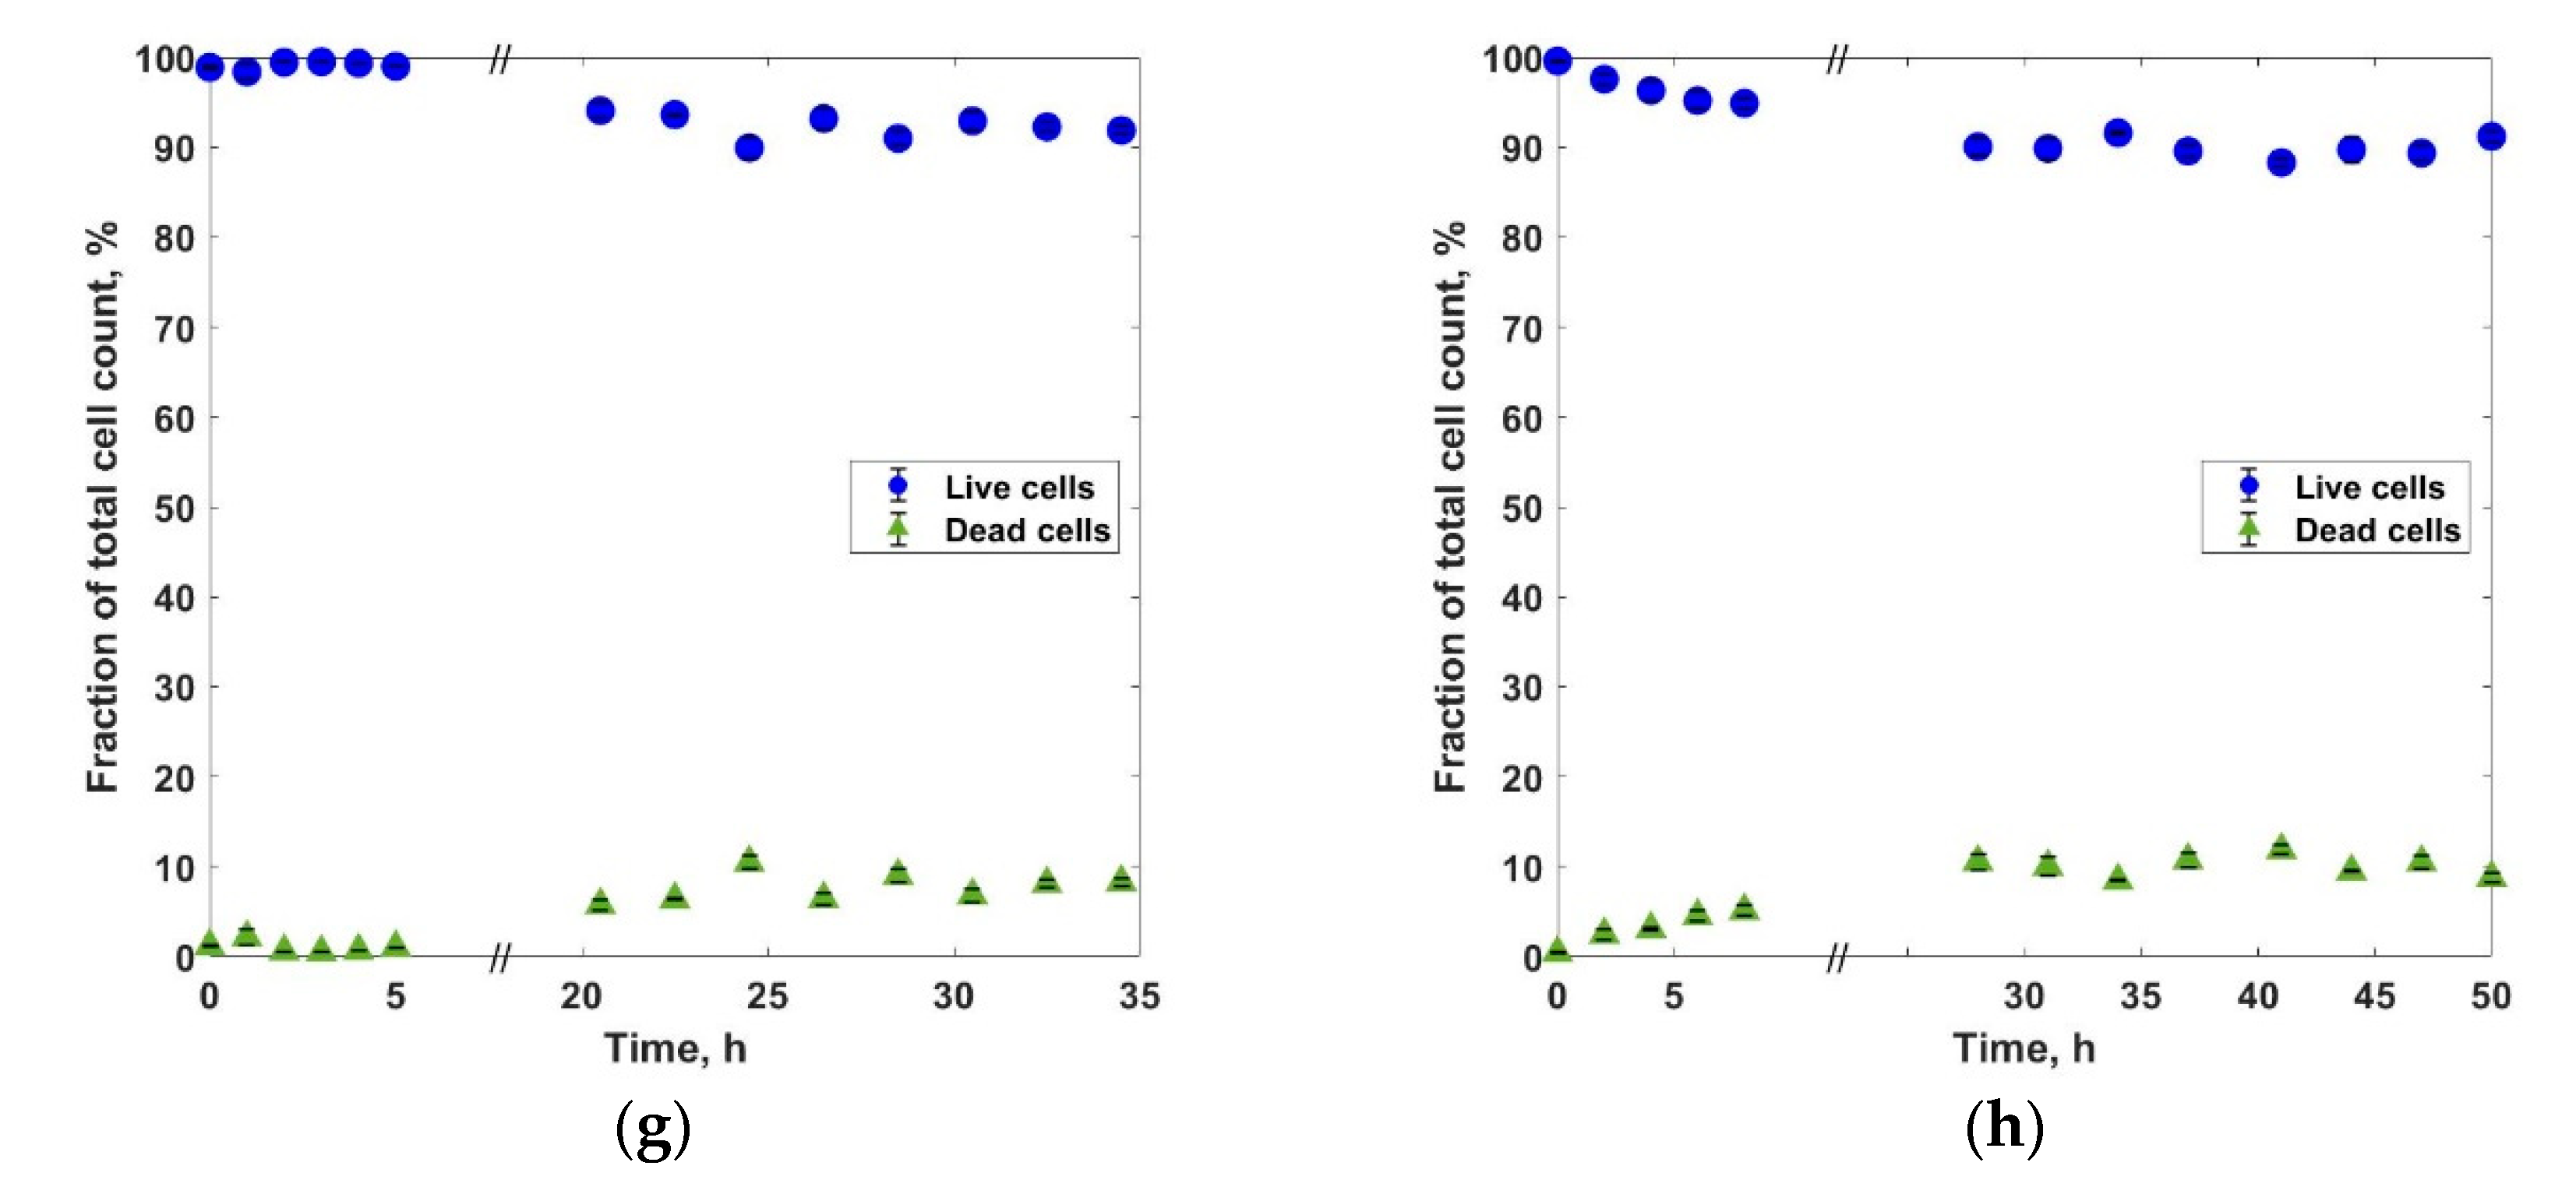
More variation was observed in the cultures when measuring the cell density as TCC (Figure 3). TCC was slightly higher in the culture of E. coli W3110 on glycerol with and without IPTG, and the difference was statistically significant (Figure 3a,b,e,f; Mann–Whitney U test, p < 0.05). However, the percentage of live and dead cells between the two cultures was not statistically significant (Figure 3c,d,g,h; Mann–Whitney U test, p > 0.05) and for both substrates the percentage of live cells was maintained high.
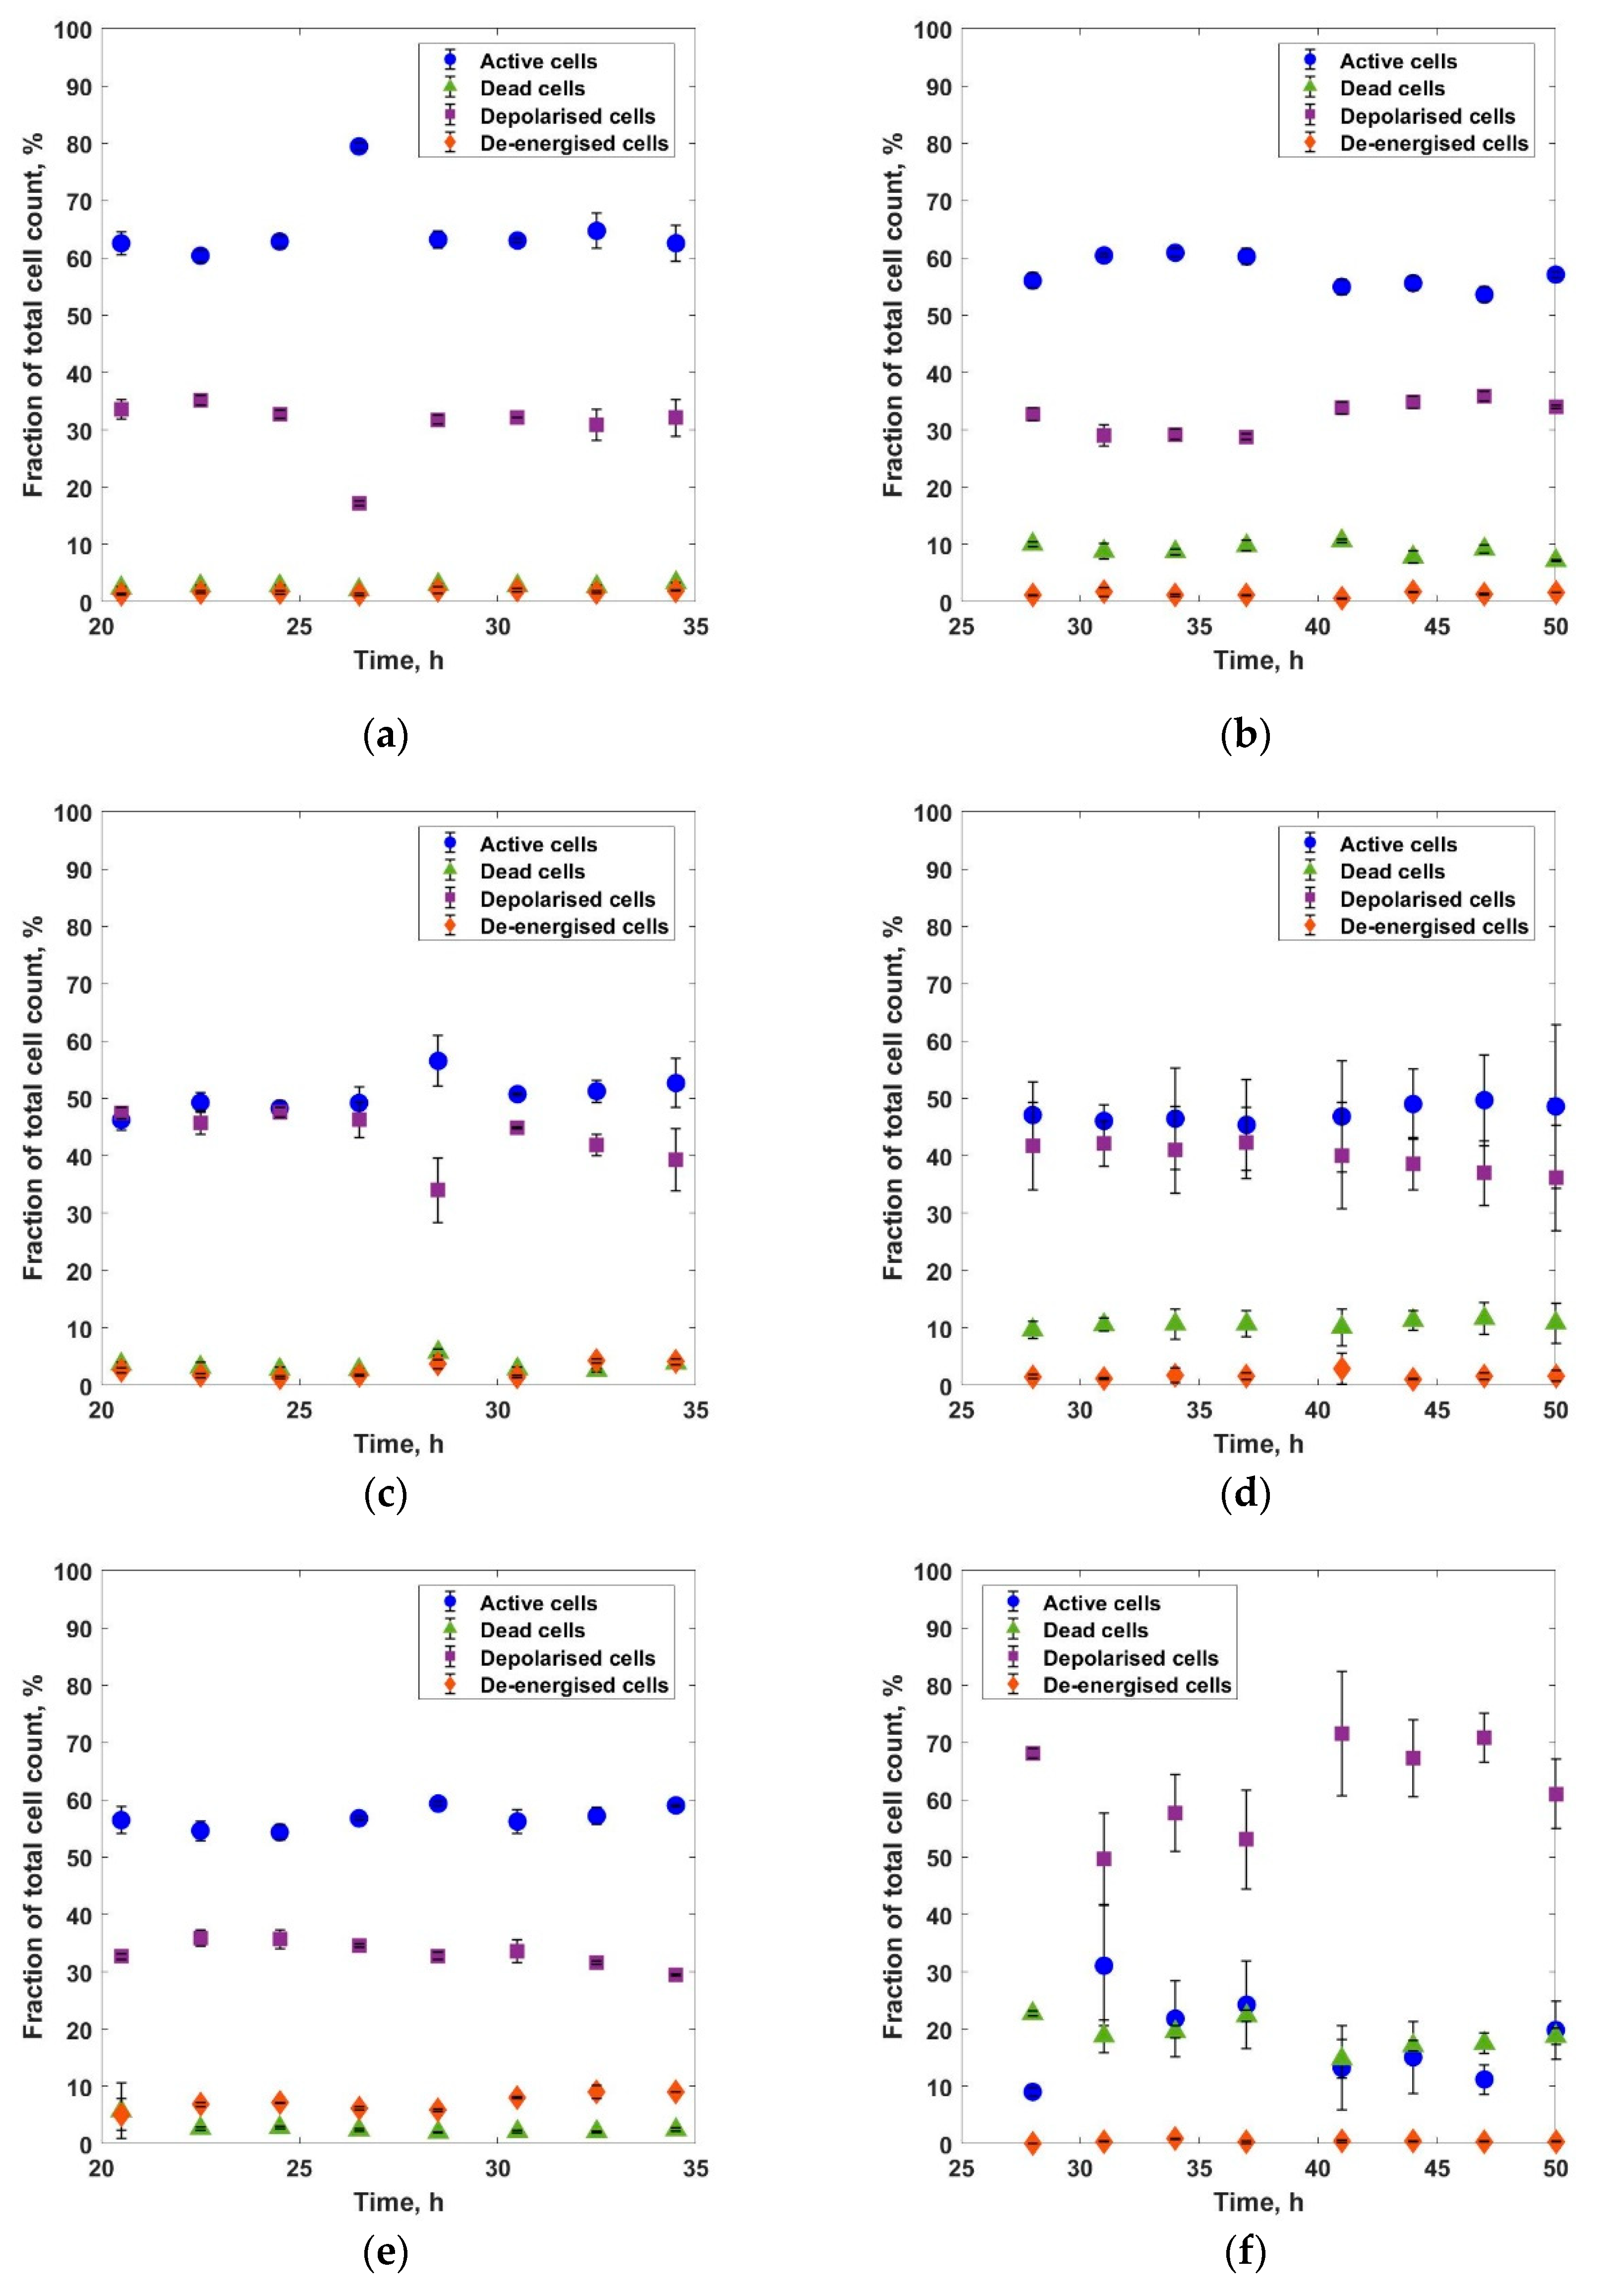
We further studied the stability of the cultures in the chemostat by measuring the changes in membrane potential, which is indicative of bacterial stress [33]. Samples collected after the bioreactor had reached steady state (and corresponding to the same sampling point as in Figure 2) were stained with a triple dye combination of DIBAC4(3)/ethidium bromide/PI. Primarily, all metabolically active cells with intact cytoplasmic membranes maintain membrane potential [34]. When membrane potential tends towards zero, the membrane is damaged, with ions travelling freely through it. This may not necessarily mean the cell is dead, but ‘compromised’ with decreased cellular functions, including biosynthesis of proteins and DNA, efflux pumping and respiration activity [35,36]. A membrane potential dye, DIBAC4(3) is excluded from polarised cells that maintain membrane potential [37]. This means that well-energised (metabolically active) cells have low fluorescence DIBAC4(3) staining. To further distinguish between the metabolically active populations, EB staining was applied. EB is used to assess the efflux pump activity, retained by cells with inactive efflux pump—‘de-energised’ population [38]; and pumped out of cells with functional efflux pumps—‘active’ population [39]. Cells that exhibit an increase in DIBAC4(3) fluorescence intensity are considered to have undergone membrane depolarization, although the dye also stains ‘permeabilised’ cells with zero membrane potential. PI staining was applied to further distinguish between ‘depolarised’ and ‘permeabilised’ (dead) cells. The PI also displaces EB staining (which permeates all cell membranes and binds to RNA and DNA) in ‘permeabilised’ cells [35].
The heterogeneity in the cultures (measured as the variation in the percentage of active, depolarised, de-energised and dead cells) increased in the culture with glycerol as the carbon source (Figure 4). All but the percentages of depolarised and de-energised cells for E. coli W3110 (Figure 4a–d) differed significantly between the runs with glucose and with glycerol (Mann–Whitney U test, p < 0.05). Moreover, for E. coli CLD1301 grown on glycerol without the addition of IPTG (Figure 4d), the fraction of depolarised cells overpassed the one of active cells. This indicates that, despite the similar biomass production, the culture on glycerol generated higher heterogeneity in the E. coli population, which was likely to influence the recombinant protein production. A possible explanation for this behavior is the lower quality of glycerol as a carbon source (energetically), putting additional stress on the cells. It is possible that growing on glycerol, the E. coli culture is ‘hedging its bets’, developing several strategies to respond to the perceived starvation, which leads to greater heterogeneity [17]. Additional support for this assumption is the work of Liu et al. [40] who showed that as the quality of the substrate declines, cells express more genes in a ‘foraging effort’, looking for a better carbon source. Therefore, when using glycerol as the carbon source, the trade-off between slightly higher biomass production and higher heterogeneity in the culture needs to be considered.
Due to the overlapping between the DIBAC4(3) and GFP emission, this measurement could not be applied for the induced E. coli CLD1301.
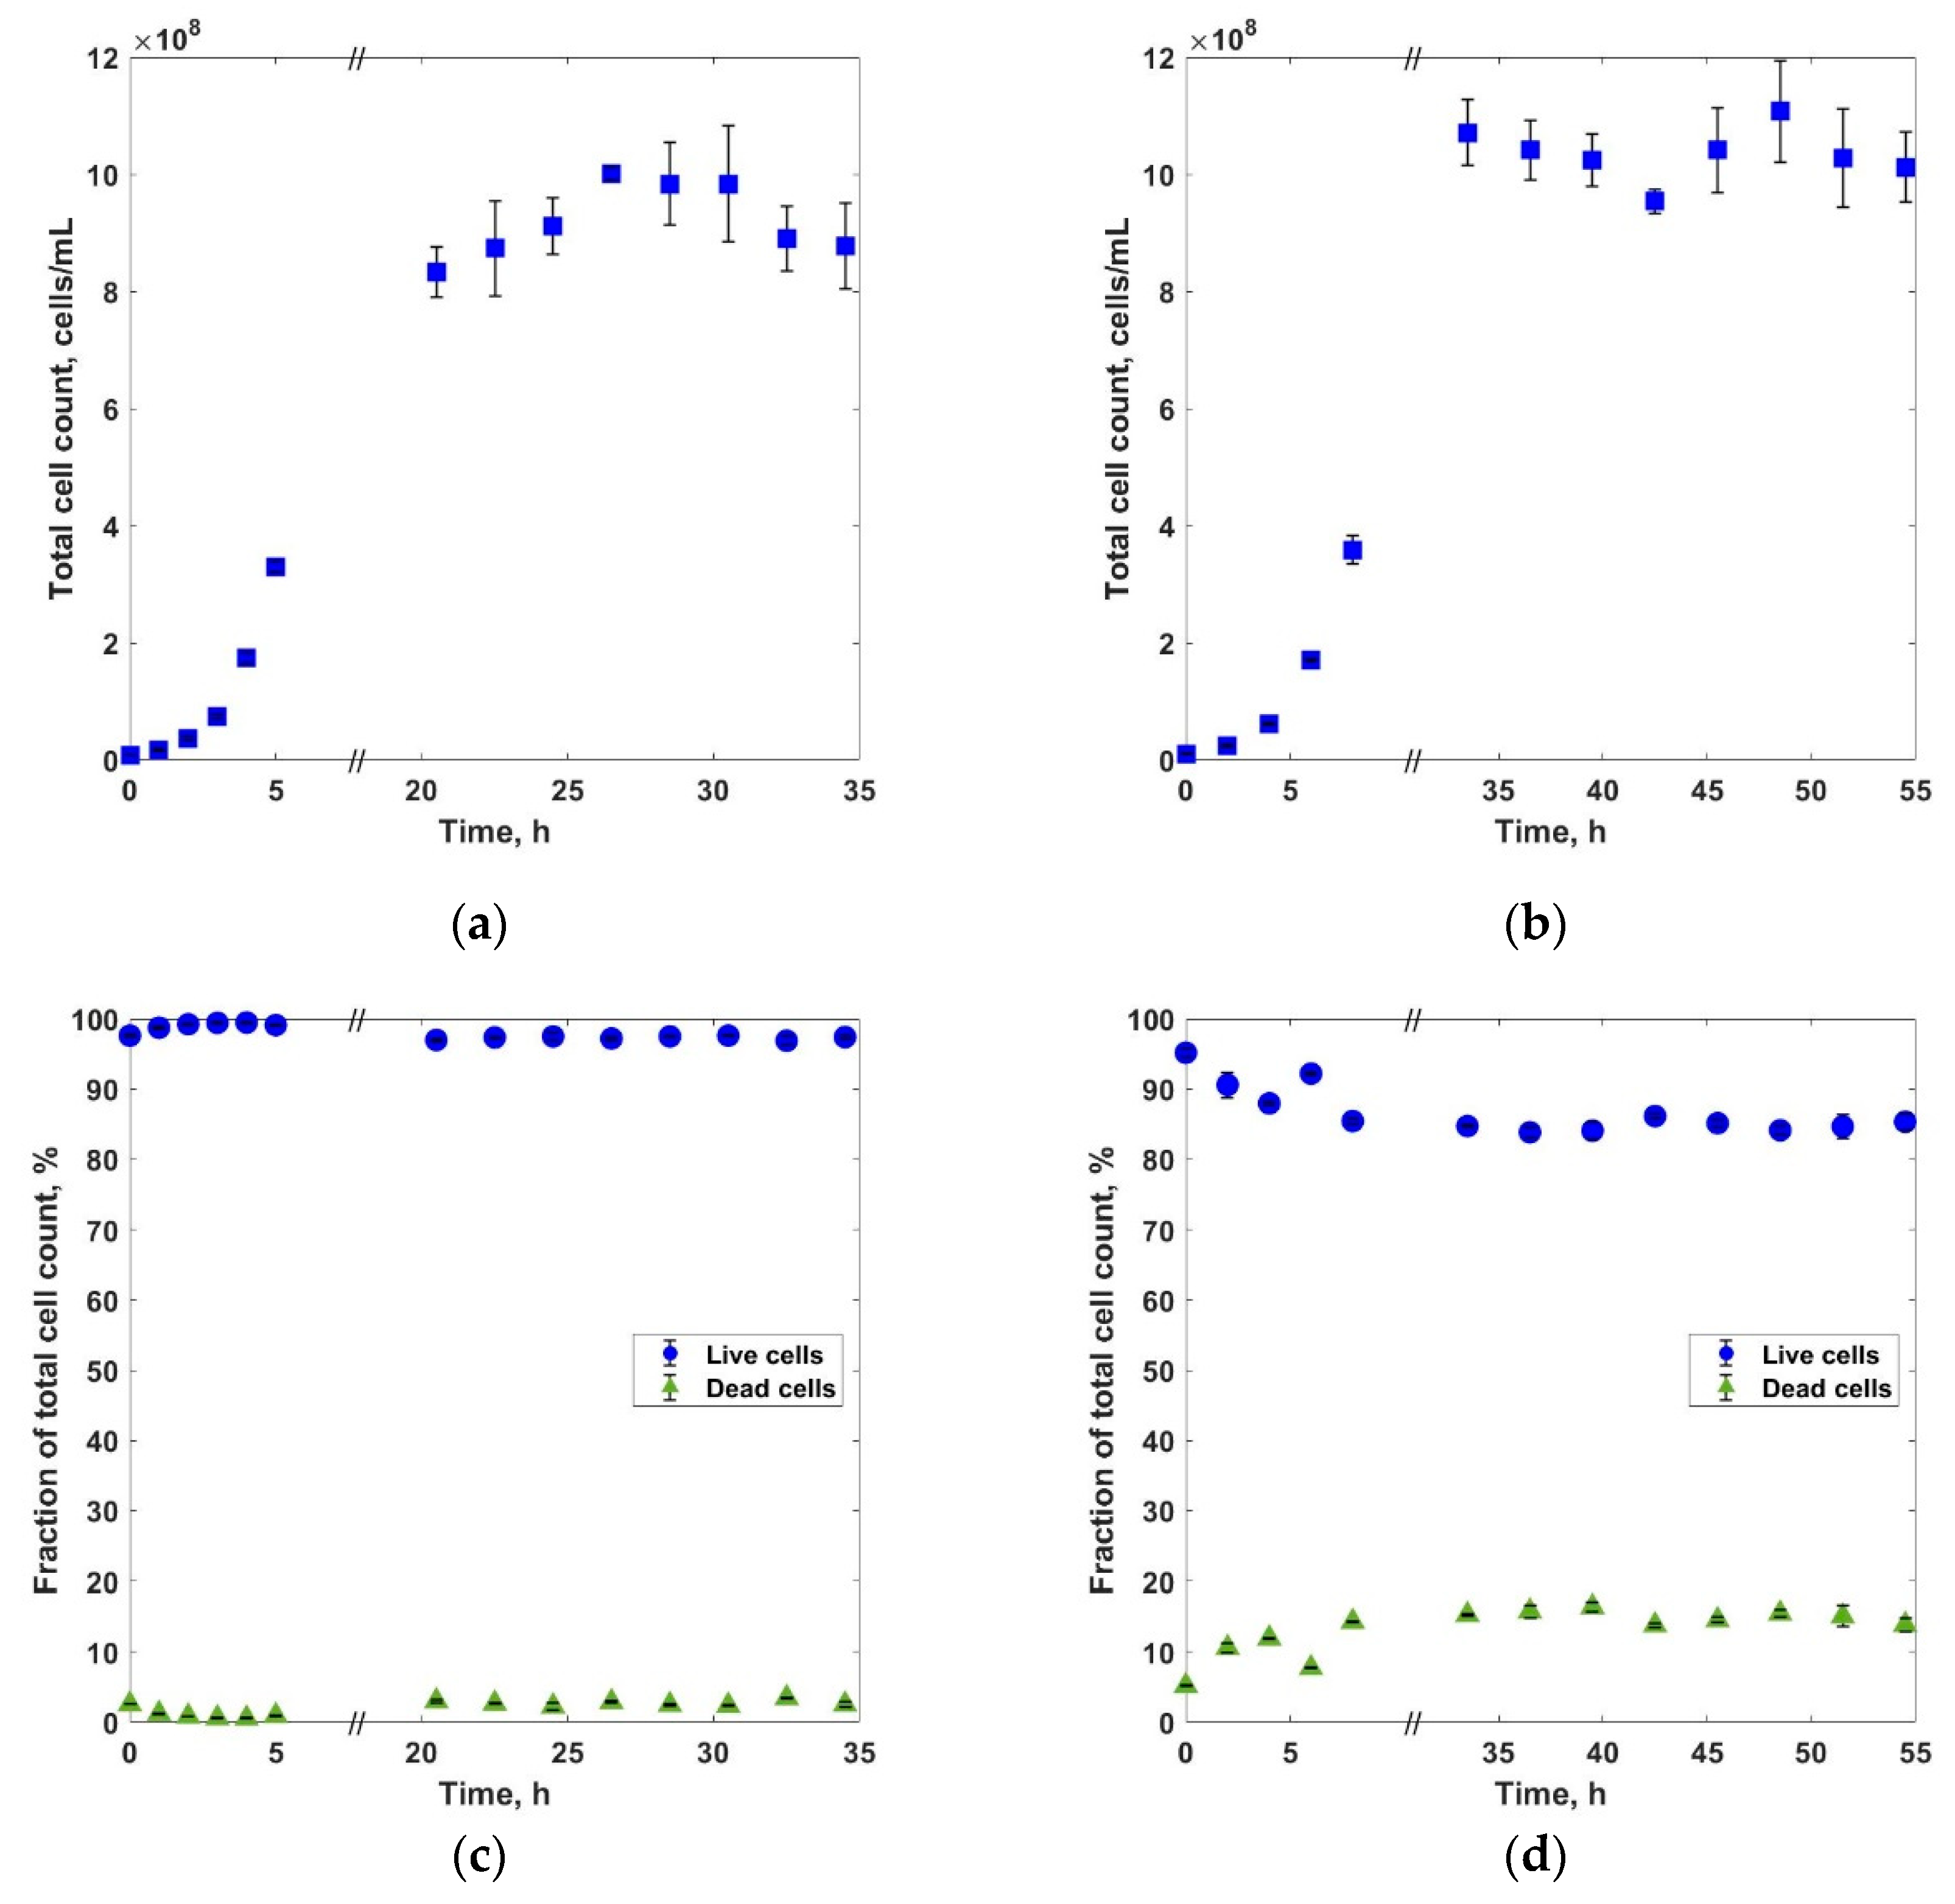
Total cell count was slightly higher in the culture of E. coli CLD1301 on glycerol without IPTG, but the difference was not statistically significant (Figure 5a,b; Mann–Whitney U test, p > 0.05). However, we could see a significant increase in the percentage of dead cells compared with the culture on glucose (Figure 6c,d; Mann–Whitney U test, p < 0.05).
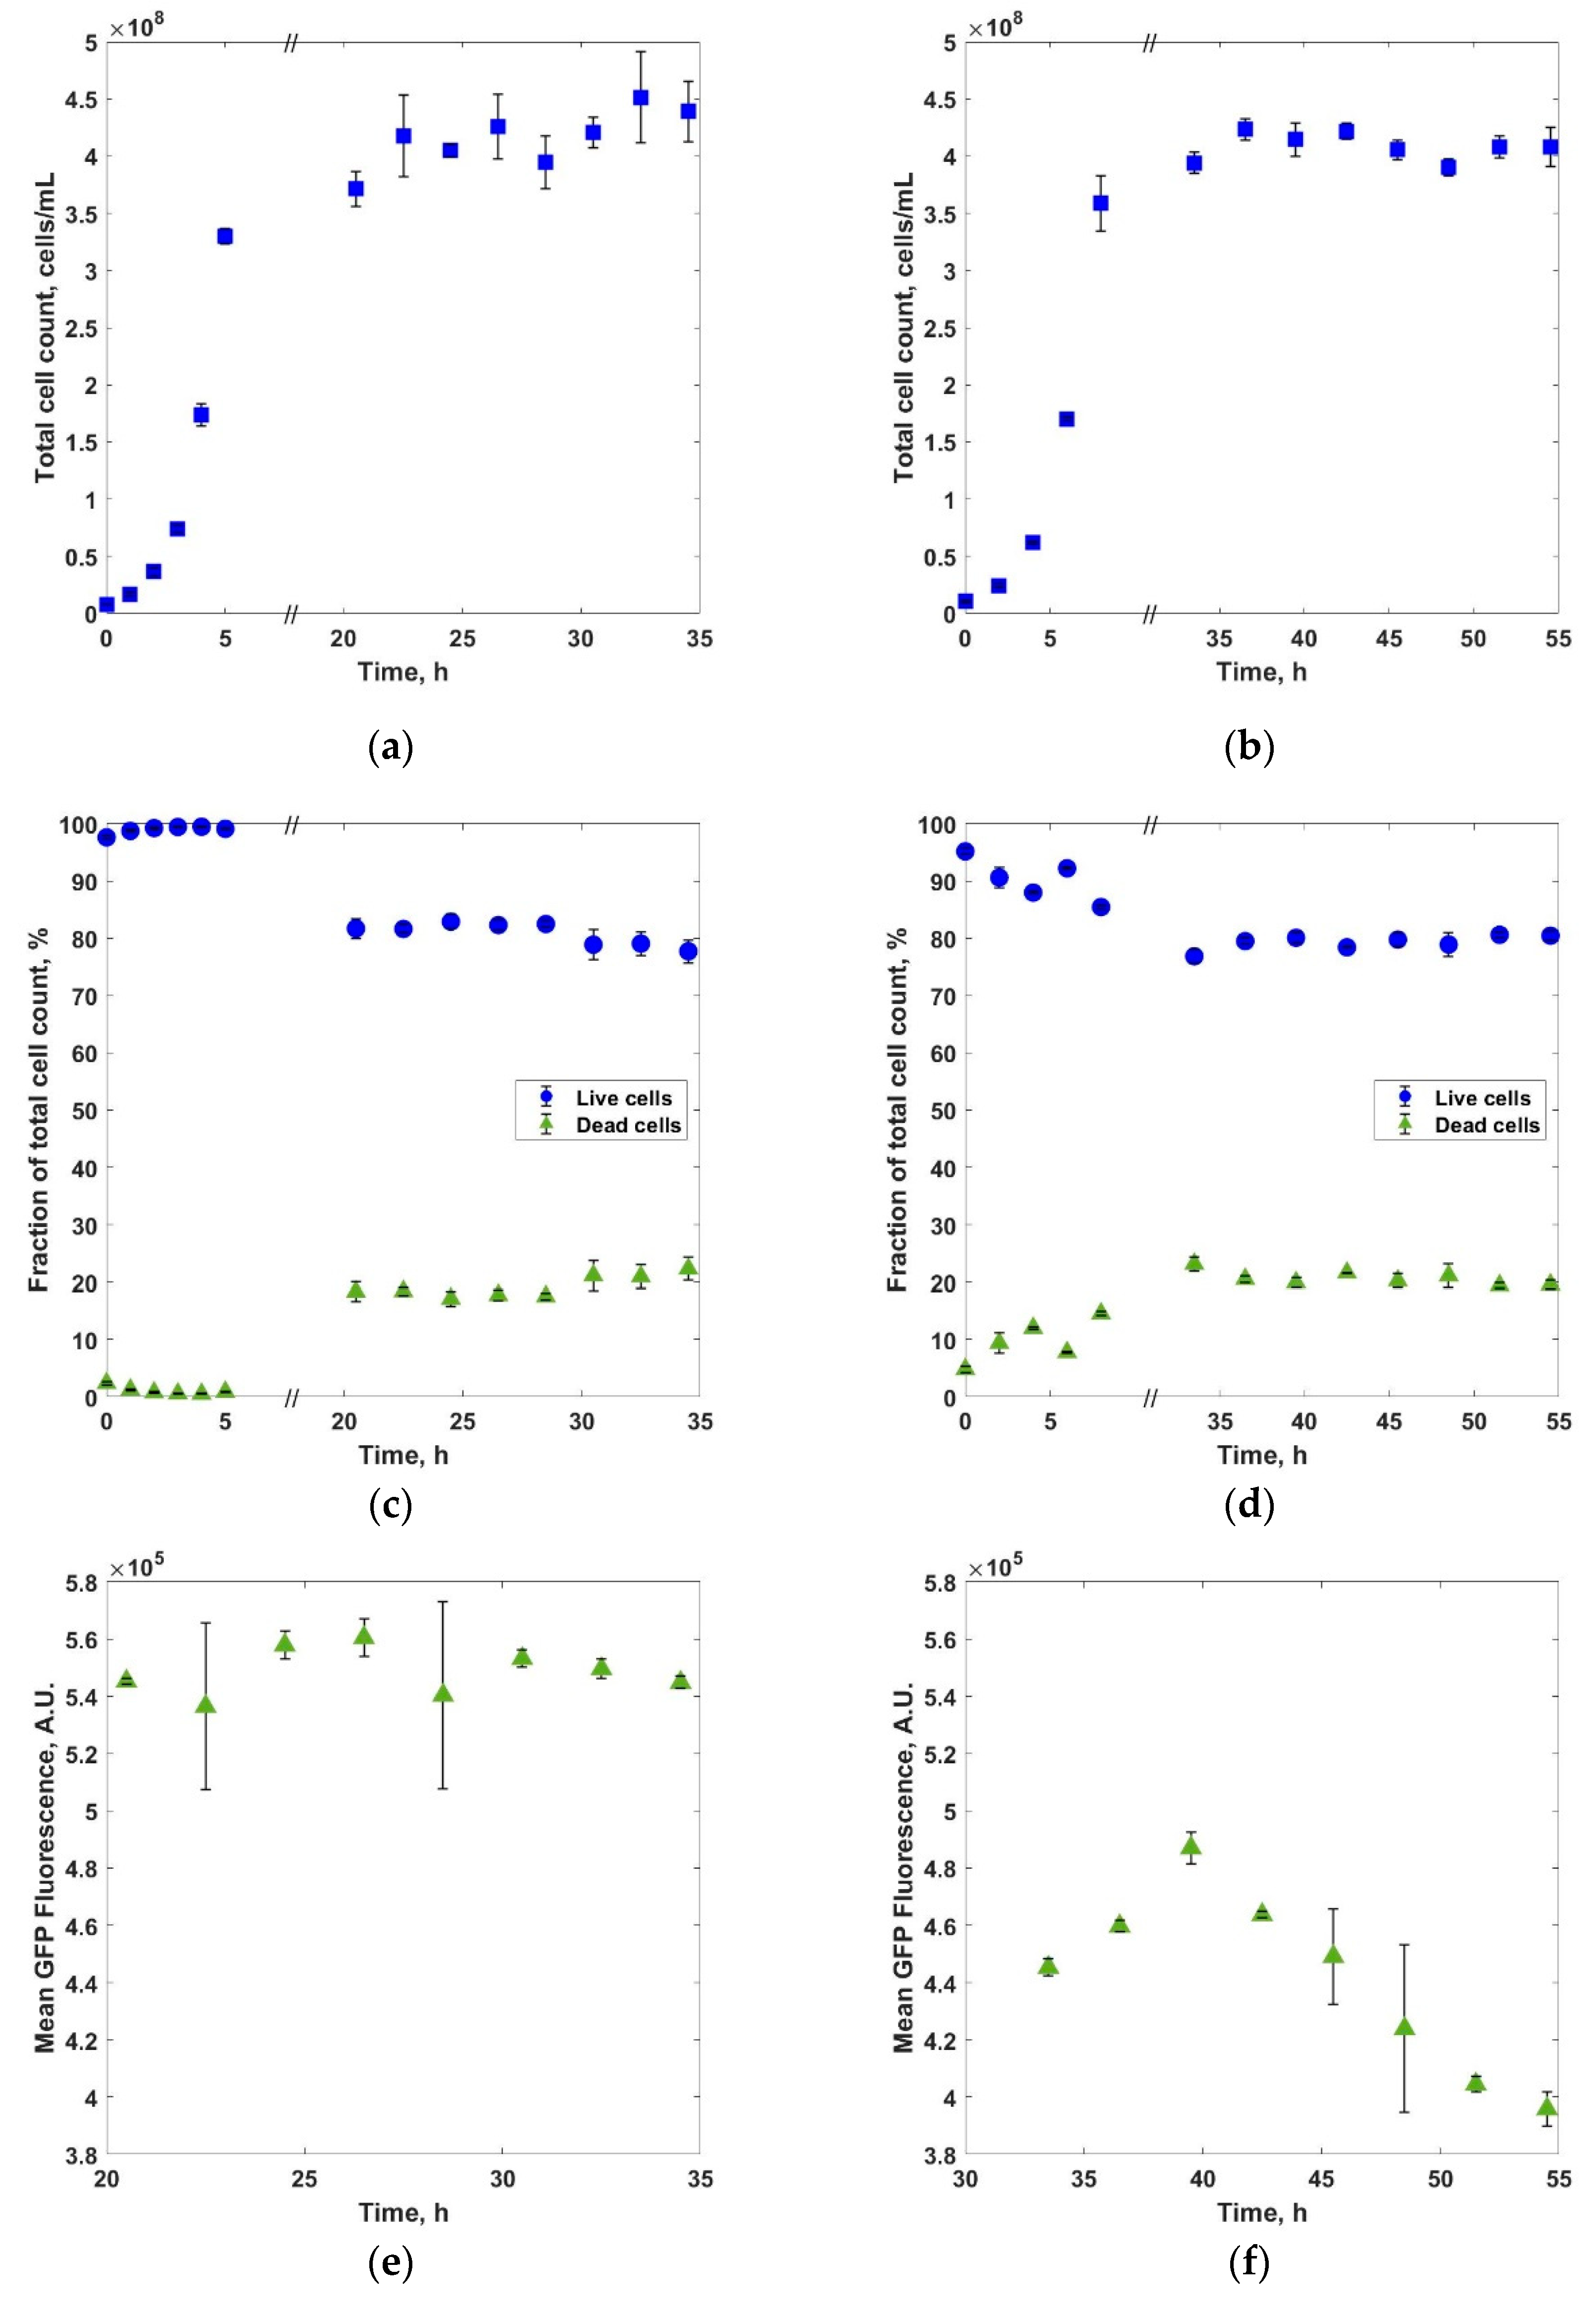
For the induced E. coli CLD1301 culture, there was no significant difference for TCC and live/dead cells between the two substrates (Figure 6a–d; Mann–Whitney U test, p > 0.05) but the mean GFP fluorescence was lower for glycerol (Figure 6e,f; Mann–Whitney U test, p < 0.05). These results align with previous reports that mention glycerol carbon stress in the chemostat cultures of E. coli using glycerol as the carbon source [41].

4. Conclusions

In this study, we compared continuous RPP in E. coli with glucose or glycerol as the sole carbon sources. Through single-cell analysis we could identify the different subpopulations in E. coli chemostat cultures, which revealed a higher heterogeneity than shown by TCC or OD600. Our results indicate that the mean GFP fluorescence is lower, and the protein production is less steady when the culture medium is based on glycerol. This partially confirms previous reports that heterogeneity in microbial production cell lines is detrimental for RPP [42]. We also note that glycerol gave a slightly higher overall biomass. Maintaining a higher biomass production and manipulating the balance between different subpopulations in order to increase the proportion of productive cells may be a possible solution for using glycerol as a successful alternative to glucose.
Reducing heterogeneity and promoting homogeneity is considered a good strategy for forcing cells into high productivity [43]. Nevertheless, heterogeneity is unavoidable and rather than looking to eliminate it, practitioners should consider managing it. We suggest that for a given substrate there is an optimal degree of heterogeneity in a bacterial population that corresponds to the best trade-off between the robustness of the fermentation process and productivity. In order to find this “sweet spot”, besides the high-throughput flow cytometry analysis [20], future work should include further analysis of the subpopulations monitored over a longer time period.

Supplementary Materials

The following are available online at https://www.mdpi.com/article/10.3390/applmicrobiol1020018/s1, Figure S1: Fluorescence microscope images of E. coli CLD1301 cells grown on glucose (a) and glycerol (b) induced with 1 mM IPTG and stained with propidium iodide (PI)., Figure S2: The influence of IPTG concentration on biomass and GFP fluorescence for E. coli CLD1301 grown on (a) glucose and (b) glycerol. Figure S3: Volatile fatty acids concentrations.

Author Contributions

Conceptualization, I.D.O. and A.W.; methodology, I.D.O., A.M.M., W.S. and A.W.; data analysis, A.M.M. and V.G.; writing—original draft preparation, A.M.M. and V.G.; writing—review and editing, A.M.M., V.G., W.S., A.W. and I.D.O.; supervision, I.D.O. and A.W.; funding acquisition, I.D.O. All authors have read and agreed to the published version of the manuscript.

Funding

This research was funded by EPSRC through the DTA scholarship for A.M.M..

Data Availability Statement

All data generated and analysed during this study are included in this article. Raw datasets are available from the corresponding author on reasonable request.

Acknowledgments

The authors acknowledge the support of Andrew Fuller from the Newcastle University Flowcytometry Core Facility.

Conflicts of Interest

The authors declare no conflict of interest.

References

  1. Tripathi, N.K.; Shrivastava, A. Recent developments in bioprocessing of recombinant proteins: Expression hosts and process development. Front. Bioeng. Biotechnol. 2019, 7, 420. [Google Scholar] [CrossRef] [Green Version]
  2. Baeshen, M.N.; Al-Hejin, A.M.; Bora, R.S.; Ahmed, M.M.M.; Ramadan, H.A.I.; Saini, K.S.; Baeshen, N.A.; Redwan, E.M. Production of biopharmaceuticals in E. coli: Current scenario and future perspectives. J. Microbiol. Biotechnol. 2015, 25, 953–962. [Google Scholar] [CrossRef]
  3. Steinebach, F.; Ulmer, N.; Wolf, M.; Decker, L.; Schneider, V.; Wälchli, R.; Karst, D.; Souquet, J.; Morbidelli, M. Design and operation of a continuous integrated monoclonal antibody production process. Biotechnol. Prog. 2017, 33, 1303–1313. [Google Scholar] [CrossRef]
  4. Zhang, X.; Tervo, C.J.; Reed, J.L. Metabolic assessment of E. coli as a Biofactory for commercial products. Metab. Eng. 2016, 35, 64–74. [Google Scholar] [CrossRef] [Green Version]
  5. Diers, I.V.; Rasmussen, E.; Larsen, P.H.; Kjaersig, I.L. Yeast fermentation processes for insulin production. Bioprocess Technol. 1991, 13, 166–176. [Google Scholar]
  6. Egli, T. Microbial growth and physiology: A call for better craftsmanship. Front. Microbiol. 2015, 6, 287. [Google Scholar] [CrossRef]
  7. Walther, J.; Lu, J.; Hollenbach, M.; Yu, M.; Hwang, C.; McLarty, J.; Brower, K. Perfusion cell culture decreases process and product heterogeneity in a head-to-head comparison with fed-batch. Biotechnol. J. 2019, 14, 1700733. [Google Scholar] [CrossRef]
  8. Warikoo, V.; Godawat, R.; Brower, K.; Jain, S.; Cummings, D.; Simons, E.; Johnson, T.; Walther, J.; Yu, M.; Wright, B.; et al. Integrated continuous production of recombinant therapeutic proteins. Biotechnol. Bioeng. 2012, 109, 3018–3029. [Google Scholar] [CrossRef]
  9. Peebo, K.; Neubauer, P. Application of Continuous Culture Methods to Recombinant Protein Production in Microorganisms. Microorganisms 2018, 6, 56. [Google Scholar] [CrossRef] [Green Version]
  10. Croughan, M.S.; Konstantinov, K.B.; Cooney, C. The future of industrial bioprocessing: Batch or continuous? Biotechnol. Bioeng. 2015, 112, 648–651. [Google Scholar] [CrossRef]
  11. Fragoso-Jiménez, J.C.; Baert, J.; Nguyen, T.M.; Liu, W.; Sassi, H.; Goormaghtigh, F.; Van Melderen, L.; Gaytán, P.; Hernández-Chávez, G.; Martinez, A.; et al. Growth-dependent recombinant product formation kinetics can be reproduced through engineering of glucose transport and is prone to phenotypic heterogeneity. Microb. Cell Factories 2019, 18, 1–16. [Google Scholar] [CrossRef]
  12. Scott, M.; Gunderson, C.W.; Mateescu, E.M.; Zhang, Z.; Hwa, T. Interdependence of Cell Growth and Gene Expression: Origins and Consequences. Science 2010, 330, 1099–1102. [Google Scholar] [CrossRef]
  13. Schmideder, A.; Weuster-Botz, D. High-performance recombinant protein production with Escherichia coli in continuously operated cascades of stirred-tank reactors. J. Ind. Microbiol. Biotechnol. 2017, 44, 1021–1029. [Google Scholar] [CrossRef]
  14. Schmideder, A.; Cremer, J.H.; Weuster-Botz, D. Parallel steady state studies on a milliliter scale accelerate fed-batch bioprocess design for recombinant protein production with Escherichia coli. Biotechnol. Prog. 2016, 32, 1426–1435. [Google Scholar] [CrossRef]
  15. Kopp, J.; Slouka, C.; Spadiut, O.; Herwig, C. The rocky road from fed-batch to continuous processing with E. coli. Front. Bioeng. Biotechnol. 2019, 7, 328. [Google Scholar] [CrossRef] [PubMed]
  16. Slouka, C.; Kopp, J.; Strohmer, D.; Kager, J.; Spadiut, O.; Herwig, C. Monitoring and control strategies for inclusion body production in E. coli based on glycerol consumption. J. Biotechnol. 2019, 296, 75–82. [Google Scholar] [CrossRef]
  17. Martínez-Gómez, K.; Flores, N.; Castañeda, H.M.; Martínez-Batallar, G.; Hernández-Chávez, G.; Ramírez, O.T.; Gosset, G.; Encarnación, S.; Bolivar, F. New insights into Escherichia coli metabolism: Carbon scavenging, acetate metabolism and carbon recycling responses during growth on glycerol. Microb. Cell Factories 2012, 11, 46. [Google Scholar] [CrossRef] [Green Version]
  18. Monteiro, M.R.; Kugelmeier, C.L.; Pinheiro, R.S.; Batalha, M.O.; César, A. Glycerol from biodiesel production: Technological paths for sustainability. Renew. Sustain. Energy Rev. 2018, 88, 109–122. [Google Scholar] [CrossRef]
  19. Cabaleiro, R.G.; Mitchell, A.M.; Smith, W.; Wipat, A.; Ofiţeru, I.D. Heterogeneity in Pure Microbial Systems: Experimental Measurements and Modeling. Front. Microbiol. 2017, 8, 1813. [Google Scholar] [CrossRef] [Green Version]
  20. Heins, A.-L.; Johanson, T.; Han, S.; Lundin, L.; Carlquist, M.; Gernaey, K.V.; Sørensen, S.J.; Lantz, A.E. Quantitative Flow Cytometry to Understand Population Heterogeneity in Response to Changes in Substrate Availability in Escherichia coli and Saccharomyces cerevisiae Chemostats. Front. Bioeng. Biotechnol. 2019, 7, 187. [Google Scholar] [CrossRef] [Green Version]
  21. Ihssen, J.; Egli, T. Specific growth rate and not cell density controls the general stress response in Escherichia coli. Microbiology 2004, 150, 1637–1648. [Google Scholar] [CrossRef] [Green Version]
  22. Beal, J.; Farny, N.G.; Haddock-Angelli, T.; Selvarajah, V.; iGEM Interlab Study Contributors. Robust estimation of bacterial cell count from optical density. Commun. Biol. 2020, 3, 512. [Google Scholar] [CrossRef]
  23. McHugh, I.O.L.; Tucker, A.L. Flow cytometry for the rapid detection of bacteria in cell culture production medium. Cytom. Part A 2007, 71, 1019–1026. [Google Scholar] [CrossRef]
  24. Davey, H.M.; Kell, D.B. Flow cytometry and cell sorting of heterogeneous microbial populations: The importance of single-cell analyses. Microbiol. Rev. 1996, 60, 641–696. [Google Scholar] [CrossRef]
  25. Caron, G.N.-V.; Stephens, A.W. Badley Assessment of bacterial viability status by flow cytometry and single cell sorting. J. Appl. Microbiol. 1998, 84, 988–998. [Google Scholar] [CrossRef]
  26. Schaechter, M. A brief history of bacterial growth physiology. Front. Microbiol. 2015, 6, 289. [Google Scholar] [CrossRef] [Green Version]
  27. Kopp, J.; Slouka, C.; Ulonska, S.; Kager, J.; Fricke, J.; Spadiut, O.; Herwig, C. Impact of Glycerol as Carbon Source onto Specific Sugar and Inducer Uptake Rates and Inclusion Body Productivity in E. coli BL21(DE3). Bioengineering 2017, 5, 1. [Google Scholar] [CrossRef] [Green Version]
  28. Eiteman, M.; Altman, E. Overcoming acetate in Escherichia coli recombinant protein fermentations. Trends Biotechnol. 2006, 24, 530–536. [Google Scholar] [CrossRef]
  29. Kosinski, M.J.; Rinas, U.; Bailey, J.E. Isopropyl-β-d-thiogalactopyranoside influences the metabolism of Escherichia coli. Appl. Microbiol. Biotechnol. 1992, 36, 782–784. [Google Scholar] [CrossRef]
  30. Dvorak, P.; Chrast, L.; Nikel, P.I.; Fedr, R.; Soucek, K.; Sedlackova, M.; Chaloupkova, R.; De Lorenzo, V.; Prokop, Z.; Damborsky, J. Exacerbation of substrate toxicity by IPTG in Escherichia coli BL21(DE3) carrying a synthetic metabolic pathway. Microb. Cell Factories 2015, 14, 1–15. [Google Scholar] [CrossRef] [Green Version]
  31. Malakar, P.; Venkatesh, K.V. Effect of substrate and IPTG concentrations on the burden to growth of Escherichia coli on glycerol due to the expression of Lac proteins. Appl. Microbiol. Biotechnol. 2012, 93, 2543–2549. [Google Scholar] [CrossRef]
  32. Gomes, L.; Monteiro, G.; Mergulhão, F. The impact of IPTG induction on plasmid stability and heterologous protein expression by Escherichia coli biofilms. Int. J. Mol. Sci. 2020, 21, 576. [Google Scholar] [CrossRef] [Green Version]
  33. Benarroch, J.; Asally, M. The Microbiologist’s Guide to Membrane Potential Dynamics. Trends Microbiol. 2020, 28, 304–314. [Google Scholar] [CrossRef] [Green Version]
  34. Diaz, M.; Herrero, M.; Garcia, L.; Quirós, C. Application of flow cytometry to industrial microbial bioprocesses. Biochem. Eng. J. 2010, 48, 385–407. [Google Scholar] [CrossRef]
  35. Nebe-Von-Caron, G.; Stephens, P.; Hewitt, C.; Powell, J.; Badley, R. Analysis of bacterial function by multi-colour fluorescence flow cytometry and single cell sorting. J. Microbiol. Methods 2000, 42, 97–114. [Google Scholar] [CrossRef]
  36. Bridier, A.; Hammes, F.; Canette, A.; Bouchez, T.; Briandet, R. Fluorescence-based tools for single-cell approaches in food microbiology. Int. J. Food Microbiol. 2015, 213, 2–16. [Google Scholar] [CrossRef] [PubMed]
  37. Davey, H.; Guyot, S. Estimation of Microbial Viability Using Flow Cytometry. Curr. Protoc. Cytom. 2020, 93, e72. [Google Scholar] [CrossRef] [Green Version]
  38. Kim, H.T.; Choi, H.J.; Kim, K.H. Flow cytometric analysis of Salmonella enterica serotype Typhimurium inactivated with supercritical carbon dioxide. J. Microbiol. Methods 2009, 78, 155–160. [Google Scholar] [CrossRef] [PubMed]
  39. Hewitt, C.J.; Nebe-Von-Caron, G. An industrial application of multiparameter flow cytometry: Assessment of cell physiological state and its application to the study of microbial fermentations. Cytometry 2001, 44, 179–187. [Google Scholar] [CrossRef]
  40. Liu, M.; Durfee, T.; Cabrera, J.E.; Zhao, K.; Jin, D.J.; Blattner, F.R. Global Transcriptional Programs Reveal a Carbon Source Foraging Strategy by Escherichia coli. J. Biol. Chem. 2005, 280, 15921–15927. [Google Scholar] [CrossRef] [Green Version]
  41. Kittler, S.; Kopp, J.; Veelenturf, P.G.; Spadiut, O.; Delvigne, F.; Herwig, C.; Slouka, C. The Lazarus Escherichia coli Effect: Recovery of Productivity on Glycerol/Lactose Mixed Feed in Continuous Biomanufacturing. Front. Bioeng. Biotechnol. 2020, 8, 993. [Google Scholar] [CrossRef] [PubMed]
  42. Delvigne, F.; Goffin, P. Microbial heterogeneity affects bioprocess robustness: Dynamic single-cell analysis contributes to understanding of microbial populations. Biotechnol. J. 2013, 9, 61–72. [Google Scholar] [CrossRef] [PubMed]
  43. Binder, D.; Drepper, T.; Jaeger, K.-E.; Delvigne, F.; Wiechert, W.; Kohlheyer, D.; Grünberger, A. Homogenizing bacterial cell factories: Analysis and engineering of phenotypic heterogeneity. Metab. Eng. 2017, 42, 145–156. [Google Scholar] [CrossRef] [PubMed]
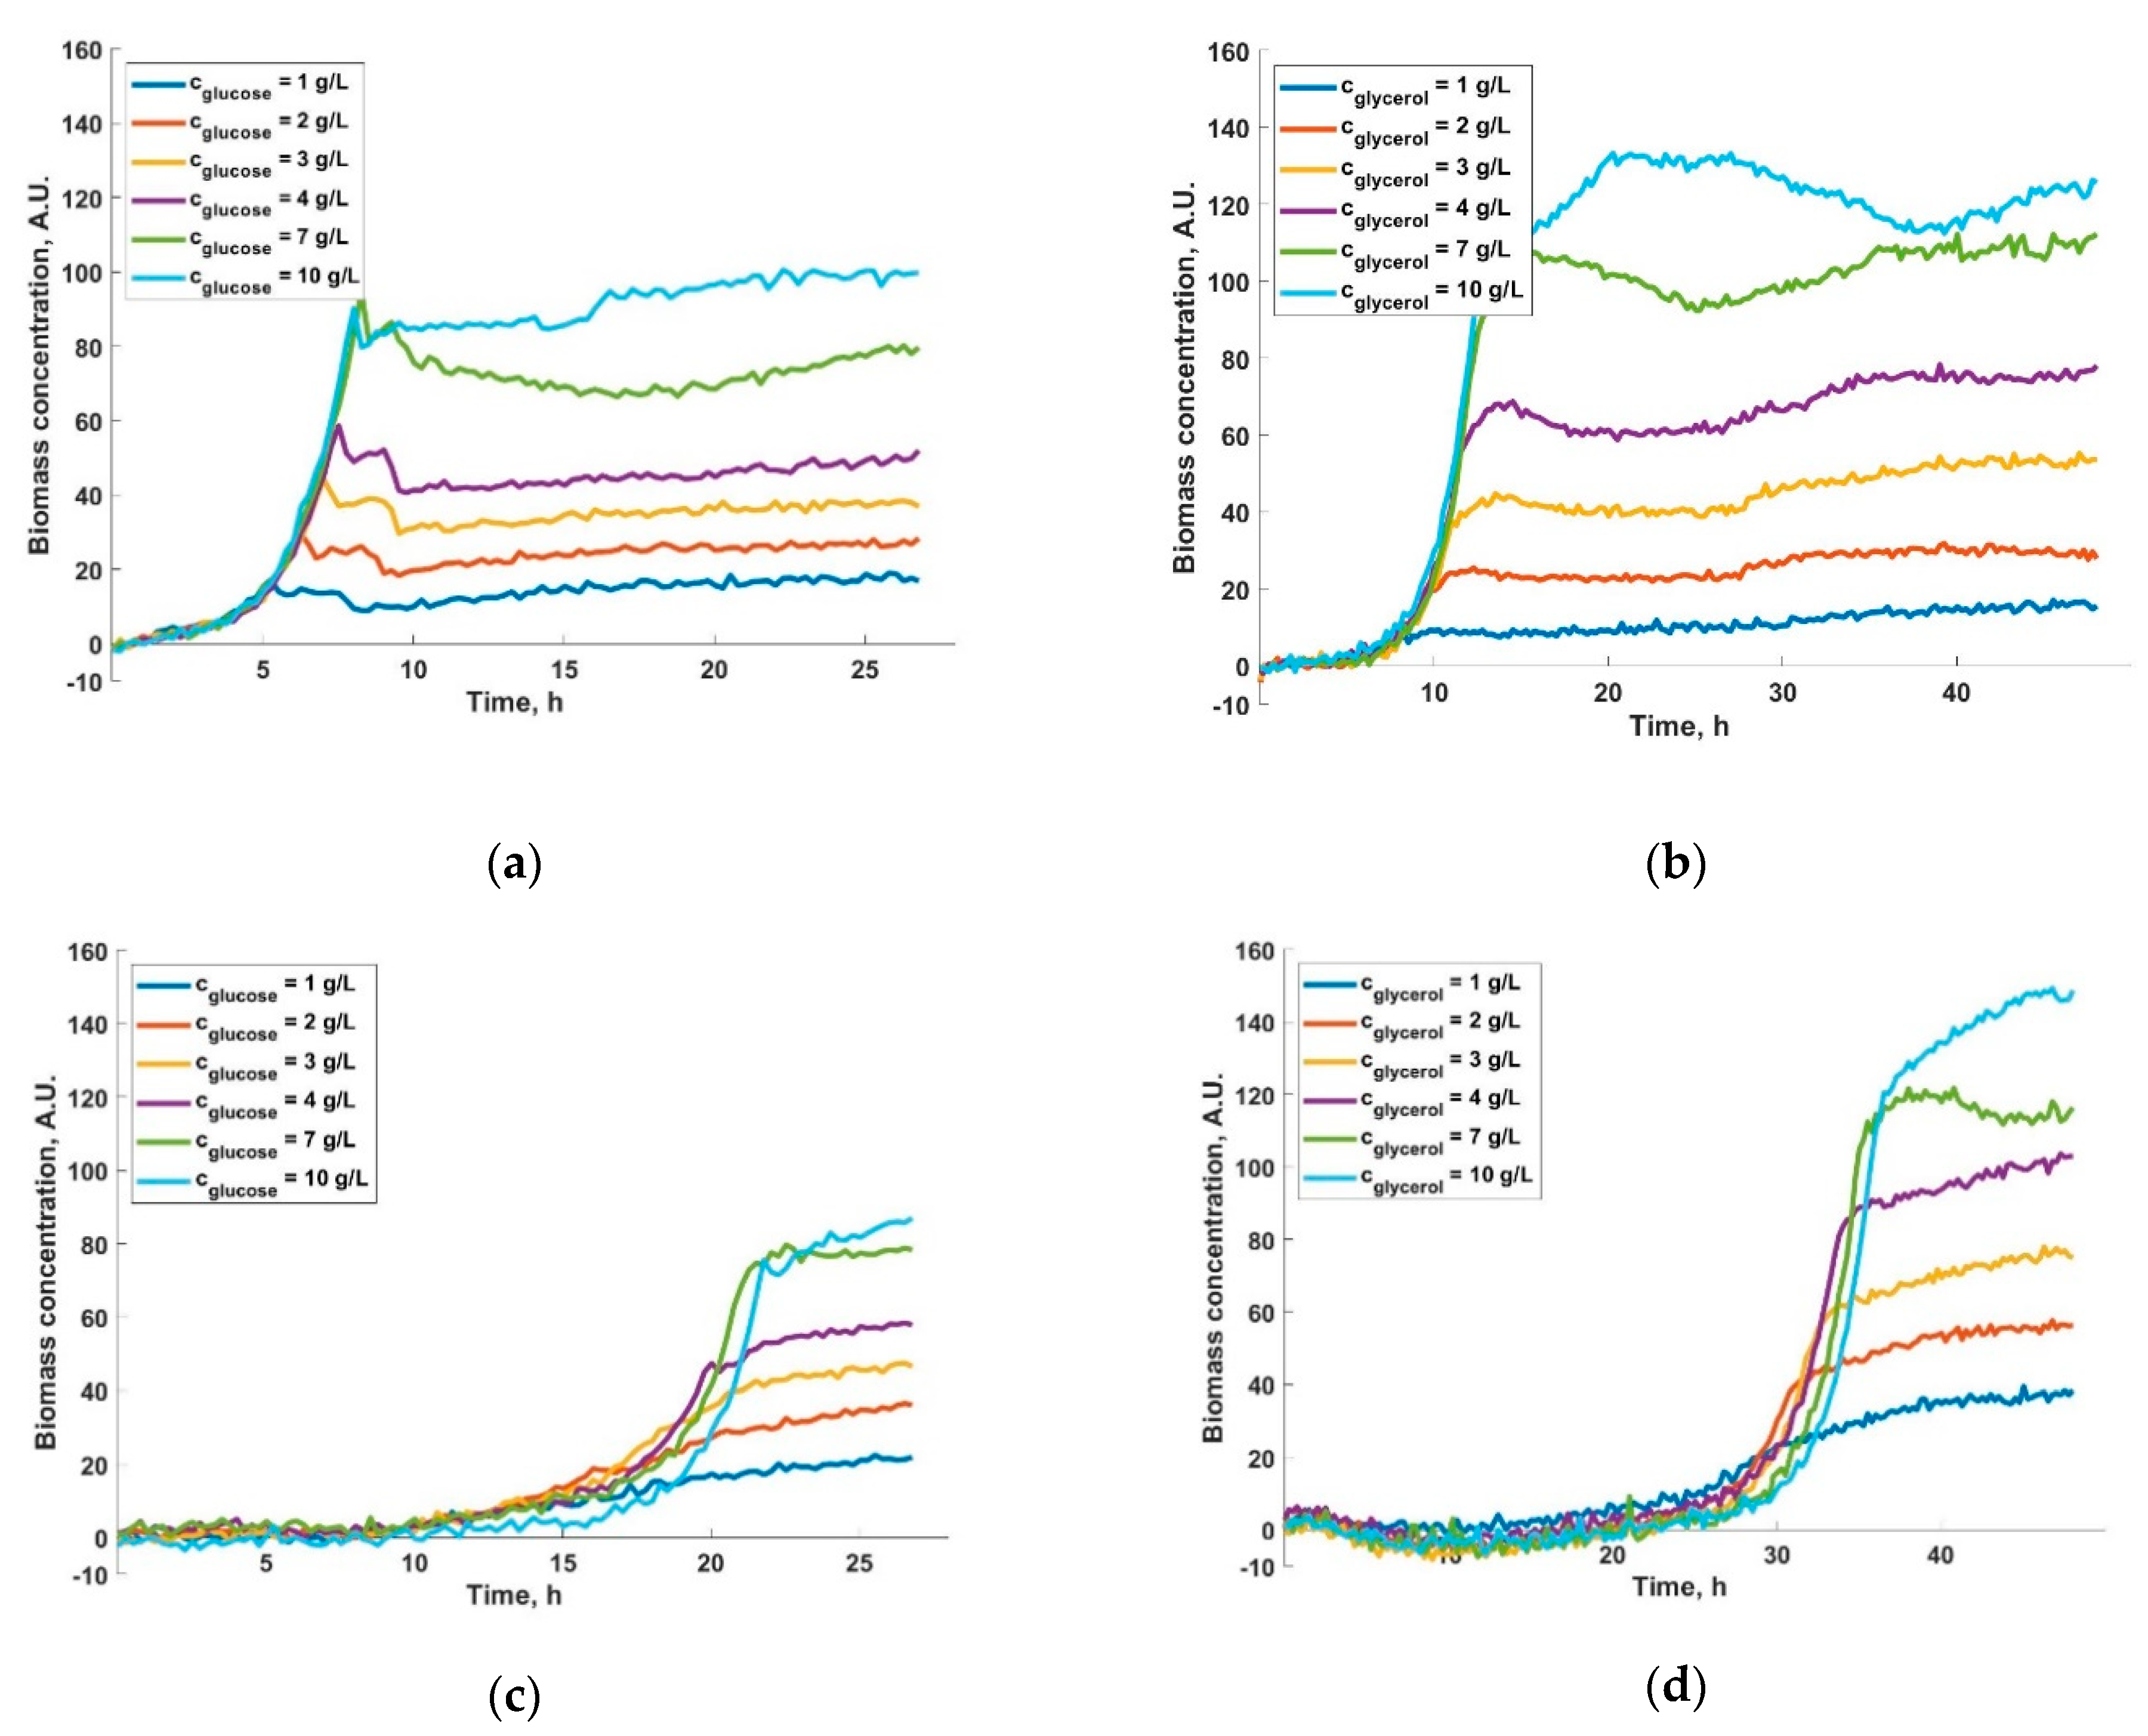
Figure 1. The influence of substrate concentration on E. coli W3110 grown on (a) glucose and (b) glycerol and on E. coli CLD1301 grown on (c) glucose and (d) glycerol. All cultures were run in triplicate in the batch microbioreactor BioLector®. Here we represent the mean of the three independent cultures. The standard deviation is not represented for these runs as, due to the multiple data points, the lines of different conditions would be undistinguishable.
Applmicrobiol 01 00018 g001
Figure 2. Substrate concentration and OD600 measurements during chemostat culture of E. coli W3110 with no IPTG addition on (a) glucose and (b) glycerol, E. coli W3110 with 1mM IPTG grown on (c) glucose and (d) glycerol, E. coli CLD1301 with no IPTG addition grown on (e) glucose and (f) glycerol and E. coli CLD1301 with 1mM IPTG grown on (g) glucose and (h) glycerol. All cultures were run in triplicate.
Applmicrobiol 01 00018 g002aApplmicrobiol 01 00018 g002b
Figure 3. Total cell counts during culture of E. coli W3110 with no IPTG addition grown on (a) glucose and (b) glycerol, the fraction of live/dead cells during E. coli W3110 culture with no IPTG addition grown on (c) glucose and (d) glycerol, E. coli W3110 with 1mM IPTG grown on (e) glucose and (f) glycerol and the fraction of live/dead cells E. coli W3110 with 1mM IPTG grown on (g) glucose and (h) glycerol. All cultures were run in triplicate.
Applmicrobiol 01 00018 g003aApplmicrobiol 01 00018 g003b
Figure 4. Dynamics of cell populations during steady state culture for (a) E. coli W3110 with no IPTG addition grown on (a) glucose and (b) glycerol, E. coli W3110 with 1mM IPTG grown on (c) glucose and (d) glycerol and E. coli CLD1301 with no IPTG addition grown on (e) glucose and (f) glycerol.
Applmicrobiol 01 00018 g004
Figure 5. Total cell counts during culture of E. coli CLD1301 with no IPTG addition on (a) glucose and (b) glycerol and the fraction of viable/dead on (c) glucose and (d) glycerol. All cultures were run in triplicate.
Applmicrobiol 01 00018 g005
Figure 6. Total cell counts during culture of E. coli CLD1301 induced with IPTG grown on (a) glucose and (b) glycerol, fraction of live/dead cells during E. coli CLD1301 culture on (c) glucose and (d) glycerol and mean GFP fluorescence during E. coli CLD1301 culture on (e) glucose and (f) glycerol. All cultures were run in triplicate.
Applmicrobiol 01 00018 g006
Table 1. Maximum specific growth rates and sampling times for E. coli cultures on glucose and glycerol.
E.coli StrainIPTGSubstrateμmaxSampling Times
W31100 mMGlucose0.6 h−12 h
W31100 mMGlycerol0.5 h−13 h
CLD13011 mMGlucose0.67 h−12 h
CLD13011 mMGlycerol0.39 h−13 h
Publisher’s Note: MDPI stays neutral with regard to jurisdictional claims in published maps and institutional affiliations.