1. Introduction
Soybean (
Glycine max L.) is one of the most important crops worldwide, with particular significance in the United States of America. It is one of the largest suppliers of animal protein feed and the second-largest contributor to vegetable oil production [
1]. However, soybean cyst nematode (SCN,
Heterodera glycines) often reduces soybean yield and causes economic loss [
2]. SCN infestation, which involves microscopic nematodes feeding on soybean roots, leads to the formation of cysts that can house hundreds of eggs. These eggs hatch and further damage the plants, impacting their water and nutrient absorption and thus reducing yields. Consequently, understanding the spatial distribution and patterns of SCN and developing an effective detection method becomes important for sustaining high-yield soybean production [
3].
Traditional detection methods, such as manual soil sampling and root inspection [
1,
4], are laborious, time-consuming and prone to failure in early SCN detection [
5]. This is because visible symptoms of SCN infestation typically appear only after significant crop damage [
6]. Moreover, these methods might not accurately represent SCN population variability due to their reliance on limited and random sampling [
7].
A cost-effective alternative is remote sensing-based detection methods where SCN infestation can be captured by analyzing the different spectral reflectance characteristics of healthy and infested plants. Remote sensing methods include ground-based, airborne, and space-borne techniques that acquire spectral reflectance information through imaging [
1,
8]. Using sensors installed on cars or portable electronics, ground-based remote sensing takes pictures and spectral reflectance of light from soybean fields. Fixed-wing aircrafts and unmanned aerial vehicles (UAVs) or drones equipped with sensors to gather data at a close range. Space-based remote sensing collects images of soybean lands by satellites that orbit the Earth’s surface at a far range. These remote sensing methods provide a non-invasive and efficient way to collect data on crop health, including detecting SCN infestation.
Despite their advantage of large-area coverage, satellite or space-borne images such as Landsat images lack the ability to detect early infestation and damage of crops caused by disease and pests due to coarse spatial and temporal resolution [
9]. Moreover, airborne and UAV multispectral images, due to fine spatial resolutions, have also been applied to the detection of SCN [
10]. Specifically, airborne images have fine spatial resolutions that are often finer than 1 m × 1 m, and they have the potential to detect soybean SCN-induced stress [
1,
8]. However, these methods lack the ability to detect subtle changes, such as early or small-area SCN infestations due to a limited number of spectral bands.
Given these challenges, there is a growing interest in developing more efficient and accurate early detection methods [
11]. Hyperspectral remote sensing can capture reflectance data across hundreds of contiguous narrow bands spanning the regions from visible to shortwave infrared (400–2500 nm), offering high spatial resolution and non-invasive insights into plant health [
12]. The rich spectral data facilitates the detection of subtle physiological and biochemical changes in plants caused by SCN, which allows for early-stage identification even before symptoms are visible [
13]. There are two types of hyperspectral systems: imaging-based and non-imaging-based. Compared to imaging systems, non-imaging hyperspectral sensors focus only on spectral reflectance curves, simplifying data acquisition and analysis while eliminating challenges such as mixed pixels, variable illumination, and atmospheric distortions [
14]. These sensors also facilitate faster and more streamlined processing, which makes them ideal for real-time field diagnostics [
15].
Moreover, vegetation indices (VIs) derived from multispectral and hyperspectral data can further enhance sensitivity to stress-induced changes in plants. Various VIs have been widely used to distinguish between healthy and infested soybean plants [
1,
11,
15,
16,
17]. For example, Bajwa et al. [
15] compared a total of 13 Vis, and it was found that the performance in detecting SCN-infested soybean plants varied greatly among different VIs and time periods of planting. Moreover, Kulkarni et al. [
16,
17] used NDVI, GNDVI, and WDRVI to detect the dynamics of soybean plants infected by SCN and predict the effect of SCN on soybean yield. Overall, the contributions of the VIs to improving the detection of soybean SCN infestations varied greatly and were site-specific. However, compared with original bands, VIs provided greater potential for early detection and management of crop diseases like SCN [
18].
This study aimed to develop and evaluate a spectral vegetation index (SCNVI) for SCN infestation detection using non-imaging hyperspectral data and machine learning methods in a controlled greenhouse setting. The SCN-specific VI (SCNVI) was developed using key wavelengths identified through statistical analysis and feature selection methods, including one-way ANOVA analysis, PCA, linear discriminant analysis (LDA; [
19]), the Select From Model with SVM (SFM + SVM; [
20]), SFM with RF (SFM + RF; [
21]), SFM with eXtreme GBoost (SFM + XGBoost; [
22]), recursive feature elimination with SVM (RFE + SVM; [
23]), RFE with RF (RFE + RF; [
24]), and RFE with XGBoost (RFE + XGBoost; [
25]). The applications of the SCNVI to infested plants separate from non-infested ones were validated by comparison with 12 widely used VIs.
2. Materials and Methods
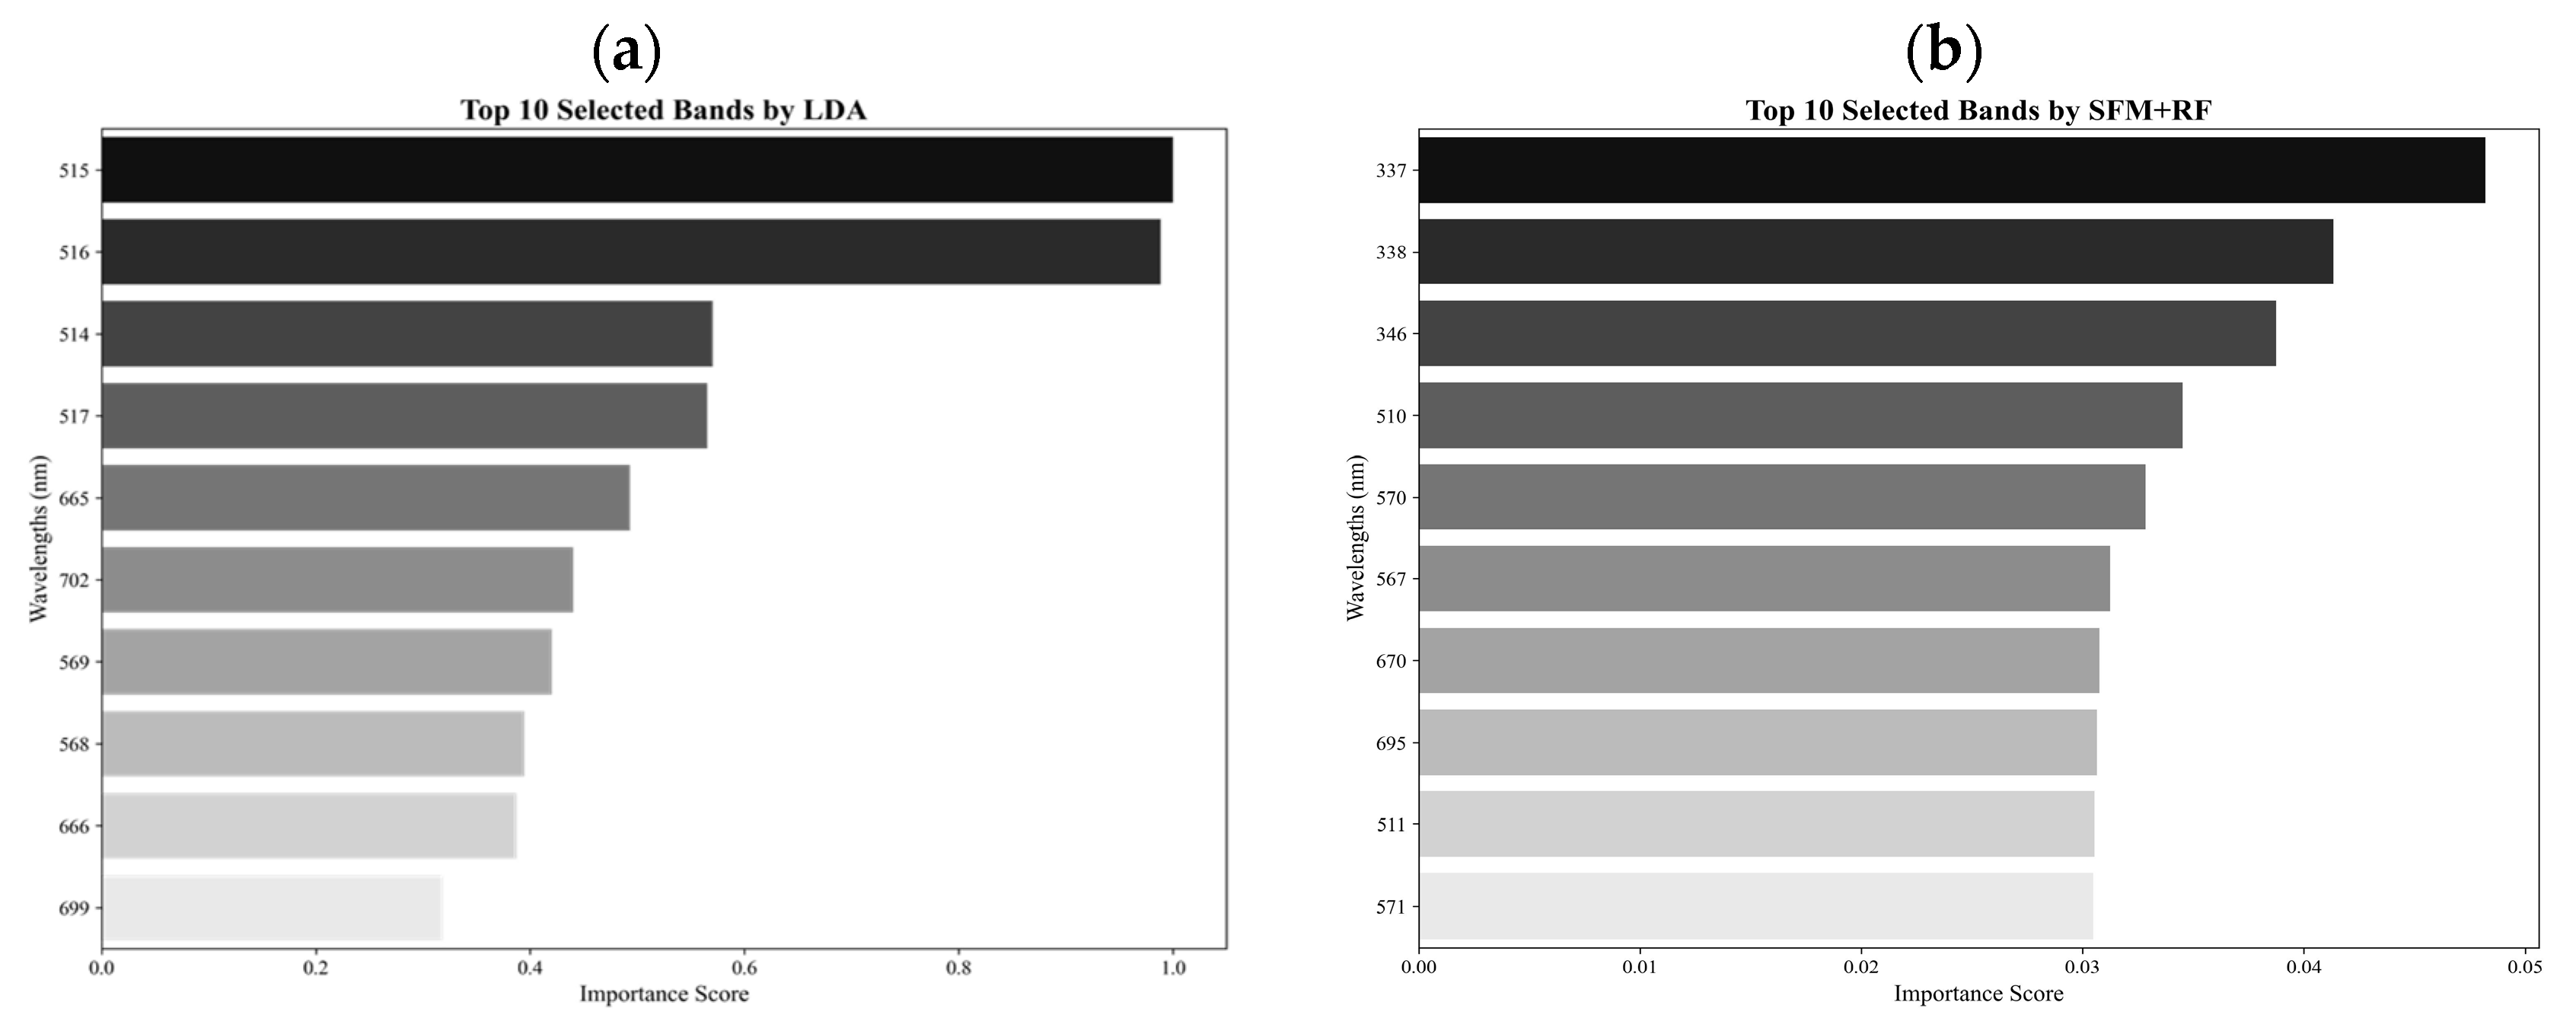
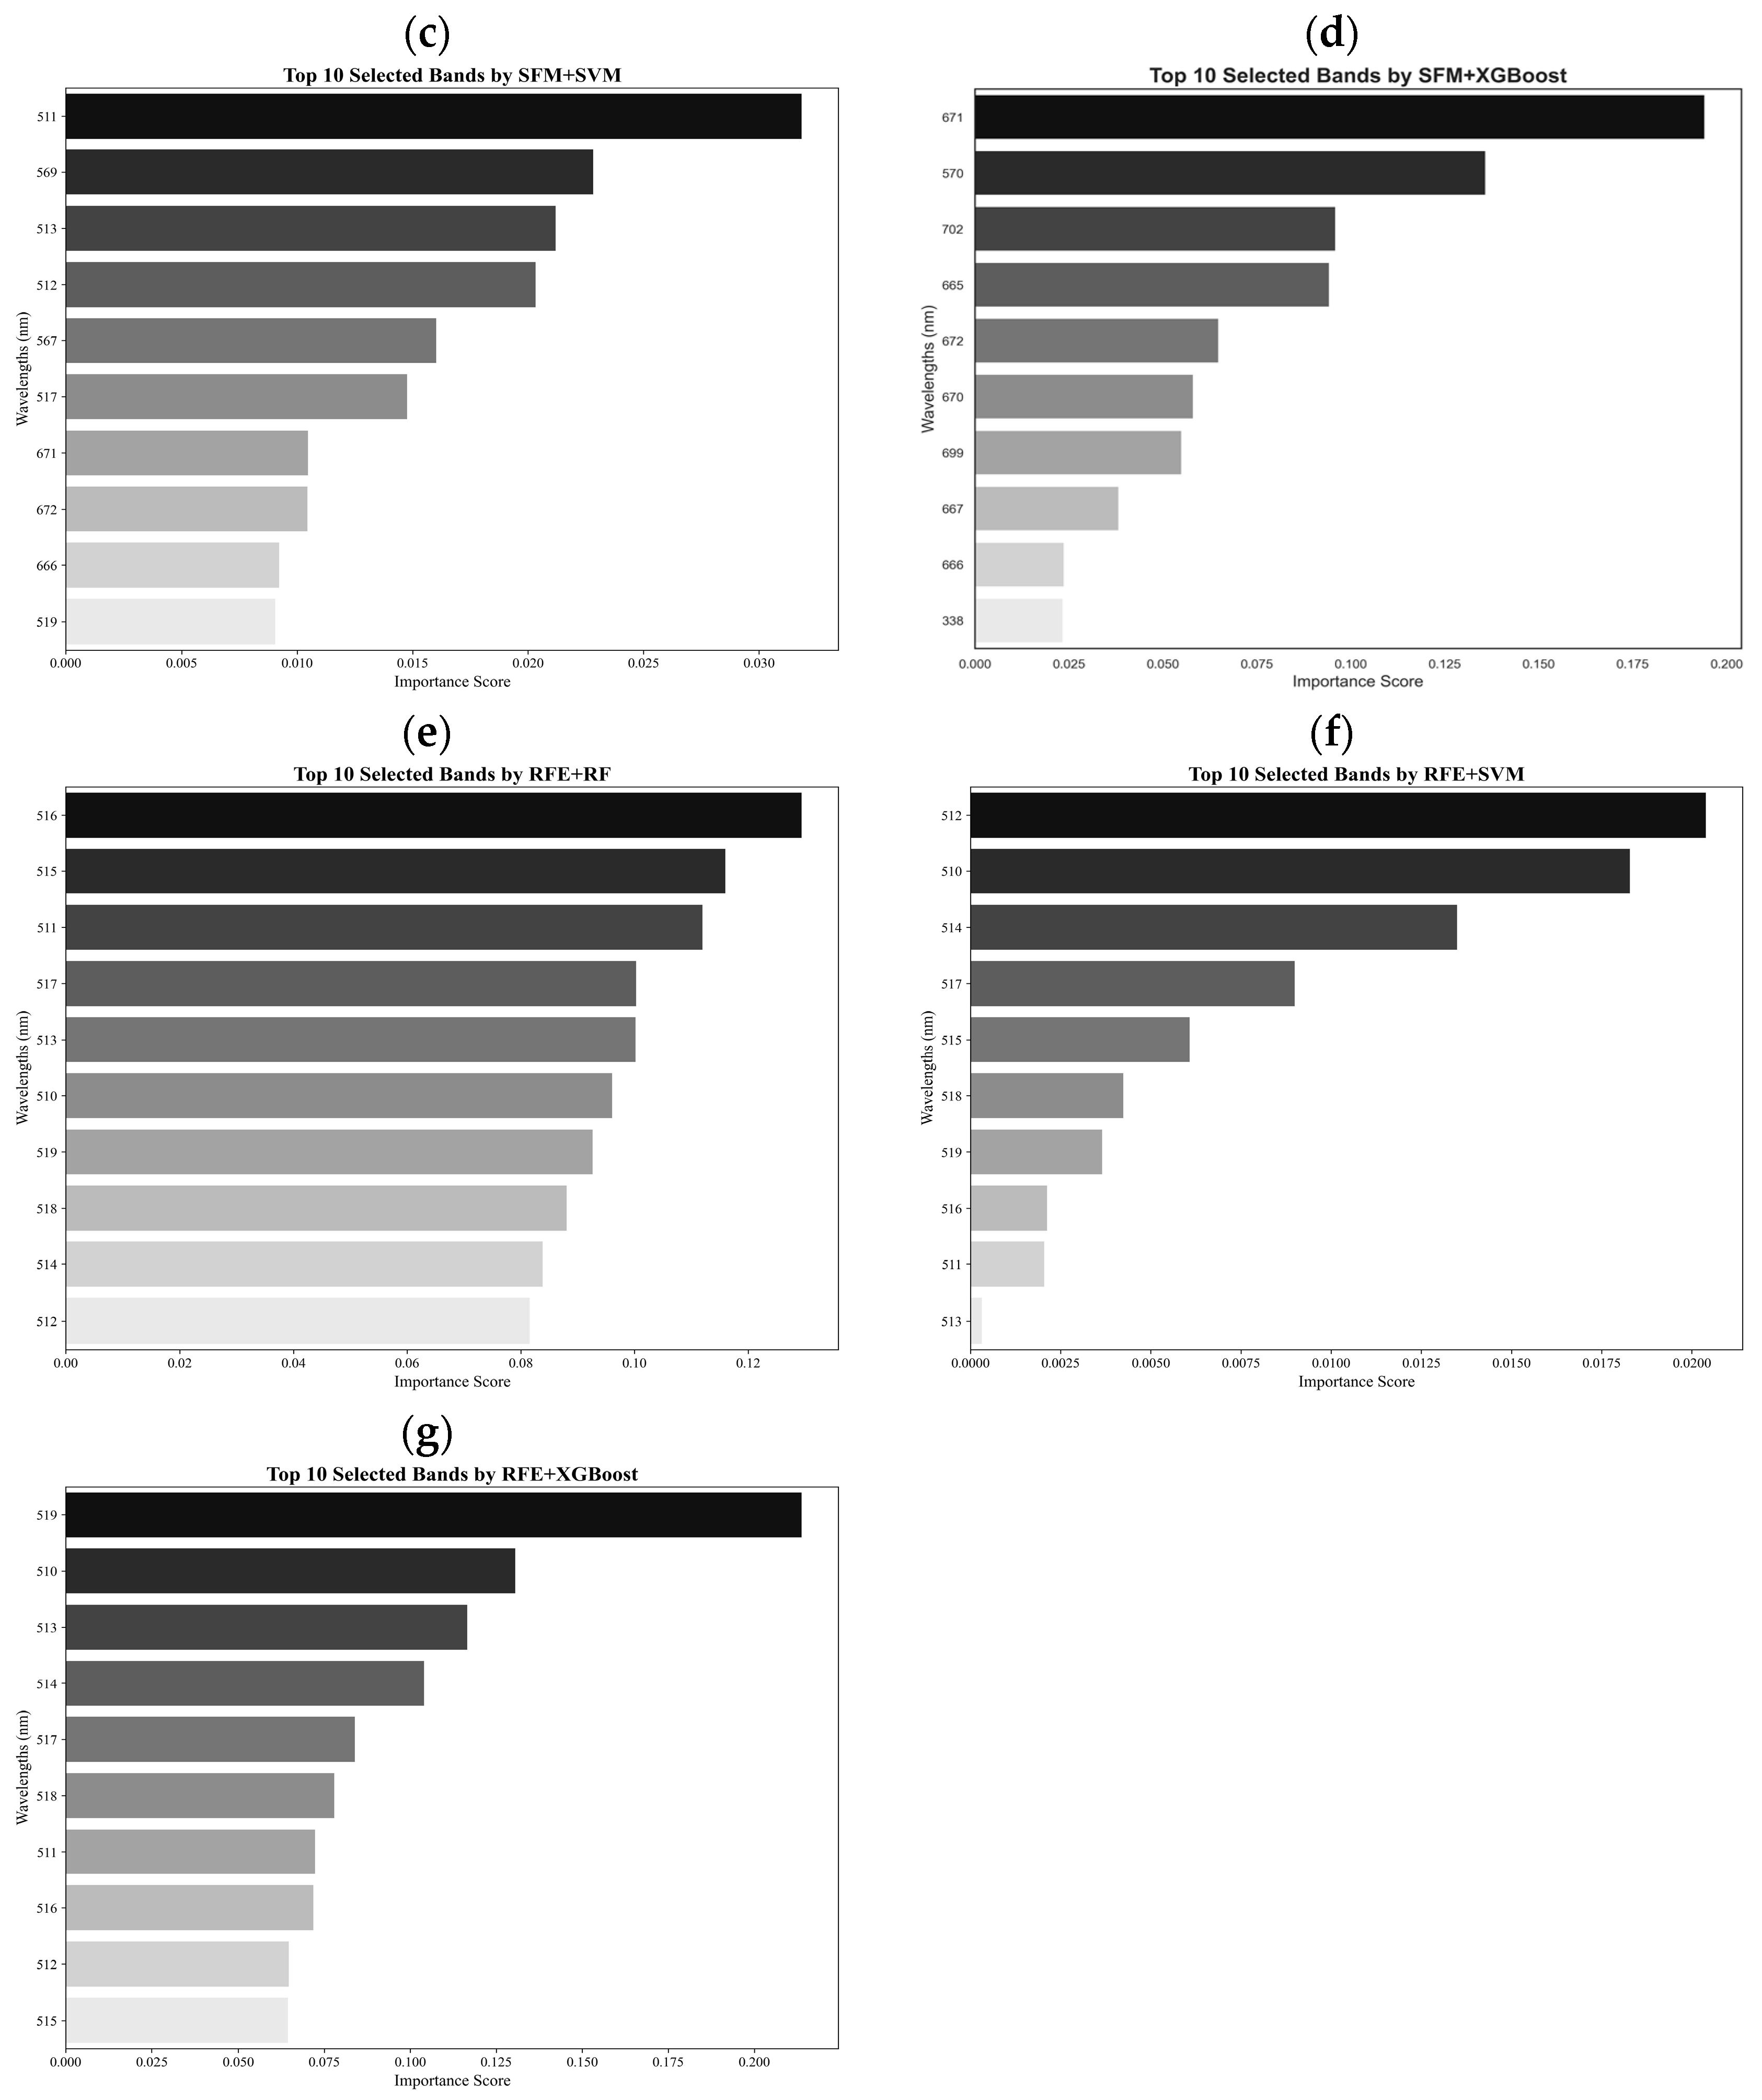
An experimental design was first used for the collection of hyperspectral data from non-inoculated and inoculated soybean plants in a greenhouse, and the statistical characteristics of the hyperspectral data were analyzed to investigate the separability of three stress levels: healthy, moderate stress, and severe stress. A one-way ANOVA of the three classes was then performed to explore statistically significant differences in spectral reflectance values among the classes, and PCA was carried out to select a total of 40 spectral bands that dominantly contributed to the principal component 1 (PC1) and PC2. Moreover, from the 40 spectral bands obtained, the top 10 spectral bands were further selected based on their importance scores and classification accuracies using seven methods, including LDA, SFM + SVM, SFM + RF, SFM + XGBoost, RFE + SVM, RFE + RF, and RFE + XGBoost. The selected 10 bands were used to create various candidate VIs by band ratioing, band differencing, band subtraction, band addition, and logarithm transformation through classification and comparison [
26]. Finally, a new SCN-specific VI was obtained based on the best performance of three-class classification and validated by comparison with 12 widely used VIs.
2.1. Experimental Design and Collection of Hyperspectral Data
Leaf-level hyperspectral data were collected using an ASD FieldSpec HandHeld 2 spectroradiometer (Malvern Panalytical Ltd., Malvern, UK) from a total of 20 soybean plants in a controlled greenhouse setting. The instrument has an adjustable integration time to optimize the signal-to-noise ratio and reduce saturation. Prior to data collection, the instrument was optimized using a Spectralon white reference panel to establish baseline reflectance values. The instrument captured the wavelengths from the ultraviolet (UV) to near-infrared region and ranging from 325 nm to 1075 nm at a spectral resolution of 1 nm. The total of 751 distinct bands provided a detailed representation of the plant’s physiological and biochemical responses to SCN stress at various stages. To simulate different levels of SCN stress, varying numbers of SCN eggs were introduced into the soil at the time of planting. Four groups of soybean plants were established by inoculating the soil with different levels of SCN eggs: 0, 1000, 5000 and 10,000 eggs per plant. Each group consisted of five plants. Due to the slight difference in spectral reflectance values between the 1000- and 5000-egg treatments, these two were combined into one class, called moderate stress. Although SCN egg inoculation levels were used as class labels, it is important to note that actual stress responses may vary due to individual plant variability, making these labels approximations of true physiological stress.
Leaf spectral reflectance was measured weekly from the 68th to the 97th day after planting. The data collection period was strategically chosen to align with the R1 (beginning bloom) to R5 (beginning seed) reproductive stages of soybean. This is a critical window when the plant’s demand for water and nutrients is at its peak for pod and seed development [
27]. This timeframe coincides with the point at which cumulative damage from multiple generations of SCN on the roots severely impairs nutrient absorption, creating a significant physiological stress that is detectable by hyperspectral sensors. A total of 100 sample spectral datasets, each consisting of spectral data from 751 bands, were obtained. There were 25 spectral datasets for each of the four inoculation groups. The controlled environment minimized external variability, ensuring that the observed spectral difference values were primarily attributable to the health status of the plants.
2.2. Spectral Preprocessing and Denoising
Raw hyperspectral reflectance measurements contain high-frequency noise arising from instrument electronics and minor environmental variability. This noise can obscure subtle spectral signatures associated with stress. To mitigate this issue while preserving biologically relevant detail, we applied wavelet-based denoising to each reflectance spectrum prior to conducting any further analyses. The wavelet approach was selected because it adaptively suppresses noise while effectively preserving sharp spectral features, such as red-edge shifts and ultraviolet responses. Wavelet-based denoising has been proven to be an effective technique in signal processing and remote sensing applications, due to its ability to achieve adaptive spatial smoothing without oversmoothing salient features [
28,
29]. It has also been successfully applied to hyperspectral image denoising and vegetation monitoring [
30].
2.3. Characterizing the Spectral Reflectance of Healthy and Stressed Plants
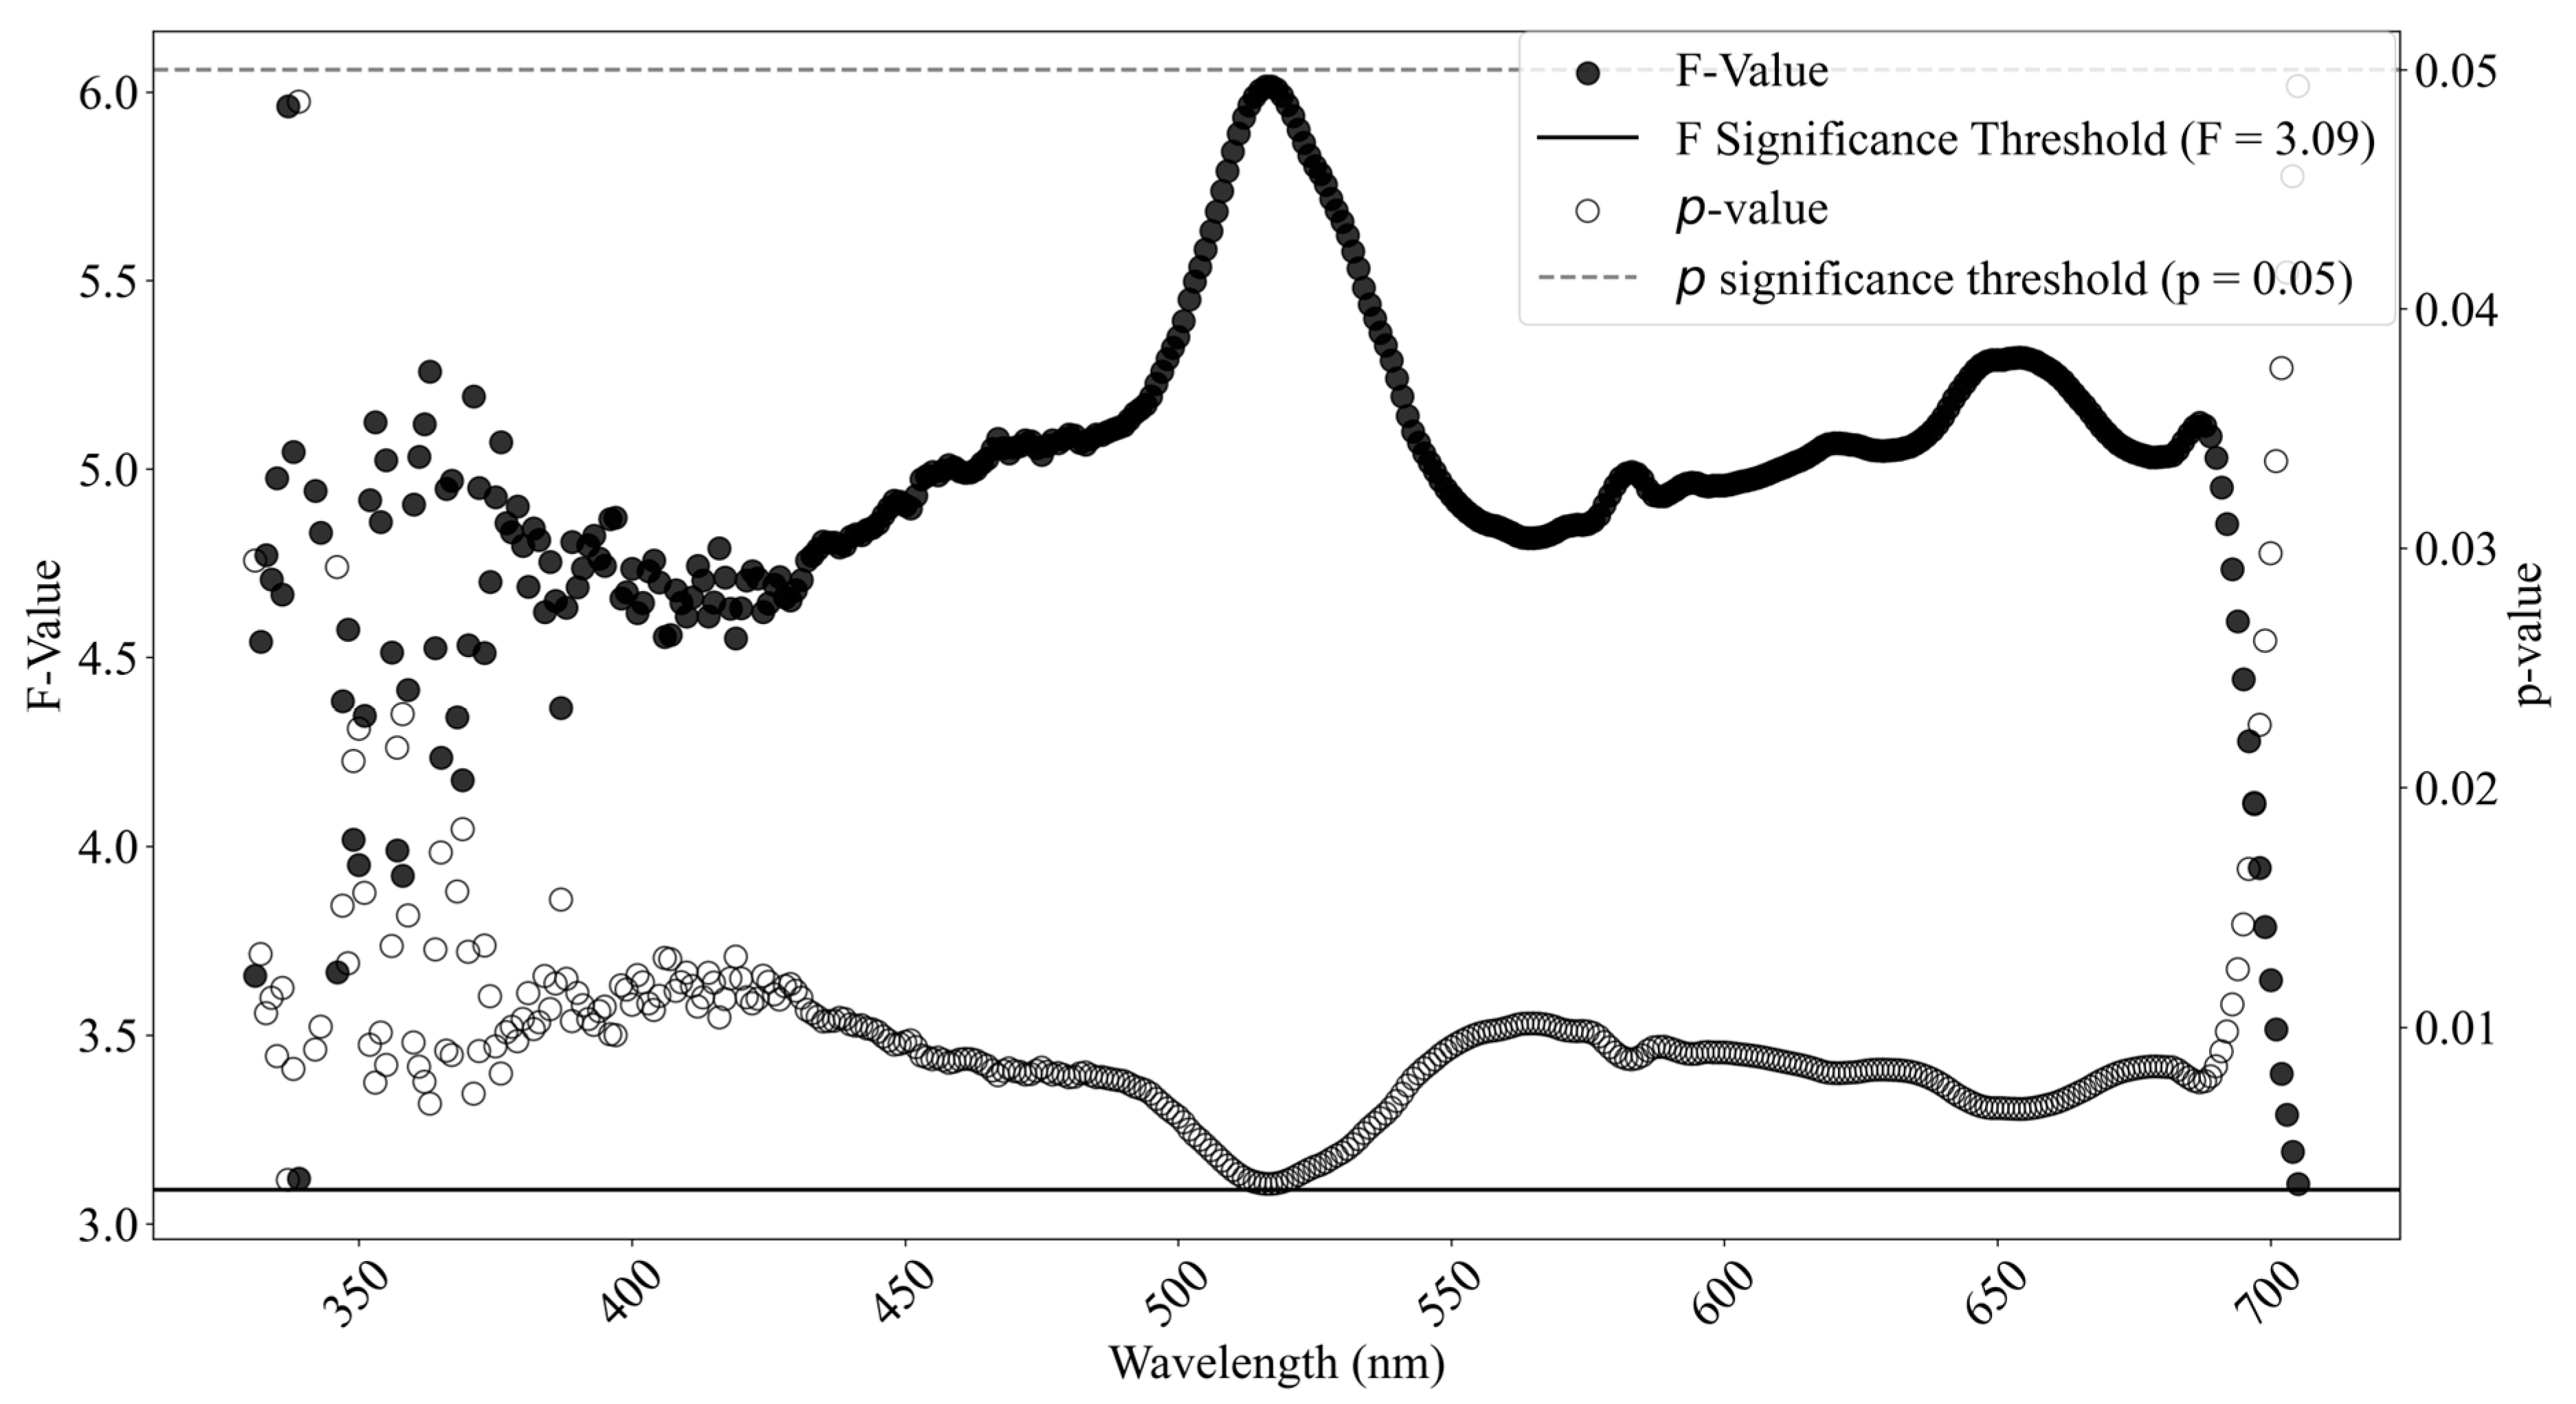
The statistics of spectral reflectance values from healthy and stressed plants were calculated and analyzed across the entire range from 325 nm to 1075 nm, and the regions in which plants were under different stress levels were clearly distinguished from each other and first identified. A one-way ANOVA between the healthy and two stressed groups (moderate stress and severe stress) was then conducted at a significance level of smaller than 0.05. The ANOVA analysis leads to an F-statistic, which is the ratio of the between class variance to the within class variance. If the class means are obtained from the same mean populations, the between-class variance should be smaller than the within-class variance. Therefore, greater ratios highlight the significant spectral bands and regions where reflectance values differ significantly across the class means.
2.4. Band Reduction of Hyperspectral Data
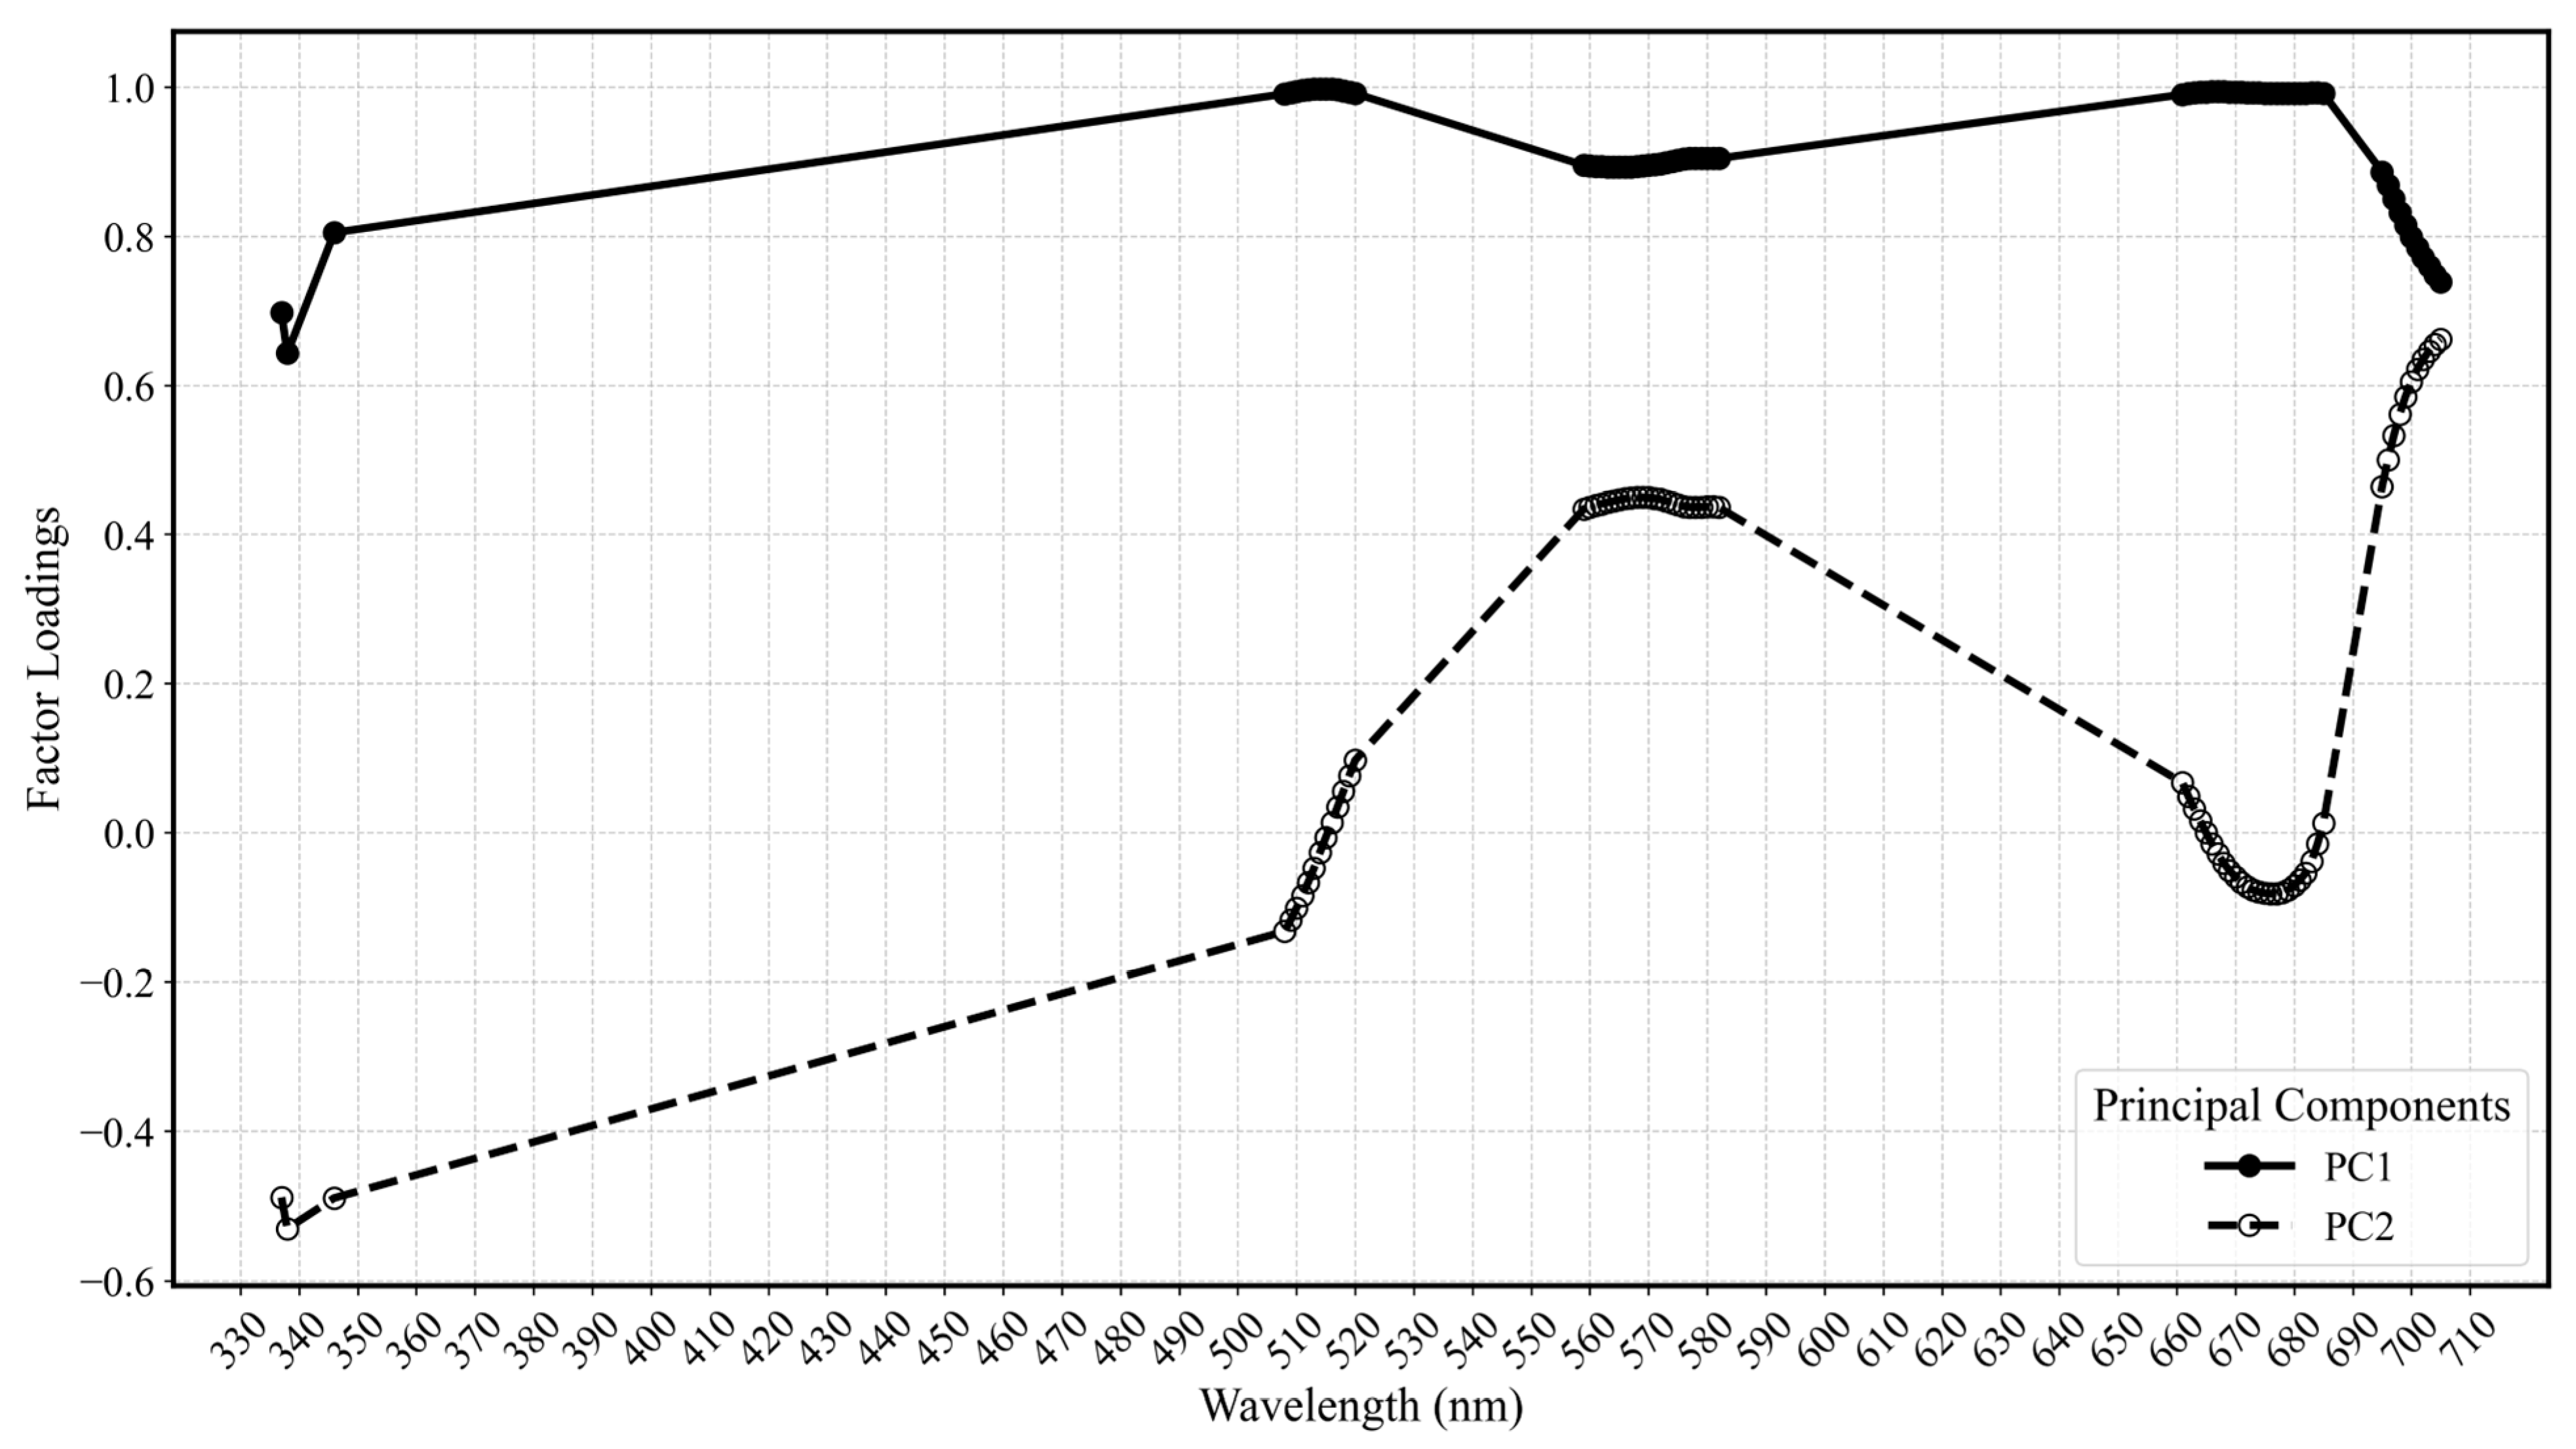
Owing to its fine spectral resolution, the hyperspectral data provides a detailed representation of subtle spectral signatures associated with different soybean stresses and diseases. To reduce the high dimensionality of the spectral data, a PCA was conducted to extract extensive spectral information into principal components (PCs). Then, the factor loadings measuring the correlations of each PC with the original bands and implying the contributions of the original bands to each PC were utilized to identify important spectral bands that could improve classification accuracy. The PCA thus facilitated the selection of important bands to balance dimensionality reduction with the preservation of critical spectral information. Based on the largest values of factor loadings in PC1 and PC2, a total of 40 significant spectral bands were selected from the ANOVA-filtered 371 bands. A total of 25 bands with the highest absolute loadings from PC1 were selected to retain broad stress-related signatures, such as those associated with chlorophyll degradation, while 15 bands from PC2 were included to capture more subtle but ecologically important features, such as red-edge shifts (680–730 nm) indicative of changes in photosynthetic efficiency and UV-range reflectance (330–400 nm) linked to lignin accumulation. This significant reduction in dimensionality facilitated a more focused analysis by highlighting the spectral bands that were most informative for SCN detection.
2.5. Methods for Selection of Optimal Wavelengths
In this study, the selection of optimal bands (wavelengths) was conducted through a combination of statistical and machine learning (ML) methods. These methods were designed to enhance the predictive accuracy of hyperspectral data in detecting SCN. A total of seven methods were used, including LDA, SFM + SVM, SFM + RF, SFM + XGBoost, RFE + SVM, RFE + RF, and RFE + XGBoost. LDA employs Fisher’s linear discriminant method to evaluate the importance of a band by maximizing the ratio of between-class variance (
) to within-class variance (
), ensuring the optimal separation of data points into predefined categories [
31]. The importance score for a band is calculated as follows:
Here, represents the weighting vector for the bands. Bands that achieve a higher ratio of between-class variance () to within-class variance () are assigned greater importance scores. This method is effective for datasets where the primary goal is to maximize class separability. This approach is most effective when data meet assumptions of normality and homogeneity of variance. LDA is valued for its computational simplicity, making it an efficient feature selection tool in situations where computational resources are limited.
SFM + RF and RFE + RF apply the Gini index. It is a measure of impurity reduction in decision tree-based algorithms, which helps to calculate the importance scores of spectral bands. The Gini index is computed as follows:
where
is the proportion of samples belonging to class
. For each band
, the overall importance is determined as follows:
where
denotes the decision tree node in which band
is used, and
represents the reduction in impurity at node
due to splitting on band
. Bands that provide the greatest reduction in impurity (i.e., with higher
) are deemed more important.
SFM + SVM and RFE + SVM use the SVM framework to calculate band importance based on the optimization problem:
where
represents the band coefficients in the SVM model,
is the feature vector of the
-th sample, and
is its class label. Bands with larger absolute coefficients (∣
∣) are considered more important. This method excels in identifying bands that contribute most to separating healthy and infested plants.
SFM + XGBoost and RFE + XGBoost evaluate band importance by analyzing the gradient of the loss function. At each boosting iteration, the gradient is calculated as follows:
where
is the loss function, and
represents the model’s prediction at the previous iteration. Bands that contribute to larger gradient magnitudes are assigned higher importance scores, as they effectively reduce the loss during training.
The SFM + SVM approach applies SFM in combination with the SVM, which is particularly adept at handling high-dimensional datasets and finding the optimal hyperplane that separates different classes [
32]. SVM’s robustness in managing non-linear boundaries makes it highly effective for complex datasets. By incorporating SFM, this method retains only the most important features, optimizing the predictive power of the model.
Both SFM + RF and SFM + XGBoost evaluate feature importance and prioritize the most critical wavelengths for SCN detection. SFM + RF ranks features by their contribution to impurity reduction in decision trees, which is particularly effective for high-dimensional datasets with potential overfitting [
33]. SFM + XGBoost, on the other hand, builds an additive model, progressively focusing on minimizing an arbitrary differentiable loss function, which makes it adept at handling datasets with complex feature interactions [
34]. Both methods are highly efficient at selecting meaningful features, although SFM + XGBoost can be sensitive to noisy data, which may either enhance or hinder performance depending on the dataset.
RFE + RF, RFE + XGBoost, and RFE + SVM employ an iterative process that continuously eliminates the least significant features, allowing the models to concentrate on the most essential ones [
35]. This recursive elimination approach ensures that the models refine their predictions by focusing on indispensable features, especially in datasets with significant feature redundancy. RFE + RF and RFE + XGBoost are particularly effective at reducing overfitting by narrowing down the feature set to only the most crucial predictors, while RFE + SVM adds the ability to handle non-linear feature interactions, making it especially useful for complex datasets.
Overall, the selection of these methods was guided by the specific characteristics of the hyperspectral data and the analytical objectives. LDA is most suitable for datasets where class separation is linear, while methods such as SFM + XGBoost and RFE + SVM are better suited to manage non-linear relationships and intricate feature interactions within the data. By applying these feature selection techniques, the optimal spectral bands for detecting SCN stress were chosen with an emphasis on accuracy, efficiency, and robustness. These methods significantly enhance the accurate identification and classification of plant health conditions, contributing to advancements in precision agriculture and hyperspectral data analysis.
2.6. Traditional Vegetation Indices Derived from Hyperspectral Data
The selection of VIs in
Table 1 for this research was driven by the need to effectively analyze various aspects of vegetation health and stress related to SCN infestation using hyperspectral data. Each chosen VI provides unique insights into plant health and stress, utilizing different spectral bands to capture specific physiological and biochemical properties of vegetation. EVI [
36] was chosen because it improves the sensitivity of NDVI [
37] to high-biomass regions and reduces the influence of atmospheric distortion and bare soil. By including the blue band to correct for soil and atmospheric scattering effects, EVI offers more reliable and detailed vegetation data, which is crucial for accurately identifying areas affected by SCN. MSAVI2 [
38] is specifically designed to minimize the influence of soil brightness, which is particularly useful in areas with sparse vegetation cover, a common case in fields affected by SCN. This index helps in accurately determining vegetation cover in such fields, enhancing the detection of stressed vegetation without the confounding effects of the underlying soil.
NDREI [
39] utilizes the red-edge spectral region, which is sensitive to changes in chlorophyll content and serves as an indicator of plant stress and health. Since SCN stress affects plant vitality by hindering nutrient uptake, NDREI is invaluable for early detection of these physiological changes before they become apparent in the visible spectrum. TVI [
40] was chosen due to its effectiveness in enhancing vegetation signals even in highly saturated areas. It uses a combination of green and red bands to assess plant vigor and health, making it suitable for monitoring changes in vegetation health over time, including the subtle effects of SCN stress. SATVI [
41] incorporates adjustments for soil brightness, making it highly effective in areas with mixed vegetation and soil backgrounds. This capability is crucial for accurately assessing vegetation health in fields with uneven SCN damage where exposed soil might otherwise skew traditional indices.
MCARI [
42] is tailored to highlight changes in the chlorophyll content of leaves, which directly correlates with plant health and productivity. Since SCN affects plant growth by attacking the root system, monitoring chlorophyll content with MCARI provides insights into the overall health and metabolic state of the plant. CCCI [
43] is adept at estimating canopy chlorophyll content, which can indicate the level of stress or disease in a plant. For SCN monitoring, CCCI helps in distinguishing between healthy and stressed plants based on how the disease affects chlorophyll levels, offering a reliable metric for assessing the extent and impact of stress.
Each of these indices was selected not only for its individual capabilities but also for how their combined use can provide a comprehensive overview of plant health across different stages of growth and varying degrees of SCN stress. These strategic choices allow for a nuanced analysis of stress impacts, facilitating targeted agricultural interventions and improving management of SCN in soybean crops.
Table 1.
The commonly used VIs, defined based on corresponding hyperspectral bands.
Table 1.
The commonly used VIs, defined based on corresponding hyperspectral bands.
| Index | Name | Formula | Reference |
|---|
| WBI | Water Band Index | | [44] |
| NRI | Nitrogen Reflectance Index | ( | [45] |
| EVI | Enhanced Vegetation Index | | [36] |
| MSAVI2 | Modified Soil-Adjusted Vegetation Index 2 | | [38] |
| NDREI | Normalized Difference Red Edge Index | | [39] |
| TVI | Triangular Vegetation Index | | [40] |
| SATVI | Soil Adjusted Total Vegetation Index | | [41] |
| MCARI | Modified Chlorophyll Absorption in Reflectance Index | | [42] |
| CCCI | Canopy Chlorophyll Content Index | | [43] |
| NDVI | Normalized Difference Vegetation Index | | [37] |
| GNDVI | Green Normalized Difference Vegetation Index | | [46] |
| SAVI | Soil-Adjusted Vegetation Index | | [47] |
2.7. A New Vegetation Index Derived from Hyperspectral Data
In addition to the commonly used VIs in
Table 1, based on the top 10 bands selected using seven methods, more than 200 new candidate VIs were created and then compared for detection of SCN stress. The new VIs were created by calculating band differencing, band ratioing, band addition, band multiplying, natural logarithm, and their combinations [
48]. The accuracy comparison of three-class classification (healthy, moderate stress, and severe stress) showed that the following VI has the best accuracy:
where
and
are the reflectance values of wavelengths 338 nm and 665 nm, respectively. The proposed SCNVI was designed to mathematically amplify its response to the plant stress caused by SCN infestation. The multiplication of
and
potentially enhanced the sensitivity of the VI to subtle early-stage stress (
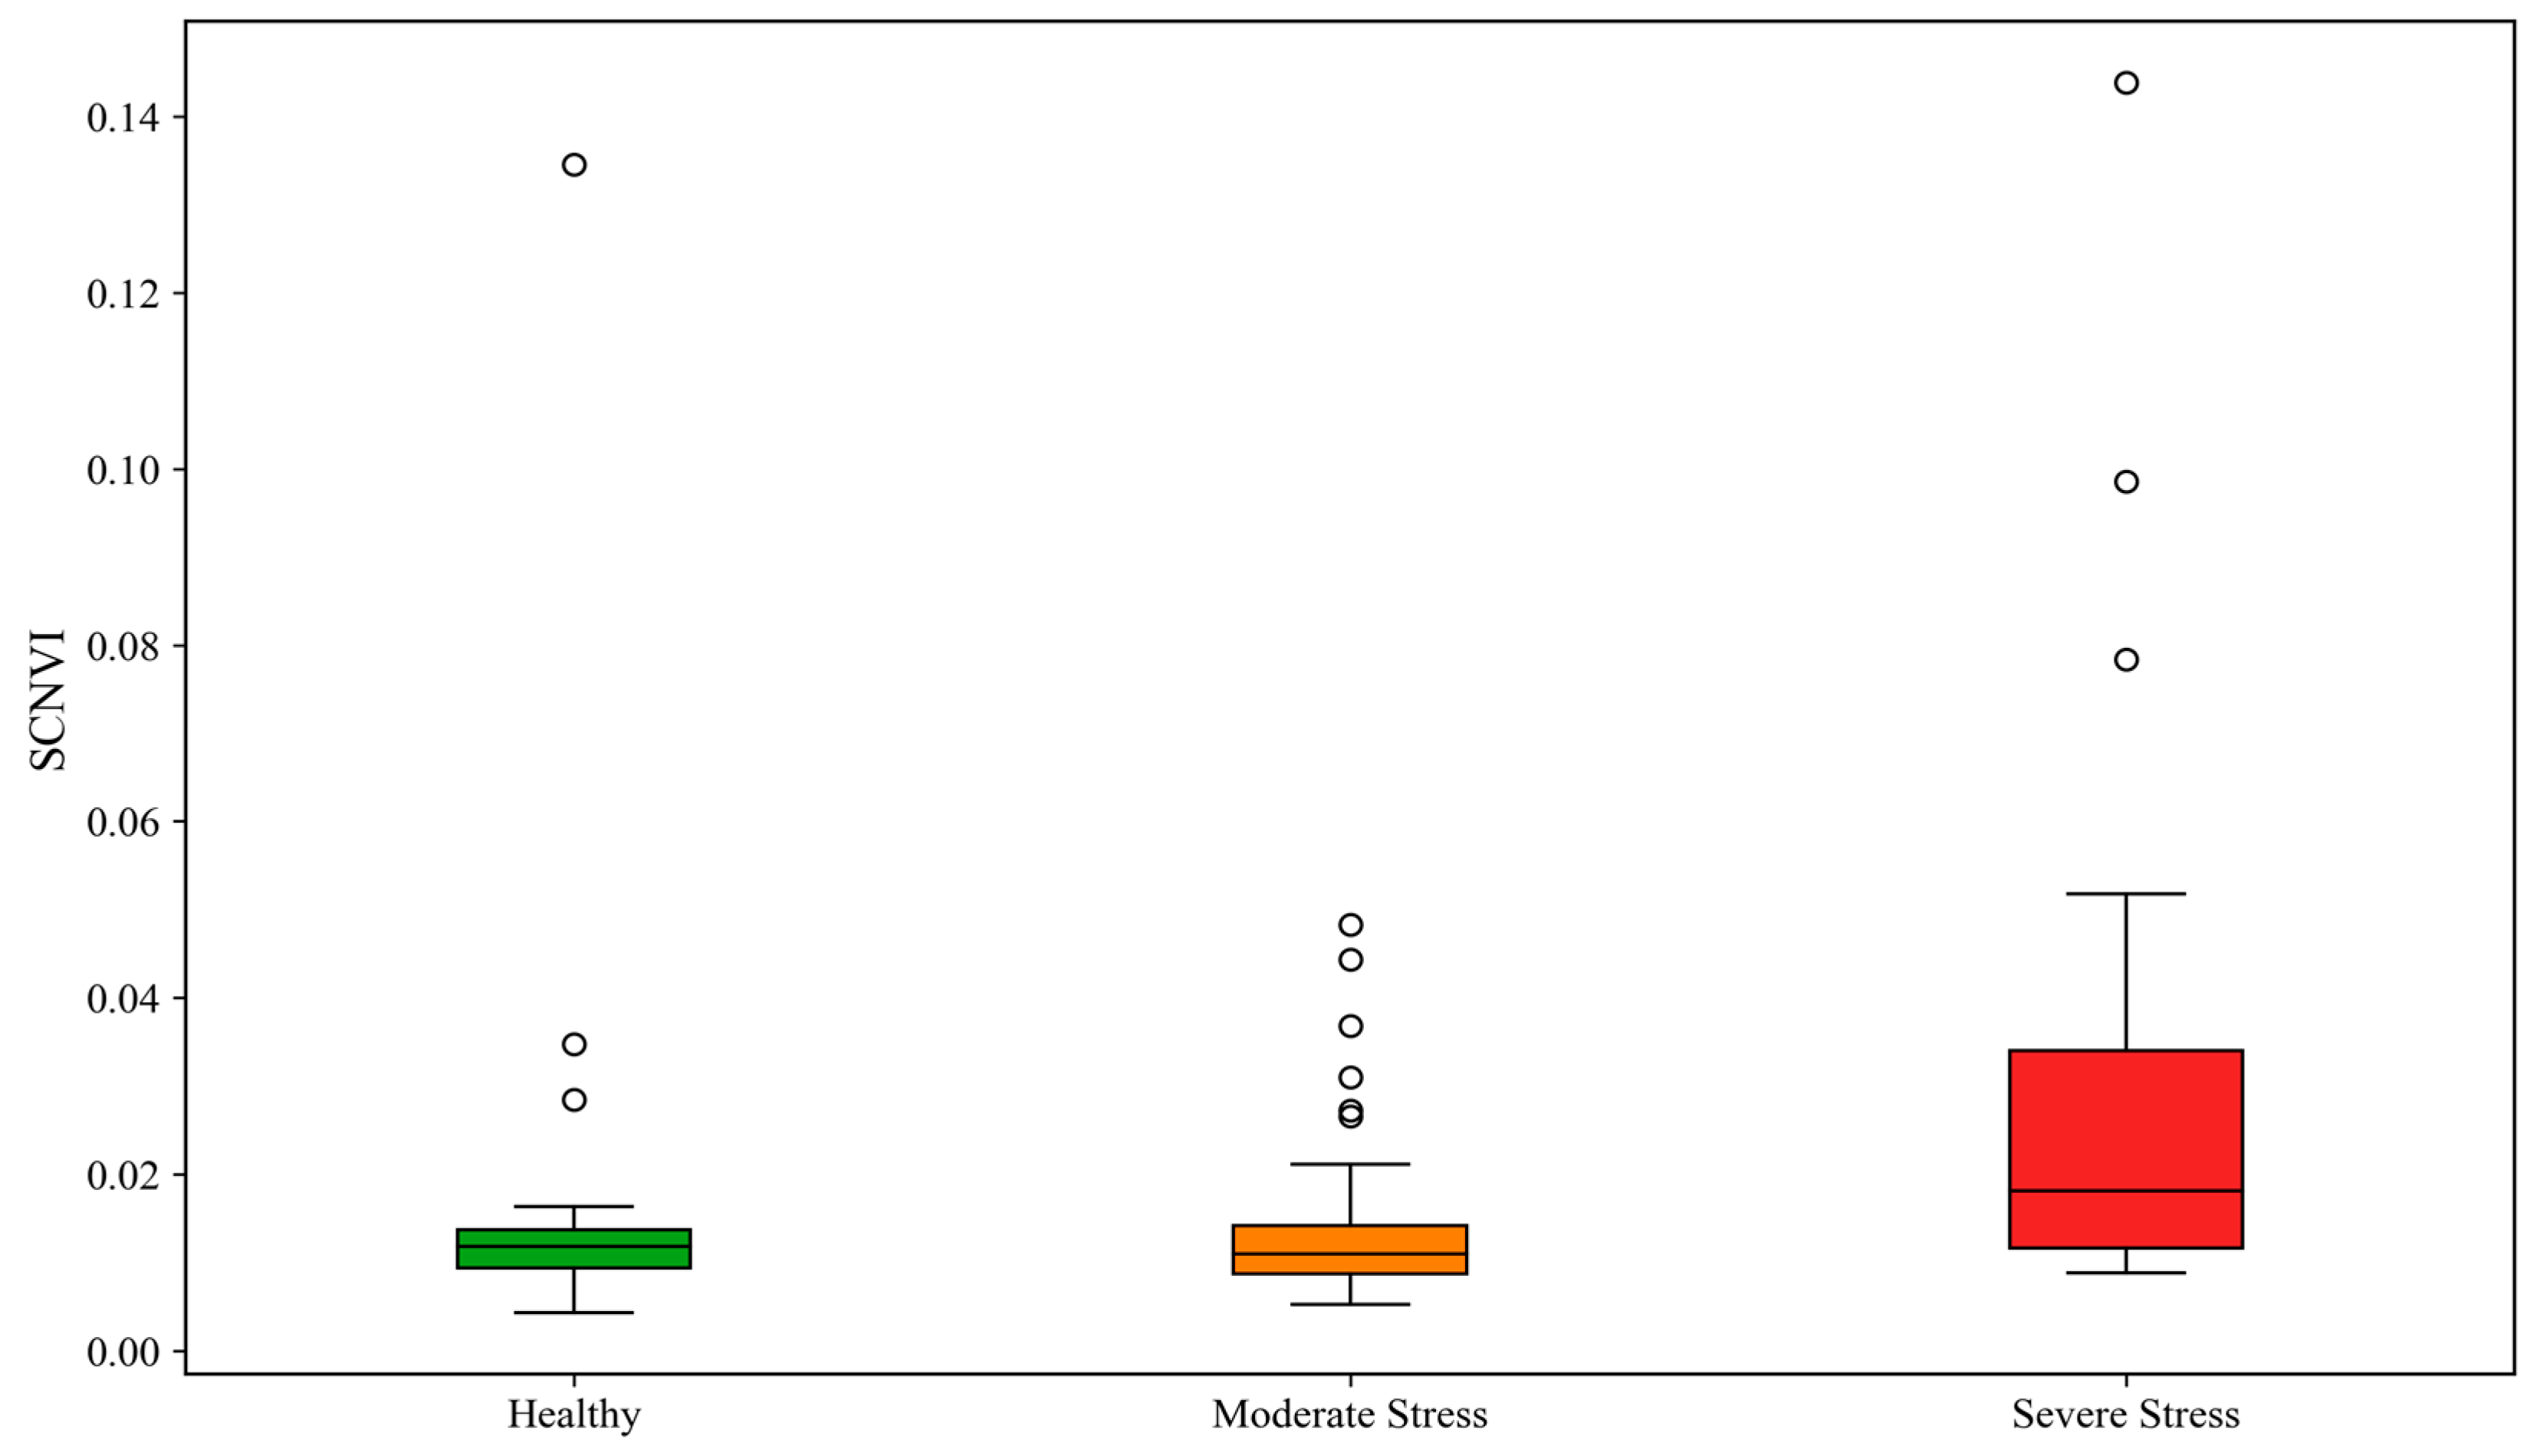
Figure 1). The natural logarithm led to a steep slope indicating a short range of Z values (the product of
and
) and reducing the impact of sensor noise, while emphasizing relative stress severity over absolute reflectance values.
Unlike NDVI, which relies on red and near-infrared (NIR) bands and becomes saturated under the condition of high-density canopy structures and biomass [
37], the SCNVI combines one UV band and one red band. The red band captures the characteristics of plant leaves and the ability to photosynthesize, while the addition of the UV band helps to mitigate saturation effects in healthy plants and increases sensitivity to reflectance changes in stressed plants. The UV band at 338 nm detects structural and biochemical stress caused by SCN infestation, such as lignin accumulation and phenolic compound synthesis. These changes are plant defense mechanisms triggered by UV exposure and pathogen attacks [
49,
50]. As cell walls degrade or secondary metabolites accumulate, UV reflectance increases, providing early warning of stress before visible symptoms appear [
50]. Moreover, the red band at 665 nm is located at the chlorophyll-a absorption peak, which reflects photosynthetic health. Healthy plants exhibit low reflectance in the red band, while SCN infestation disrupts chlorophyll synthesis, leading to degradation and increasing reflectance, which is the direct marker of photosynthetic impairment [
49]. The red band is negatively correlated with chlorophyll content, making it a sensitive indicator of photosynthetic decline [
49]. Combining the UV band and red band, SCNVI captures holistic plant health changes [
51]. Thus, the proposed SCNVI provides the potential to improve the three-class classification. In addition, in the logarithmic transformation, adding a value of 1 ensures positive input values, avoiding undefined results when reflectance values approach 0.
Figure 1 presents the distribution of SCNVI values across three stress levels: healthy, moderate stress, and severe stress. The x-axis represents the plant stress categories, while the y-axis represents SCNVI values. Overall, healthy samples are approximately clustered tightly at low SCNVI values, indicating no structural damage and chlorophyll degradation. In contrast, severely stressed samples are approximately distributed with the highest SCNVI values, reflecting significant stress from UV-induced structural changes and photosynthetic decline. Moderately stressed samples are located in the middle of the range, exhibiting minor stress and subtle changes. However, the separation among the three classes is not perfect due to overlapping spectral reflectance values in some samples, which would lead to uncertainties and limit the classification ability of the SCNVI.
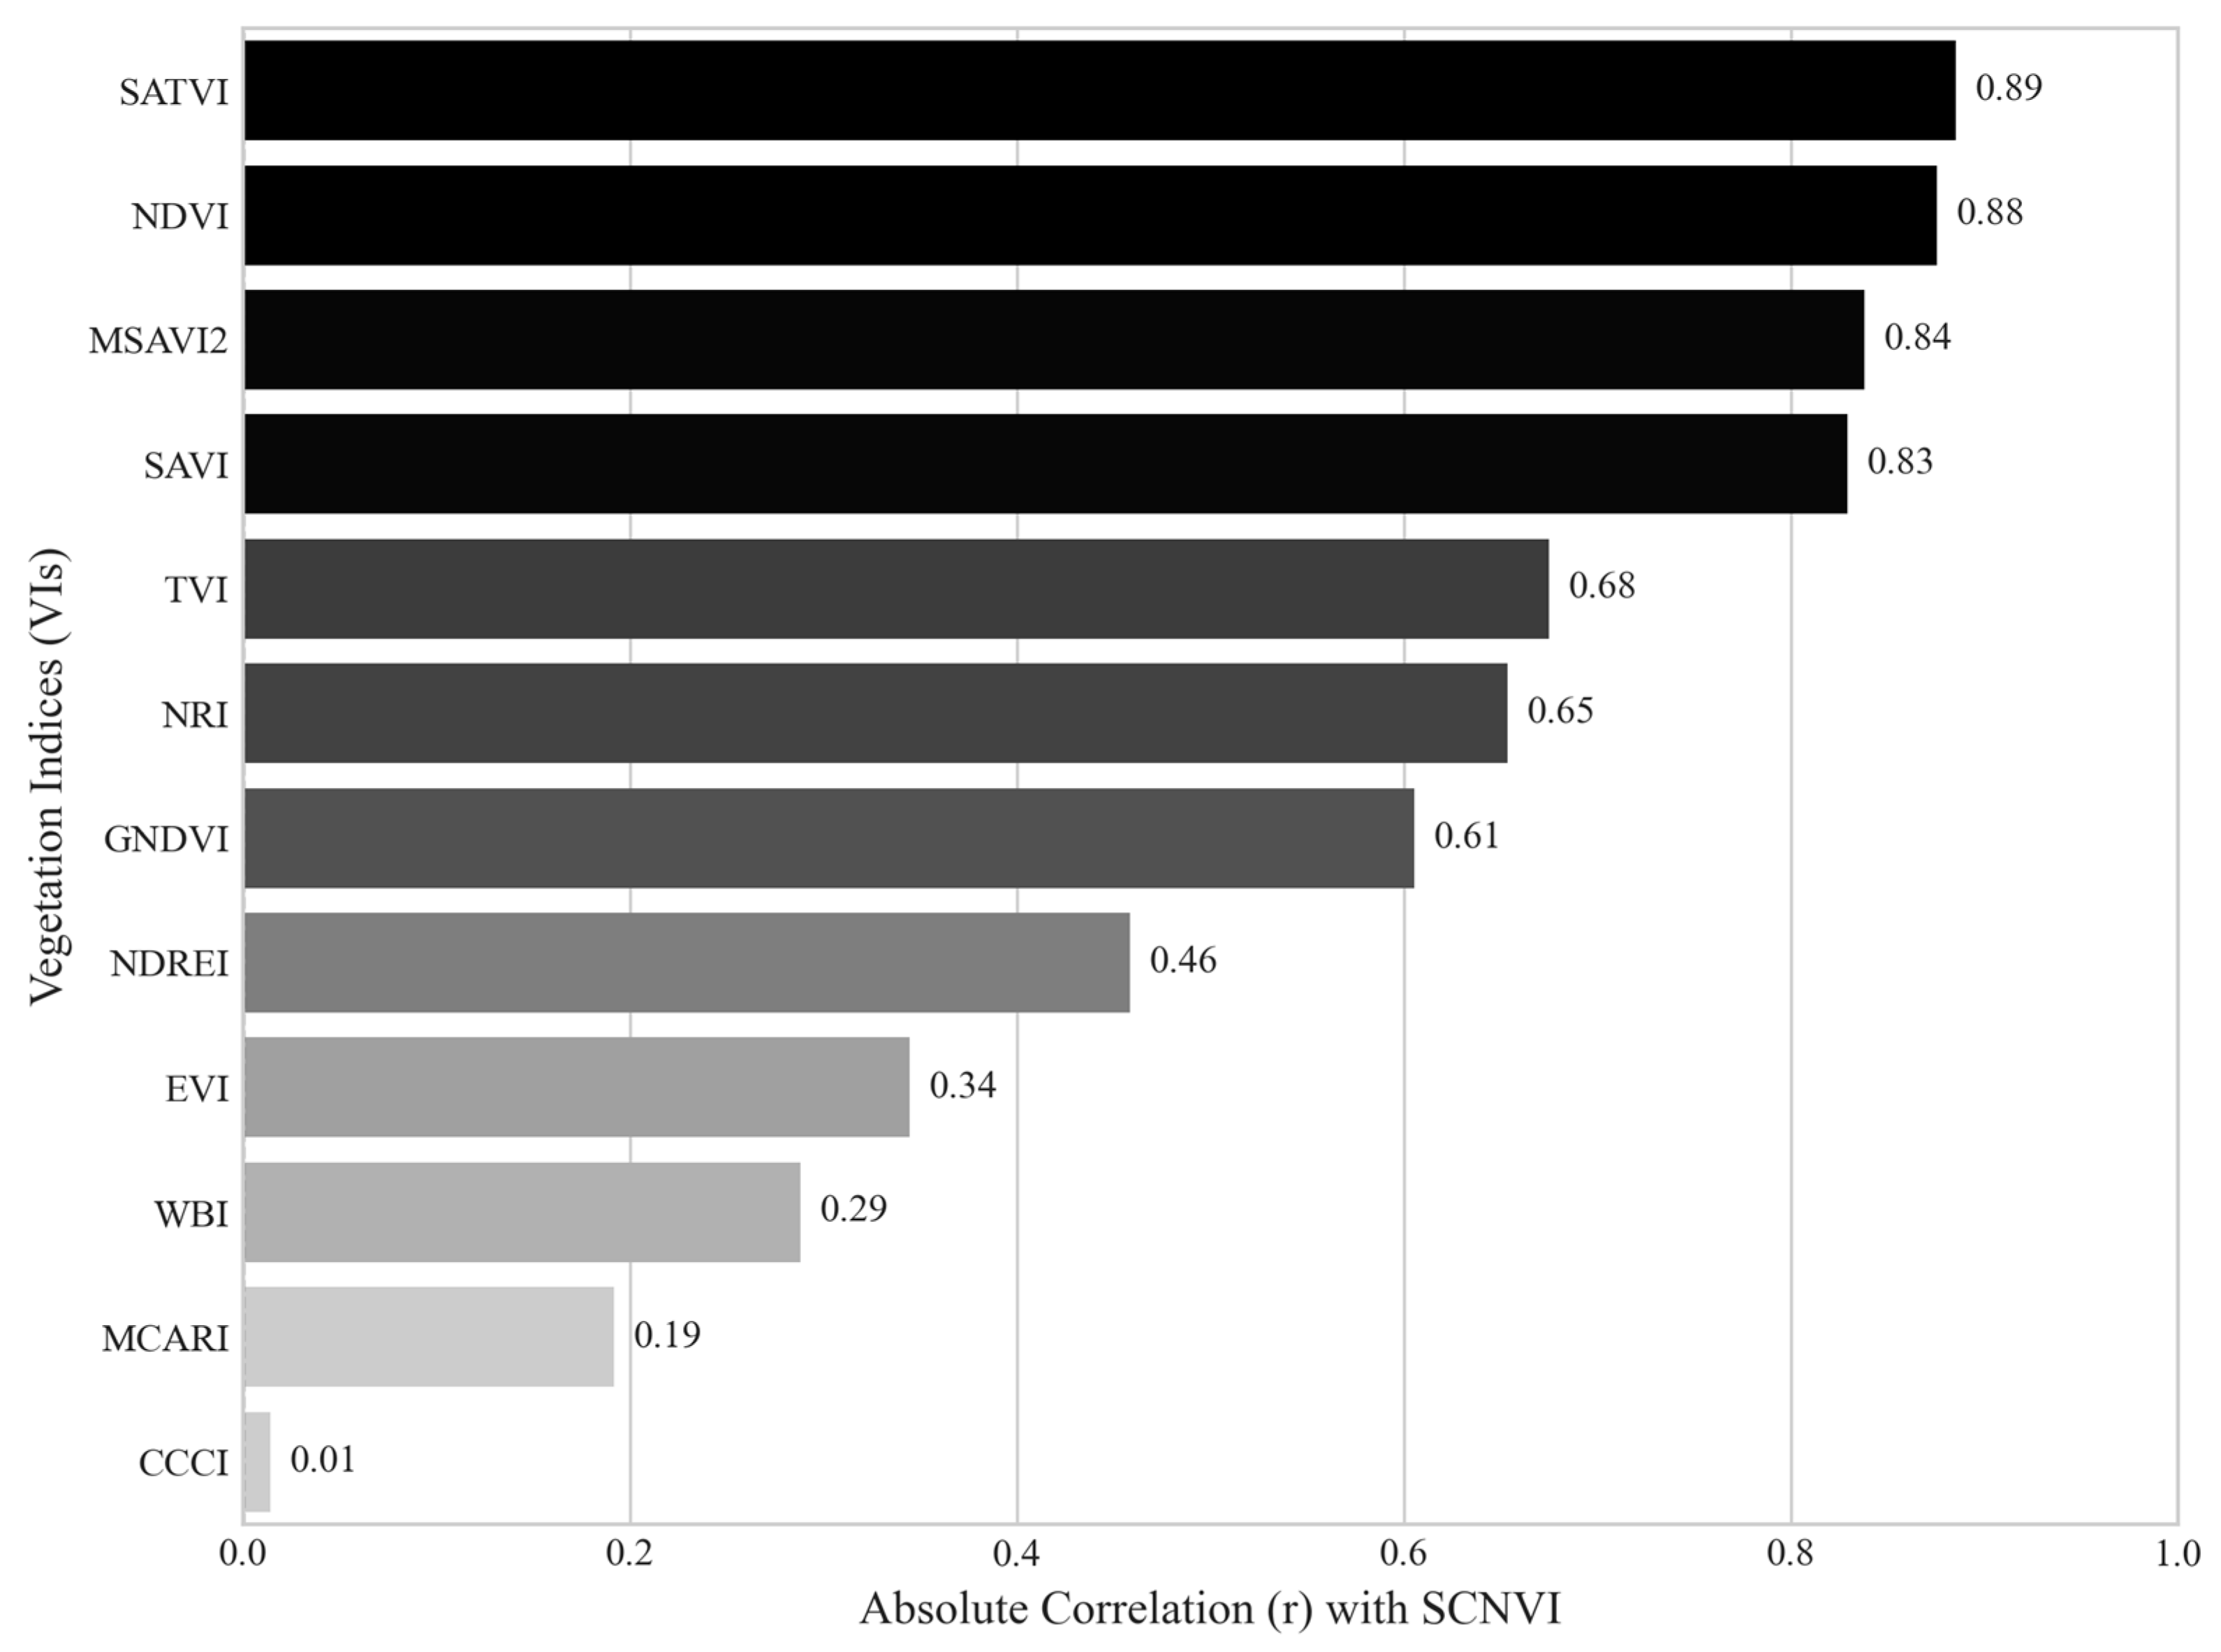
Moreover, the SCNVI is strongly correlated with the widely used VIs, including the soil adjusted total vegetation index (SATVI) (r = 0.89), NDVI (r = 0.88), MSAVI2 (r = 0.84), and SAVI (r = 0.83), implying that it is well suited for assessing vegetation vigor, biomass, and overall structural health (
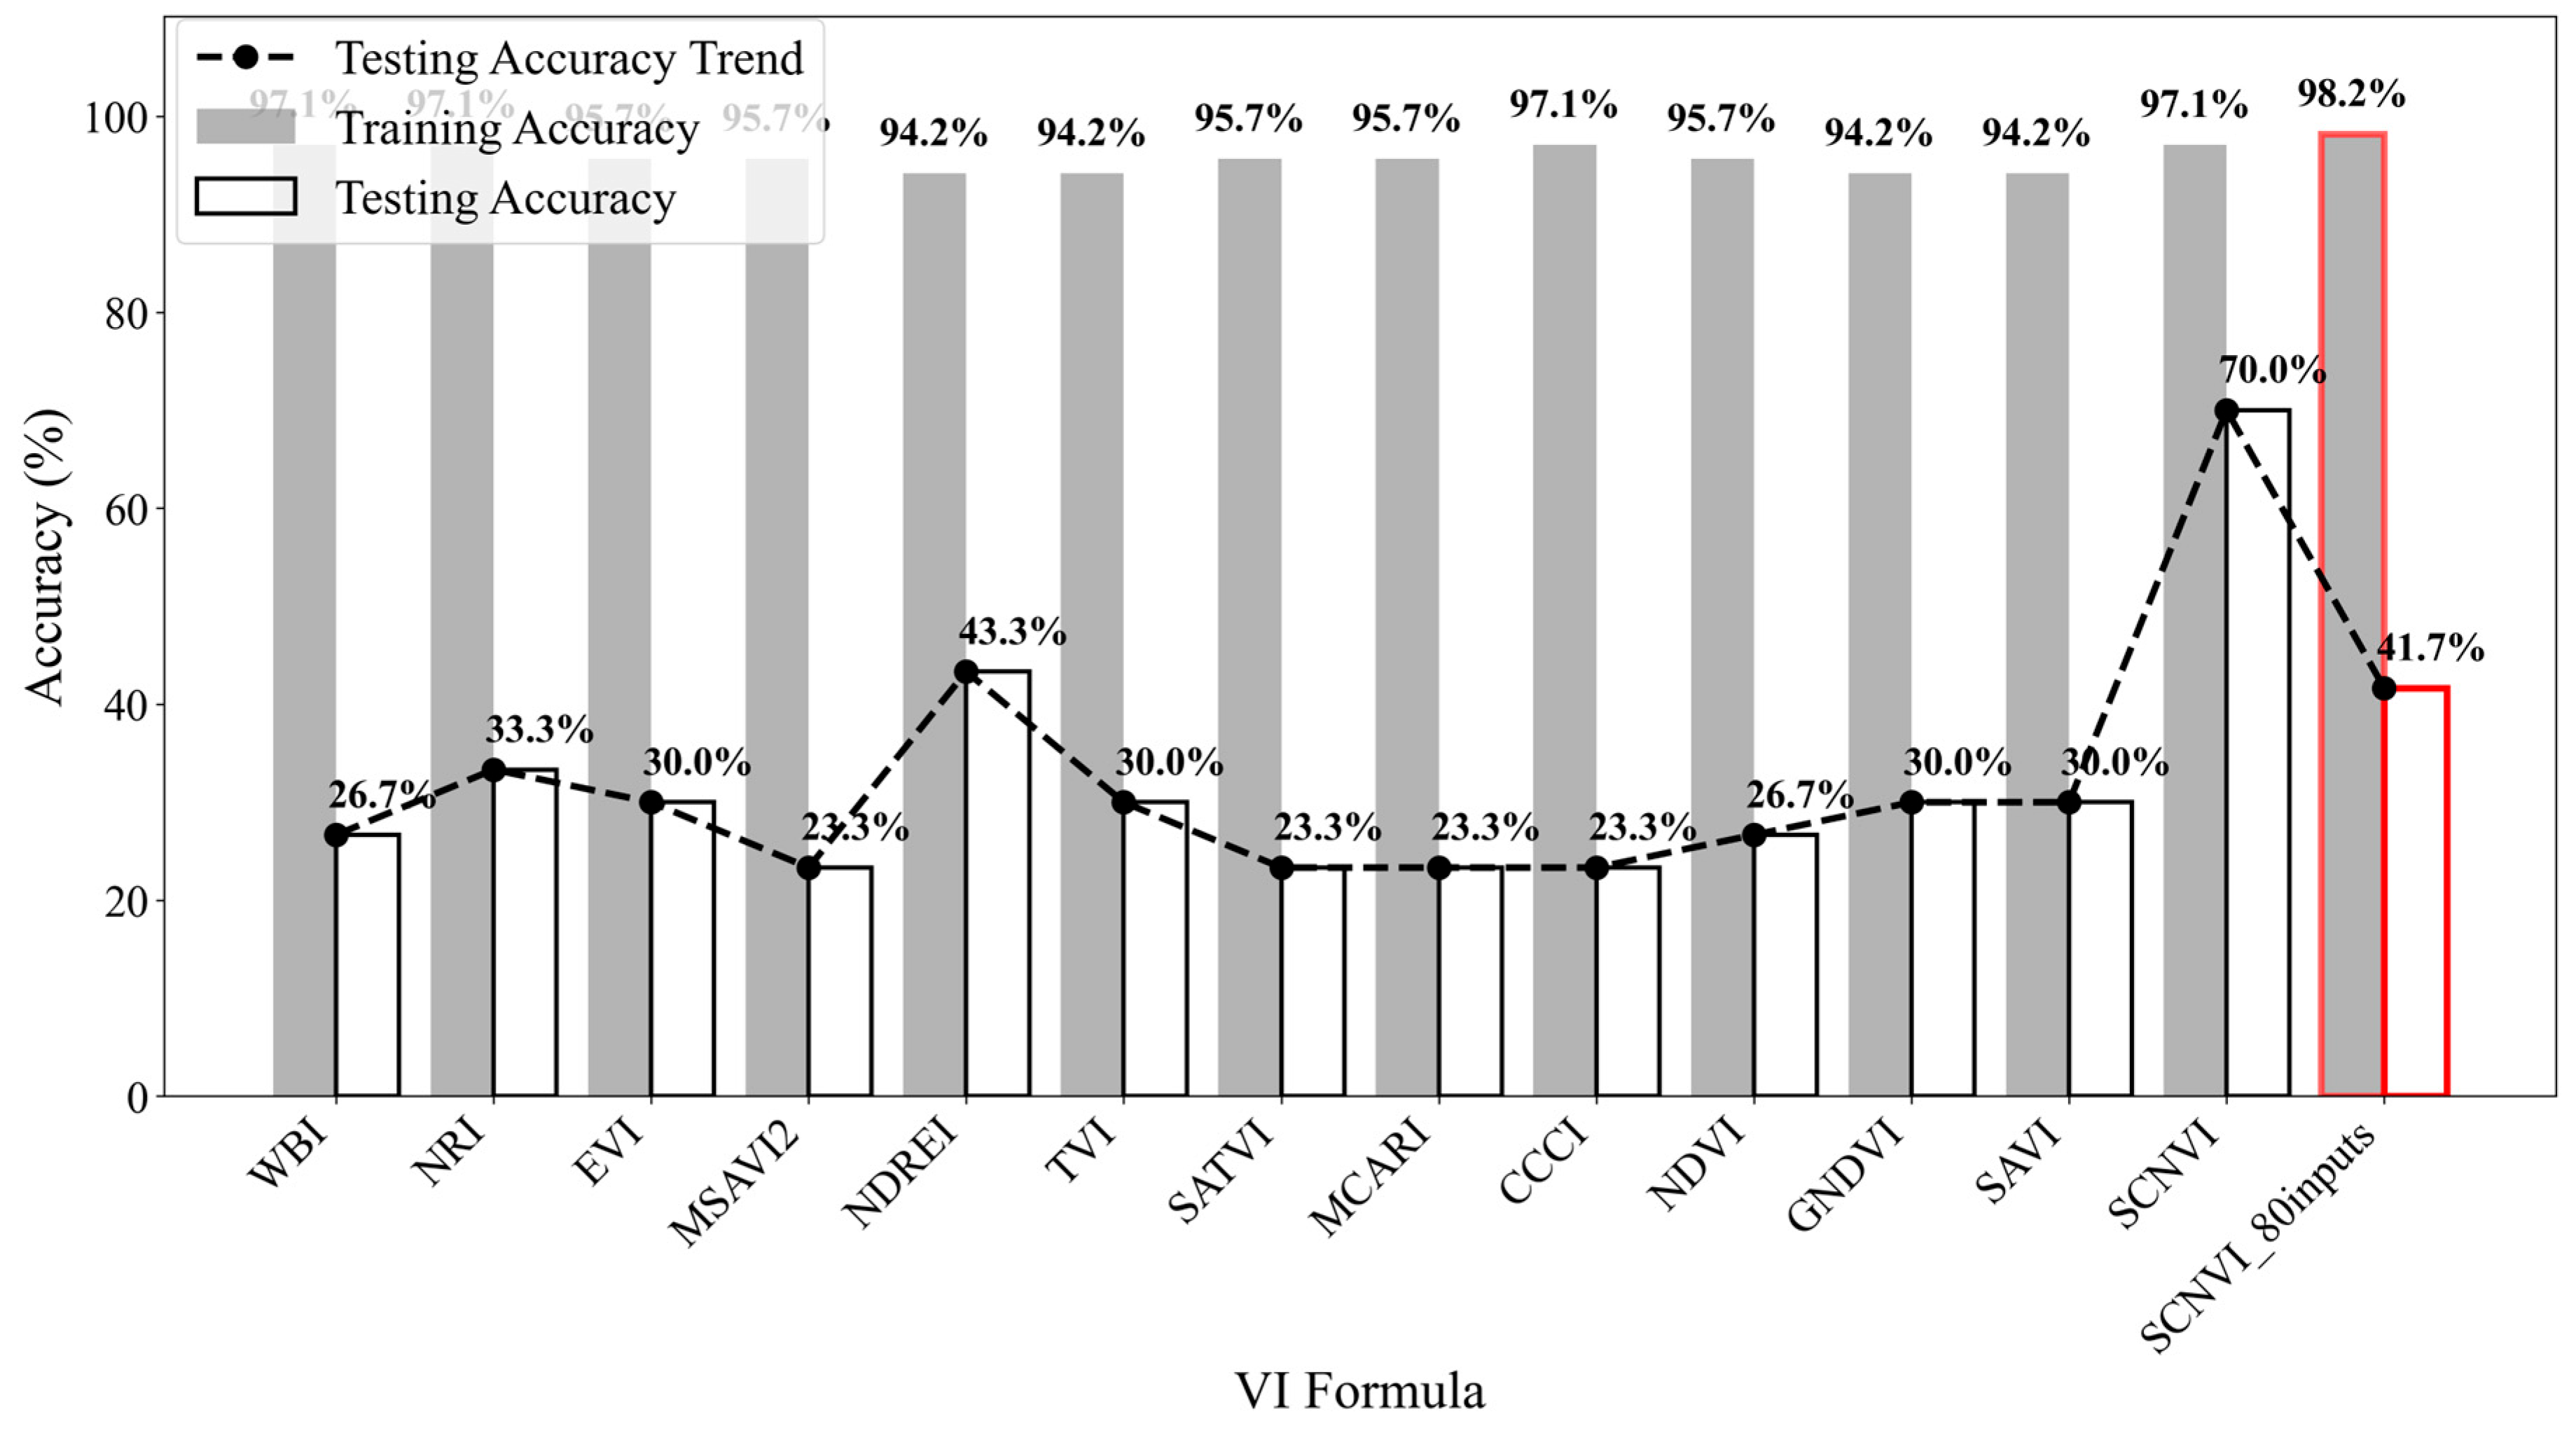
Figure 2). Additionally, its moderate correlations with nitrogen-sensitive VIs such as NRI (r = 0.65) and GNDVI (r = 0.61) indicate that it can provide insights into nitrogen absorption and photosynthetic efficiency. However, its lower correlations with chlorophyll-related (MCARI, r = 0.19) and water-sensitive (WBI, r = 0.29) VIs show that SCNVI is less focused on chlorophyll variation and water status but captures broader stress response in soybean plants. This unique profile is attributable to the inclusion of the 338 nm UV band, which detects the accumulation of biochemical defense compounds such as lignin and phenolic compounds. By integrating this early biochemical stress signal with the photosynthetic decline captured by the red band, the SCNVI provides a more comprehensive evaluation of SCN infestation. This justifies its novelty and superior performance compared to indices that target only one aspect of plant health. Therefore, SCNVI is effective in predicting plant stress and canopy structure, especially stress related to SCN infestation.
2.8. Accuracy Assessment
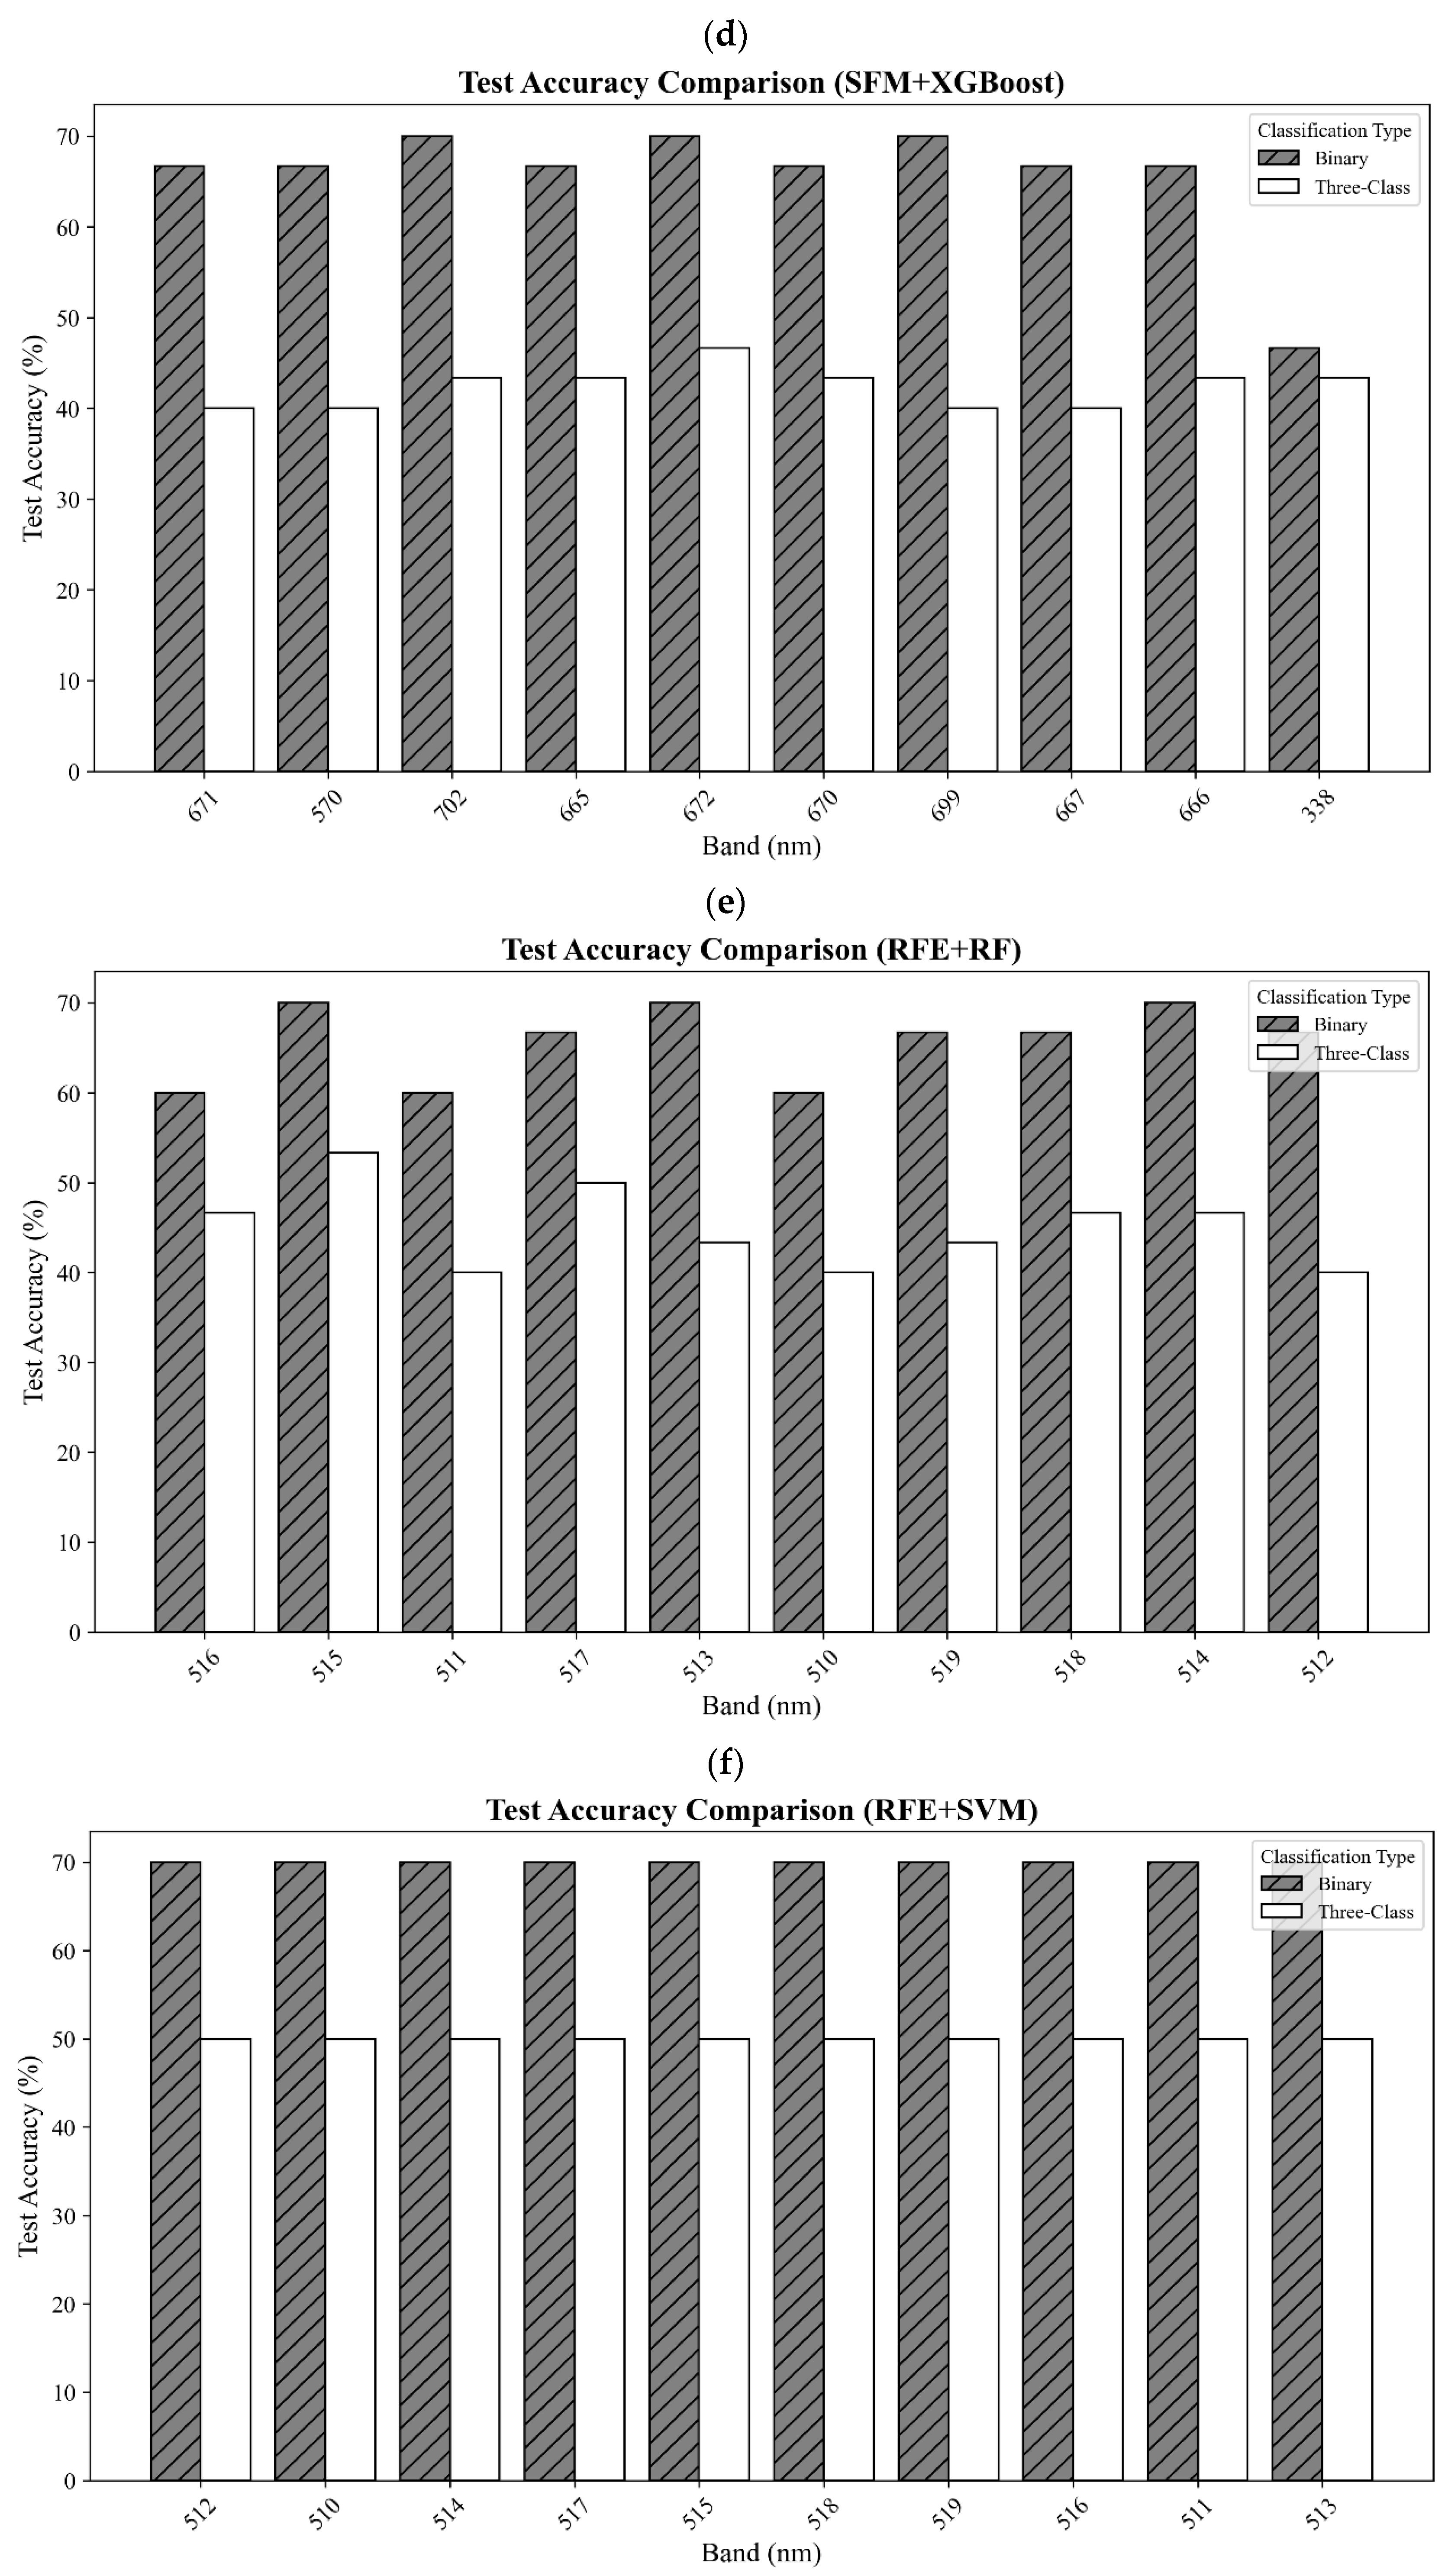
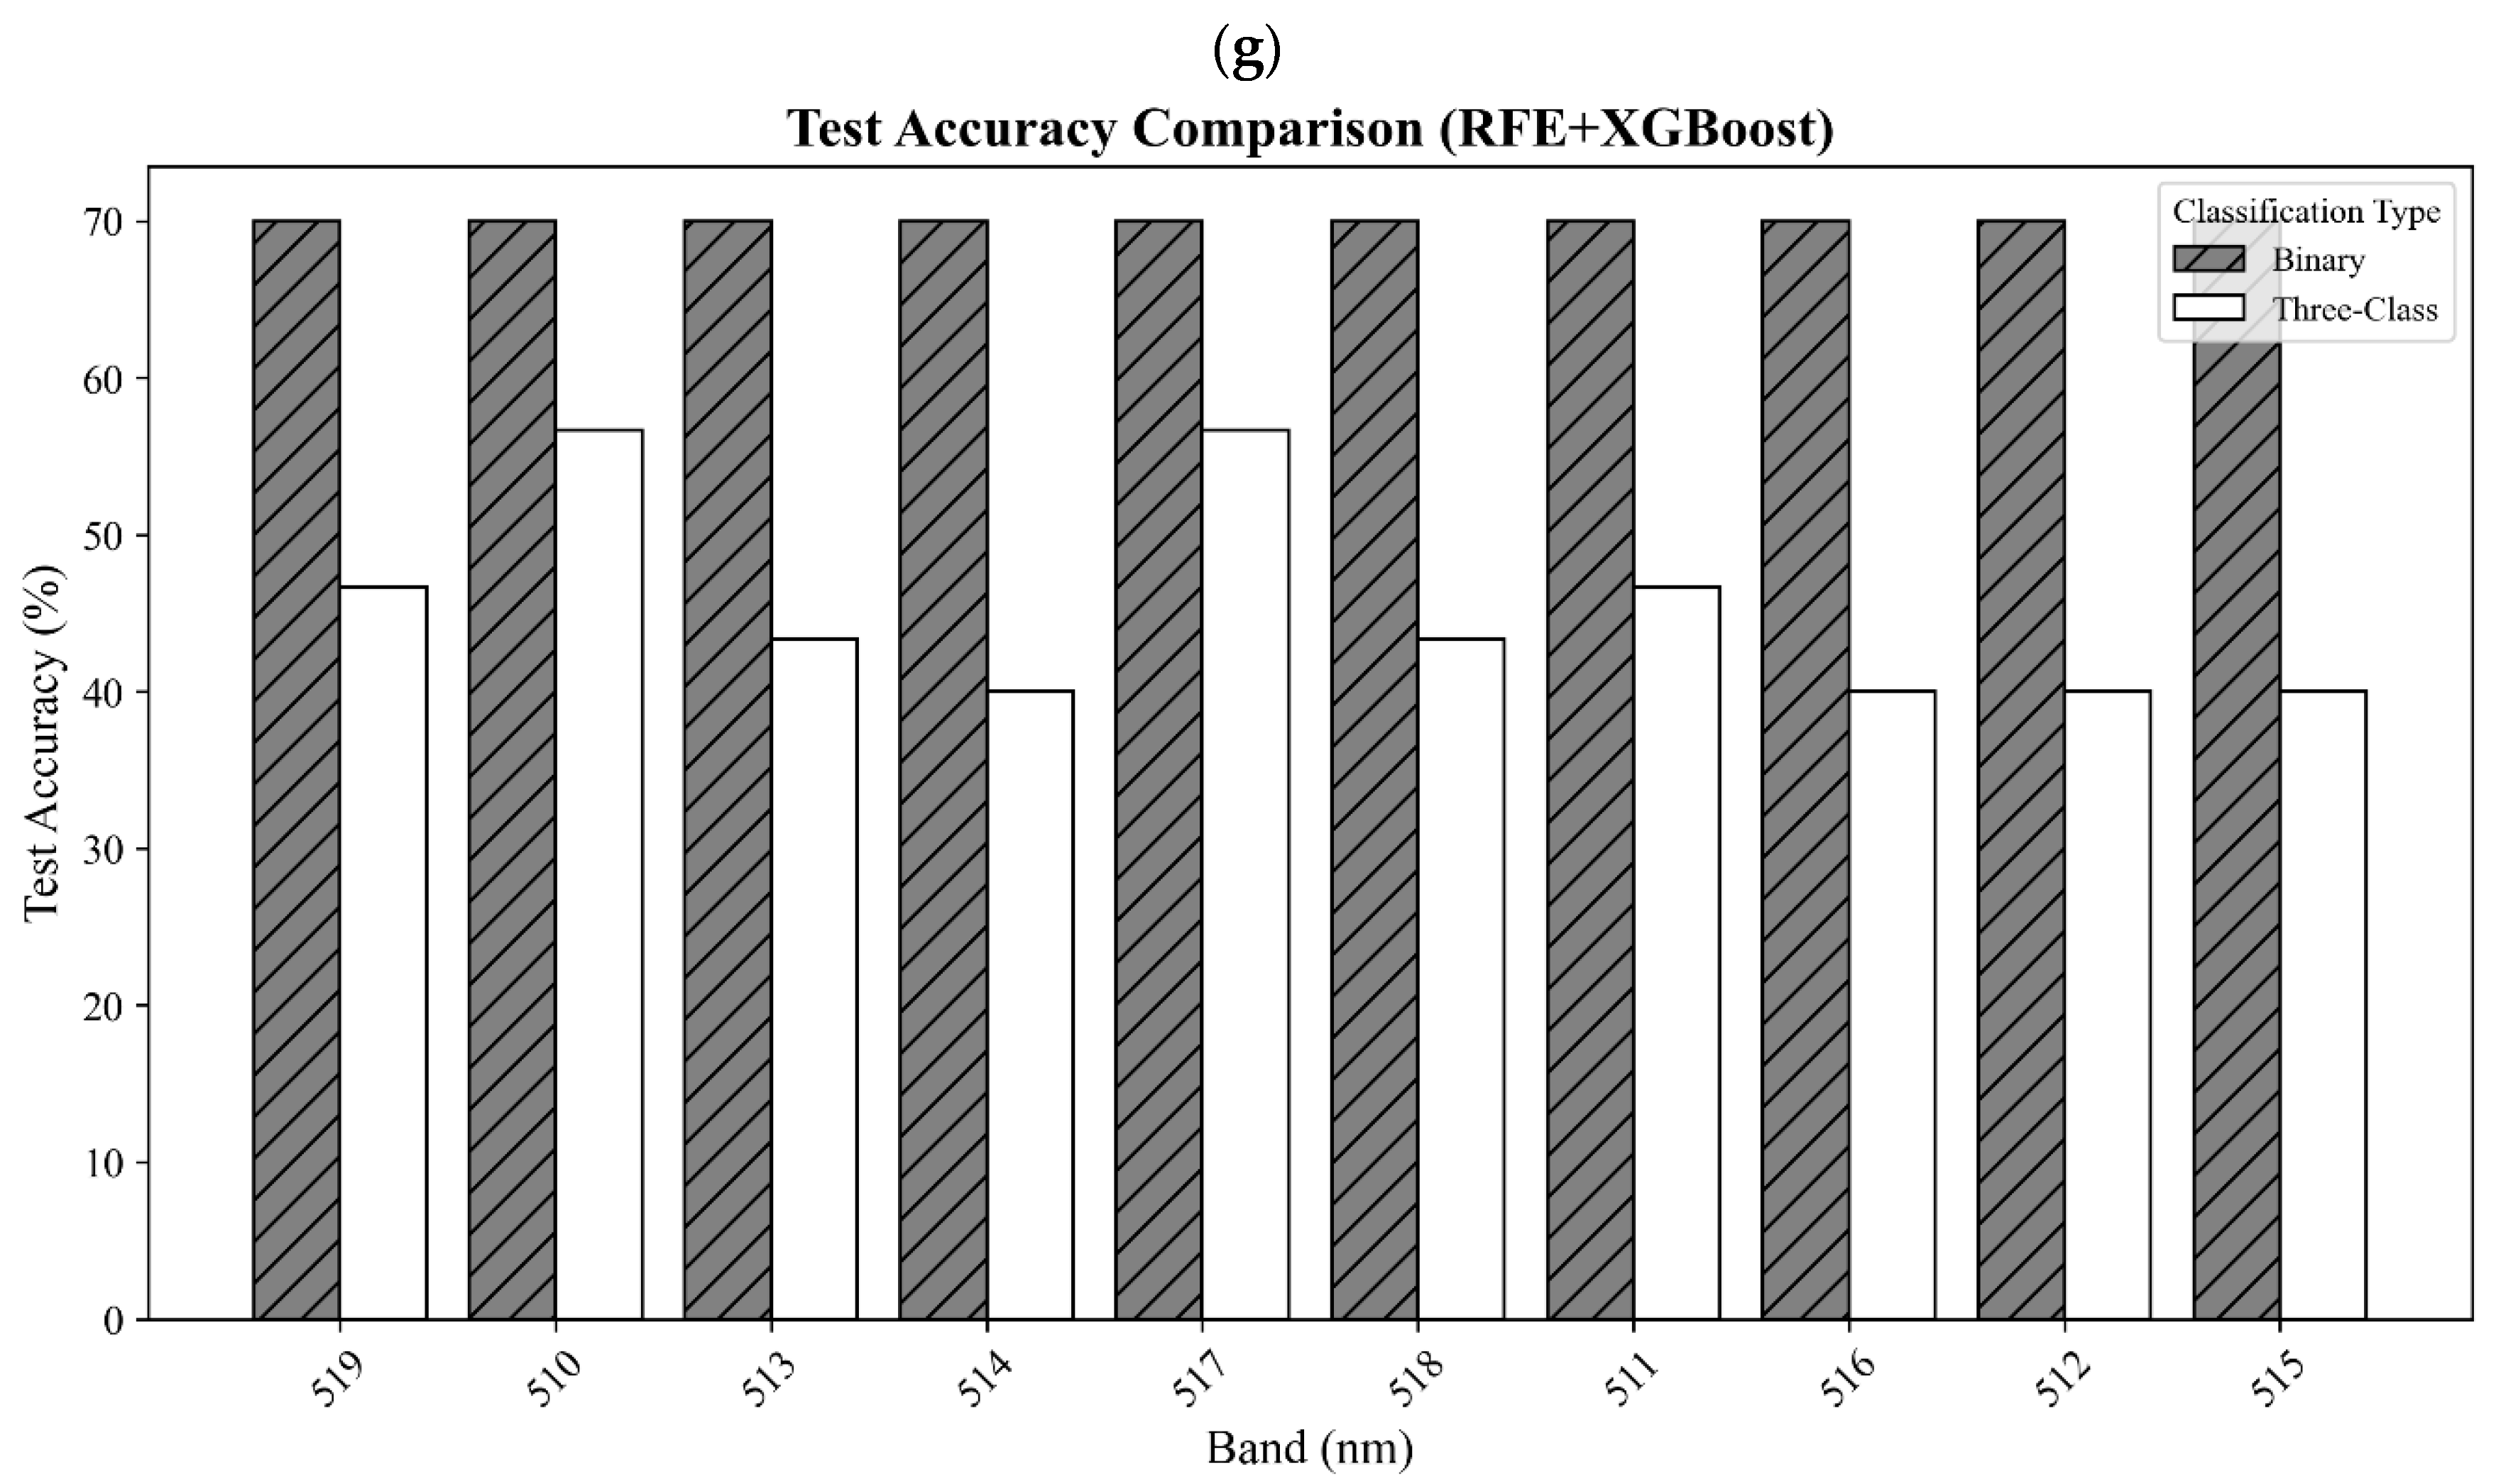
In this study, both the distinction between healthy and stressed soybean plants and the classification of three categories were achieved using hyperspectral data and seven classifiers. The hyperspectral data were collected five times from a total of 20 plants, leading to a total of 100 datasets for three classes: healthy (25 datasets from 5 plants), moderate stress (50 datasets from 10 plants), and severe stress (25 datasets from 5 plants). The dataset was split, with 70% used for training and 30% used for testing. Prior to model training, reflectance values were preprocessed using mean imputation for missing values (SimpleImputer, strategy = mean) and standardized via z-score normalization using StandardScaler to ensure consistent feature scaling. A confusion matrix was employed to assess the accuracy of classification. The confusion matrix was used to calculate the producer’s and user’s and overall accuracies to measure model performance. Moreover, the Kappa statistics, weighted precision, weighted recall, weighted F1, and the Matthews correlation coefficient (MCC) were calculated to further evaluate model performance.
5. Conclusions
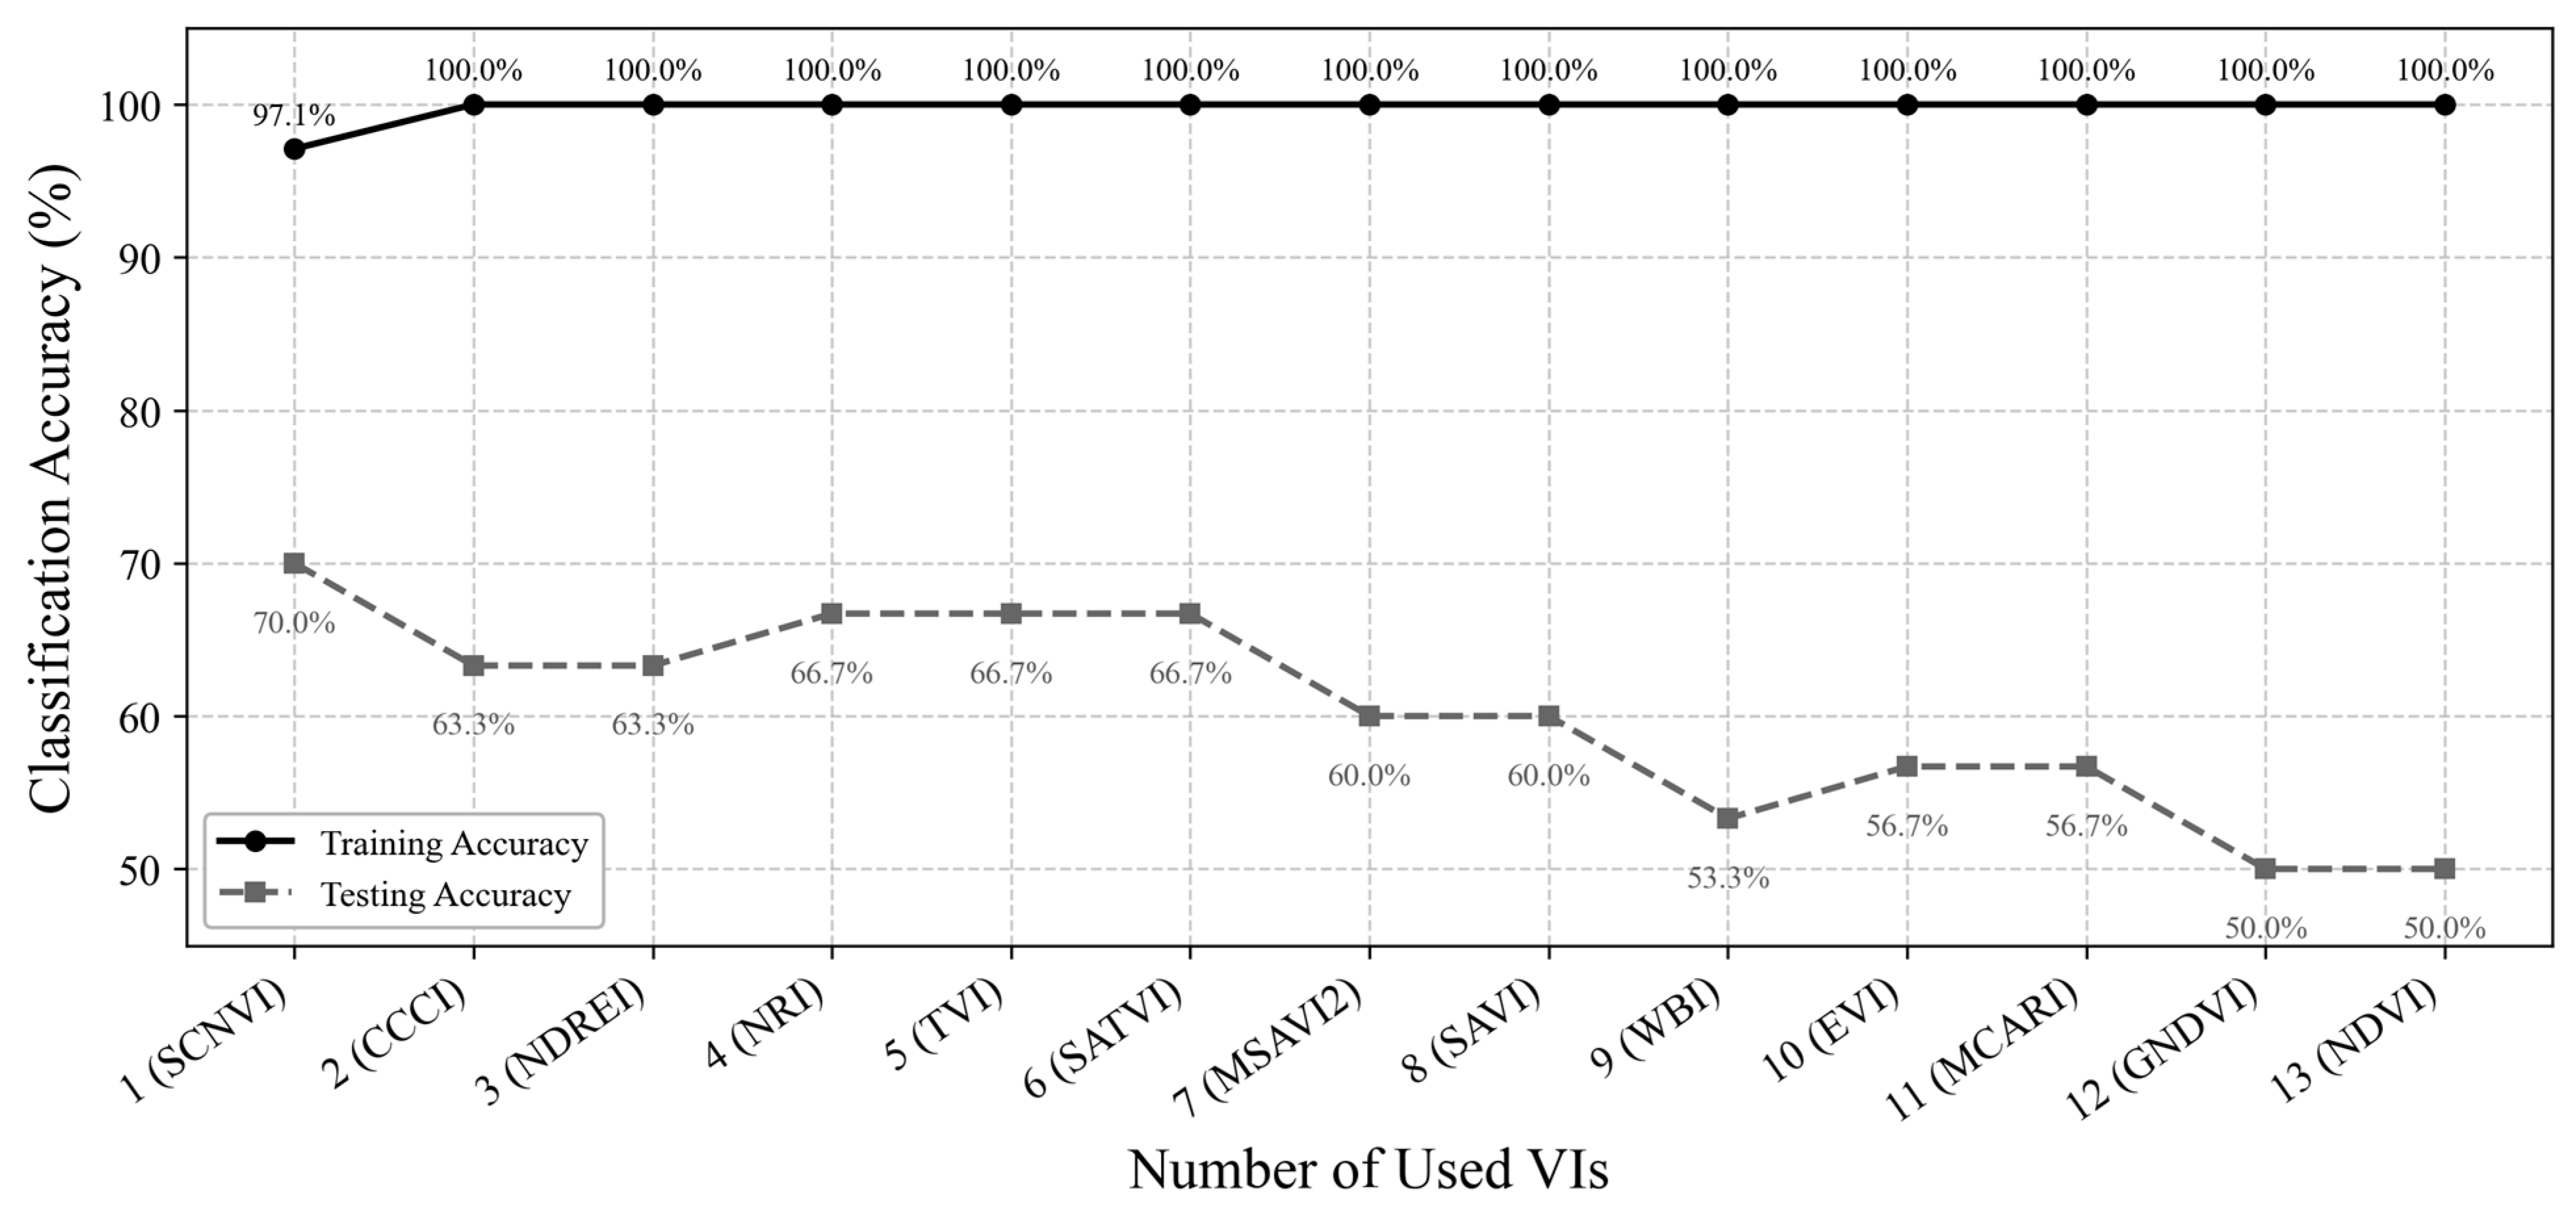
Developing an effective method for detecting SCN infestation, especially for early detection, is critical in reducing loss of soybean yields due to pest- and disease-induced damages. In this study, a new spectral vegetation index, SCNVI, was proposed based on the selected 338 nm UV band and 665 nm red band from hyperspectral data through spectral data statistical analysis, band selection, and classification comparison. The results showed the following: (1) Severely stressed plants had significantly higher spectral reflectance values than healthy and moderately stressed plants in both the UV and visible regions. The spectral reflectance values from the moderately stressed plants were higher than those from the healthy plants, but their spectral differences were slight; (2) mean reflectance values differed significantly among the three classes overall, but the difference was not significant between the healthy and moderately stressed plants; (3) most of the selected top 10 bands by the seven methods fell in the region from 511 nm to 672 nm with several in the UV and red-edge regions, such as 338 nm and 699 nm; (4) based on the testing data, most of the combinations of the top 10 bands with seven classifiers led to an accuracy of 70% for the binary classification of healthy versus infested plants, but the accuracy was lower than 60% for three-class classification; and (5) the proposed SCNVI, coupled with XGBoost, resulted in a more accurate classification of three classes (70%), and compared with 12 traditional VIs, it increased the accuracy by 67%, showing a stronger capacity for early detection of SCN infestation. While these results are promising, they represent a foundational step. Therefore, we conclude that the SCNVI shows the potential for enhancing SCN detection. Moreover, a follow-up study adapting the SCNVI for UAV-based sensors suggests its framework is suitable for field-scale applications, as clusters derived from the adapted index correlated significantly with SCN egg population changes in the field [
60]. This indicates a promising method for developing practical, large-area SCN monitoring tools. However, its true efficacy and practical utility for soybean production must first be confirmed through large-scale field validation under real-world agricultural conditions.
