Can We Teach Machines to Select Like a Plant Breeder? A Recommender System Approach to Support Early Generation Selection Decisions Based on Breeders’ Preferences

 ,
,
Abstract
1. Introduction
2. Materials and Methods
2.1. Plant Material, Classification of Breeder’s Decisions, and Genotypic Data
2.2. Estimating the Explained Variance of Breeders’ Decisions
2.3. Forward Prediction of Breeder’s Decisions by Machine Learning Algorithms
- (1)
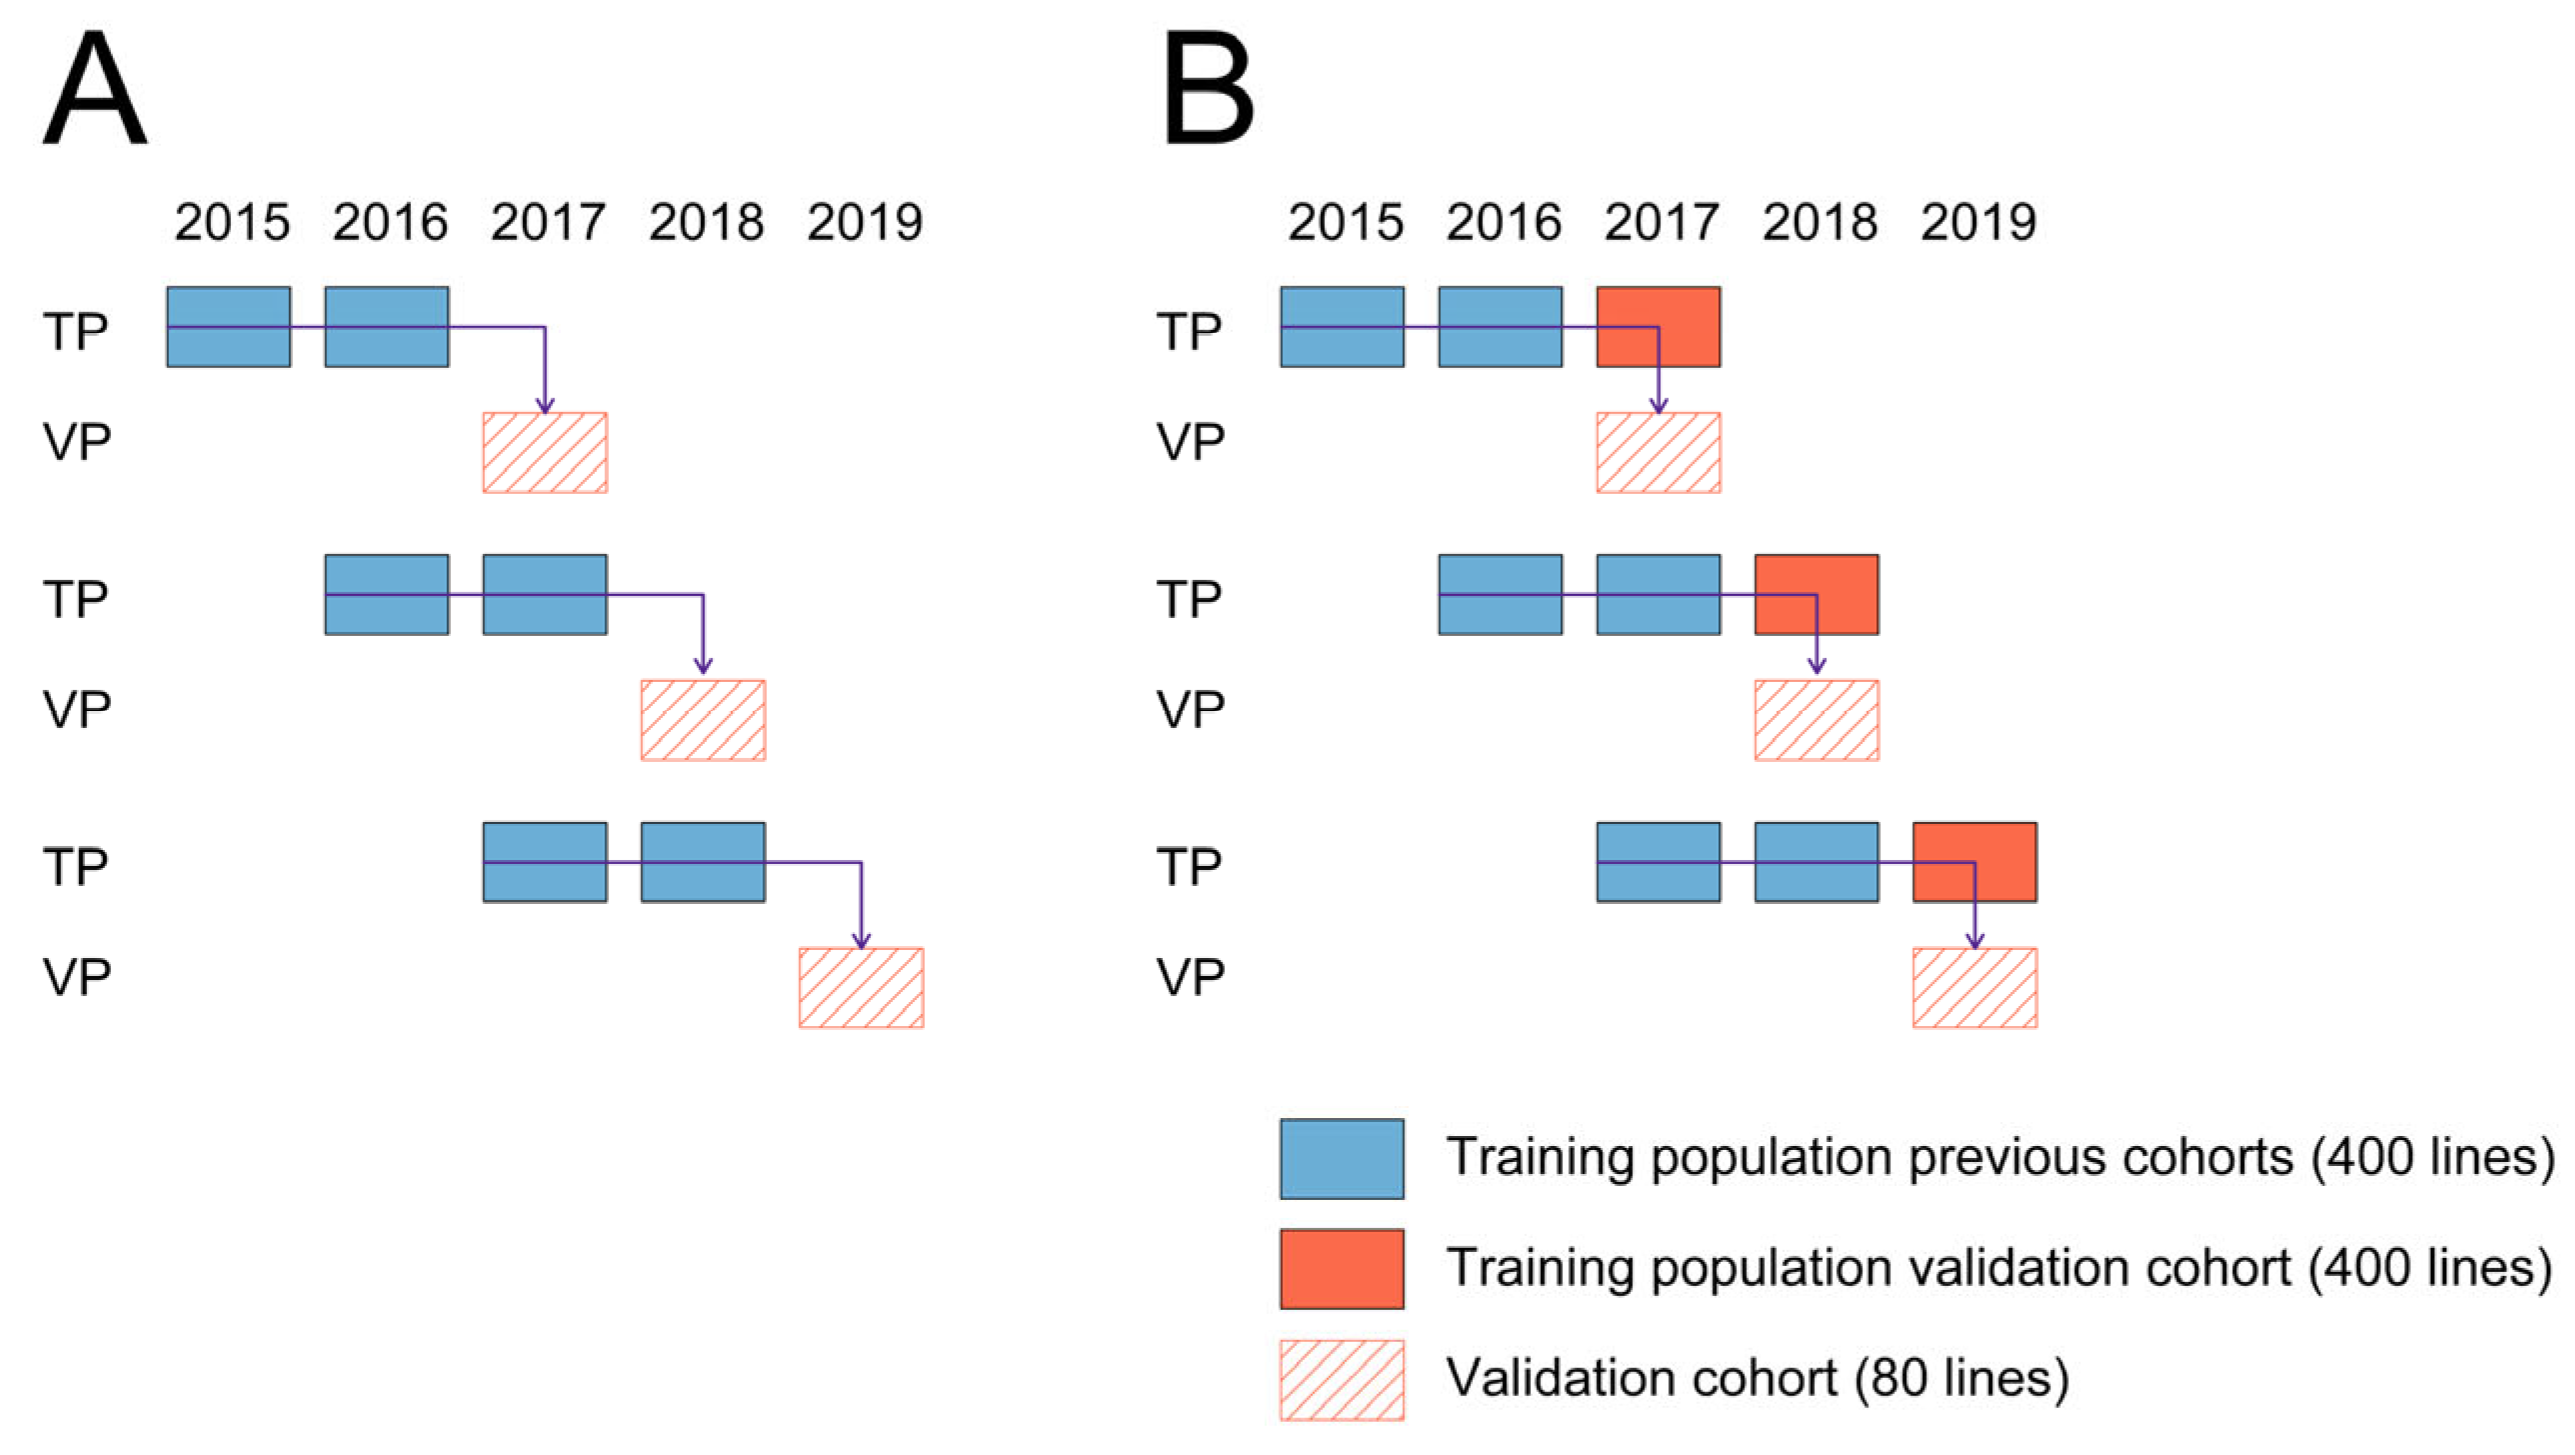
- Training populations coming from two cohorts preceding the cohort that was used for validation were used for fitting prediction models (800 lines) (Figure 2A).
- (2)
- Training populations coming from two cohorts preceding the cohort used for validation were used for fitting prediction models, while this set was augmented by the training population coming from the same cohort that was used for validation (1200 lines) (Figure 2B).
2.4. Retrospective Assessment of the Machine Learning Algorithms’ Recommendations as a Selection Decision Support Tool
- (1)
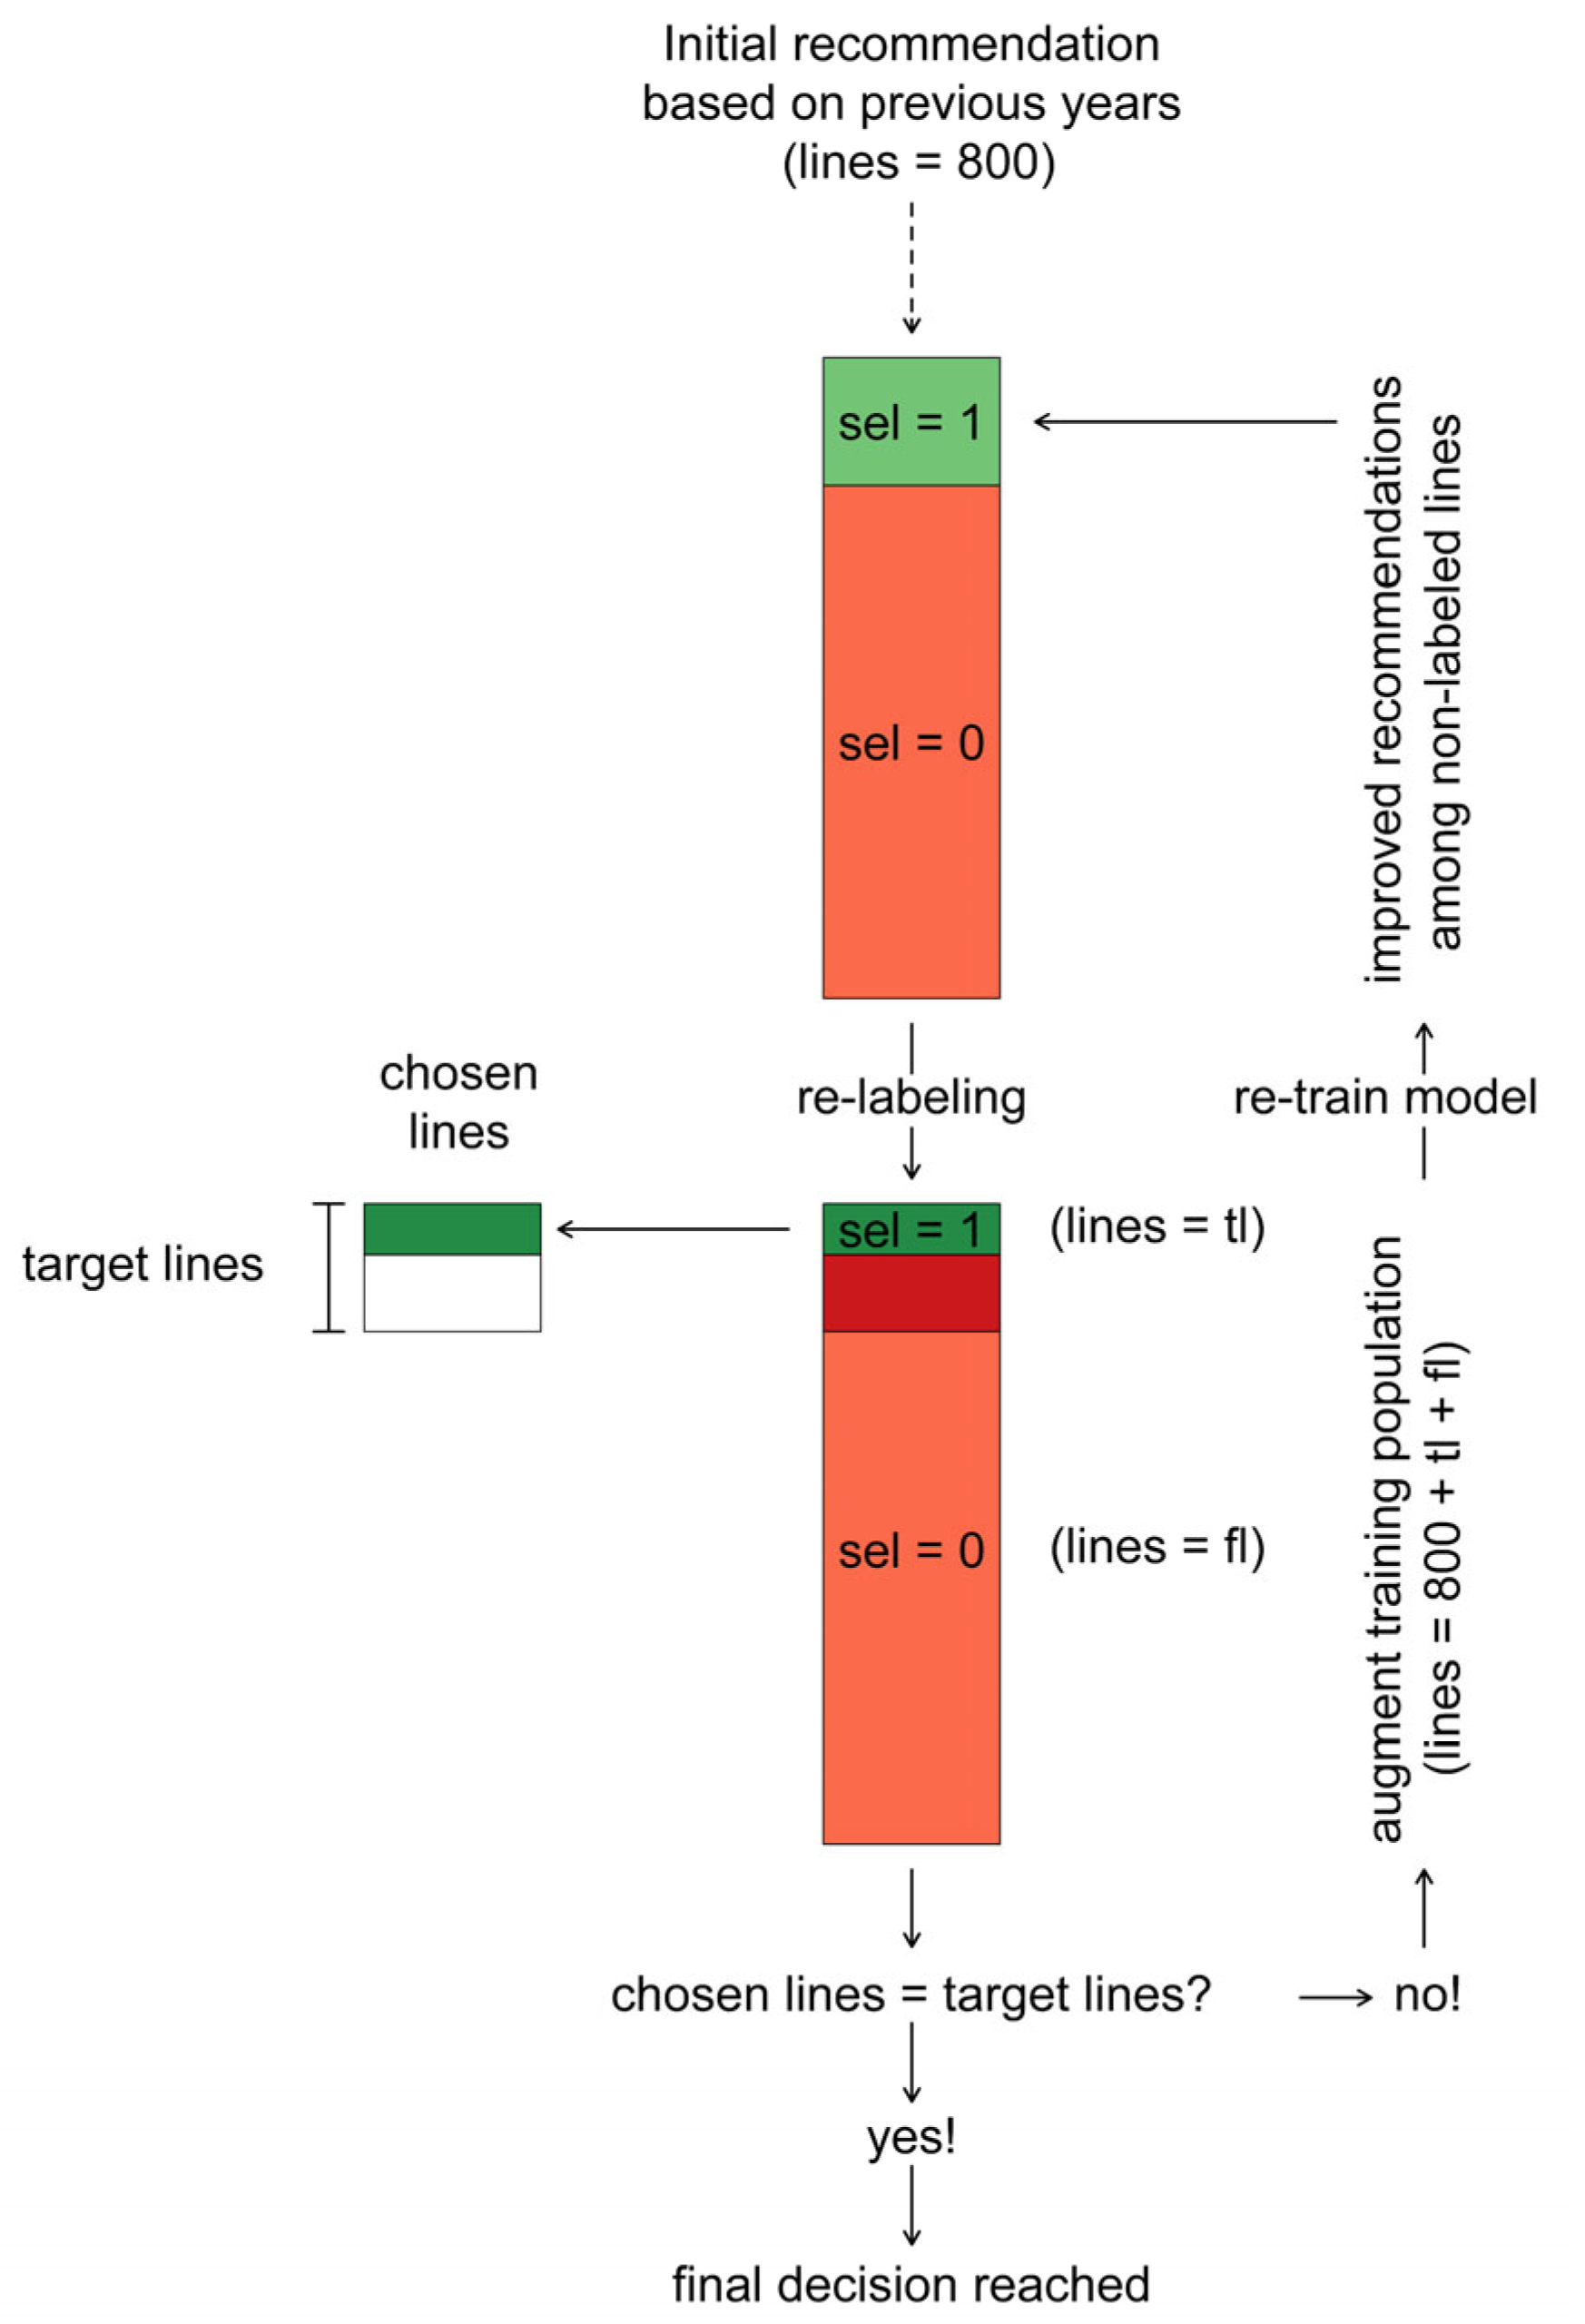
- In the first iteration , the lines with the highest probability of selection were recommended and labeled to fall into the class of selected lines .
- (2)
- Based on the actual breeder’s choice among these recommended lines, this labeling of was retained for a number of lines corresponding to the true positives, while it was changed to for a number of lines corresponding to the false positives.
- (3)
- The true positive lines were then added to the pool of chosen lines (.
- (4)
- After (re)-labeling the lines in the population of selection candidates in this way, they were used to augment the initial training population of lines to a size of .
- (5)
- Machine learning models were then re-trained with this augmented training population to obtain recommendations for the remaining not-yet-labeled lines in the population of selection candidates.
- (6)
- In the second iteration the crosses with the highest probability of selection were recommended and labeled to fall into the class of selected lines , reducing the number of recommended lines to the remaining difference towards the target of lines.
- (7)
- Steps (2)–(6) were subsequently repeated for iterations or until the target number of lines was reached in the pool of chosen lines .
3. Results
4. Discussion
5. Conclusions
Supplementary Materials
Author Contributions
Funding
Data Availability Statement
Acknowledgments
Conflicts of Interest
References
- Tong, H.; Nikoloski, Z. Machine learning approaches for crop improvement: Leveraging phenotypic and genotypic big data. J. Plant Physiol. 2021, 257, 153354. [Google Scholar] [CrossRef] [PubMed]
- de Beukelaer, H.; de Meyer, G.; Fack, V. Heuristic exploitation of genetic structure in marker-assisted gene pyramiding problems. BMC Genet. 2015, 16, 2. [Google Scholar] [CrossRef] [PubMed]
- Akdemir, D.; Beavis, W.; Fritsche-Neto, R.; Singh, A.K.; Isidro-Sánchez, J. Multi-objective optimized genomic breeding strategies for sustainable food improvement. Heredity 2019, 122, 672–683. [Google Scholar] [CrossRef] [PubMed]
- González-Camacho, J.M.; Ornella, L.; Pérez-Rodríguez, P.; Gianola, D.; Dreisigacker, S.; Crossa, J. Applications of Machine Learning Methods to Genomic Selection in Breeding Wheat for Rust Resistance. Plant Genome 2018, 11, 170104. [Google Scholar] [CrossRef]
- Montesinos-López, O.A.; Montesinos-López, A.; Pérez-Rodríguez, P.; Barrón-López, J.A.; Martini, J.W.R.; Fajardo-Flores, S.B.; Gaytan-Lugo, L.S.; Santana-Mancilla, P.C.; Crossa, J. A review of deep learning applications for genomic selection. BMC Genom. 2021, 22, 19. [Google Scholar] [CrossRef]
- Robert, P.; Auzanneau, J.; Goudemand, E.; Oury, F.-X.; Rolland, B.; Heumez, E.; Bouchet, S.; Le Gouis, J.; Rincent, R. Phenomic selection in wheat breeding: Identification and optimisation of factors influencing prediction accuracy and comparison to genomic selection. Theor. Appl. Genet. 2022, 135, 895–914. [Google Scholar] [CrossRef]
- Krause, M.R.; Mondal, S.; Crossa, J.; Singh, R.P.; Pinto, F.; Haghighattalab, A.; Shrestha, S.; Rutkoski, J.; Gore, M.A.; Sorrells, M.E.; et al. Aerial high-throughput phenotyping enables indirect selection for grain yield at the early generation, seed-limited stages in breeding programs. Crop Sci. 2020, 60, 3096–3114. [Google Scholar] [CrossRef]
- Zhao, Y.; Thorwarth, P.; Jiang, Y.; Philipp, N.; Schulthess, A.W.; Gils, M.; Boeven, P.H.G.; Longin, C.F.H.; Schacht, J.; Ebmeyer, E.; et al. Unlocking big data doubled the accuracy in predicting the grain yield in hybrid wheat. Sci. Adv. 2021, 7, eabf9106. [Google Scholar] [CrossRef]
- Juliana, P.; Poland, J.; Huerta-Espino, J.; Shrestha, S.; Crossa, J.; Crespo-Herrera, L.; Toledo, F.H.; Govindan, V.; Mondal, S.; Kumar, U.; et al. Improving grain yield, stress resilience and quality of bread wheat using large-scale genomics. Nat. Genet. 2019, 51, 1530–1539. [Google Scholar] [CrossRef]
- Borrenpohl, D.; Huang, M.; Olson, E.; Sneller, C. The value of early-stage phenotyping for wheat breeding in the age of genomic selection. Theor. Appl. Genet. 2020, 133, 2499–2520. [Google Scholar] [CrossRef]
- Raffo, M.A.; Sarup, P.; Guo, X.; Liu, H.; Andersen, J.R.; Orabi, J.; Jahoor, A.; Jensen, J. Improvement of genomic prediction in advanced wheat breeding lines by including additive-by-additive epistasis. Theor. Appl. Genet. 2022, 135, 965–978. [Google Scholar] [CrossRef] [PubMed]
- Sneller, C.; Ignacio, C.; Ward, B.; Rutkoski, J.; Mohammadi, M. Using Genomic Selection to Leverage Resources among Breeding Programs: Consortium-Based Breeding. Agronomy 2021, 11, 1555. [Google Scholar] [CrossRef]
- Juliana, P.; Singh, R.P.; Braun, H.-J.; Huerta-Espino, J.; Crespo-Herrera, L.; Govindan, V.; Mondal, S.; Poland, J.; Shrestha, S. Genomic Selection for Grain Yield in the CIMMYT Wheat Breeding Program—Status and Perspectives. Front. Plant Sci. 2020, 11, 564183. [Google Scholar] [CrossRef]
- Robertsen, C.; Hjortshøj, R.; Janss, L. Genomic Selection in Cereal Breeding. Agronomy 2019, 9, 95. [Google Scholar] [CrossRef]
- Farooq, M.A.; Gao, S.; Hassan, M.A.; Huang, Z.; Rasheed, A.; Hearne, S.; Prasanna, B.; Li, X.; Li, H. Artificial intelligence in plant breeding. Trends Genet. 2024, 40, 891–908. [Google Scholar] [CrossRef] [PubMed]
- Desta, Z.A.; Ortiz, R. Genomic selection: Genome-wide prediction in plant improvement. Trends Plant Sci. 2014, 19, 592–601. [Google Scholar] [CrossRef]
- Michel, S.; Löschenberger, F.; Sparry, E.; Ametz, C.; Bürstmayr, H. Multi-Year Dynamics of Single-Step Genomic Prediction in an Applied Wheat Breeding Program. Agronomy 2020, 10, 1591. [Google Scholar] [CrossRef]
- Schrag, T.A.; Schipprack, W.; Melchinger, A.E. Across-years prediction of hybrid performance in maize using genomics. Theor. Appl. Genet. 2019, 132, 933–946. [Google Scholar] [CrossRef]
- Sleper, J.A.; Sweet, P.K.; Mukherjee, S.; Li, M.; Hugie, K.L.; Warner, T.L. Genomewide selection utilizing historic datasets improves early stage selection accuracy and selection stability. Crop Sci. 2020, 60, 772–778. [Google Scholar] [CrossRef]
- Akdemir, D.; Sanchez, J.I.; Jannink, J.-L. Optimization of genomic selection training populations with a genetic algorithm. Genet. Sel. Evol. 2015, 47, 38. [Google Scholar] [CrossRef]
- Fernández-González, J.; Akdemir, D.; Isidro y Sánchez, J. A comparison of methods for training population optimization in genomic selection. Theor. Appl. Genet. 2023, 136, 30. [Google Scholar] [CrossRef] [PubMed]
- Bustos-Korts, D.; Malosetti, M.; Chapman, S.; Biddulph, B.; van Eeuwijk, F. Improvement of Predictive Ability by Uniform Coverage of the Target Genetic Space. G3 Genes|Genomes|Genet. 2016, 6, 3733–3747. [Google Scholar] [CrossRef]
- Neyhart, J.L.; Tiede, T.; Lorenz, A.J.; Smith, K.P. Evaluating Methods of Updating Training Data in Long-Term Genomewide Selection. G3 Genes|Genomes|Genet. 2017, 7, 1499–1510. [Google Scholar] [CrossRef]
- Heffner, E.L.; Sorrells, M.E.; Jannink, J.-L. Genomic Selection for Crop Improvement. Crop Sci. 2009, 49, 1–12. [Google Scholar] [CrossRef]
- Meuwissen, T.H.E.; Hayes, B.J.; Goddard, M.E. Prediction of total genetic value using genome-wide dense marker maps. Genetics 2001, 157, 1819–1829. [Google Scholar] [CrossRef]
- Tsai, H.; Cericola, F.; Edriss, V.; Andersen, J.R.; Orabi, J.; Jensen, J.D.; Jahoor, A.; Janss, L.; Jensen, J. Use of multiple traits genomic prediction, genotype by environment interactions and spatial effect to improve prediction accuracy in yield data. PLoS ONE 2020, 15, e0232665. [Google Scholar] [CrossRef] [PubMed]
- Belamkar, V.; Guttieri, M.J.; Hussain, W.; Jarquín, D.; El-basyoni, I.; Poland, J.; Lorenz, A.J.; Baenziger, P.S. Genomic Selection in Preliminary Yield Trials in a Winter Wheat Breeding Program. G3 Genes|Genomes|Genet. 2018, 8, 2735–2747. [Google Scholar] [CrossRef]
- Ben-Sadoun, S.; Rincent, R.; Auzanneau, J.; Oury, F.X.; Rolland, B.; Heumez, E.; Ravel, C.; Charmet, G.; Bouchet, S. Economical optimization of a breeding scheme by selective phenotyping of the calibration set in a multi-trait context: Application to bread making quality. Theor. Appl. Genet. 2020, 133, 2197–2212. [Google Scholar] [CrossRef]
- Fradgley, N.S.; Bentley, A.R.; Gardner, K.A.; Swarbreck, S.M.; Kerton, M. Maintenance of UK bread baking quality: Trends in wheat quality traits over 50 years of breeding and potential for future application of genomic-assisted selection. Plant Genome 2023, 16, e20326. [Google Scholar] [CrossRef]
- Schmidt, M.; Kollers, S.; Maasberg-Prelle, A.; Großer, J.; Schinkel, B.; Tomerius, A.; Graner, A.; Korzun, V. Prediction of malting quality traits in barley based on genome-wide marker data to assess the potential of genomic selection. Theor. Appl. Genet. 2016, 129, 203–213. [Google Scholar] [CrossRef]
- Charmet, G.; Pin, P.A.; Schmitt, M.; Leroy, N.; Claustres, B.; Burt, C.; Genty, A. Genomic prediction of agronomic and malting quality traits in six-rowed winter barley. Euphytica 2023, 219, 63. [Google Scholar] [CrossRef]
- Montesinos-López, O.A.; Kismiantini; Montesinos-López, A. Two simple methods to improve the accuracy of the genomic selection methodology. BMC Genom. 2023, 24, 220. [Google Scholar] [CrossRef] [PubMed]
- González-Camacho, J.M.; Crossa, J.; Pérez-Rodríguez, P.; Ornella, L.; Gianola, D. Genome-enabled prediction using probabilistic neural network classifiers. BMC Genom. 2016, 17, 208. [Google Scholar] [CrossRef] [PubMed]
- Xu, Z.; Kurek, A.; Cannon, S.B.; Beavis, W.D. Predictions from algorithmic modeling result in better decisions than from data modeling for soybean iron deficiency chlorosis. PLoS ONE 2021, 16, e0240948. [Google Scholar] [CrossRef]
- Ornella, L.; Pérez, P.; Tapia, E.; González-Camacho, J.M.; Burgueño, J.; Zhang, X.; Singh, S.; Vicente, F.S.; Bonnett, D.; Dreisigacker, S.; et al. Genomic-enabled prediction with classification algorithms. Heredity 2014, 112, 616–626. [Google Scholar] [CrossRef]
- Tschermak, E. Ein Leben fuer die Zuechtung. Aus der Werkstatt eines alten Pflanzenzuechter. Odal 1941, 10, 768–777. [Google Scholar]
- Duvick, D.N. Theory, empiricism and intuition in professional plant breeding. In Farmers, Scientists and Plant Breeding: Integrating Knowledge and Practice; CABI Publishing: Wallingford, UK, 2002; pp. 189–211. [Google Scholar]
- Bueren, E.T.L.; Struik, P.C.; Tiemens-Hulscher, M.; Jacobsen, E. Concepts of Intrinsic Value and Integrity of Plants in Organic Plant Breeding and Propagation. Crop Sci. 2003, 43, 1922–1929. [Google Scholar] [CrossRef]
- Timmermann, M. The Breeder’s Eye—Theoretical Aspects of the Breeder’s Decision-Making. In Proceedings of the COST SUSVAR workshop on Cereal Crop Diversity: Implications for Production and Products; Ostergard, H., Fontaine, L., Eds.; ITAB: Paris, France, 2006; pp. 118–123. [Google Scholar]
- Bernardo, R. Reinventing quantitative genetics for plant breeding: Something old, something new, something borrowed, something BLUE. Heredity 2020, 125, 375–385. [Google Scholar] [CrossRef] [PubMed]
- Burke, R.; Felfernig, A.; Göker, M.H. Recommender Systems: An Overview. AI Mag. 2011, 32, 13–18. [Google Scholar] [CrossRef]
- Breiman, L. Random Forests. Mach. Learn. 2001, 45, 5–32. [Google Scholar] [CrossRef]
- Roy, D.; Dutta, M. A systematic review and research perspective on recommender systems. J. Big Data 2022, 9, 59. [Google Scholar] [CrossRef]
- Diversity Arrays Technology Pty Ltd. DArT P/L, 2020. Available online: https://www.diversityarrays.com/ (accessed on 15 May 2025).
- Stekhoven, D.J.; Bühlmann, P. Missforest-Non-parametric missing value imputation for mixed-type data. Bioinformatics 2012, 28, 112–118. [Google Scholar] [CrossRef] [PubMed]
- Michel, S.; Löschenberger, F.; Ametz, C.; Pachler, B.; Sparry, E.; Bürstmayr, H. Simultaneous selection for grain yield and protein content in genomics-assisted wheat breeding. Theor. Appl. Genet. 2019, 132, 1745–1760. [Google Scholar] [CrossRef]
- Michel, S.; Kummer, C.; Gallee, M.; Hellinger, J.; Ametz, C.; Akgöl, B.; Epure, D.; Löschenberger, F.; Buerstmayr, H. Improving the baking quality of bread wheat by genomic selection in early generations. Theor. Appl. Genet. 2018, 131, 477–493. [Google Scholar] [CrossRef]
- Moreno-Amores, J.; Michel, S.; Löschenberger, F.; Buerstmayr, H. Dissecting the Contribution of Environmental Influences, Plant Phenology, and Disease Resistance to Improving Genomic Predictions for Fusarium Head Blight Resistance in Wheat. Agronomy 2020, 10, 2008. [Google Scholar] [CrossRef]
- Pérez, P.; de los Campos, G. Genome-Wide Regression and Prediction with the BGLR Statistical Package. Genetics 2014, 198, 483–495. [Google Scholar] [CrossRef]
- R Core Team R: A Language and Environment for Statistical Computing 2022. Available online: https://www.r-project.org/ (accessed on 15 May 2025).
- Heuer, C.; Scheel, C.; Tetens, J.; Kühn, C.; Thaller, G. Genomic prediction of unordered categorical traits: An application to subpopulation assignment in German Warmblood horses. Genet. Sel. Evol. 2016, 48, 13. [Google Scholar] [CrossRef]
- Nakagawa, S.; Schielzeth, H. Repeatability for Gaussian and non-Gaussian data: A practical guide for biologists. Biol. Rev. 2010, 85, 935–956. [Google Scholar] [CrossRef]
- de Villemereuil, P.; Gimenez, O.; Doligez, B. Comparing parent–offspring regression with frequentist and Bayesian animal models to estimate heritability in wild populations: A simulation study for Gaussian and binary traits. Methods Ecol. Evol. 2013, 4, 260–275. [Google Scholar] [CrossRef]
- Tay, J.K.; Narasimhan, B.; Hastie, T. Elastic Net Regularization Paths for All Generalized Linear Models. J. Stat. Softw. 2023, 106, 1–31. [Google Scholar] [CrossRef]
- Günther, F.; Fritsch, S. Neuralnet: Training of Neural Networks. R J. 2010, 2, 30. [Google Scholar] [CrossRef]
- Liaw, A.; Wiener, M. Classification and Regression by randomForest. R News 2002, 2, 18–22. [Google Scholar]
- Lichtenthaler, U. Substitute or Synthesis: The Interplay between Human and Artificial Intelligence. Res. Technol. Manag. 2018, 61, 12–14. [Google Scholar] [CrossRef]
- Jiang, Y.; Li, X.; Luo, H.; Yin, S.; Kaynak, O. Quo vadis artificial intelligence? Discov. Artif. Intell. 2022, 2, 4. [Google Scholar] [CrossRef]
- Korteling, J.E.; van de Boer-Visschedijk, G.C.; Blankendaal, R.A.M.; Boonekamp, R.C.; Eikelboom, A.R. Human-versus Artificial Intelligence. Front. Artif. Intell. 2021, 4, 1–13. [Google Scholar] [CrossRef]
- Rapp, M.; Lein, V.; Lacoudre, F.; Lafferty, J.; Müller, E.; Vida, G.; Bozhanova, V.; Ibraliu, A.; Thorwarth, P.; Piepho, H.P.; et al. Simultaneous improvement of grain yield and protein content in durum wheat by different phenotypic indices and genomic selection. Theor. Appl. Genet. 2018, 131, 1315–1329. [Google Scholar] [CrossRef]
- Thorwarth, P.; Liu, G.; Ebmeyer, E.; Schacht, J.; Schachschneider, R.; Kazman, E.; Reif, J.C.; Würschum, T.; Longin, C.F.H. Dissecting the genetics underlying the relationship between protein content and grain yield in a large hybrid wheat population. Theor. Appl. Genet. 2019, 132, 489–500. [Google Scholar] [CrossRef] [PubMed]
- Bernardo, R. Retrospective Index Weights Used in Multiple Trait Selection in a Maize Breeding Program. Crop Sci. 1991, 31, 1174–1179. [Google Scholar] [CrossRef]
- Michel, S.; Löschenberger, F.; Ametz, C.; Pachler, B.; Sparry, E.; Bürstmayr, H. Combining grain yield, protein content and protein quality by multi-trait genomic selection in bread wheat. Theor. Appl. Genet. 2019, 132, 2767–2780. [Google Scholar] [CrossRef]
- Ceron-Rojas, J.J.; Crossa, J.; Arief, V.N.; Basford, K.; Rutkoski, J.; Jarquín, D.; Alvarado, G.; Beyene, Y.; Semagn, K.; DeLacy, I. A Genomic Selection Index Applied to Simulated and Real Data. G3 Genes|Genomes|Genet. 2015, 5, 2155–2164. [Google Scholar] [CrossRef]
- Schulthess, A.W.; Wang, Y.; Miedaner, T.; Wilde, P.; Reif, J.C.; Zhao, Y. Multiple-trait- and selection indices-genomic predictions for grain yield and protein content in rye for feeding purposes. Theor. Appl. Genet. 2016, 129, 273–287. [Google Scholar] [CrossRef] [PubMed]


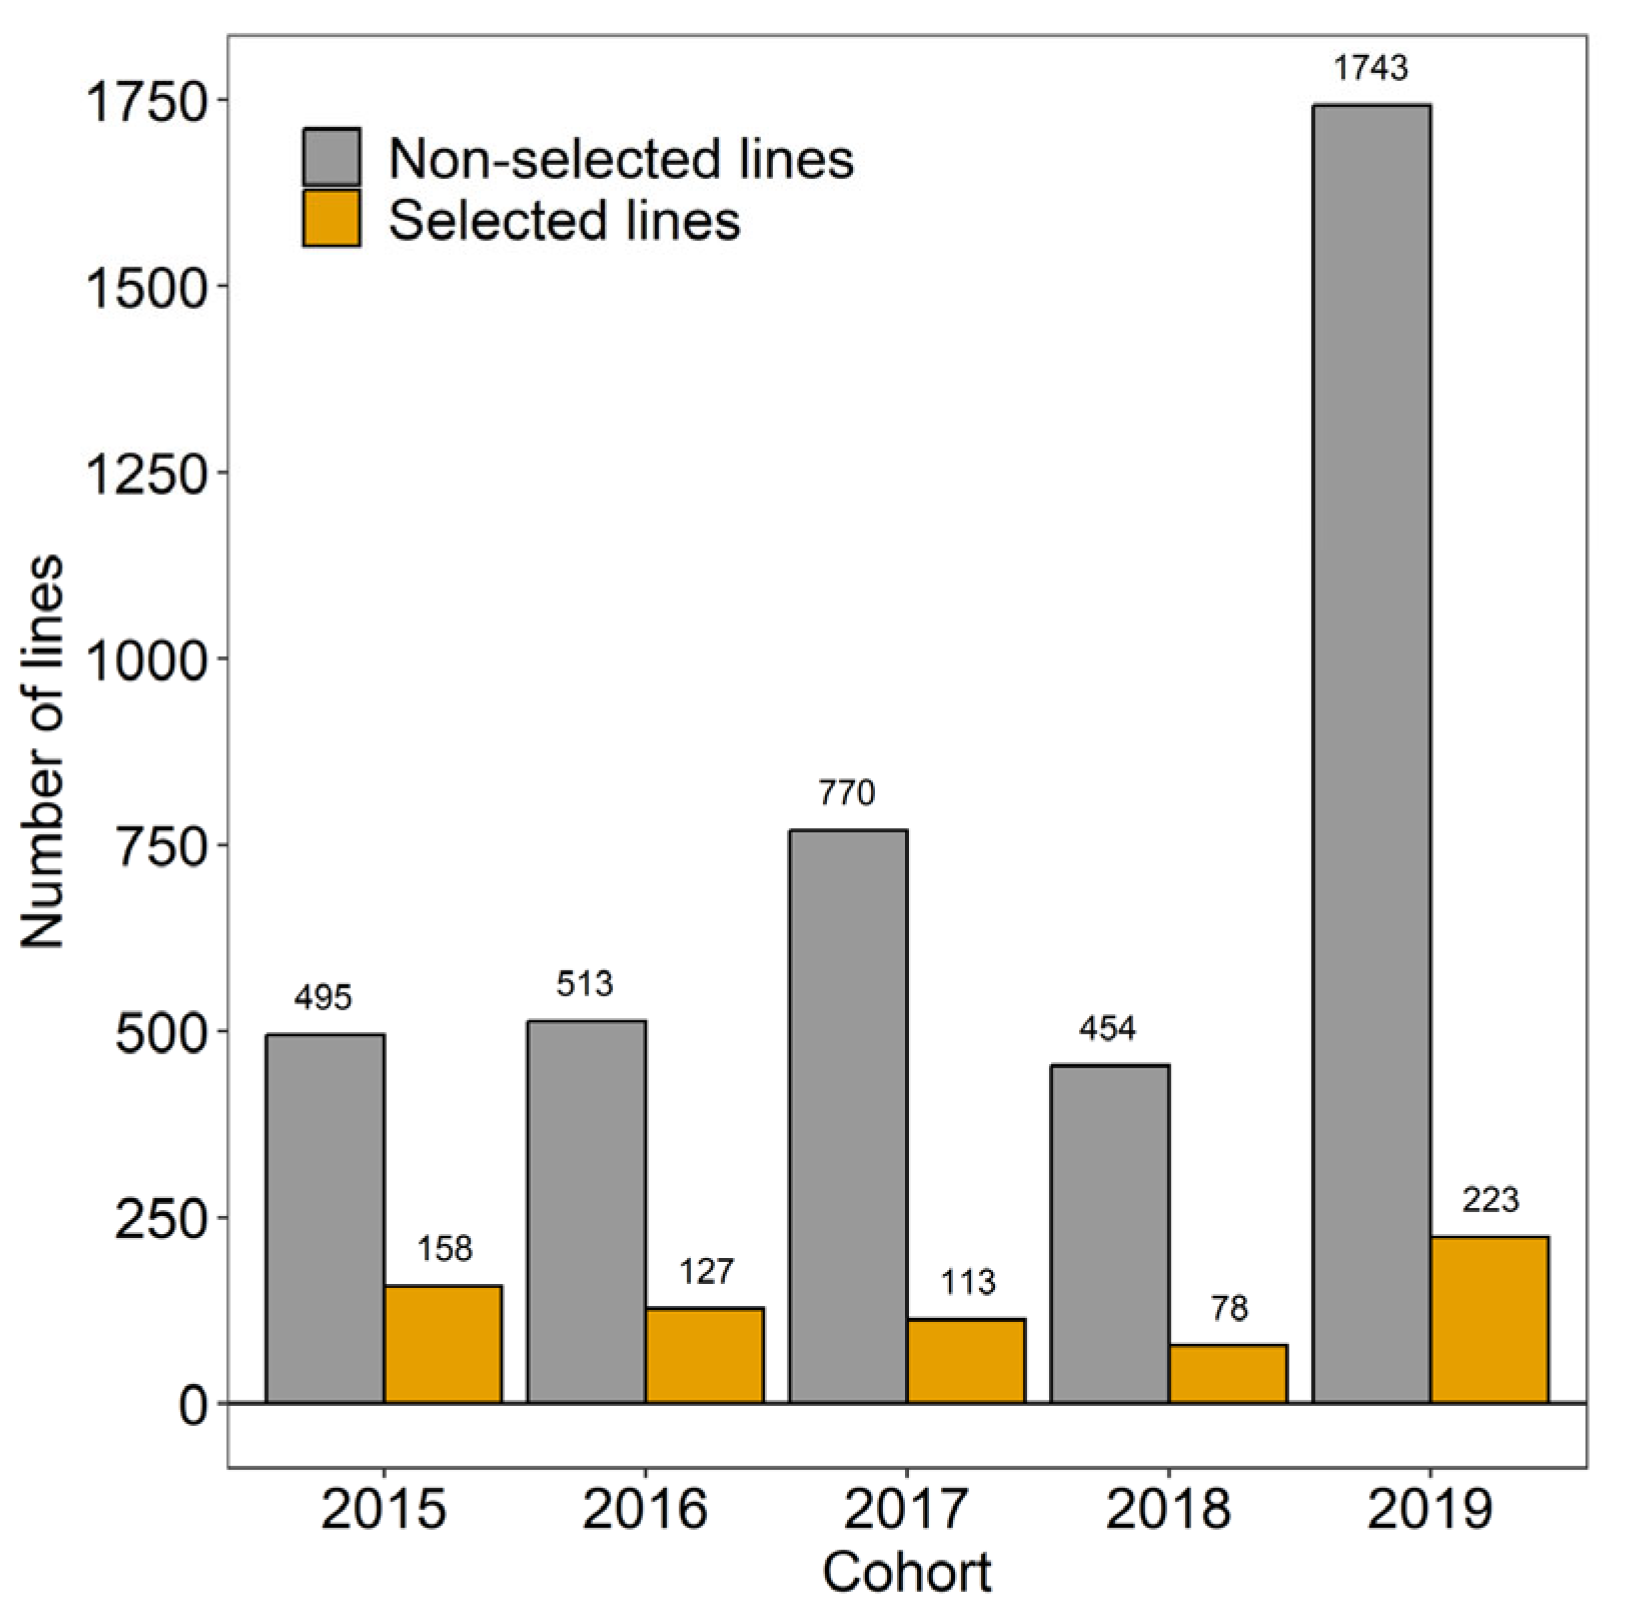
| Year | Lines | Non-Selected Lines | Selected Lines | ||
|---|---|---|---|---|---|
| 2015 | 653 | 495 | 158 | 0.77 | 0.33 |
| 2016 | 640 | 513 | 127 | 0.57 | 0.32 |
| 2017 | 883 | 770 | 113 | 0.53 | 0.24 |
| 2018 | 532 | 454 | 78 | 0.55 | 0.22 |
| 2019 | 1966 | 1743 | 223 | 0.54 | 0.34 |
| 2015–2019 | 4674 | 3975 | 669 | 0.45 | 0.25 |
Disclaimer/Publisher’s Note: The statements, opinions and data contained in all publications are solely those of the individual author(s) and contributor(s) and not of MDPI and/or the editor(s). MDPI and/or the editor(s) disclaim responsibility for any injury to people or property resulting from any ideas, methods, instructions or products referred to in the content. |
© 2025 by the authors. Licensee MDPI, Basel, Switzerland. This article is an open access article distributed under the terms and conditions of the Creative Commons Attribution (CC BY) license (https://creativecommons.org/licenses/by/4.0/).
Share and Cite
Michel, S.; Löschenberger, F.; Ametz, C.; Bistrich, H.; Bürstmayr, H. Can We Teach Machines to Select Like a Plant Breeder? A Recommender System Approach to Support Early Generation Selection Decisions Based on Breeders’ Preferences. Crops 2025, 5, 31. https://doi.org/10.3390/crops5030031
Michel S, Löschenberger F, Ametz C, Bistrich H, Bürstmayr H. Can We Teach Machines to Select Like a Plant Breeder? A Recommender System Approach to Support Early Generation Selection Decisions Based on Breeders’ Preferences. Crops. 2025; 5(3):31. https://doi.org/10.3390/crops5030031
Chicago/Turabian StyleMichel, Sebastian, Franziska Löschenberger, Christian Ametz, Herbert Bistrich, and Hermann Bürstmayr. 2025. "Can We Teach Machines to Select Like a Plant Breeder? A Recommender System Approach to Support Early Generation Selection Decisions Based on Breeders’ Preferences" Crops 5, no. 3: 31. https://doi.org/10.3390/crops5030031
APA StyleMichel, S., Löschenberger, F., Ametz, C., Bistrich, H., & Bürstmayr, H. (2025). Can We Teach Machines to Select Like a Plant Breeder? A Recommender System Approach to Support Early Generation Selection Decisions Based on Breeders’ Preferences. Crops, 5(3), 31. https://doi.org/10.3390/crops5030031