Article

Comparison of the Nutritional, Physicochemical, Technological–Functional, and Structural Properties and Antioxidant Compounds of Corn Kernel Flours from Native Mexican Maize Cultivated in Jalisco Highlands

by
Luis Alfonso Hernández-Villaseñor
1,
Salvador Hernández-Estrada
1,
Víctor Manuel Gómez-Rodríguez
1,
Humberto Ramírez-Vega
1,
Zuamí Villagrán
1,
Araceli Ortega-Martínez
2,
Efigenia Montalvo-González
3,
José Martín Ruvalcaba-Gómez
4,
Napoleón González-Silva
1,* and
Luis Miguel Anaya-Esparza
5,*
1
Centro Universitario de los Altos, Universidad de Guadalajara, Tepatitlán de Morelos 47620, Mexico
2
Centro Universitario de la Ciénega, Universidad de Guadalajara, Av. Universidad 1115, Ocotlán 47810, Mexico
3
Laboratorio de Integral de Investigación de Alimentos, Tecnológico Nacional de México, Instituto Tecnológico de Tepic, Tepic 63175, Mexico
4
Centro Nacional de Recursos Genéticos, Instituto Nacional de Investigaciones Forestales, Agrícolas y Pecuarias, Tepatitlán de Morelos 47600, Mexico
5
Centro de Estudios para la Agricultura, la Alimentación y la Crisis Climática, Centro Universitario de los Altos, Universidad de Guadalajara, Tepatitlán de Morelos 47620, Mexico
*
Authors to whom correspondence should be addressed.
Crops 2025, 5(3), 26; https://doi.org/10.3390/crops5030026
Submission received: 25 February 2025 / Revised: 10 April 2025 / Accepted: 23 April 2025 / Published: 3 May 2025

Abstract

:
Maize plays a crucial role in global nutrition and food security, with Mexico making a significant contribution through its diverse native corn genotypes. However, research on flours derived from these native maize genotypes remains limited, hindering their potential applications in food manufacturing. This study aimed to determine the nutritional, physicochemical, techno-functional, structural, and antioxidant properties of corn kernel flours from nine native Mexican maize accessions cultivated in the highlands of Jalisco. Enough cobs for each maize accession were randomly selected to yield 1000 g of corn kernels. Data analysis was conducted by analysis of variance and Kruskal–Wallis tests (α = 0.05). Moreover, Principal Component Analysis (PCA) and Hierarchical Cluster Analysis (HCA) were performed. Native corn kernel flour (NCKF) demonstrated higher protein and fat content compared to white hybrid corn flour (WHF). While both flours showed similar pH, titratable acidity, and water activity levels, NCKF exhibited higher total soluble solids. Additionally, NCKF showed superior techno-functional properties, including water solubility, water absorption index, swelling power, emulsifying capacity, and foaming capacity, while its oil absorption index was comparable to that of WHF. Moreover, NCKF contained higher levels of bioactive compounds, such as soluble phenols, condensed tannins, flavonoids, anthocyanins, and carotenoids, along with enhanced antioxidant properties, as measured by FRAP, DPPH, and ABTS assays. FTIR analysis revealed that all NCKF samples exhibited patterns similar to those of WHF with differences in transmittance intensities. Notably, spectral differences were identified by PCA, while HCA demonstrated that corn flours exhibited similitudes and differences among them, which can be categorized into four groups based on their nutritional, physicochemical, and technological–functional properties, as well as antioxidant compound contents. Overall, the evaluated corn flours displayed nutritional, physicochemical, techno-functional, and antioxidant properties for the potential development of functional or nutraceutical food and beverage products.

1. Introduction

Maize (Zea mays) is a member of the Gramineae (Poaceae), originated in Mexico, and is cultivated worldwide [1,2]. In terms of production and significance for human consumption, maize ranks as one of the most vital crops worldwide. Beyond its role in human nutrition, maize serves as a crucial component in animal feed production and various industrial applications, including biodiesel, high-fructose corn syrup, and natural pigments [3]. Mexico is the seventh largest corn producer worldwide, with maize essential in the Mexican daily diet and the main pillar of the country’s food sovereignty [4,5]. In 2022, a total of approximately 21,888,517 tons of maize were cultivated over 7.3 million hectares, with 0.5% of this area allocated to pigmented maize [6]. In the highlands of Jalisco, pigmented maize accounted for 0.04% of the total maize cultivation [7]. Maize is consumed as a fresh product (cooked corn cob), processed food (tortillas, tamales, gorditas, tlayudas, and sweet kernel corn), beverage (atole, champurrado, or tejuino), among others [8,9]. Additionally, it can be utilized as fresh masa and flour as an ingredient for manufacturing other food products (often bakery products). Yellow and white hybrid corn varieties are extensively employed at industrial scales due to their higher production yields [10,11]. Conversely, Mexico significantly contributes to the diversity of pigmented maize cultivars, with 68 out of the 350 cultivars reported in the Americas and recognized by Mexican authorities [12]. These native cultivars exhibit various kernel colors such as red, pink, yellow, white, blue, purple, and black. The primary limitation of these native corn genotypes for industrial use is their low production yields; thus, they are predominantly cultivated and consumed within local communities [13,14,15]. Consequently, in 2020, the government enacted federal legislation aimed at promoting and protecting native maize [16].
In addition to its nutritional benefits such as providing proteins, fats, and carbohydrates, native corn kernels contain valuable phytochemicals, including phenolic acids, flavonoids, anthocyanins, and carotenes [17]. These compounds are associated with a reduced risk of various chronic non-communicable diseases, such as obesity, diabetes, hypertension, and cancer [18]. Given these properties, native corn kernels hold significant potential for food applications, particularly in their powdered or flour form, for the development of functional and nutraceutical foods and beverages. The success of industrial processing and food applications using corn-based flours depends on their physicochemical properties (pH, color, total soluble solids, water activity, and titratable acidity) and functional properties (foaming capacity, solubility, emulsifying ability, and water and oil absorption) [19]. Evaluating these properties is essential for determining their potential applications in the food industry [20], as they play a critical role in shaping the characteristics and quality of new food products [21]. Additionally, the structural properties of pigmented corn powder have been investigated by spectroscopic analysis, particularly FTIR studies [22].
Diverse studies have reported that pigmented corn kernel-based flour, particularly darker colors, is a significant source of nutrients and bioactive molecules, which exhibit suitable properties for making functional foods [21,23,24,25,26,27]. Currently, the use of native maize in the food industry faces two major problems: the lack of knowledge about its physicochemical, nutritional, and technological–functional properties and the loss of local genotypes by their substitution with modern/hybrid cultivars or more profitable crops [13].
This study aimed to compare the nutritional (protein, fat, carbohydrate, ash, moisture, crude fiber, and starch contents), physicochemical (color parameters, activity water, total soluble solids, pH, titratable acidity), techno-functional (water solubility, oil and water absorption capacities, foaming and emulsifying capacities), and structural (FTIR analysis) properties, as well as bioactive compound (soluble phenols, flavonoids, anthocyanins, and β-carotene) content and antioxidant activity (DPPH, ABTS, and FRAP) of nine native Mexican native corn kernel flours with potential food industrial applications.

2. Materials and Methods

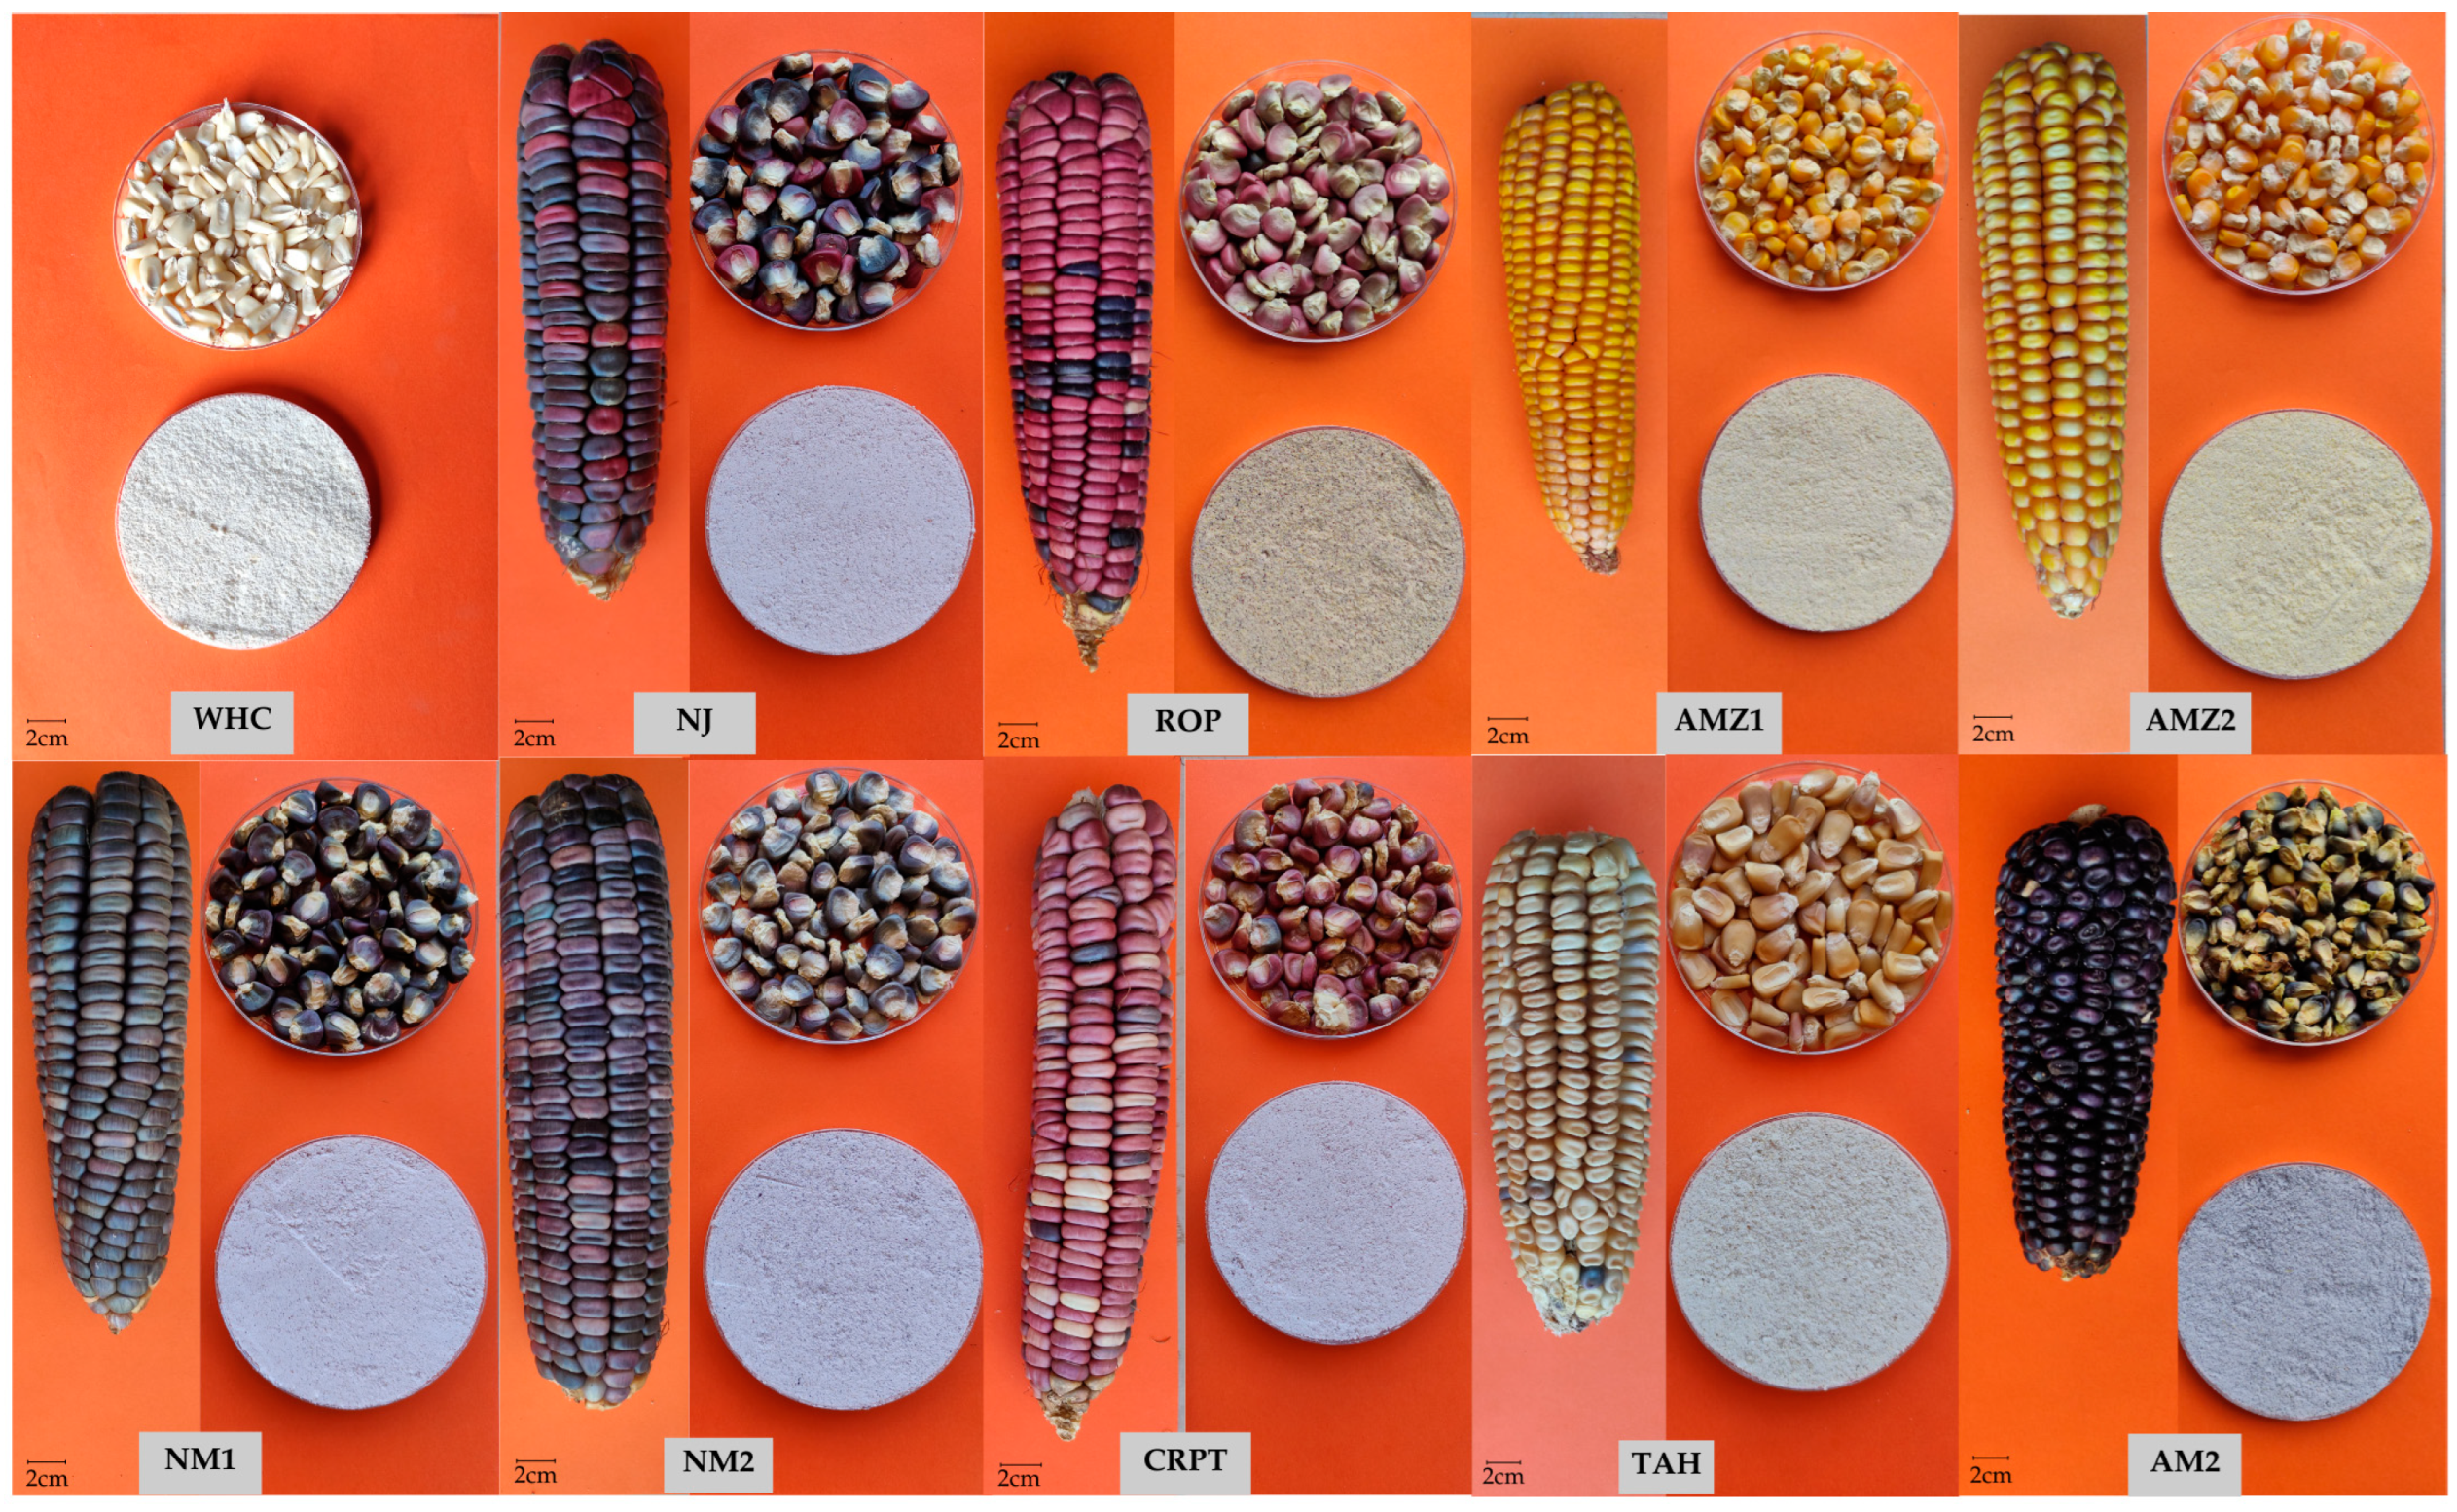
2.1. Maize Collection

Nine native maize accessions were investigated (Table 1). Grains were donated by local producers and subsequently cultivated at the Campo Experimental Centro Altos de Jalisco from the Institute of Forestry and Livestock Research, located in Tepatitlan de Morelos, Jalisco, Mexico (102°43′50″ W, 20°52′57″ N; altitude, 1927 m.a.s.l.), during the 2024–2025 season (160 to 190 days from planting to threshing). The area is characterized by a sub-humid warm climate (1927 m.a.s.l.), luvisol and phaeozem soil, ≤18 °C annual temperature (average), and 860 mm precipitation from June to October [28]. Manual sowing was conducted at 60,000 seeds/ha−1 (June 2022). Inorganic urea (300 kg of nitrogen per hectare) and diammonium phosphate (150 kg per hectare) were applied at sowing, followed by a second urea application (45 kg) during the V5 vegetative stage. Weed control was managed with Primagram Gold (atrazine + S-methachlor, Syngenta, Budapest, Hungary) at 5 L/ha−1, and root pests were controlled with Force TM 1.5G (Tefluthrin, Syngenta, Budapest, Hungary) at 10 kg/ha−1. The cobs were collected after being sun-dried from a field of 1-hactare. Enough cobs for each maize accession were randomly selected to yield 1000 g of corn kernels [29], as listed in Table 1. The corn samples were transported to the Biotechnological Process Innovation Laboratory from Centro Universitario de Los Altos of the University of Guadalajara (20°50′50″ N, 102°47′00″ O). Then, the corn kernels were air-dried in a convective drying oven (LUZEREN®, DGH9070A, ISSE LABS S. A de C. V., Mexico City, Mexico) at 40 °C for 24 h and pulverized in a rotary impact mill (Retsch, SR300, Haan, Germany), and sieved to 0.075 mm (mesh #200, GB/T60003.1-2012). The resulting flour was divided into three batches (330 g each), placed in hermetic bags, and stored in the dark at room temperature before analysis. Laboratory analyses were performed over the subsequent two weeks. Commercial white hybrid corn flour (P3051W, Pioneer, Bunkyo City, Tokyo) was used as a control.
Figure 1 shows the visual appearance of maize grains and corn kernel fours used in this study.

2.2. Nutritional Composition

Moisture (gravimetry), protein (Kjeldahl), fat (Soxhlet), and ash (muffle calcination) of corn kernel flour samples were determined according to AOAC standard methods [30]. Additionally, the carbohydrate content was estimated by difference [31]. The content of starch was determined using an FT-NIR spectroscopy (FOSS, DS2500, Hillerod, Denmark) coupled with a calibration curve (R2: 0.82), previously calibrated and validated with corn samples from the location. The nutritional composition was presented as a percentage, and the energy value was determined using Equation (1), as recommended [31].
Energy   value   ( Kcal / 100   g ) = 4   × %   carbohydrates + 4   × %   portein + 9   × %   fat

2.3. Physicochemical Parameters

Total soluble solids (°Brix) were quantified using an ATAGO digital refractometer (PAL87S, Atago Co., Ltd., Tokyo, Japan), following the standard procedure (method 932.12, [30]). A HANNA pH meter (HI 207, Bedford, UK) was used to assess the pH levels. Titratable acidity was measured by combining the corn sample (5 g) with distilled water (dH2O, 50 mL), following the AOAC methodology [30], using 1% w/v phenolphthalein and 0.1 N NaOH; the results were presented as a percentage of malic acid. Activity water (Aw) measurements were obtained using a piece of portable equipment (VTSYIQI, VTS160A, Hefei, China), following the specifications of the manufacturer. The color parameters were analyzed on a CIELab* scale (L*, a*, and b*) using a portable FRU colorimeter (WR10QC, ShenZhen Wave Optoelectronics Technology Co., Ltd. Shenzhen, China). Finally, to generate the reference color squares, L*, a, and b* scores were processed using a converter tool (http://colormine.org/color-converter, accessed on 7 April 2022).

2.4. Technological–Functional Properties

The WSI (water solubility index) was measured employing a modified method described by [32]. The process involved mixing corn kernel flour (2.5 g) with dH2O (30 mL) in a conical tube. This mixture was then homogenized in a vortex (1 min) and placed in a water bath (30 °C/30 min) with continuous agitation (80 rpm). Following this, the mixture was centrifuged (6000 rpm for 10 min) and the supernatant was recovered and evaporated (110 °C for 24 h), with results presented as percentages (Equation (2)). The WAI (water absorption index) was determined by calculating the mass difference in the sample before and after centrifugation and evaporation (Equation (3)), with results expressed as the amount of water absorbed per unit of dry sample (g g−1).
WSI   ( % ) = Weight   of   pellet   after   centriguation Weight   of   sample × 100
WAI = Weight   of   the   pellet   after   centriguation weight   of   the   sample -   ( weight   of   the   peller   after   evaporation )
The oil absorption capacity (OAC) was determined by mixing corn kernel flour (2.5 g) and corn oil (30 mL) in a conical tube. After homogenizing in a vortex (1 min) and centrifuging (60 min at 10,000 rpm), the oil supernatant was carefully discarded, and the weight of the resulting pellet was measured. OAC was calculated based on the difference in weight, with results informed as the amount of oil absorbed per unit of dry sample (g g−1) [33].
To assess the swelling power (SP), corn kernel powder (100 mg) was mixed with dH2O (10 mL) in a conical tube and heated in a water bath (60 °C for 30 min). After cooling to room temperature, the mixture was centrifuged (3000 rpm for 30 min) [34]. SP was presented as a percentage (Equation (4)), with calculations considering the adjusted sample moisture content.
Swelling   power   % = weight   of   the   gel weight   of   the   sample   with   moisture   corrected   × 100
Emulsifying capacity was determined according to the methodology outlined in [35]. In a conical tube, corn kernel flour (2 g), dH2O (20 mL), and canola oil (20 mL) were mixed and homogenized at 70 rpm (20 min). Subsequently, the tubes were centrifuged at 10,000 rpm (10 min). The height of the formed emulsion was measured using a digital vernier caliper, and the results were presented as percentages (Equation (5)).
Emulsifying   activity   ( % ) = Height   of   emulsified layer Height   of   whole   layer   in   the   centrifugal   tube     × 100
Foaming capacity was determined following the methodology outlined in [36]. A conical tube was used to mix 1% (w/v) corn kernel flour with dH2O, which was then homogenized in a vortex (60 s). Next, the mixture was processed in a high-speed homogenizer (LANKAI, FSH-2A, Wuhan Baykul Electronic Commerce Co., Ltd. Wuhan, China) at 12,500× g (60 s) at room temperature. Finally, the height of the resulting foam was measured with a digital Vernier caliper, and the results were presented as a percentage (Equation (6)).
Foam ing   capacity   ( % ) = Height   of   the   solution   after   homogenization   ( mm ) Height   of   the   solution   before   homogenization   ( mm )   Height   of   the   solution   before   homogenization   ( mm )   ×   100

2.5. Bioactive Compounds

A methanolic-water extraction was conducted to quantify soluble phenols, flavonoids, anthocyanins, condensed tannins, and antioxidant activity using FRAP, ABTS, and DPPH assays [37]. In a conical Falcon tube, 500 mg of corn kernel powder was mixed with 10 mL of a methanol-acidified water solution (80:20 v/v) containing 2% v/v hydrochloric acid (2 M). The mixture was then subjected to orbital shaking (JOANLAB, RML 80 Pro, Zhengzhou, China) at 80 rpm for 60 min at room temperature. Following extraction, the sample was centrifuged at 4 °C at 8000× g for 10 min. The resulting supernatants were collected and stored at −20 °C for further analysis. All determinations were carried out using an ACCURIS microplate reader (SmartReader MR-9600, Accuris Instruments, Nanjing, China).

2.5.1. Soluble Phenols

A mixture containing 0.012 mL of corn kernel flour extract, 0.012 mL of Folin–Ciocalteu solution (Sigma-Aldrich, Merck Group, St. Louis, MO, USA) at 2N, 0.116 mL of Na2CO3 at 7.5% w/v, and finally 0.164 mL of dH2O was placed in a test tube and left to incubate in the dark (15 min). Subsequently, 0.2 mL of this combination was transferred to a 96-well plate, and a plate reader was used to determine its absorbance at 750 nm [38]. A gallic acid (Sigma-Aldrich, USA) calibration curve from 0.0125 to 1 mg/mL (R2 = 0.998) was used to quantify the results, which were then represented as milligrams of gallic acid equivalents per gram of dry sample (mg GAE/g).

2.5.2. Flavonoids

In a test tube, 0.43 mL of a sodium nitrate solution (Sigma-Aldrich, USA) at 5% w/v was put in a conical tube and combined with 0.1 mL of corn kernel flour extract, after it was mixed and incubated for 5 min. Subsequently, 0.030 mL of 10% aluminum chloride (Golden-Bell reagents, Materiales y Abastos Especializados, Naucalpan de Juarez, Mexico) was added and incubated for an additional minute. Then, 0.44 mL of sodium hydroxide (NaOH 1 M) was added and homogenized using a vortex mixer. Subsequently, 0.2 mL of this combination was transferred to a 96-well plate, and a plate reader was used to determine its absorbance at 490 nm [39]. A calibration curve from 0.0125 to 1 mg/mL (R2 = 0.999) was constructed using quercetin (Sigma-Aldrich, USA), and the results were expressed as milligram equivalents of quercetin per gram of dry extract (mg QE/g).

2.5.3. Total Anthocyanins

The total anthocyanin content (TAC) was determined using the pH differential method. The procedure involved diluting the extract in a 1:9 ratio into sodium acetate buffer (0.4 M at pH 4.5), and potassium chloride buffer (0.025 M at pH 1). Following dilution, 0.2 mL of each reaction mixture was transferred to a 96-well plate. The samples were analyzed at absorbance wavelengths of 700 and 520 nm utilizing a microplate reader. The TAC was expressed as cyanidin-3-glucoside per gram (C3G/g), based on the molecular weight (449.2 g/mol) and molar extinction coefficient (26,900 L cm⁻1 mg⁻1) of C3G [40].

2.5.4. Condensed Tannins

Condensed tannins were quantified using the vanillin–HCl method [41]. Briefly, 1 mL of vanillin solution (4% w/v in methanol, Sigma-Aldrich, USA) was mixed with 0.133 mL of the extract sample and 0.5 mL of concentrated hydrochloric acid (Jalmek, Jalmek Científica S.A. de C.V., San Nicolas de los Garza, Mexico). The mixture was vortexed for 30 s and then incubated in the dark at 30 °C for 15 min. After incubation, 0.2 mL of the mixture was transferred to a 96-well plate, and absorbance was measured at 500 nm using a plate reader. A calibration curve from 0.0125 to 1 mg/mL (R2 = 0.998) was constructed using catechin (Sigma-Aldrich, USA) as the standard. The results are expressed as milligrams of catechin equivalents per gram of sample (mg CE/g).

2.5.5. Total Carotenoids

The methodology outlined in [42] was employed to determine total carotenoid content. A mixture of corn flour (2 g), acetone/petroleum ether (80:20 v/v) solution (7 mL), and MgCO3 (0.5 g) was homogenized (60 s) and cold centrifuged (4 °C) for 30 min at 15,000 rpm. Subsequently, the recovered supernatant was combined with 20% NaCl solution (15 mL) in a separator funnel. The aqueous phase was discarded, and the organic layer was diluted with 10 mL of petroleum ether (Jalmek, Mexico) solution. Later, 0.2 mL of this combination was transferred to a 96-well plate, and a plate reader was used to determine its absorbance at 448 nm. The results were expressed as milligrams of β-carotene per gram of corn flour, based on a standard curve generated with β-carotene from 10 to 100 µg/mL (Sigma Aldrich).

2.6. Antioxidant Activity

2.6.1. Radical DPPH Scavenging Assay

To determine DPPH• radical scavenging activity, in a 96-well plate, 0.260 mL of DPPH solution (Sigma Aldrich, USA) at 190 mM was blended with 0.04 mL of extract and incubated under agitation (200 rpm) for 30 min (in darkness). Subsequently, the absorbance was recorded at 517 nm in a plate reader. The Trolox standard (Sigma-Aldrich, USA) was used to create a calibration curve from 40 to 600 µmol/mL (R2 = 0.992), and the findings were reported as millimole Trolox equivalent per gram (mmol TE/g) [43].

2.6.2. ABTS• + Radical Scavenging Assay

To measure the ABTS• + radical scavenging activity, 0.035 mL of extract was combined with 0.265 mL of 2,2-azino-bis-(3-ethyl-benzotiazoline-6-sulfonic acid) (Sigma Aldrich, USA) solution at 7 mM in a 96-well plate. Then, the mixture was incubated for 10 min in dark conditions with agitation (200 rpm). The absorbance was read at 734 nm in a plate reader. A calibration curve (R2 = 0.999) was constructed with the Trolox standard from 40 to 600 µmol/mL (Sigma-Aldrich, USA), and the results were reported as millimole Trolox equivalent per gram (mmol TE/g) [44].

2.6.3. Ferric Reducing Antioxidant Power (FRAP)

To conduct the FRAP assay, 0.036 mL of extract, 0.264 mL of FRAP solution, and 0.009 mL of dH2O were added to combine in a tube. This mixture was shaken (200 rpm) in the dark (30 min). Then, the absorbance (595 nm) was measured in a plate reader after 0.2 mL of the mixture was added to a 96-well plate. A calibration curve (R2 = 0.997) was constructed using a Trolox standard from 40 to 600 µmol/mL (Sigma-Aldrich, USA), and millimole Trolox equivalent per gram (mmol TE/g) was used to express the results [45]. The FRAP solution contained acetate buffer (0.3 M, pH 3.6), FeCl3 (20 mM), and TPTZ (10 mM) in 10:1:1: v/v ratio.

2.7. FTIR Analysis

The structural analysis of corn kernel flours was performed through FTIR analysis. An FTIR spectrometer (Agilent) was used to record the FTIR spectra for the maize-based flours at room temperature using ATR (attenuated total reflectance). The spectrum was recorded at wavelengths ranging from 4000 to 450 cm−1 with 24 scans and a resolution of 2 cm−1 [46].

2.8. Statistical Analysis

Data were collected from three independent experiments (n = 3) performed in triplicate and are reported as mean ± standard deviation. Before statistical analysis, normality and homoscedasticity were evaluated using the Kolmogorov–Smirnov and Levene’s tests, respectively (p > 0.05). A one-way analysis of variance (ANOVA) followed by Fisher’s Least Significant Difference (LSD) test (for mean comparisons, p < 0.05) was applied to analyze pH values, total soluble solids, luminosity (L*), a*, b* color parameters, protein, fat, emulsifying capacity, swelling power, foaming capacity, and total soluble phenols. For variables such as titratable acidity, water activity, moisture, ash content, starch content, solubility water index, water absorption index, oil absorption index, total flavonoids, total anthocyanins, condensed tannins, total carotenoids, and antioxidant activities (DPPH, ABTS, and FRAP), non-parametric Kruskal–Wallis tests were used. Multiple comparisons of mean ranks were performed for all groups (p < 0.05). Principal Component Analysis was conducted utilizing the raw data obtained from FTIR studies. Additionally, Hierarchical Cluster Analysis was executed using data from nutritional, physicochemical, and technological–functional properties and antioxidant compounds. All statistical analyses were conducted using Statistica software (v. 10, StatSoft®, Tulsa, OK, USA).

3. Results and Discussions

3.1. Nutritional Composition of Corn Kernel Flour Samples

The nutritional composition of corn kernel flour is essential due to its significance in the human diet and its potential applications in food manufacturing. The nutritional profiles of the nine native Mexican corn kernel powders are presented in Table 2. Significant differences (p < 0.05) were observed across all evaluated parameters, reflecting both intra-and inter-varietal variations among the corn flours [47].
The moisture levels of the corn flour samples ranged from 8.28 to 10.52% (p ˂ 0.05), similar to that reported in the literature for Mexican and Indian native corn kernel flours (7.0–9.80%) [21,29,48]. Furthermore, these moisture contents are lower than those documented for Brazilian corn landrace kernels (10.29 to 11.45%) [49], Chinese maize varieties (10.40 to 10.77%) [50], and corn kernels from the USA (6 to 11%) [51]. It was recommended that the moisture of maize-based flours should not exceed 14% [31] because this enhances their shelf-life stability and reduces the probability of spoilage by microbial growth during storage [52].
Regarding protein content, the native corn kernel-based flours demonstrated higher protein content (9.20–10.96%) than white hybrid corn kernel flour (8.65%); nonetheless, the AZ1 corn kernel flour exhibited the highest protein content (p ˂ 0.05). This finding aligns with previous research on Mexican accessions, which reported higher protein contents in blue corn flour (9.1%) compared to white corn flour (8.4%) [29]. Comparable protein values have been reported for white (8.55–9.1%), yellow (8.29–11%), red (8.5–10.3%), blue (12.2%), and purple (9.53–9.88%) native pigmented corn kernel flours from Serbia and India accessions [47,53,54]. In Brazilian corn flour from seven different corn landraces, the protein content was reported to a range from 7.04 to 11.59% [34]. Additionally, other Brazilian corn landraces have demonstrated an average protein content of 11.4% [49]. In contrast, corn flour from China was reported to contain a protein content ranging from 8.49 to 8.56% [55], while three Chinese maize varieties exhibiting protein content between 9.13 and 9.78% [50] was reported. Furthermore, the protein content of native pigmented corn kernel flours falls within the range recommended by international food standards (6–15%) [56].
Fat content in native Mexican corn kernel flours ranged from 3.38 to 4.37%; almost all flours exhibited higher fat content than white hybrid flour (3.78%), except for AZ1 (3.76%), NM1 (3.74%), and AM2 (3.38%), which were closely related to white hybrid flour (p ˂ 0.05). These values are in agreement with native corn kernel powders from Mexico, India, and Turkey; moreover, it was determined that pigmented corn flours contain a higher fat content than white corn flours [29,32,47,52]. In corn flour derived from native Brazilian genotypes, lipid content was reported to range from 3.10% to 5.53%, whereas Chinese corn varieties exhibit lipid content values ranging from 3.92% to 4%. Additionally, a fat content of 1–5% was documented in five native corn varieties from the USA [51]. However, the fat content values obtained in this study were lower than the 9% recommended by international food standards for cereal-based flours [56].
Carbohydrates constitute the primary macronutrient in corn-based products, with the carbohydrate content in native Mexican corn kernel flour ranging from 74.71 to 76.56% (p ˂ 0.05), comparable to that of white hybrid corn flour (76.39%). These findings agree with previous reports for blue (61.3%), red (69.1%), yellow (77.85%), dark purple (74.66%), blue (84.17%), and white (72.07%) corn kernel flours from Mexico, India, Côte d’Ivoire, and Serbia [21,48,53,57]. In blue and yellow corn kernels from the USA, a carbohydrate content ranging from 78 to 82% was reported [58]. Furthermore, the carbohydrate content of native Mexican corn kernel flours aligns with the range recommended by international food standards (70–75%) [56]. However, the main component of corn carbohydrates is starch [47]. Starch is a polysaccharide derived from various raw materials including corn kernels and possesses potential for industrial applications. It is extensively utilized as an additive in food products [58]. Starch content in native corn kernel flours ranged from 51.41 to 63.19% (p ˂ 0.05), wherein NJ (62.29%), AZ2 (63.19%), NM1 (61.54%), and NM2 (63.07%) exhibit starch content comparable to that of white hybrid corn kernel flour (63.07%); in contrast, the lowest starch content was observed in AM2 (51.41%). Comparable starch contents were reported (58.07–71.54%) for fifteen native Mexican corn flours of blue color [59]. A total starch content of 63.94% in blue corn flour (Turkey) [52], 45.81% in white corn flour (India) [48], 67.27% in yellow corn flour, 64.43% in dark purple corn flour, and 64.86% in purple red corn flour (Côte d’Ivoire) [57] was documented. In 20 Brazilian corn landraces, a total starch content ranging from 54 to 67% was documented [50]. The starch content in corn kernel flour is important because most physicochemical and technological–functional properties of corn-based flours that are appreciated for food applications are influenced by the starch content [60]. In this context, native Mexican corn kernel flour could serve as a potential starch source.
Additionally, the pigmented corn kernel flour showed higher (p ˂ 0.05) ash content (2.43–3.48%) than white hybrid corn kernel flour (2.29%); moreover, AM2 had the highest ash content. These values are similar to those reported in white (1.33–1.99%), yellow (2.0–3.17%), red (2.74–3.53%), purple (2.13%), dark purple (1.89%), and blue (1.1%) corn-based flours from Indian, Côte d’Ivoire, Mexican, and Serbian accessions [29,47,54,57]. Moreover, the ash content is higher than of corn varieties from China (1.96–2.11%) and Brazil (1.42–1.55%) [49,50]. This parameter is important because it provides insight into the quantity of essential minerals present within corn-based flour, which is related to agronomic conditions [47,52].
In many countries worldwide, cereals are a primary component of the human diet and serve as a significant source of energy. The energy values of native Mexican corn kernel flour ranged from 370.02 to 383.89 Kcal/100 g, which are comparable to or higher than those of white hybrid corn flour (374.18 Kcal/100 g). Similar energy values have been reported for yellow (380.24 Kcal), white (367.91 Kcal), dark purple (380.66 Kcal), purple-red (384.04 Kcal), and blue and yellow (380–400 Kcal) corn kernel flours from Côte d’Ivoire, Cameroon, and the USA [27,50,51]. Based on these findings, the nutritional composition of native Mexican corn kernel flour makes it well suited for the development of potentially functional and gluten-free food products.

3.2. Physicochemical Properties of Corn Kernel Flour Samples

The functional characteristics and potential uses of corn-based flours are greatly affected by their physicochemical attributes. Table 3 lists the physicochemical properties of the white hybrid and native Mexican corn kernel flours. The pH and TA of white hybrid corn flour were 6.13 and 0.43% malic acid, respectively, which exhibited differences (p ˂ 0.05) in comparison to native corn flours that demonstrated pH values ranging from 6.13 to 6.38, while TA ranged from 0.23 to 0.68% malic acid (p ˂ 0.05). Previous research has reported pH and TA values of 6.15–6.34 and 0.13–0.30%, respectively, in blue corn flour derived from Peruvian native maize [26]. Similarly, Mutlu et al. [57] reported that Turkish blue corn flour exhibited a pH value of 6.45 and TA of 0.69%. pH and TA are associated with the presence of organic acids in foods; however, these parameters can be utilized as indicators of flour quality because alterations in these parameters may be associated with microbial growth [61].
Total soluble solids (TSS) represent the amount of soluble sugars in foods. Most of the native Mexican corn kernel flours (except for AZ2 and NM1) exhibited higher TSS (p ˂ 0.05) values (1.17–2.00 °Brix) than white hybrid corn flour (0.77 °Brix). These TSS values are comparable to or even higher than those found in Colombian corn-based flour (1.30 °Brix) [62]. Moreover, it was reported that some white hybrid corns from South Africa showed low TSS values (0.2 °Brix) [21]. Furthermore, low TSS values in corn flour may be associated with longer storage time of the grain, in which the TSS concentration may decrease due to its conversion to starch, or it may be used in grain respiration [63].
Water activity is crucial in the food industry, particularly cereal-based flour. Low levels can inhibit microorganism growth and control enzymatic and non-enzymatic reactions linked to food spoilage during storage. The water activity of native corn kernel flour ranged from 0.41 to 0.48 (p ˂ 0.05), which was lower than white hybrid corn flour (0.56). These results align with those reported for Turkey’s blue corn flour (aw = 0.44) [52]. Furthermore, Aw values of 0.34 have been reported in five pigmented native corn flour samples from Peru [26]. Nonetheless, García-Campos et al. [64] reported an Aw of 0.7 in two red and blue native corn powders from the Altiplano of Mexico, where the differences between the results may be attributable to the sample processing and/or storage conditions.
For its part, the color of corn kernel flour is considered a quality indicator, primarily from a commercial perspective, as it can potentially enhance the sensory attributes of food products made from corn [23]. The color parameters (luminosity, a*, and b*) are listed in Table 4. In general, all corn kernel flour samples showed differences (p ˂ 0.05) for all color attributes. The luminosity values ranged from 74.57 to 90.80, while a* ranged from −0.65 to 3.31, and b* from 2.47 to 32.79. The color of corn flour depends on the accumulation of pigments or secondary metabolites which, in turn, depend on genetic characteristics and agronomic practices [23,52,53]. A study on 15 pigmented native maize accessions cultivated in northeast Mexico (Nuevo Leon state) reported luminosity values ranging from 25.13 to 63.64, a* from 2.41 to 33.58, and b* from 14.36 to 72.05 [65]. Treham et al. [47] reported color differences in maize accessions from white, yellow, and brownish-purple colors. Additionally, it has been reported that the color of flour differs from that of the grain. This discrepancy is attributed to the concentration of color-related compounds primarily in the pericarp, while flour is produced using the entire grain. This process may affect the content of bioactive compounds in the flour and result in the color differences [64], as shown in the color square presented in Table 4.
It must be mentioned that some authors have reported that the physicochemical properties of cereal-based flours, particularly those derived from corn kernels, are significantly influenced by corn kernel hardness, particle size, and pasting properties (peak viscosity, hot paste viscosity, breakdown, final viscosity, setback, pasting temperature, and peak time) [66,67].

3.3. Technological–Functional Properties of Corn Kernel Flour Samples

The functional properties of corn-based flours determine their potential use as food additives [56]. The techno-functional properties of native Mexican corn kernel flours are given in Table 5. In general, all evaluated parameters showed differences (p ˂ 0.05) between samples. Among functional properties, WSI, WAI, and swelling power are related to the interaction of starch and proteins, which significantly influences the quality of corn-based flours [60].
The WSI of all corn kernel samples ranged from 5.43 to 7.41% (p ˂ 0.05), with the highest value observed in white hybrid corn flour and the lowest in AM2 flour. Diverse native corn-based flours from Colombia, Mexico, India, Brazil, and China exhibited WSI values ranging from 0.92 to 20.24% [21,34,55,58,68]. A higher WSI value enhances the stickiness and adhesiveness of baking products. The observed differences can be attributed to the structural and morphological characteristics of the starch granules and the presence of other compounds such as proteins and fibers [21,68]. In corn-based flours, WSI is typically associated with starch degradation and the release of soluble molecules [24].
The WAI of corn kernel flours ranged from 2.09 to 3.29 g g−1 (p ˂ 0.05). Comparable patterns have been reported in a variety of native corn kernel flours from Colombia, Mexico, and India, including blue (2.88 g g−1), white (1.04–2.45 g g−1), and yellow (1.91–2.94 g g−1) colors, which is typical for native corn starches [21,48,60,68]. WAI is associated with starch integrity in the presence of water, indicating that higher WAI values correspond to a greater degree of starch gelatinization [48,59].
Regarding swelling power (SP), most native corn kernel flours (except for NM2: 3.58% and AM2: 3.96%) exhibited higher values (4.69–9.33%) than white hybrid corn kernel flour (5.03%) (p ˂ 0.05). The observed patterns align with those documented in previous studies examining native Chinese corn kernel flours [60]. Additionally, SP values for ten native Brazilian corn flours have been reported to range from 8.89 to 13.14% [34]. The hydration characteristics of corn-based flour may be influenced by proteins, with polar amino acids serving as the primary sites for water–protein interactions [48,60]. Higher WAI and SP values are advantageous in the bakery industry because they facilitate the incorporation of a greater volume of water in the preparations, thus improving the kneading process and extending the freshness of the final product [21].
Additionally, the oil absorption index (OAI) of native corn kernel flour ranged from 4.70 to 5.41 g g−1, with AZ2 exhibiting similar OAI values to white hybrid corn flour. These values exceed those reported in blue corn flour (2.34 g g−1) and white corn flour (0.84 g g−1) from Chinese and Mexican accessions [21,60]. OAI is dependent on the concentration of protein, fiber, and starch; however, in native corn, oil absorption capacity is influenced by the amylose/amylopectin ratio and the extent of its chains [69]. Native corn-based flour may be advantageous in food formulations where an enhancement in oil absorption capacity is desired [70], particularly in meat- and bakery-based products and fried foods, potentially improving flavor and mouthfeel [21].
Regarding emulsifying capacity (EC), most native corn kernel flours (1.44–3.11%) exhibited lower EC values than white hybrid corn flour (2.97%), except for AM2 (3.12%) and ROP (3.17%), which showed higher EC values. These values exceed those reported for Mexican blue corn flour (2.25%) and blends of blue corn–sweet potato flour (0.86–2.06%); however, they are lower than those for blends of corn–wheat flour (11.19–16.75%) [21]. EC is related to the capacity of proteins to stabilize the oil–water interface due to the hydrophobic character of their chains and depends on the oil/protein ratio in the system [70], as well as to the fiber content that contributes to the stability of the emulsion by increasing the system’s viscosity [21,68]. EC is of interest for its applications in the food industry, especially in the manufacture of products that require a high emulsification capacity, such as soups, instant beverages, and frozen desserts [70].
The foaming capacity (FC) of various raw materials is significant in food preparation as it contributes to maintaining the structure before and after the processing of products such as ice cream and bakery items. In this context, the majority of native corn kernel flours (except for Negro Jalisco and Azúl México 2) exhibited higher FC (7.03–16.70%) than hybrid corn flour (6.31%). These values vary according to the food matrix; in corn flour from Mexico and Pakistan, FC values of 13.78–29.96% have been reported. However, the FC values may decrease when combined with other food matrices such as sweet potato or wheat flour [21,70]. FC depends on the protein content of the flours, which can reduce water surface tension by acting as surfactants [71]; additionally, the solubility of the samples plays a significant role in this parameter [21]. According to Keramaris et al. [72], the FC of corn flour can be influenced by sample processing, particularly when subjected to thermal treatment [21].

3.4. Bioactive Compounds of Corn Kernel Flour Samples

The content of soluble phenols (TSPs), flavonoids, anthocyanins, condensed tannins, and carotenoids of white and native corn kernel powder are listed in Table 6. All samples showed differences (p ˂ 0.05) for all evaluated parameters.
Native corn kernel flour is characterized by the presence of bioactive compounds that are mainly associated with its kernel color. However, the concentration of these compounds is influenced by various factors, including genotype, kernel color, location of these compounds into the grain, agricultural practices, light, oxygen, temperature, processing factors, storing conditions, among others [25]. The TSP (15.66 to 38.76 mg GAE/g) content of native corn kernel flour is higher than white hybrid flour (10.02 mg GAE/g), where the AM2 exhibited the highest TSP content. Hernández-Santos et al. [21] reported a TSP content of 38.03 mg GAE/g in blue corn kernel flour. It was reported that blue corn flour contains higher phenol content than white corn flour [29]. A phenolic content of 3.07 mg/g in blue corn kernel powder was determined [25]. In native Peruvian corn kernel flours, it was reported that the values range from 3.95 to 8.17 mg/g, depending on the color of the corn source [73]. TSP values of 3.04 to 5.77 mg/g have been reported in Serbian corn kernel flours [74]. Tannins are a class of polyphenols that contribute to the antioxidant properties of foods [37]. The condensed tannin (CT) contents of white and native Mexican corn kernel flours ranged from 0.30 to 2.83 mg CE/g (p ˂ 0.05), where CRTP exhibited the highest CT content. It was reported that tannin contents ranged from 0.09 to 0.11 mg/g in corn flour from Nigeria [75]. Moreover, in nixtamalized corn flour, values were up to 0.33 mg/g [76]. The flavonoid content of native corn kernel flour ranged from 10.65 to 20.86 mg CE/g, significantly higher than that of white hybrid corn kernel flour, which contained 2.56 mg CE/g. Among the native accessions, ROP exhibited the highest FLA content. Hernández-Santos et al. [21] reported an even higher FLA content of 43.12 mg CE/g in Mexican blue corn kernel flour. In comparison, flavonoid values ranging from 0.094 to 0.24 mg CE/g have been reported in dark red and blue corn flours from Serbia [55].
Anthocyanins are typically associated with the red to purple coloration of corn kernels. In this study, total anthocyanins were detected in the NM2 (0.04 mg C3G/g) and AM2 (0.10 mg C3G/g) samples. According to the analytical protocol employed, no anthocyanins were detected in the WHC, NJ, ROP, AZ1, AZ2, NM1, CRPT, and TAH samples, which exhibited a variety of grain colors, including white, red, purple, yellow, blue, gray, and brown (Figure 1). Previous studies have reported that the color of corn flour may differ from that of the whole grain, potentially affecting the content of bioactive compounds [65]. Similar trends have previously been observed, with no anthocyanins detected in white corn flour, whereas blue corn flour exhibited a content of 0.02 mg C3G/g. This difference is attributed to the anthocyanins being responsible for the blue-red coloration in foods [29]. Suriano et al. [77] reported that anthocyanin content varies with maize color, where purple maize contains higher levels (0.78 mg/g) compared to blue (0.21 mg/g) and red (0.03 mg/g) colors; however, they did not report the presence of anthocyanins in yellow maize. Nikolic et al. [47] found that blue corn contains more anthocyanins (0.91 mg/g) than red corn (0.025 mg/g), while no anthocyanins were detected in white and yellow samples. It was indicated that the anthocyanin content is influenced by the maize genotype, color intensity, and the specific location of these compounds within the grain, such as the starchy endosperm, pericarp, and aleurone layers, as well as the stage of grains ripening [29,78]. Colombo et al. [28] reported that anthocyanins are primarily located in the pericarp of red and black corn kernels, whereas in blue corn kernels, they are concentrated in the aleurone. Additionally, the limit of detection (LOD) and limit of quantification (LOQ) of the spectrophotometric method employed could be the limiting factors [77,78].
The total carotenoid content of the corn kernel flour samples ranged from 0.08 to 0.42 mg βCE/g, where AZ2 flour exhibited the highest content (p ˂ 0.05); nonetheless, in some samples (white hybrid, NJ, ROP, NM2, and AM2), carotenoids were not detected. The carotenoids are usually found in yellow-orange foods [52]. A total carotenoid content of 0.053 mg/g in orange corn flour was reported [79]. In this context, native corn kernels are an important source of bioactive compounds.

3.5. Antioxidant Activity of Corn Kernel Flour Samples

The antioxidant activity of native and white corn kernel powder by DPPH, ABTS, and FRAP are listed in Table 7. All samples showed differences (p ˂ 0.05) in their antioxidant activity by the three evaluated methods.
Regarding the DPPH method, the white hybrid corn flour (26.46 mmol TE/g) exhibited higher antioxidant properties compared to native corn kernel flours (19.86 to 24.44 mmol TE/g) (p ˂ 0.05). In contrast, in the ABTS method, the white corn flour (12.79 mmol TE/g) exhibited a lower antioxidant capacity compared to the native corn kernel flours (15.83 to 26.15 mmol TE/g); the highest ABTS activity was observed in AM2 flour (p ˂ 0.05), a blue color corn. Additionally, the FRAP activity values ranged from 30.24 to 46.46 mmol TE/g, where the highest activity was observed in NJ (p ˂ 0.05). Several authors have reported that native pigmented corn kernels (often blue) are a valuable source of antioxidant compounds capable of inhibiting free radicals, which protect cells from oxidative stress [45,48]. Differences among the antioxidant results may be attributed to the distinct antioxidant mechanisms of each in vitro antioxidant method, as well as the diversity and concentration of bioactive compounds found in corn kernel flour. Antioxidant molecules, such as phenolic acids and flavonoids, inhibit DPPH and ABTS radicals. These substances neutralize harmful free radicals by donating electrons and hydrogen atoms, while some compounds can convert Fe3+ to Fe2+ [29,54].

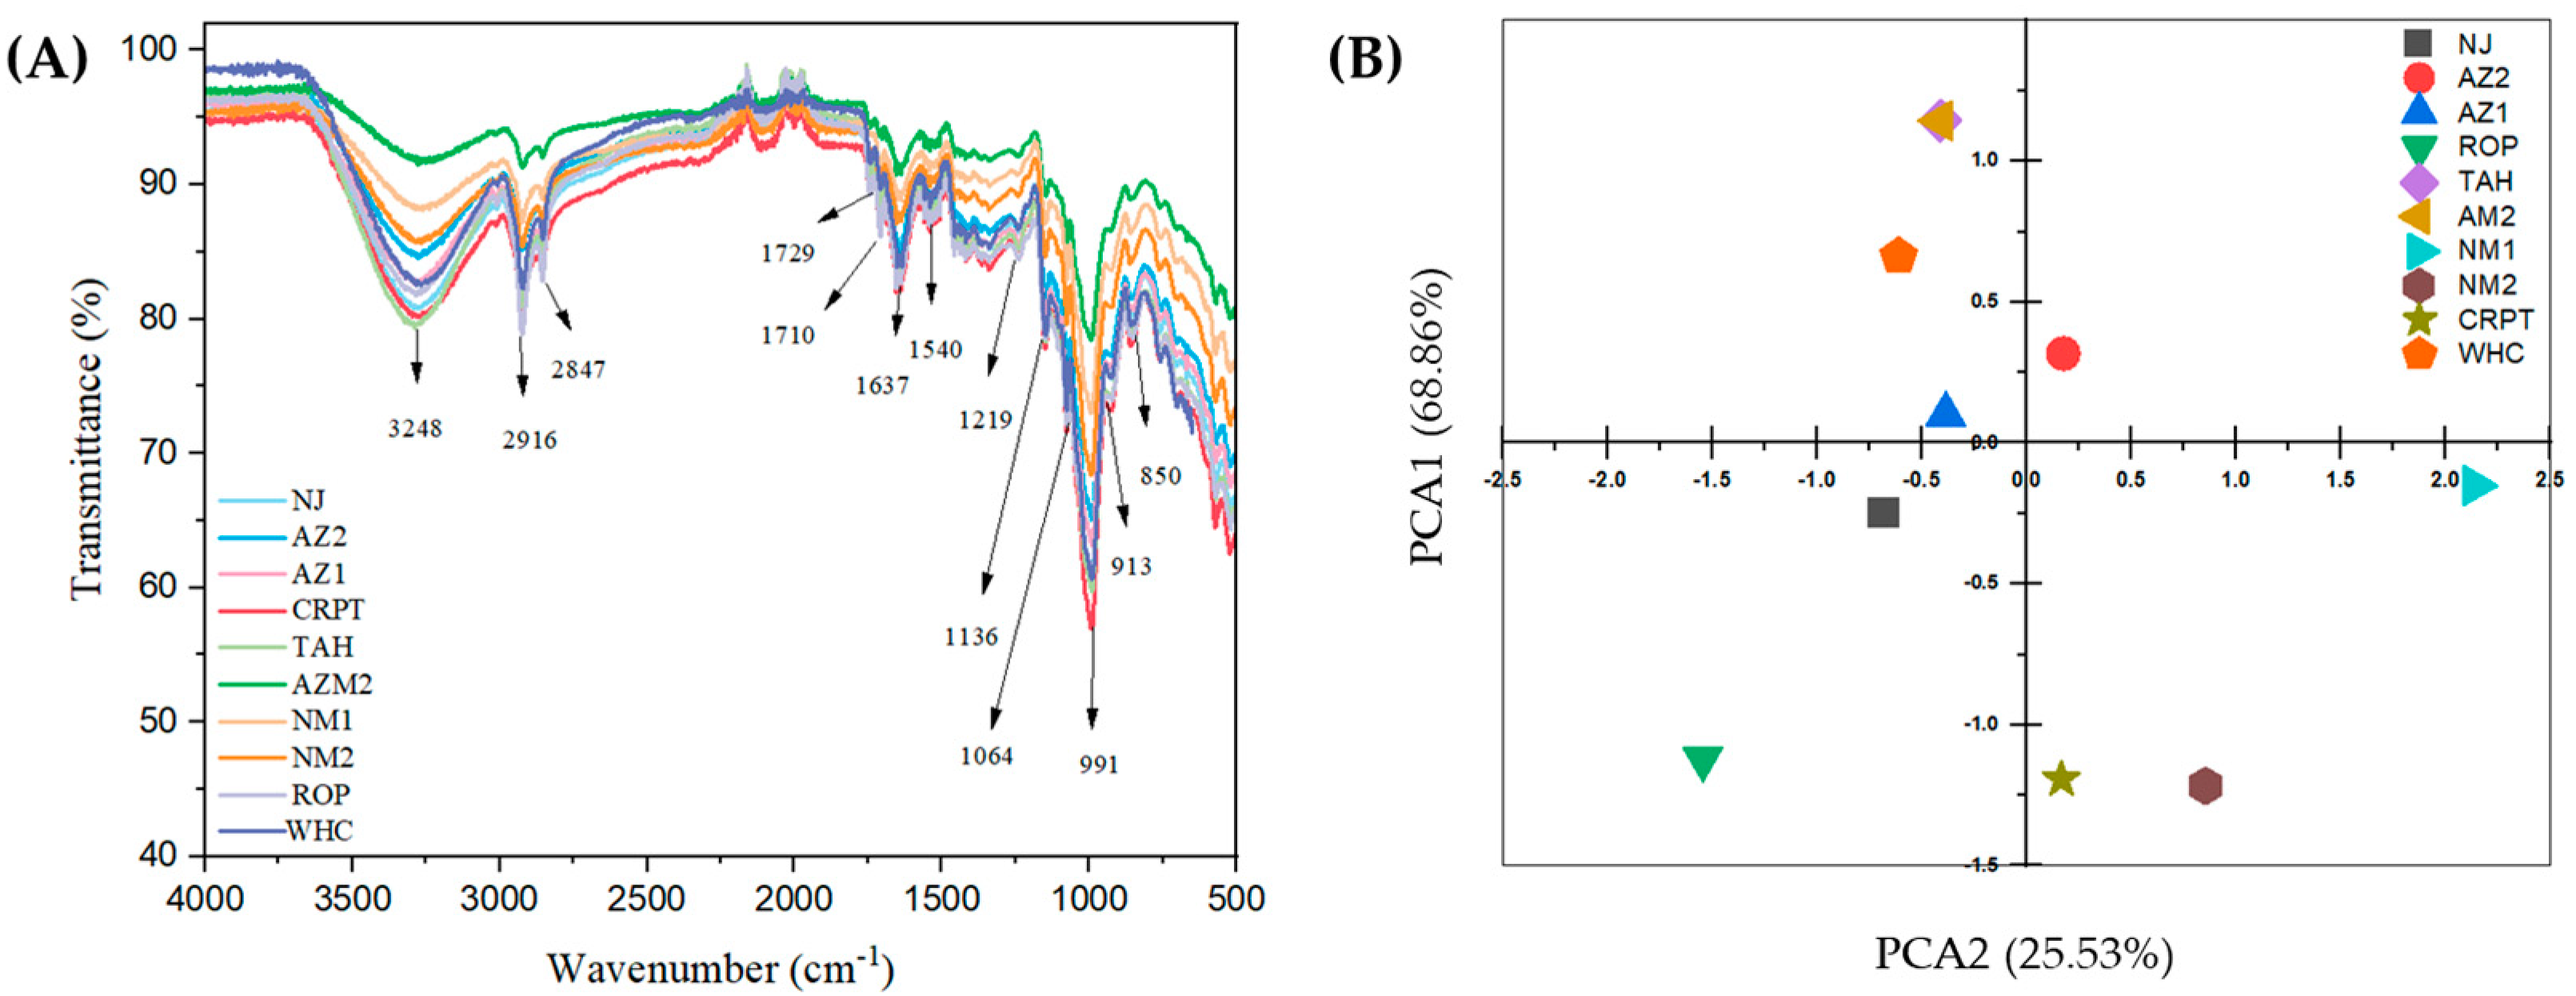
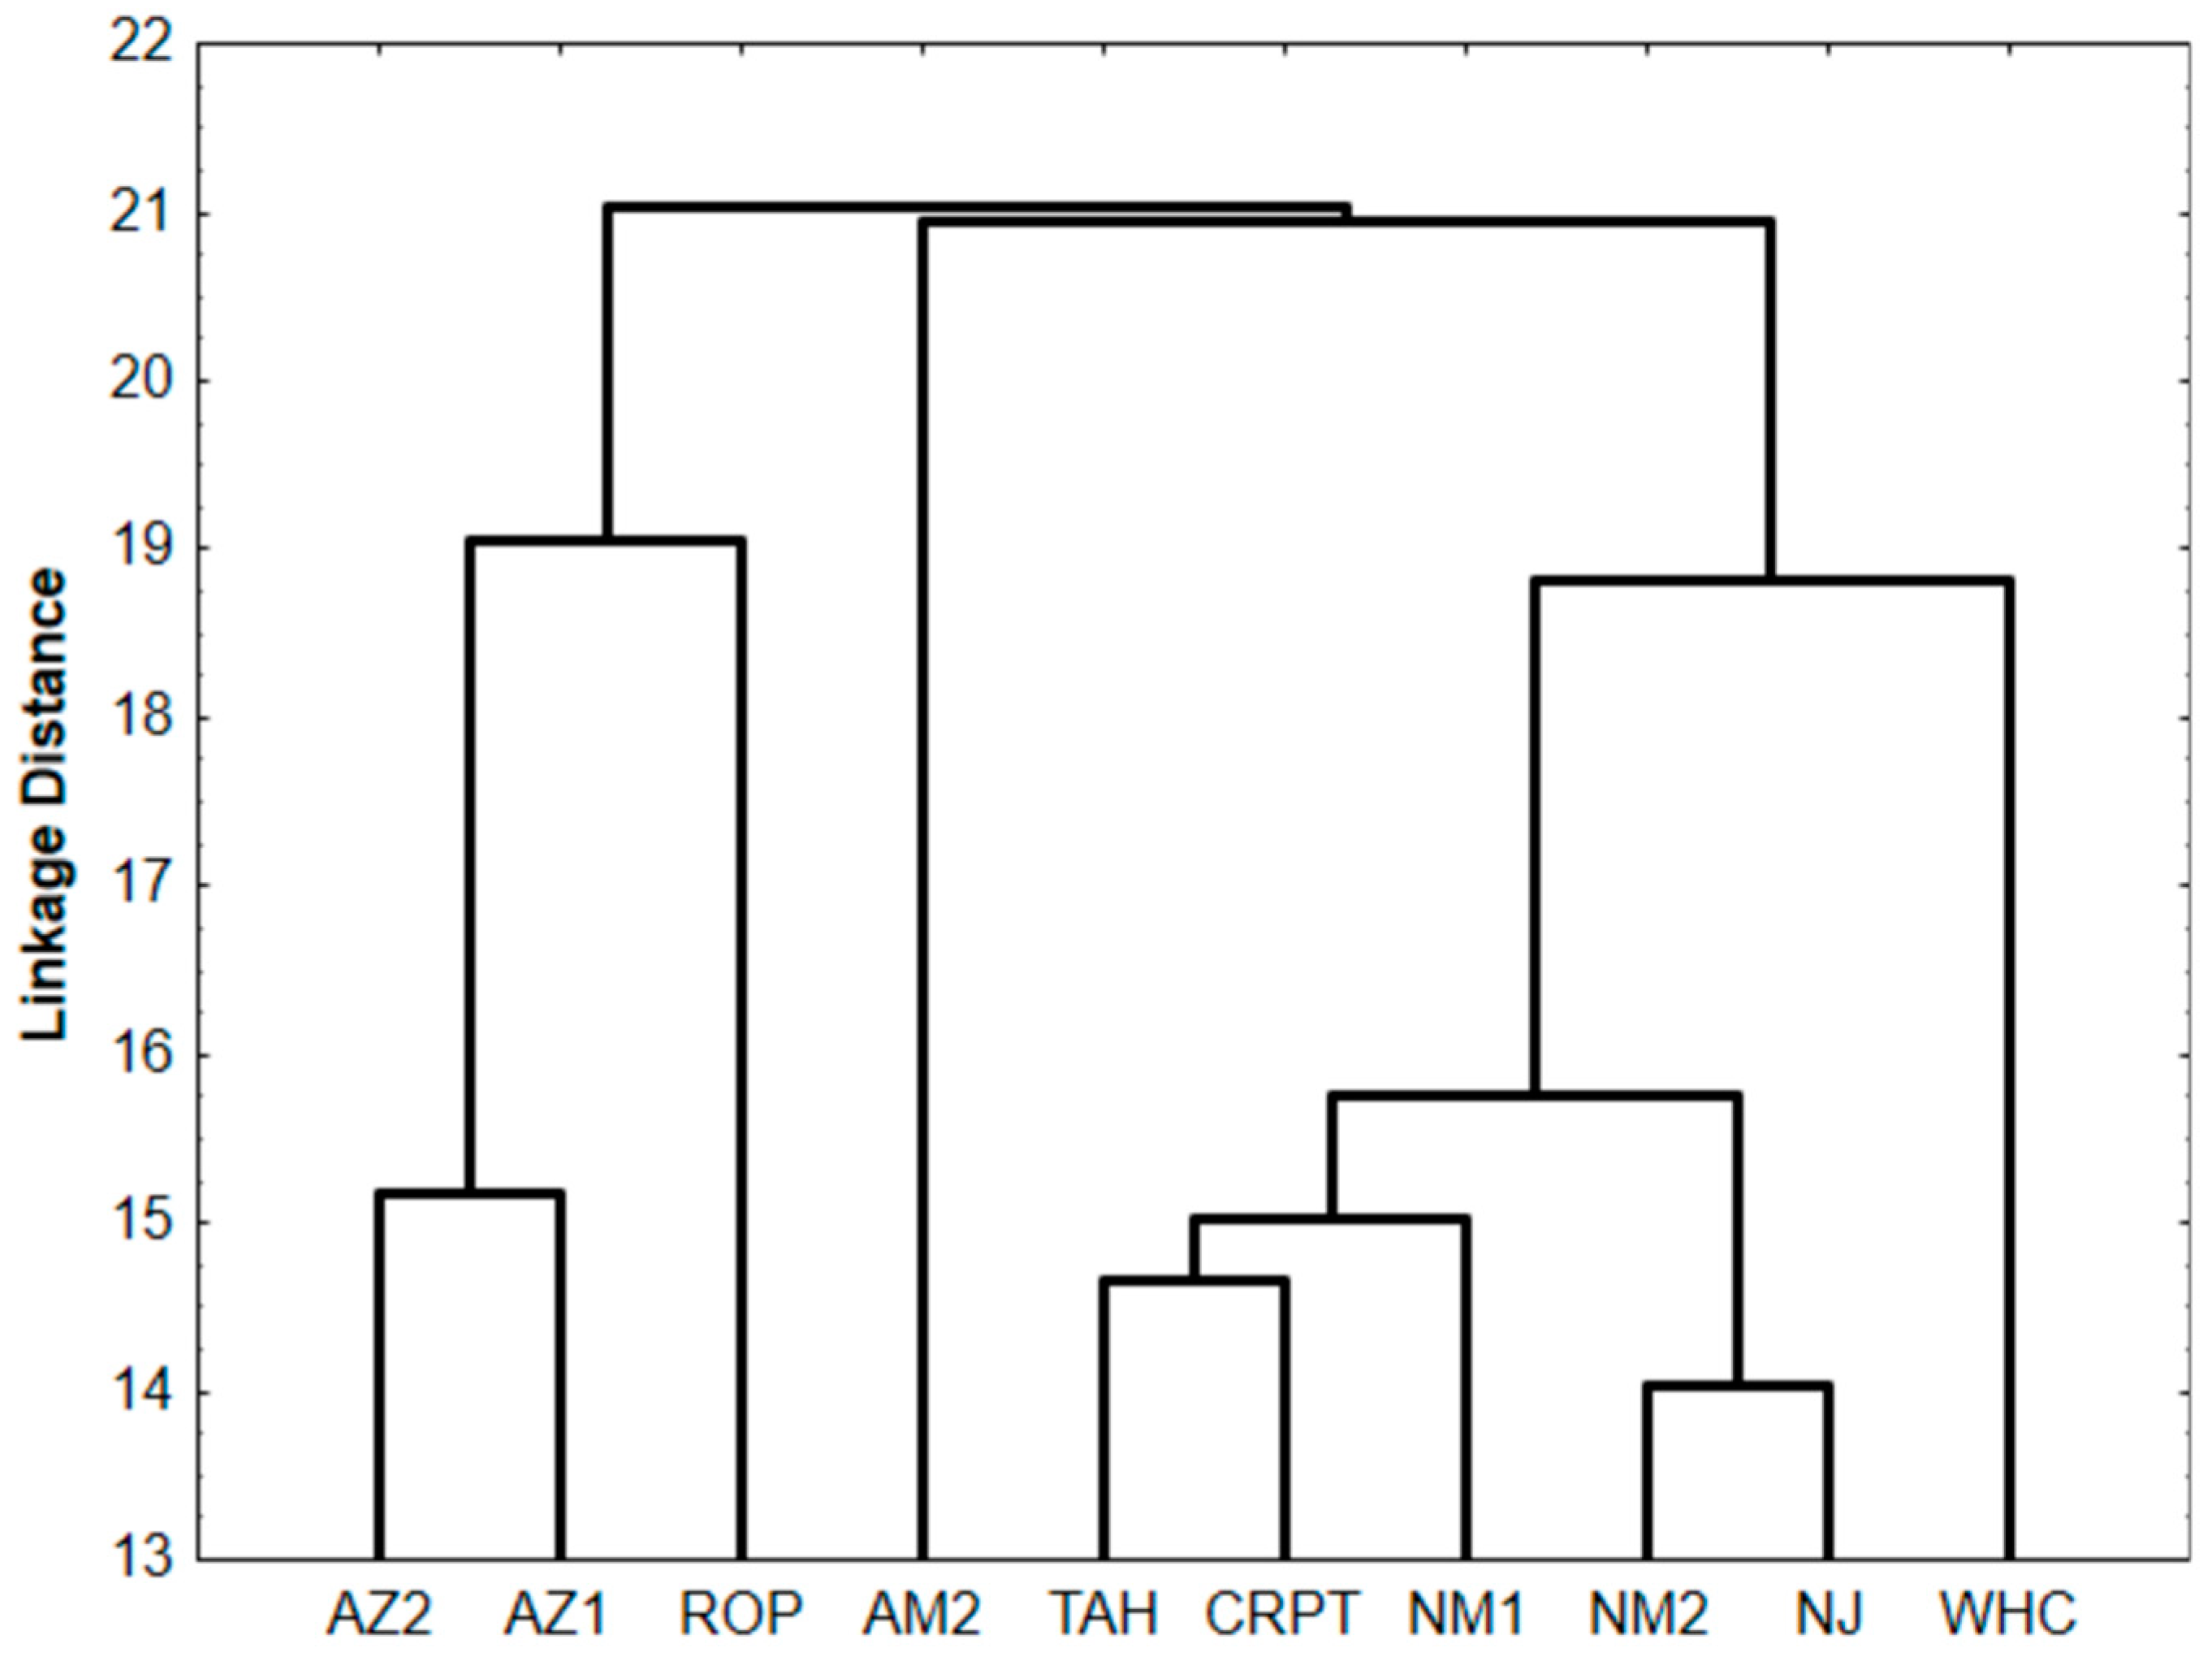
3.6. Structural Properties via FTIR Analysis

FTIR spectroscopy is a highly effective analytical technique for identifying the vibrations, frequencies, and intensities of chemical bonds within functional groups of molecules. The FTIR spectra of white hybrid and native Mexican corn kernel flours exhibited comparable patterns among them but differed from transmittance intensities among samples; similar trends were reported in native Indian corn kernel powders of different colors (orange, blue, red, white, and purple) via FTIR studies [46]. The primary analysis of FTIR spectra suggested the presence of bands associated with proteins, lipids, polysaccharides, and water [34].
Figure 2A shows the FTIR spectra of white and native corn flour. The broad absorption peak centered at 3248 cm−1 was attributed to stretching –OH groups in water molecules and amide structures within the corn flour samples [80], while signals around 2916 and 2847 cm−1 corresponded to the stretching mode of the C–H bond of the methylene functional group associated with lipids/fatty acids [34]. Peaks at 1729, 1720 (C=O stretching), 1637 (C=O stretching and N–H bending), and 1540 cm−1 (N–H bending, and C–N, C–O, C–C stretching vibrations) were assigned to the secondary structure of corn proteins, such as amide I, amide II, β-sheets, random coil, α-helix, and β-turn [60,81]. The bands at 1219 cm−1 (C–O stretching) and 1136 cm−1 (O–C–O symmetric stretching), and peaks at 1064 cm−1 (C–O and C–C stretching), 991 cm−1 (C–O bending of glycosidic bond), 913 cm−1, and 850 cm−1 were attributed to the C–H group of polysaccharide compounds, often starch molecules and their components, amylose and amylopectin [34,60,82]. Conversely, it was reported that the signal at 1423 cm−1 in corn kernel flour is attributed to the C–O deformation of phenolic compounds, whereas the signals at 1637 and 1710 cm−1 are attributed to the C=C and C=O groups of the aromatic rings of flavones (=C–O–C). Moreover, signals at 1540, 1450, 1219, and 1000 cm−1 could be associated with flavonoids, whereas signals at 850 cm−1 could be associated with anthocyanins [46]. Additionally, any shift displacements or absence of certain signals in the FTIR spectra could be associated with the moisture content in the sample [83].
To elucidate the differences among corn kernel flours, a Principal Component Analysis (PCA) of the FTIR spectra (4000 to 500 cm−1) was conducted. PCA is a useful tool for studying local corn diversity [83]. Corn flours exhibited spectral variations (Figure 2B), which can be categorized into four quadrants. The application of PCA to the spectral profile accounted for 94.38% (PCA1: 68.86% and PCA2: 25.53%) of the total variance of the spectral dataset. The first quadrant comprises AZ2, and the second quadrant comprises AZ1, WHC, AM2, and TAH. The third quadrant contains NJ and ROP, whereas the fourth quadrant comprises CRPT, NM2, and NM1. The PCA tool was employed to differentiate the physicochemical, thermal, and pasting properties of eight Brazilian maize landraces [34]. Kuhnen et al. [83] utilized chemometric analysis (form FTIR data) to distinguish landrace corn flours produced in Brazil. Furthermore, PCA was applied to assess the impact of thermal process on the physicochemical and rheological properties of two corn flour varieties [31].
Hierarchical Cluster Analysis was conducted on corn flour samples, focusing on their nutritional, physicochemical, and technological–functional properties and antioxidant compounds (Figure 3). The analysis employed Euclidean distances to determine the similarities and differences among the samples, revealing that samples within the same cluster exhibited greater similarity to each other than to those in different clusters. Four distinct clusters were identified. The first cluster comprised AZ2, AZ1, and ROP; the second cluster consisted of AM2; the third cluster included TAH, CRPT, NM1, NM2, and NJ; and the fourth cluster was represented by WHC. This analytical approach was utilized to differentiate the physicochemical, thermal, and pasting properties of eight Brazilian maize landraces [34].

4. Conclusions

The food applications of corn-based flour are closely linked to its functional properties (water solubility index, water and oil absorption index, swelling power, emulsifying and foaming capacity), which are influenced by its physicochemical (pH, titratable acidity, total soluble solids, water activity, and color attributes) and nutritional characteristics (moisture, protein, fat, carbohydrates, starch, and ash). The findings of this study suggest that native Mexican corn flours cultivated in Jalisco highlands hold potential for use in the food industry as they are rich in nutritional components and bioactive compounds (soluble phenols, flavonoids, anthocyanins, condensed tannins, and carotenoids), and exhibit antioxidant properties (DPPH, ABTS, and FRAP).
Additionally, native corn flours exhibited noteworthy physicochemical and techno-functional properties, rendering them as a promising raw material for the development of functional or nutraceutical foods and beverages. Research into the functional properties of native corn-based flour could offer valuable insights into their potential industrial applications. FTIR analysis is an effective tool for examining local maize diversity, enabling rapid screening of native corn-based flours with distinct chemical composition.
The accessions evaluated in this study hold potential for genetic improvement purposes, focusing on their conservation, propagation, and industrial application. Their properties underscore their potential for diverse applications within the food and beverage industries. However, further research is required to achieve a comprehensive characterization of these materials, including the effect of flour particle size, the profile of bioactive compounds, and rheological properties, to fully explore the use of these flours in food and beverage processing.

Author Contributions

Conceptualization, V.M.G.-R., H.R.-V., N.G.-S., and L.M.A.-E.; Data Curation, Z.V. and L.M.A.-E.; Formal Analysis, Z.V., J.M.R.-G., and L.M.A.-E.; Investigation, L.A.H.-V., S.H.-E., V.M.G.-R., H.R.-V., Z.V., A.O.-M., E.M.-G., J.M.R.-G., N.G.-S., and L.M.A.-E.; Methodology, L.A.H.-V., S.H.-E., Z.V., A.O.-M., E.M.-G., J.M.R.-G., and L.M.A.-E.; Resources, V.M.G.-R., H.R.-V., N.G.-S., and L.M.A.-E.; Software, Z.V., J.M.R.-G., and L.M.A.-E.; Validation, V.M.G.-R., N.G.-S., and L.M.A.-E.; Writing—Original Draft, L.A.H.-V., S.H.-E., V.M.G.-R., H.R.-V., Z.V., A.O.-M., E.M.-G., J.M.R.-G., N.G.-S., and L.M.A.-E.; Writing—Review and Editing, V.M.G.-R., H.R.-V., Z.V., and E.M.-G. All authors have read and agreed to the published version of the manuscript.

Funding

This research received no external funding.

Data Availability Statement

The dataset used and/or analyzed during the current study is available from the corresponding author upon reasonable request.

Acknowledgments

Luis Alfonso Hernández-Villaseñor (CVU: 629990) and Salvador Hernández-Estrada (CVU: 1319414) gratefully acknowledge the financial support for the scholarship from SECIHTI-México for Postgraduate studies in Biosciences program from the Centro Universitario de Los Altos (CUALTOS) of University of Guadalajara. Thanks to Andrea Quetzalli Uribe Torres and Gerardo Alcalá Aceves for technical support as part of their activities in the “Early incorporation into Research Program” from CUALTOS, and to the Instituto de Investigación en Ciencias Médicas (IICM) from CUALTOS for the infrastructure support.

Conflicts of Interest

The authors declare no conflicts of interest.

References

  1. Revilla, P.; Alves, M.L.; Andelković, V.; Balconi, C.; Dinis, I.; Mendes-Moreira, P.; Redaelli, R.; De Galarreta, J.I.R.; Patto, M.C.V.; Žilić, S.; et al. Traditional Foods from Maize (Zea mays L.) in Europe. Fnut 2022, 8, 683399. [Google Scholar]
  2. Erenstein, O.; Jaleta, M.; Sonder, K.; Mottaleb, K.; Prasanna, B.M. Global Production, Consumption And Trade: Trends And R&D Implications. Food Segurity 2022, 14, 1295–1319. [Google Scholar]
  3. Jayaprakash, S.; Raja, S.; He, J.; Paramannil, M. Functional Relevance of Bioactive Compounds in Purple Maize: A Contemporary Extraction Progressions and Prospective Applications. Cereal Res. Commun. 2023, 51, 263–282. [Google Scholar] [CrossRef]
  4. Medina-Hernández, J.; Caamal-Cauich, I.; Pat-Fernández, V.G.; Ávila-Dorantes, J.A. Current Challenges and Forecasts in Maize Grain Production and Consumption in Mexico. Agro Prod. 2024, 17, 165–172. [Google Scholar]
  5. USDA. Northwest Africa Wheat: Varying Weather Conditions; Mixed Results for MY 2024/25. United States Department of Agriculture. Available online: https://apps.fas.usda.gov/psdonline/circulars/production.pdf (accessed on 17 February 2025).
  6. Servicio de Información Agroalimentaria y Pesquera. Producción Agrícola. 2024. Available online: https://www.gob.mx/siap/acciones-y-programas/produccion-agricola-33119 (accessed on 17 February 2025).
  7. Padilla-Gutiérrez, H.; Pérez-Esparza, A.; navarro-Pantoja, C.A. Jalisco Gigante Agroalimentario; Desarrollo Económico y Bienestar: Guadalajara, Mexico, 2019. [Google Scholar]
  8. Serna-Saldivar, S.O. Understanding the Functionality and Manufacturing of Nixtamalized Maize Products. J. Cereal Sci. 2021, 99, 103205. [Google Scholar] [CrossRef]
  9. Rivera, B.E.; Morales, D.; Gómez, M.G.; Nevárez, G.V. Consumo Responsable de la Tortilla de Maíz, una Herencia que Debemos Cuidar. Tema de Cienc. Y Tecnol. 2021, 25, 9–14. [Google Scholar]
  10. Portillo-Vázquez, M.; Sangermán-Jarquín, D.M.; Pérez-Robles, K. Creación de Regiones Agrícolas Altamente Especializadas en el Cultivo Maíz. Estudio de caso: Sinaloa, Sonora, Nayarit y Jalisco. Rev. Mex. De Cienc. Agrícolas 2023, 14, 303–310. [Google Scholar]
  11. SIAP. Producción Agrícola de Maíz. 2022. Available online: https://nube.siap.gob.mx/avance_agricola/ (accessed on 19 February 2025).
  12. CONABIO. Biodiversidad Mexicana. Razas de Maíz de México. 2020. Available online: https://www.biodiversidad.gob.mx/diversidad/alimentos/maices/razas-de-maiz (accessed on 19 February 2025).
  13. Ramírez-Vega, H.; Vázquez-Carrillo, G.; Muñóz-Rosales, G.M.; Martínez-Loperena, R.; Heredia-Nava, D.; Martínez-Sifuentes, J.Á.; Anaya-Esparza, L.M.; Gómez-Rodríguez, V.M. Physical and Chemical Characteristics of Native Maize from the Jalisco Highlands and their Influence on the Nixtamalization Process. Agriculture 2022, 12, 1293. [Google Scholar] [CrossRef]
  14. Salinas-Moreno, Y.; Esquivel-Esquivel, G.; Ramírez-Díaz, J.L.; La Torre, I.A.; Bautista-Ramírez, E.; Santillán-Fernández, A. Selección de Germoplasma de Maíz Morado (Zea mays L.) con Potencial para Extracción de Pigmentos. Rev. Fitotec. Mex. 2021, 44, 309–321. [Google Scholar]
  15. Vázquez-Carrillo, M.G.; Toledo-Aguilar, R.; Aragón-Cuevas, F.; Salinas-Moreno, Y.; Palacios-Rojas, N.; Santiago-Ramos, D. From Maize to Tlayuda, a Traditional Big-flat Leathery Tortilla. Effect of Two Nixtamalization Processes on Some Physicochemical and Nutraceutical Properties. Int. J. Gastron. Food Sci. 2023, 31, 100661. [Google Scholar]
  16. Diario Oficial de la Federación. Ley Federal Para El Fomento y Protección Del Maíz Nativo; Gobierno Federal Mexicano: Mexico, Mexico, 2020; Available online: https://www.diputados.gob.mx/LeyesBiblio/ref/lffpmn/LFFPMN_orig_13abr20.pdf (accessed on 19 February 2025).
  17. Paulsmeyer, M.N.; Vermillion, K.E.; Juvik, J.A. Assessing the Diversity of Anthocyanin Composition in Various Tissues of Purple Corn (Zea mays L.). Phytochemistry 2022, 201, 113263. [Google Scholar] [CrossRef]
  18. Zhang, Q.; De Mejia, E.G.; Luna-Vital, D.; Tao, T.; Chandrasekaran, S.; Chatham, L.; Juvik, J.; Singh, V.; Kumar, D. Relationship of Phenolic Composition of Selected Purple Maize (Zea mays L.) Genotypes with their Anti-Inflammatory, Anti-Adipogenic and Anti-Diabetic Potential. Food Chem. 2019, 289, 739–750. [Google Scholar] [CrossRef] [PubMed]
  19. Filipčev, B.; Đalović, I.; Nježić, Z.; Šimurina, O.; Bekavac, G.; Pojić, M. Physical and Milling Properties of Maize; CRC Press eBooks: Boca Raton, FL, USA, 2022; 38p. [Google Scholar]
  20. Hasmadi, M.; Noorfarahzilah, M.; Noraidah, H.; Zainol, M.; Jahurul, M. Functional Properties of Composite Flour: A Review. Food Res. 2020, 4, 1820–1831. [Google Scholar]
  21. Hernández-Santos, B.; Lerdo-Reyes, A.A.; Téllez-Morales, J.A.; Rodríguez-Miranda, J. Chemical Composition, Techno-functional Properties, and Bioactive Components of Blends of Blue Corn/Purple Sweet Potato for its Possible Application in the Food Industry. J. Food Meas. Charact. 2022, 17, 1909–1920. [Google Scholar] [CrossRef]
  22. Fan, F.; Yang, Z.; Xing, X. Study on the Pyrolysis Properties of Corn Straw by TG–FTIR and TG–GC/MS. J. Therm. Anal. Calorim. 2021, 143, 3783–3791. [Google Scholar] [CrossRef]
  23. Colombo, R.; Ferron, L.; Papetti, A. Colored Corn: An Up-Date on Metabolites Extraction, Health Implication, and Potential Use. Molecules 2021, 26, 199. [Google Scholar] [CrossRef]
  24. Adebo, O.A.; Oyedeji, A.B.; Adebiyi, J.A.; Chinma, C.E.; Oyeyinka, S.A.; Olatunde, O.O.; Green, E.; Njobeh, P.B.; Kondiah, K. Kinetics of Phenolic Compounds Modification during Maize Flour Fermentation. Molecules 2021, 26, 6702. [Google Scholar] [CrossRef]
  25. Méndez-Lagunas, L.L.; Cruz-Gracida, M.; Barriada-Bernal, L.G.; Rodríguez-Méndez, L.I. Profile of Phenolic Acids, Antioxidant Activity and Total Phenolic Compounds During Blue Corn Tortilla Processing and its Bioaccessibility. J. Food Sci. Technol. 2020, 57, 4688–4696. [Google Scholar] [CrossRef]
  26. Salvador-Reyes, R.; Rebellato, A.P.; Pallone, J.A.L.; Ferrari, R.A.; Clerici, M.T.P.S. Kernel Characterization and Starch Morphology in Five Varieties of Peruvian Andean Maize. Food Res. Int. 2021, 140, 110044. [Google Scholar] [CrossRef]
  27. Vázquez-Carrillo, M.G.; Aparicio-Eusebio, L.A.; Salinas-Moreno, Y.; Buendía-Gonzalez, M.O.; Santiago-Ramos, D. Nutraceutical, Physicochemical, and Sensory Properties of Blue Corn Polvorones, a Traditional Flour-Based Confectionery. Plant Foods Hum. Nutr. 2018, 73, 321–327. [Google Scholar] [CrossRef]
  28. IIEG. Tepatitlán de Morelos. Diagnóstico del Municipio. Recuperado de. 2021. Available online: https://iieg.gob.mx/ns/wp-content/uploads/2023/02/Tepatitl%C3%A1n-de-Morelos-1.pdf (accessed on 20 February 2025).
  29. Camelo-Méndez, G.A.; Agama-Acevedo, E.; Tovar, J.; Bello-Pérez, L.A. Functional Study of Raw and Cooked Blue Maize Flour: Starch Digestibility, Total Phenolic Content and Antioxidant Activity. J. Cereal Sci. 2017, 76, 179–185. [Google Scholar] [CrossRef]
  30. AOAC. Official Method of Analysis of Association of Official Analytical Chemists International; AOAC International Gaitherburg: Gaithersburg, MD, USA, 2016; Available online: https://law.resource.org/pub/us/cfr/ibr/002/aoac.methods.1.1990.pdf (accessed on 20 February 2025).
  31. Dongmo, H.; Tambo, S.T.; Teboukeu, G.B.; Mboukap, A.N.; Fotso, B.S.; Djuidje, M.C.T.; Klang, J.M. Effect of process and variety on physico-chemical and rheological properties of two corn flour varieties (Atp and Kassaï). J. Agric. Food Res. 2020, 2, 100075. [Google Scholar] [CrossRef]
  32. Anderson, R.A.; Conway, H.F.; Peplinski, A.J. Gelatinization of Corn Grits by Roll Cooking, Extrusion Cooking and Steaming. Starch-Stärke 1970, 22, 130–135. [Google Scholar] [CrossRef]
  33. Nasrin, T.A.A.; Noomhorm, A.; Anal, A.K. Physico-Chemical Characterization of Culled Plantain Pulp Starch, Peel Starch, and Flour. Int. J. Food Prop. 2015, 18, 165–177. [Google Scholar] [CrossRef]
  34. Uarrota, V.G.; Amante, E.R.; Demiate, I.M.; Vieira, F.; Delgadillo, I.; Maraschin, M. Physicochemical, Thermal, and Pasting Properties of Flours and Starches of Eight Brazilian Maize Landraces (Zea mays L.). Food Hydrocoll. 2013, 30, 614–624. [Google Scholar] [CrossRef]
  35. Yasumatsu, K.; Sawada, K.; Moritaka, S.; Misaki, M.; Toda, J.; Wada, T.; Ishii, K. Whipping and Emulsifying Properties of Soybean Products. Agric. Biol. Chem. 1972, 36, 719–727. [Google Scholar] [CrossRef]
  36. Piornos, J.A.; Burgos, C.; Morales, E.; Rubilar, M.; Acevedo, F. Highly efficent encapsulation of linseed oil into alginate/lupin protein beads: Optimizatation of the emulsión formulation. Food Hydrocoll. 2017, 63, 139–148. [Google Scholar] [CrossRef]
  37. Pérez-Jiménez, J.; Arranz, S.; Tabernero, M.; Díaz-Rubio, M.E.; Serrano, J.; Goñi, I.; Saura-Calixto, F. Updated Methodology to Determine Antioxidant Capacity in Plant Foods, Oils and Beverages: Extraction, Measurement and Expression of Results. Food Res. Int. 2008, 41, 274–285. [Google Scholar] [CrossRef]
  38. Montreau, F.R. Sur Le Dosage Des Composés Phénoliques Totaux Dans Les Vins Par La Méthode Folin-Ciocalteu. OENO One 1972, 6, 397–404. [Google Scholar] [CrossRef]
  39. Esmaeili, A.K.; Taha, R.M.; Mohajer, S.; Banisalam, B. Antioxidant Activity and Total Phenolic and Flavonoid Content of Various Solvent Extracts from in Vivo and in Vitro Grown Trifolium pratense L. (Red Clover). BioMed Res. Int. 2015, 1, 643285. [Google Scholar]
  40. Barba, F.J.; Rajha, H.N.; Debs, E.; Abi-Khattar, A.-M.; Khabbaz, S.; Dar, B.N.; Simirgiotis, M.J.; Castagnini, J.M.; Maroun, R.G.; Louka, N. Optimization of Polyphenols’ Recovery from Purple Corn Cobs Assisted by Infrared Technology and Use of Extracted Anthocyanins as a Natural Colorant in Pickled Turnip. Molecules 2022, 27, 5222. [Google Scholar] [CrossRef] [PubMed]
  41. Broadhurst, R.B.; Jones, W.T. Analysis of Condensed Tannins Using Acidified Vanillin. J. Sci. Food Agric. 1978, 29, 788–794. [Google Scholar] [CrossRef]
  42. Ortega, V.G.; Ramírez, J.A.; Velázquez, G.; Tovar, B.; Mata, M.; Montalvo, E. Effect of High Hydrostatic Pressure on Antioxidant Content of ‘Ataulfo’ Mango During Postharvest Maturation. Food Sci. Technol. Int. 2013, 33, 561–568. [Google Scholar] [CrossRef]
  43. Prior, R.L.; Wu, X.; Schaich, K. Standardized Methods for the Determination of Antioxidant Capacity and Phenolics in Foods and Dietary Supplements. J. Agric. Food Chem. 2005, 53, 4290–4302. [Google Scholar] [CrossRef]
  44. Re, R.; Pellegrini, N.; Proteggente, A.; Pannala, A.; Yang, M.; Rice-Evans, C. Antioxidant activity applying an improved ABTS radical cation de colorization assay. Free Radic. Biol. Med. 1999, 26, 1231–1237. [Google Scholar] [CrossRef] [PubMed]
  45. Benzie, I.F.; Strain, J.J. The Ferric Reducing Ability of Plasma (FRAP) as a Measure of "Antioxidant Power": The FRAP Assay. Anal. Biochem. 1996, 239, 70–76. [Google Scholar] [CrossRef] [PubMed]
  46. Bharat, B.; Bhushan, B.; Ajay Pal, M.; Kumar, M.; Manesh, C.D.; Yathish, K.R.; Bahadur, S.J.; Pardeep, K.; Sumit, K.A.; Alla, S.; et al. FTIR Spectra, Antioxidant Capacity and Degradation Kinetics of Maize Anthocyanin Extract Under Variable Process Conditions. Appl. Food Res. 2023, 3, 100282. [Google Scholar]
  47. Trehan, S.; Singh, N.; Kaur, A. Diversity and Relationship Among Grain, Flour and Starch Characteristics of Indian Himalayan Colored Corn Accessions. J. Food Sci. Technol. 2020, 57, 3801–3813. [Google Scholar] [CrossRef]
  48. Patil, S.; Kaur, C.; Puniya, M.K.; Mahapatra, A.; Dhakane-Lad, J.; Jalgaonkar, K.; Mahawar, M.K. Functional Properties of Extruded Corn Flour. Turk. J. Agric. Eng. Res. 2021, 2, 167–174. [Google Scholar] [CrossRef]
  49. Barbosa-Pinto, A.T.B.; Pereira, J.; de Oliveira, T.R.; Prestes, R.A.; Mattielo, R.R.; Demiate, I.M. Characterization of Corn Landraces Planted Grown in the Campos Gerais Region (Paraná, Brazil) for Industrial Utilization. Braz. Arch. Biol. Technol. 2009, 52, 17–28. [Google Scholar] [CrossRef]
  50. Yaqoob, S.; Cai, D.; Liu, M.; Zheng, M.; Zhao, C.B.; Liu, J.S. Characterization of Microstructure, Physicochemical and Functional Properties of Corn Varieties Using Different Analytical Techniques. Int. J. Food Prop. 2019, 22, 572–582. [Google Scholar] [CrossRef]
  51. Oas, S.E.; Adams, K.R. The Nutritional Content of Five Southwestern US Indigenous Maize (Zea mays L.) Landraces of Varying Endosperm Type. Am. Antiq. 2022, 87, 284–302. [Google Scholar] [CrossRef]
  52. Mutlu, C.; Arslan-Tontul, S.; Candal, C.; Kilic, O.; Erbas, M. Physicochemical, Thermal, and Sensory Properties of Blue Corn (Zea mays L.). J. Food Sci. 2018, 8, 53–59. [Google Scholar] [CrossRef] [PubMed]
  53. Nikolić, V.; Žilić, S.; Simic, M.; Vasić, M. Wholegrain Flours of Differently Colored Maize Kernels as Macro-and Micronutrient-Rich Food Ingredients Integralno Brašno od Kukuruza Različite Boje Zrna Kao Izvor Makro-i Mikro-NutriJenata. J. Process. Energy Agric. 2022, 26, 64–67. [Google Scholar] [CrossRef]
  54. Žilić, S.; Kocadağlı, T.; Vančetović, J.; Gökmen, V. Effects of Baking Conditions and Dough Formulations on Phenolic Compound Stability, Antioxidant Capacity and Color of Cookies Made From Anthocyanin-Rich Corn Flour. Food Sci. Technol. 2016, 65, 597–603. [Google Scholar] [CrossRef]
  55. Shi, L.; Li, W.; Sun, J.; Qiu, Y.; Wei, X.; Luan, G.; Hu, Y.; Tatsumi, E. Grinding of Maize: The Effects of Fine Grinding on Compositional, Functional and Physicochemical Properties of Maize Flour. J. Cereal Sci. 2016, 68, 25–30. [Google Scholar] [CrossRef]
  56. Codex Alimentarius. Codex Alimentarius. Normas Internationals de los Alimentos. 2013. Available online: https://www.fao.org/fao-who-codexalimentarius/codex-texts/codes-of-practice/es/ (accessed on 20 February 2025).
  57. Akaffou, F.; Koffi, D.; Cisse, M.; Niamké, S. Physicochemical and Functional Properties of Flours from Three Purple Maize Varieties Named “Violet de Katiola” in Côte d’Ivoire. Asian Food Sci. J. 2018, 4, 1–10. [Google Scholar] [CrossRef]
  58. Martínez-Trejo, G.I.; Anaya-Esparza, L.M.; Vargas-Torres, A.; Hernández-Uribe, J.P.; Viñas-Bravo, O. Dual Modification of Chayotextle Starch: Effect on Physicochemical, Functional, and Structural Properties. Starch 2023, 75, 9–10. [Google Scholar]
  59. Uriarte-Aceves, P.; Cuevas-Rodriguez, E.O.; Gutiérrez-Dorado, R.; Mora-Rochin, S.; Reyes-Moreno, C.; Puangpraphant, S.; Milán-Carrillo, J. Physical, Compositional, and Wet-Milling Characteristics of Mexican Blue Maize (Zea mays L.) Landrace. Cereal J. Chem. 2015, 92, 491–496. [Google Scholar] [CrossRef]
  60. An, N.; Li, D.; Wang, L.; Wang, Y. Microwave irradiation of corn kernels: Effects on Structural, Thermal, Functional and Rheological Properties of Corn Flour. Food Hydrocoll. 2023, 143, 108939. [Google Scholar] [CrossRef]
  61. Milán-Carrillo, J.; Gutiérrez-Dorado, R.; Cuevas-Rodríguez, E.; Garzón-Tiznado, J.; Reyes-Moreno, C. Nixtamalized Flour From Quality Protein Maize (Zea mays L.) Optimization of Alkaline Processing. Plant Foods Hum. Nutr. 2004, 59, 35–44. [Google Scholar] [CrossRef]
  62. Balseiro, G.; Taron, A.; Garcia-Zapateiro, L.A. Nutritional Properties of Different Composite Flours from Maize (Zea mays) Variety ica v109 and Pearl Millet (Pennisetum glaucum) Malted with Calcium Chloride and Gibberellic Acid. Eur. Food Res. Technol. 2014, 240, 471–475. [Google Scholar] [CrossRef]
  63. Machado-Filho, G.; Nascimento, I.; Sakai, T.; Rocha, W.; Santos, M. Brix analysis and green corn cob productivy by nitrogen fertilization time. Appl. Res. Agrotechnol. 2018, 11, 33–41. [Google Scholar]
  64. García-Campos, A.U.; Cruz-Monterrosa, R.G.; Rayas-Amor, A.A.; Jiménez-Guzmán, J.; Fabela-Morón, M.F.; De la Paz Salgado-Cruz, M.; De Jesús Cortés-Sánchez, A.; Villanueva-Carvajal, A.; Díaz-Ramírez, M. Caracterización Físico-Química de Maíz (Zea mays L.) Criollo (Azul y Rojo) del Estado de México. Agro Product. 2020, 13, 95–100. [Google Scholar] [CrossRef]
  65. Rodríguez-Salinas, P.A.; Zavala-García, F.; Urías-Orona, V.; Muy-Rangel, D.; Heredia, J.B.; Niño-Medina, G. Chromatic, Nutritional and Nutraceutical Properties of Pigmented Native Maize (Zea mays L.) Genotypes From the Northeast of Mexico. Arab. J. Sci. Eng. 2020, 45, 95–112. [Google Scholar] [CrossRef]
  66. Savlak, N.; Türker, B.; Yeşilkanat, N. Effects of Particle Size Distribution on Some Physical, Chemical and Functional Properties of Unripe Banana Flour. Food Chem. 2016, 213, 180–186. [Google Scholar] [CrossRef]
  67. Balet, S.; Guelpa, A.; Fox, G.; Manley, M. Rapid Visco Analyser (RVA) as a Tool for Measuring Starch-Related Physiochemical Properties in Cereals: A Review. Food Anal. Methods 2019, 12, 2344–2360. [Google Scholar] [CrossRef]
  68. Mejía-Terán, A.; Blanco-Lizarazo, C.M.; Mateus, E.L.; Sotelo-Díaz, I. Techno-Functional and Physicochemical Properties of Corn Flours as Potential Food Ingredients. Appl. Food Res. 2024, 4, 100427. [Google Scholar] [CrossRef]
  69. Khan, A.; Siddiqui, S.; Rahman, U.U.; Ali, H.; Saba, M.; Azhar, F.A.; Rehman, M.M.U.; Shah, A.A.; Badshah, M.; Hasan, F.; et al. Physicochemical Properties of Enzymatically Prepared Resistant Starch from Maize Flour and its Use in Cookies Formulation. Int. J. Food Prop. 2020, 23, 549–569. [Google Scholar] [CrossRef]
  70. Shad, M.; Nawaz, H.; Noor, M.; Badar, H.; Hussain, M.; Choudhry, M. Functional Properties of Maize Flour and its Blends with Wheat Flour: Optimization of Preparation Conditions by response Surface Methodology. Pak. J. Bot. 2013, 45, 2027–2035. [Google Scholar]
  71. Petkova, B.; Tcholakova, S.; Chenkova, M.; Golemanov, K.; Denkov, N.; Thorley, D.; Stoyanov, S. Foamability of Aqueous solutions: Role of surfactant type and concentration. Adv. Colloid Interface Sci. 2020, 276, 102084. [Google Scholar] [CrossRef]
  72. Keramaris, A.; Papadopoulos, V.; Kasapidou, E.; Mitlianga, P. A comprehensive analysis on nutritional and antioxidant characteristics of a traditional roasted maize flour (Furniko) of ponti greeks: Comparative study to related flour products. Plant Foods Hum. Nutr. 2023, 58, 476–482. [Google Scholar] [CrossRef]
  73. Montilla, E.C.; Hillebrand, S.; Antezana, A.; Winterhalter, P. Soluble and Bound Phenolic Compounds in Different Bolivian Purple Corn (Zea mays L.) Cultivars. J. Agric. Food Chem. 2011, 59, 7068–7074. [Google Scholar]
  74. Žilić, S.; Mogol, B.A.; Akıllıoğlu, G.; Serpen, A.; Babić, M.; Gökmen, V. Effects of Infrared Heating on Phenolic Compounds and Maillard Reaction Products in Maize Flour. J. Cereal Sci. 2013, 58, 1–7. [Google Scholar]
  75. Oladapo, A.S.; Adepeju, A.B.; Akinyele, A.A.; Adepeju, D.M. The Proximate, Functional and Anti-Nutritional Properties of Three Selected Varieties of Maize (Yellow, White and Pop Corn) flour. Int. J. Sci. Eng. Sci. 2017, 1, 23–26. [Google Scholar]
  76. Inyang, U.E.; Akindolu, B.E.; Elijah, A.I. Nutrient Composition, Amino Acid Profile and Anti-Nutritional Factors of Nixtamalized Maize Flour Supplemented With Sprouted Soybean Flour. Eur. J. Nutr. Food Saf. 2019, 9, 41–51. [Google Scholar] [CrossRef]
  77. Suriano, S.; Balconi, C.; Valoti, P.; Redaelli, R. Comparison of Total Polyphenols, Profile Anthocyanins, Color Analysis, Carotenoids and Tocols in Pigmented Maize. Lwt 2021, 144, 111257. [Google Scholar] [CrossRef]
  78. Hu, Q.P.; Xu, J.G. Profiles of Carotenoids, Anthocyanins, Phenolics, and Antioxidant Activity of Selected Color Waxy Corn Grains during Maturation. J. Agric. Food Chem. 2011, 59, 2026–2033. [Google Scholar] [CrossRef]
  79. Beta, T.; Hwang, T. Influence of heat and Moisture Treatment on Carotenoids, Phenoliccontent, and Antioxidant Capacity of Orange Maize Flour. Food Chem. 2017, 246, 58–64. [Google Scholar] [CrossRef]
  80. Awolu, O.O.; Odoro, J.W.; Adeloye, J.B.; Lawal, O.M. Physicochemical Evaluation and Fourier Transform Infrared SpectrosCopy Characterization of Quality Protein Maize Starch Subjected to Different Modifications. J. Food Sci. 2020, 85, 3052–3060. [Google Scholar] [CrossRef]
  81. Cueto, M.; Farroni, A.; Rodríguez, S.D.; Schoenlechner, R.; Schleining, G.; Del Pilar Buera, M. Assessing Changes in Enriched Maize Flour Formulations After Extrusion by Means of FTIR, XRD, and Chemometric Analysis. Food Bioprocess Technol. 2018, 11, 1586–1595. [Google Scholar]
  82. Ying, D.; Hlaing, M.M.; Lerisson, J.; Pitts, K.; Cheng, L.; Sanguansri, L.; Augustin, M.A. Physical properties and FTIR Analysis of Rice-Oat Flour and Maize-Oat Flour Based Extruded Food Products Containing Olive Pomace. Food Res. Int. 2017, 100, 665–673. [Google Scholar]
  83. Kuhnen, S.; Ogliari, J.; Dias, P.; Boffo, E.; Correia, I.; Ferreira, A.; Delgadillo, I.; Maraschin, M. ATR-FTIR Spectroscopy and Chemometric Analysis Applied to Discrimination of Landrace Maize Flours Produced in Southern Brazil. Int. J. Food Sci. Technol. 2010, 45, 1673–1681. [Google Scholar] [CrossRef]
Figure 1. Visual appearance of maize grain and whole maize kernel flour used in this study.
Crops 05 00026 g001
Figure 2. FTIR spectra (A) and Principal Component Analysis (B) of white hybrid and native Mexican corn flour.
Crops 05 00026 g002
Figure 3. Similarity cluster of corn flours based on their nutritional, physicochemical, and technological–functional properties and antioxidant compounds.
Crops 05 00026 g003
Table 1. Corn kernel samples used in this study.
Name of Corn SampleCodeVisual Kernel ColorCob Sample
(Pieces)
Corn Kernel (g)
White hybrid (Control)WHCWhite 1000
Negro JaliscoNJDark red101000
Rojo occidente pozoleroROPPurple101000
Amarillo Zamorano 1AZ1Yellow101000
Amarillo Zamorano 2AZ2Yellow101000
Negro Michoacan 1NM1Dark blue101000
Negro Michoacan 2NM2Dark gray91000
Criollo Rojo Pozolero TepatitlánCRPTLight purple111000
Tabloncillo AhumadoTAHLight brown101000
Azúl México 2AM2Black231000
Table 2. Nutritional composition of white hybrid and native corn kernel powders.
SampleMoisture (%)Protein (%)Fat (%)Carbohydrates (%)Starch (%)Ash (%)Energy Value (Kcal/100 g)
WHC9.78 ± 0.04 b8.65 ± 0.03 e3.78 ± 0.03 e76.39 ± 0.07 a63.07 ± 0.17 a2.29 ± 0.04 f374.18
NJ8.70 ± 0.04 e9.79 ± 0.13 c3.91 ± 0.01 d75.94 ± 0.17 b62.29 ± 0.27 b2.48 ± 0.01 d378.11
ROP8.68 ± 0.01 e10.16 ± 0.13 b4.37 ± 0.06 a75.43 ± 0.19 c57.85 ± 0.69 e2.71 ± 0.08 b381.69
AZ18.50 ± 0.12 f10.96 ± 0.11 a3.76 ± 0.03 e75.37 ± 0.01 c60.52 ± 0.14 c2.68 ± 0.02 b379.16
AZ28.01 ± 0.05 h9.67 ± 0.12 c4.33 ± 0.03 a76.56 ± 0.20 a63.19 ± 0.25 a2.47 ± 0.03 d383.89
NM18.51 ± 0.05 f9.72 ± 0.19 c3.74 ± 0.03 e76.39 ± 0.17 a61.54 ± 0.63 b2.61 ± 0.01 c378.10
NM29.30 ± 0.08 c9.20 ± 0.07 d4.03 ± 0.05 c75.97 ± 0.03 b63.07 ± 0.02 a2.37 ± 0.02 e376.95
CRPT8.94 ± 0.09 d9.74 ± 0.01 c3.98 ± 0.04 c75.75 ± 0.03 b60.18 ± 0.03 cd2.43 ± 0.03 de377.78
TAH8.28 ± 0.01 g10.23 ± 0.04 b4.16 ± 0.04 b75.90 ± 0.02 b59.68 ± 0.01 d2.69 ± 0.03 b381.84
AM210.52 ± 0.09 a10.19 ± 0.12 b3.38 ± 0.03 f74.71 ± 0.18 d51.41 ± 0.12 f3.48 ± 0.07 a370.02
Data are mean ± standard deviation (n = 3). Different letters in same column indicate significant differences between samples (p ˂ 0.05). All results are presented on dry matter basis.
Table 3. Physicochemical properties of white hybrid and native corn kernel flours.
SamplepHTitratable Acidity
(% Malic Acid)
Total Soluble Solids
(°Brix)
Water Activity
WHC6.13 ± 0.03 f0.43 ± 0.02 d0.77 ± 0.12 e0.56 ± 0.01 a
NJ6.13 ± 0.06 de0.26± 0.07 ef1.57 ± 0.15 c0.42 ± 0.01 e
ROP6.38 ± 0.04 a0.23 ± 0.01 ef1.40 ± 0.17 cd0.41 ± 0.01 e
AZ16.25 ± 0.06 bcd0.28 ± 0.06 e2.00 ± 0.10 ab0.42 ± 0.01 e
AZ26.20 ± 0.01 cde0.60 ± 0.03 b0.60 ± 0.20 e0.46 ± 0.01 c
NM16.11 ± 0.01 ef0.54 ± 0.01 c0.57 ± 0.15 e0.47 ± 0.01 bc
NM26.14 ± 0.01 ef0.68 ±0.02 a1.17 ± 0.21 d0.46 ± 0.01 cd
CRPT6.28 ± 0.06 abc0.23 ± 0.02 ef1.23 ± 0.06 d0.45 ± 0.01 d
TAH6.16 ± 0.10 def0.22 ± 0.03 f2.17 ± 0.21 a0.41 ± 0.01 e
AM26.31 ± 0.02 ab0.63 ± 0.03 ab1.90 ± 0.10 b0.48 ± 0.02 b
Data are mean ± standard deviation (n = 3). Different letters in same column indicate significant differences between samples (p ˂ 0.05). All results are presented on dry matter basis.
Table 4. Color attributes (luminosity, a*, and b*) of white hybrid and native corn kernel flours.
SampleLuminositya*b*Color
WHC86.26 ± 0.93 bcd−0.47 ± 0.44 c9.86 ± 0.81 eCrops 05 00026 i001
NJ87.85 ± 3.08 abc2.66 ± 0.35 a4.95± 0.89 fCrops 05 00026 i002
ROP78.33 ± 1.43 e2.96 ± 0.33 a23.03 ± 1.18 cCrops 05 00026 i003
AZ190.80 ± 0.77 a−0.57 ± 0.58 c26.82 ± 1.58 bCrops 05 00026 i004
AZ290.09 ± 0.88 ab−0.27 ± 0.43 c32.79 ± 0.48 aCrops 05 00026 i005
NM186.43 ± 2.38 bcd2.88 ± 0.73 a6.11 ± 0.74 fCrops 05 00026 i006
NM286.13 ± 3.24 cd1.49 ± 0.30 b2.47 ± 0.98 hCrops 05 00026 i007
CRPT82.72 ± 2.49 d3.31 ± 0.18 a2.75 ± 0.86 ghCrops 05 00026 i008
TAH84.65 ± 3.52 cd−0.65 ± 0.16 c12.05 ± 1.79 dCrops 05 00026 i009
AM274.57 ± 0.62 e0.47 ± 0.14 c2.89 ± 0.03 hCrops 05 00026 i010
Data are mean ± standard deviation (n = 3). Different letters in same column indicate significant differences between samples (p ˂ 0.05). All results are presented on dry matter basis. Color square indicate the color of corn flour samples based on Luminosity, a*, and b* parameters.
Table 5. Technological–functional properties of white hybrid and native corn kernel powders.
SampleWSI (%)WAI (g g−1)Swelling Power (%)OAI (%)Emulsifying Capacity (%)Foaming Capacity (%)
WHC7.41 ± 0.10 a2.40 ± 0.07 c5.03 ± 0.32 ef5.52 ± 0.09 a2.97 ± 0.11 b6.31 ± 0.23 ef
NJ5.81 ± 0.12 bc3.29 ± 0.02 a9.33 ± 0.57 a4.70 ± 0.08 c1.91 ± 0.16 c5.19 ± 0.68 fg
ROP6.58 ± 1.61 ab2.63 ± 0.32 c8.42 ± 0.30 b4.70 ± 0.07 c3.67 ± 0.60 a10.03 ± 0.21 c
AZ15.95 ± 0.61 bc2.55 ± 0.04 b6.83 ± 0.67 d4.80 ± 0.04 c3.11 ± 0.34 b7.99 ± 1.34 de
AZ26.45 ± 0.20 abc2.41 ± 0.08 c6.82 ± 0.42 d5.41 ± 0.13 a1.98 ± 0.07 c12.13 ± 1.46 b
NM15.51 ± 0.06 c2.09 ± 0.04 f5.49 ± 0.26 e5.17 ± 0.16 b1.44 ± 0.08 d16.70 ± 1.91 a
NM26.16 ± 0.36 bc2.16 ± 0.03 e3.58 ± 0.09 g5.03 ±0.25 b2.02 ± 0.17 c9.77 ± 1.22 cd
CRPT6.21 ± 0.34 bc2.13 ± 0.03 ef4.69 ± 0.31 f4.74 ± 0.04 c2.84 ± 0.42 b7.42 ± 1.70 e
TAH5.48 ± 0.40 c2.54 ± 0.02 b7.56 ± 0.64 c4.79 ± 0.08 c2.95 ± 0.11 b7.03 ± 0.63 ef
AM25.43 ± 0.39 c2.24 ± 0.01 d3.96 ± 0.18 g5.17 ± 0.12 b3.12 ± 0.16 b3.52 ± 0.94 h
Data are mean ± standard deviation (n = 3). Different letters in same column indicate significant differences between samples (p ˂ 0.05). WSI: water solubility index; WAI: water absorption index; OAI: oil absorption index. All results are presented on dry matter basis.
Table 6. Contents of soluble phenols, flavonoids, anthocyanins, carotenoids, and condensed tannins of white hybrid and native corn kernel powders.
SampleTSP
(mg GAE/g)
CT
(mg CE/g)
FLA
(mg CE/g)
TA
(mg C3G/g)
TC
(mg βCE/g)
WHC10.02 ± 1.24 d1.33 ± 0.14 b2.56 ± 0.77 e˂LOD˂LOQ
NJ23.23 ± 0.57 e0.30 ± 0.08 d19.96 ± 0.77 a˂LOD˂LOQ
ROP27.49 ± 2.29 c0.38 ± 0.08 d20.86 ± 0.17 a˂LOD˂LOQ
AZ119.01 ± 0.18 fg0.90 ± 0.10 c14.42 ± 0.83 c˂LOD0.42 ± 0.02 a
AZ215.66 ± 1.47 g0.22 ± 0.08 d14.64 ± 0.05 c˂LOD0.29 ± 0.05 b
NM122.26 ± 0.26 ef0.99 ± 0.34 bc16.60 ± 0.50 b˂LOD0.14 ± 0.01 c
NM233.03 ± 1.95 b 0.47 ± 0.08 d17.83 ± 0.01 b0.04 ± 0.001 b˂LOQ
CRPT17.18 ± 0.83 g2.83 ± 0.17 a14.67 ± 0.13 c˂LOD0.29 ± 0.02 b
TAH17.18 ± 0.18 g0.34 ± 0.01 d10.65 ± 0.56 d˂LOD0.08 ± 0.01 d
AM238.76 ± 1.05 a0.93 ± 0.17 c16.89 ± 0.18 b0.10 ± 0.01 a˂LOQ
Data are mean ± standard deviation (n = 3). Different letters in same column indicate significant differences between samples (p ˂ 0.05). TSP: total soluble phenols; FLA: total flavonoids; TA: total anthocyanins; CT: condensed tannins; TC: total carotenoids; GAE: galic acid equivalent; CE: catechin equivalent; C3G: Cyanidin-3-gñlucoside; βCE: β-carotene equivalent. LOD: limit of detection; LOQ: limit of quantification. All results are presented on dry matter basis.
Table 7. Antioxidant activity of white hybrid and native corn kernel powders.
SampleDPPH (mmol TE/g)ABTS (mmol TE/g)FRAP (mmol TE/g)
WHC26.46 ± 0.37 a12.79 ± 0.23 g31.16 ± 1.87 f
NJ24.44 ± 0.33 bc22.45 ± 0.23 c46.46 ± 5.12 a
ROP24.78 ± 0.23 b16.86 ± 0.24 ef33.30 ± 2.54 ef
AZ123.86 ± 0.29 c15.83 ± 0.24 f26.80 ± 1.41 g
AZ224.31 ± 0.46 bc17.40 ± 0.24 e37.99 ± 1.24 c
NM124.06 ± 0.03 c24.34 ± 0.38 b37.33 ± 4.07 cd
NM220.44 ± 0.26 d21.37 ± 1.50 d43.29 ± 3.17 b
CRPT24.31 ± 0.29 bc19.36 ± 0.19 e30.24 ± 2.46 f
TAH23.87 ± 0.12 c25.64 ± 0.29 a34.66 ± 0.98 de
AM219.86 ± 0.35 e26.15 ± 0.29 a31.55 ± 2.01 ef
Data are mean ± standard deviation (n = 3). Different letters in same column indicate significant differences between samples (p ˂ 0.05). All results are presented on dry matter basis.
Disclaimer/Publisher’s Note: The statements, opinions and data contained in all publications are solely those of the individual author(s) and contributor(s) and not of MDPI and/or the editor(s). MDPI and/or the editor(s) disclaim responsibility for any injury to people or property resulting from any ideas, methods, instructions or products referred to in the content.

