Communication

The Impact of Planting Density and Intermediate Skips on Grain Sorghum Yields

1
Department of Agronomy, University of Florida, Gainesville, FL 32611, USA
2
Department of Plant and Soil Sciences, Oklahoma State University, Stillwater, OK 74078, USA
*
Author to whom correspondence should be addressed.
Crops 2025, 5(3), 25; https://doi.org/10.3390/crops5030025
Submission received: 28 March 2025 / Revised: 15 April 2025 / Accepted: 23 April 2025 / Published: 1 May 2025

Abstract

:
Planting density can influence the growth and potential yield of grain sorghum systems, particularly in resource-limited environments. Therefore, documenting the sorghum’s response to different planting densities is essential for understanding crop behavior in relation to optimal yields. A study was conducted in Lahoma and Perkins, Oklahoma, in 2019 and 2020 to assess the impact of varying planting densities and within-row planting in-row gaps. Planting density varied from 43,225 to 223,500 plants ha−1. Three additional treatments were implemented at 148,000 plants ha−1 with 0.3, 0.6, and 0.9 m gaps. An increase in plant density resulted in higher yields at Lahoma in 2019. However, at Perkins in 2019 and 2020, yields were optimized at 148,000 and 111,000 plants ha−1, respectively, and decreased as planting densities diminished. In-row gaps of 0.3 and 0.6 m did not significantly affect yields across all site-years; however, at Perkins, the 0.9 m gap significantly reduced yields compared to stands without gaps in both years. Overall, a direct relationship was observed between sorghum yields and planting density. Further evaluation of in-row gaps and how planting management should be adjusted is warranted based on the presented information.

1. Introduction

Grain sorghum (Sorghum bicolor) is a cereal grain crop that originated in Africa but is now an emerging row crop across semi-arid regions of the United States [1]. The primary use of sorghum is within the animal production industry, where the grain is used as feedstuff for both cattle and poultry production [2]. In the United States, most of the sorghum is produced in the southern Great Plains and harvested primarily for grain or silage [3,4]. While sorghum varieties have improved through increased yield [5], production hectarage and productivity have decreased. In 2016, the sorghum production in the United States amounted to 12,199,190 Mg which decreased to 9,241,760 Mg in 2017 [6]. Sorghum yield potential is influenced by several factors, including cultivar variants, adoption of new technology, production methods, and regional cultural practices [7]. Despite these production limitations, as well as uncontrollable environmental factors, sorghum production can still be improved with a better understanding of crop production practices focused on improving productivity and thus, economic returns.
As with most crops, management decisions of planting practices are critical and ultimately relate to final yields. Manipulating agronomic practices such as planting density can aid sorghum productivity in the southern Great Plains [8,9]. Planting at various densities often comes with benefits and challenges. Planting at higher densities provides increased soil coverage and therefore increases the utilization of solar radiation within the crop canopy. Planting at lower densities can conserve soil moisture while closing yield gaps, which are often associated with lower planting rates, through tiller production. One of the greatest factors that planting densities impact is tiller production; however, the extent of this impact is confounding in the literature [10,11,12]. Bandaru et al. [1] showed that planting at higher densities decreased tiller production in sorghum, which resulted in up to a 100% increase in yields.
Much of the current literature has evaluated planting densities on consistent stands; however, in a practical environment this is often not the case. Variability in plant density can arise as a result of excessive row spacing or gaps between plants due to uneven germination, planter skips, or abiotic or biotic stress events causing early-season loss of plants due to unfavorable environmental conditions or pest pressure. While these non-uniform stands can cause improper management of the field, as well as other issues, reports on their true impact on yield have been variable. Nielsen [13] reported that non-uniformity of within-row plant spacing may reduce grain yield. However, within-row plant spacing has been correlated with more severe yield loss within lower populations compared to higher planting populations [14]. Alternatively, Liu et al. [15] and Erbach et al. [16] suggested that grain yield is not affected by plant spacing.
As interest in grain sorghum production throughout semi-arid production systems grows, it is becoming critical to determine how yield of grain sorghum responds when planted at different densities and across various spacings. The objectives of this study are to (1) evaluate the impact of planting density on grain yield and (2) quantify the response of grain sorghum yield to within-row plant spacing. Evaluating plant densities is a critical tool for sound agronomic management. Further evaluation based on uneven stands or in-row gaps will greatly improve the applicability of this information.

2. Materials and Methods

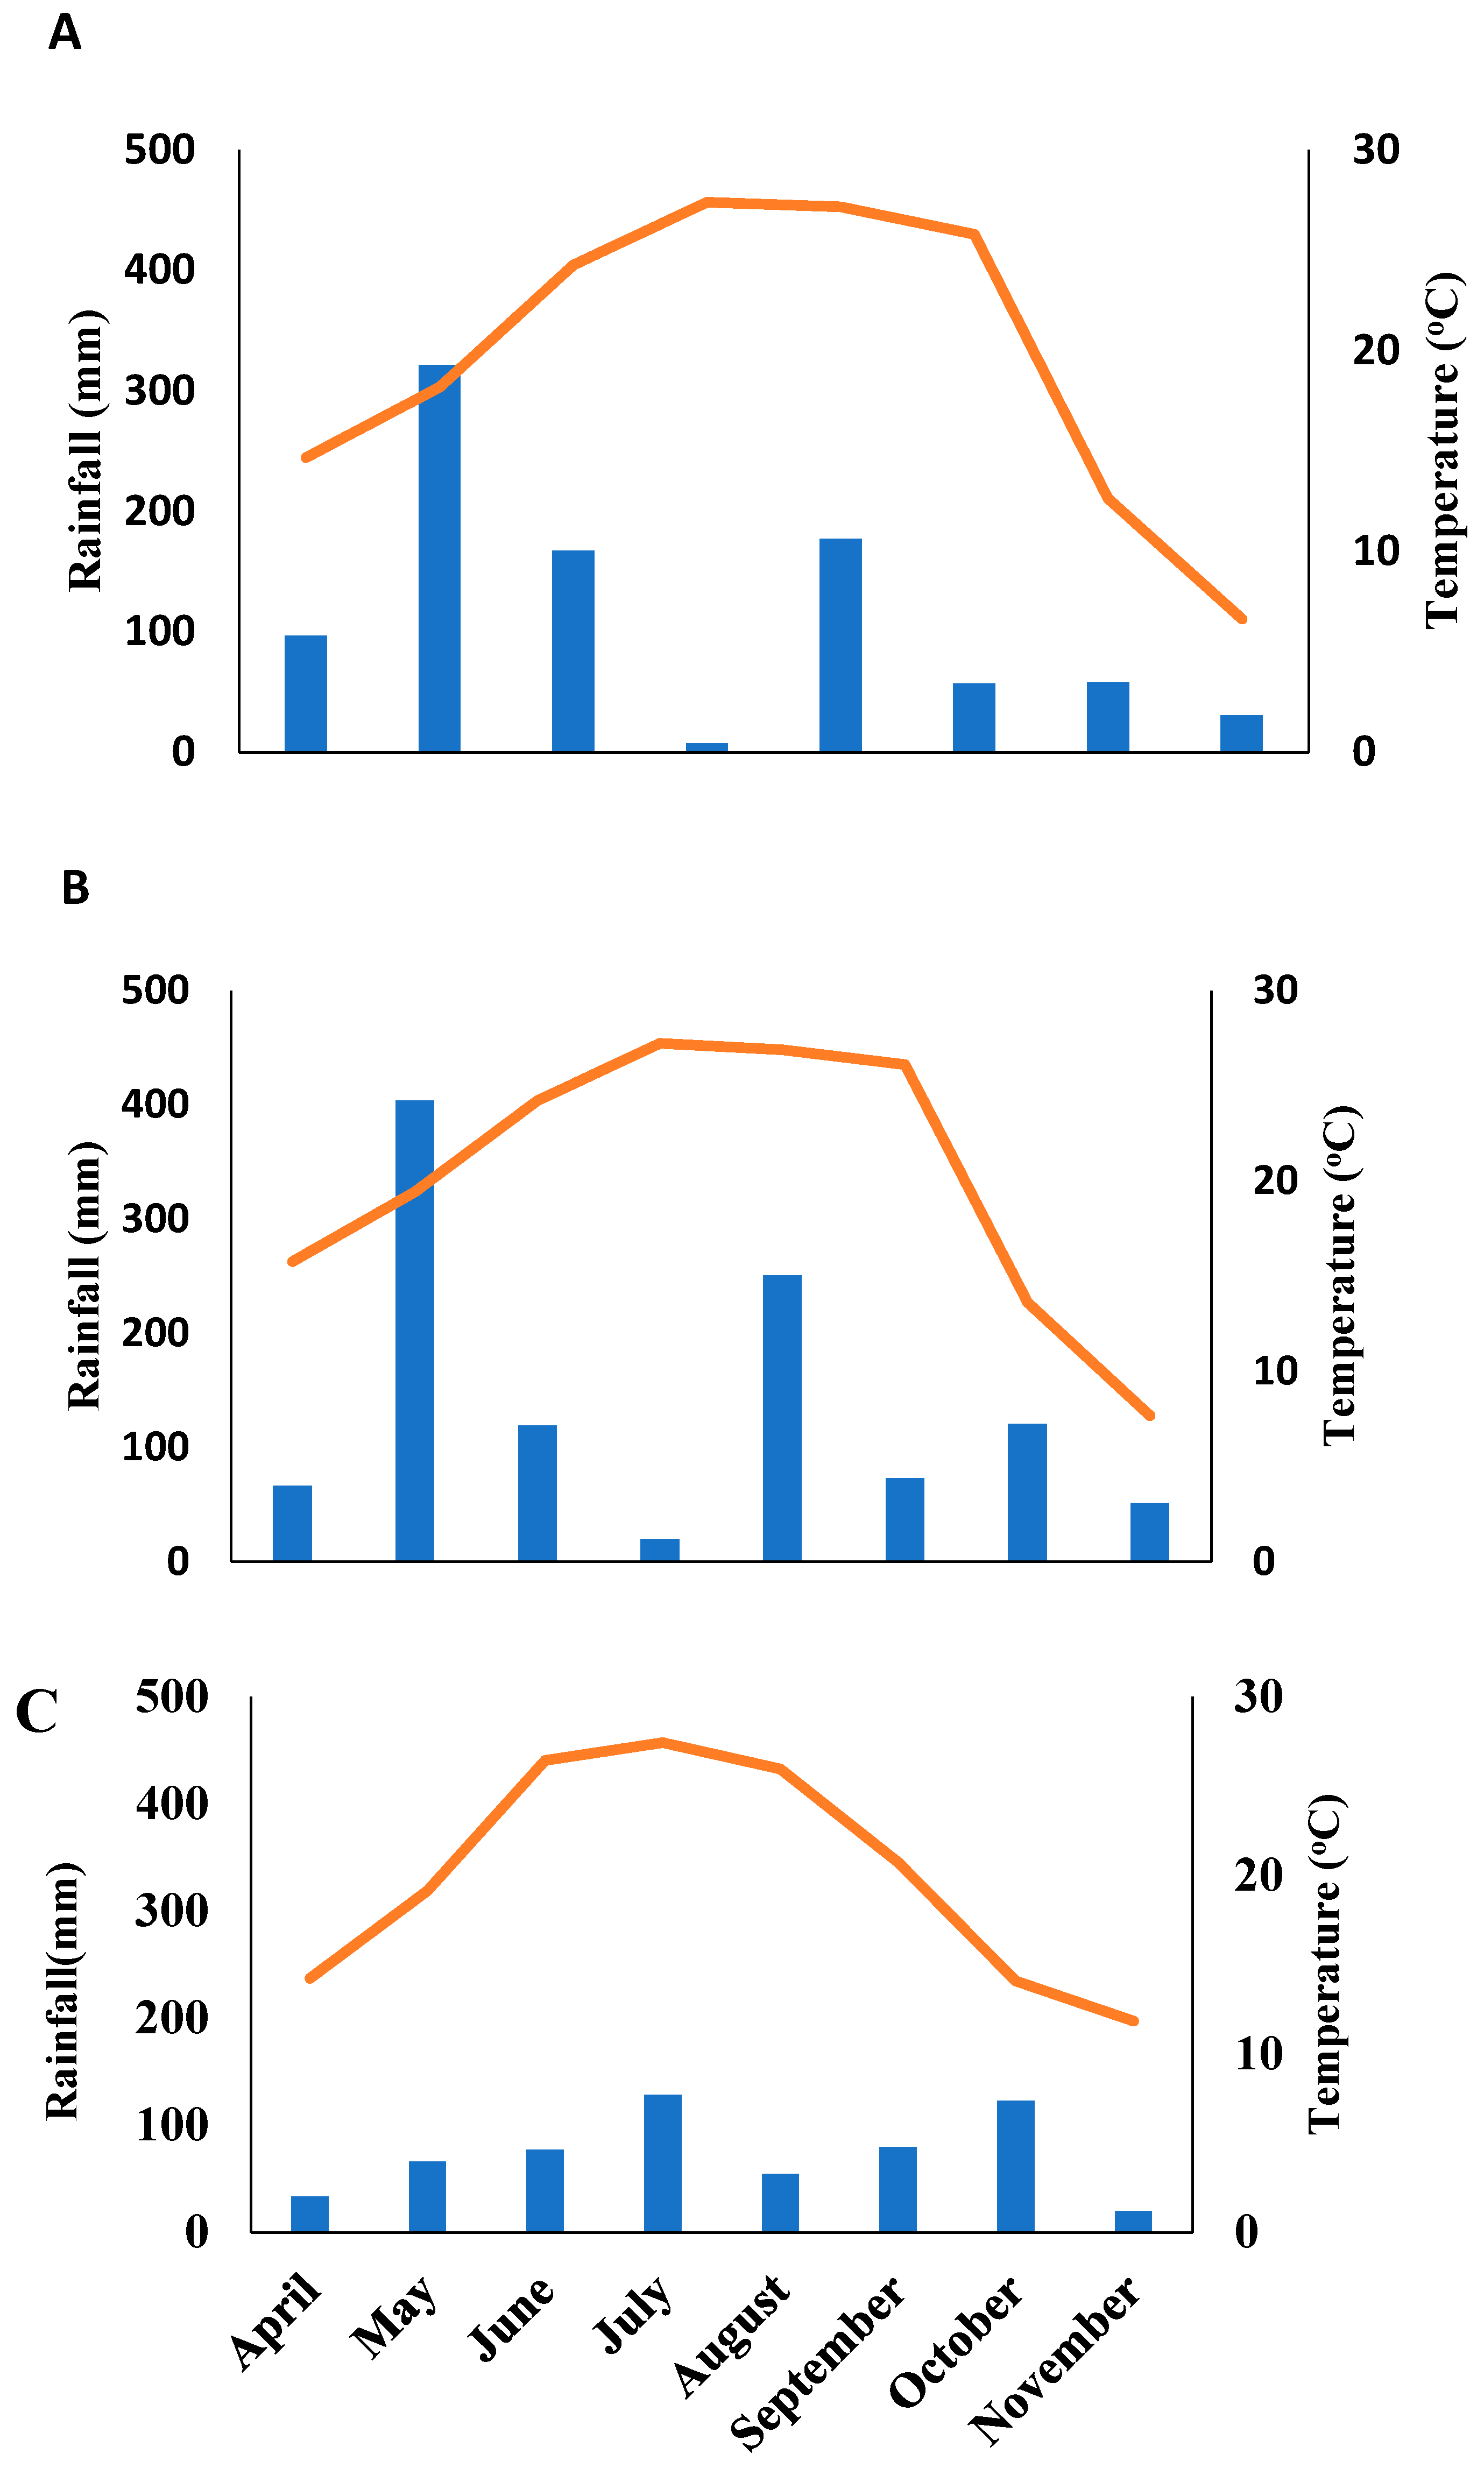
2.1. Experimental Locations and Conditions

Field experiments were established at the Oklahoma State University North Central Research Station near Lahoma, Oklahoma, in 2019 and at the Cimarron Valley Research Station in Perkins, Oklahoma, in 2019 and 2020. The temperatures and rainfall for each year and location are listed in Figure 1. Overall, the 2019 growing season was within a couple degrees of normal throughout the growing season. Precipitation patterns drastically varied from normal conditions, with the months of April and May being 50 and 150 mm above average for April and May, respectively. However, July and August were well below average with 95 and 15 mm precipitation, respectively). The 2020 season had a more consistent moisture pattern compared to the long-term average. The primary difference was that the moisture levels were consistently below average (50 to 90 mm) throughout the growing season, excluding August, for which the moisture level was nearly 100 mm above average. The dominant soil series and soil descriptions for the different site years are listed in Table 1. Prior to plot establishment, soil samples were collected across the trial areas and submitted to the Soil, Water, and Forage Analytical Laboratory at OSU. These samples were used to guide nutrient applications according to OSU Extension recommendations.

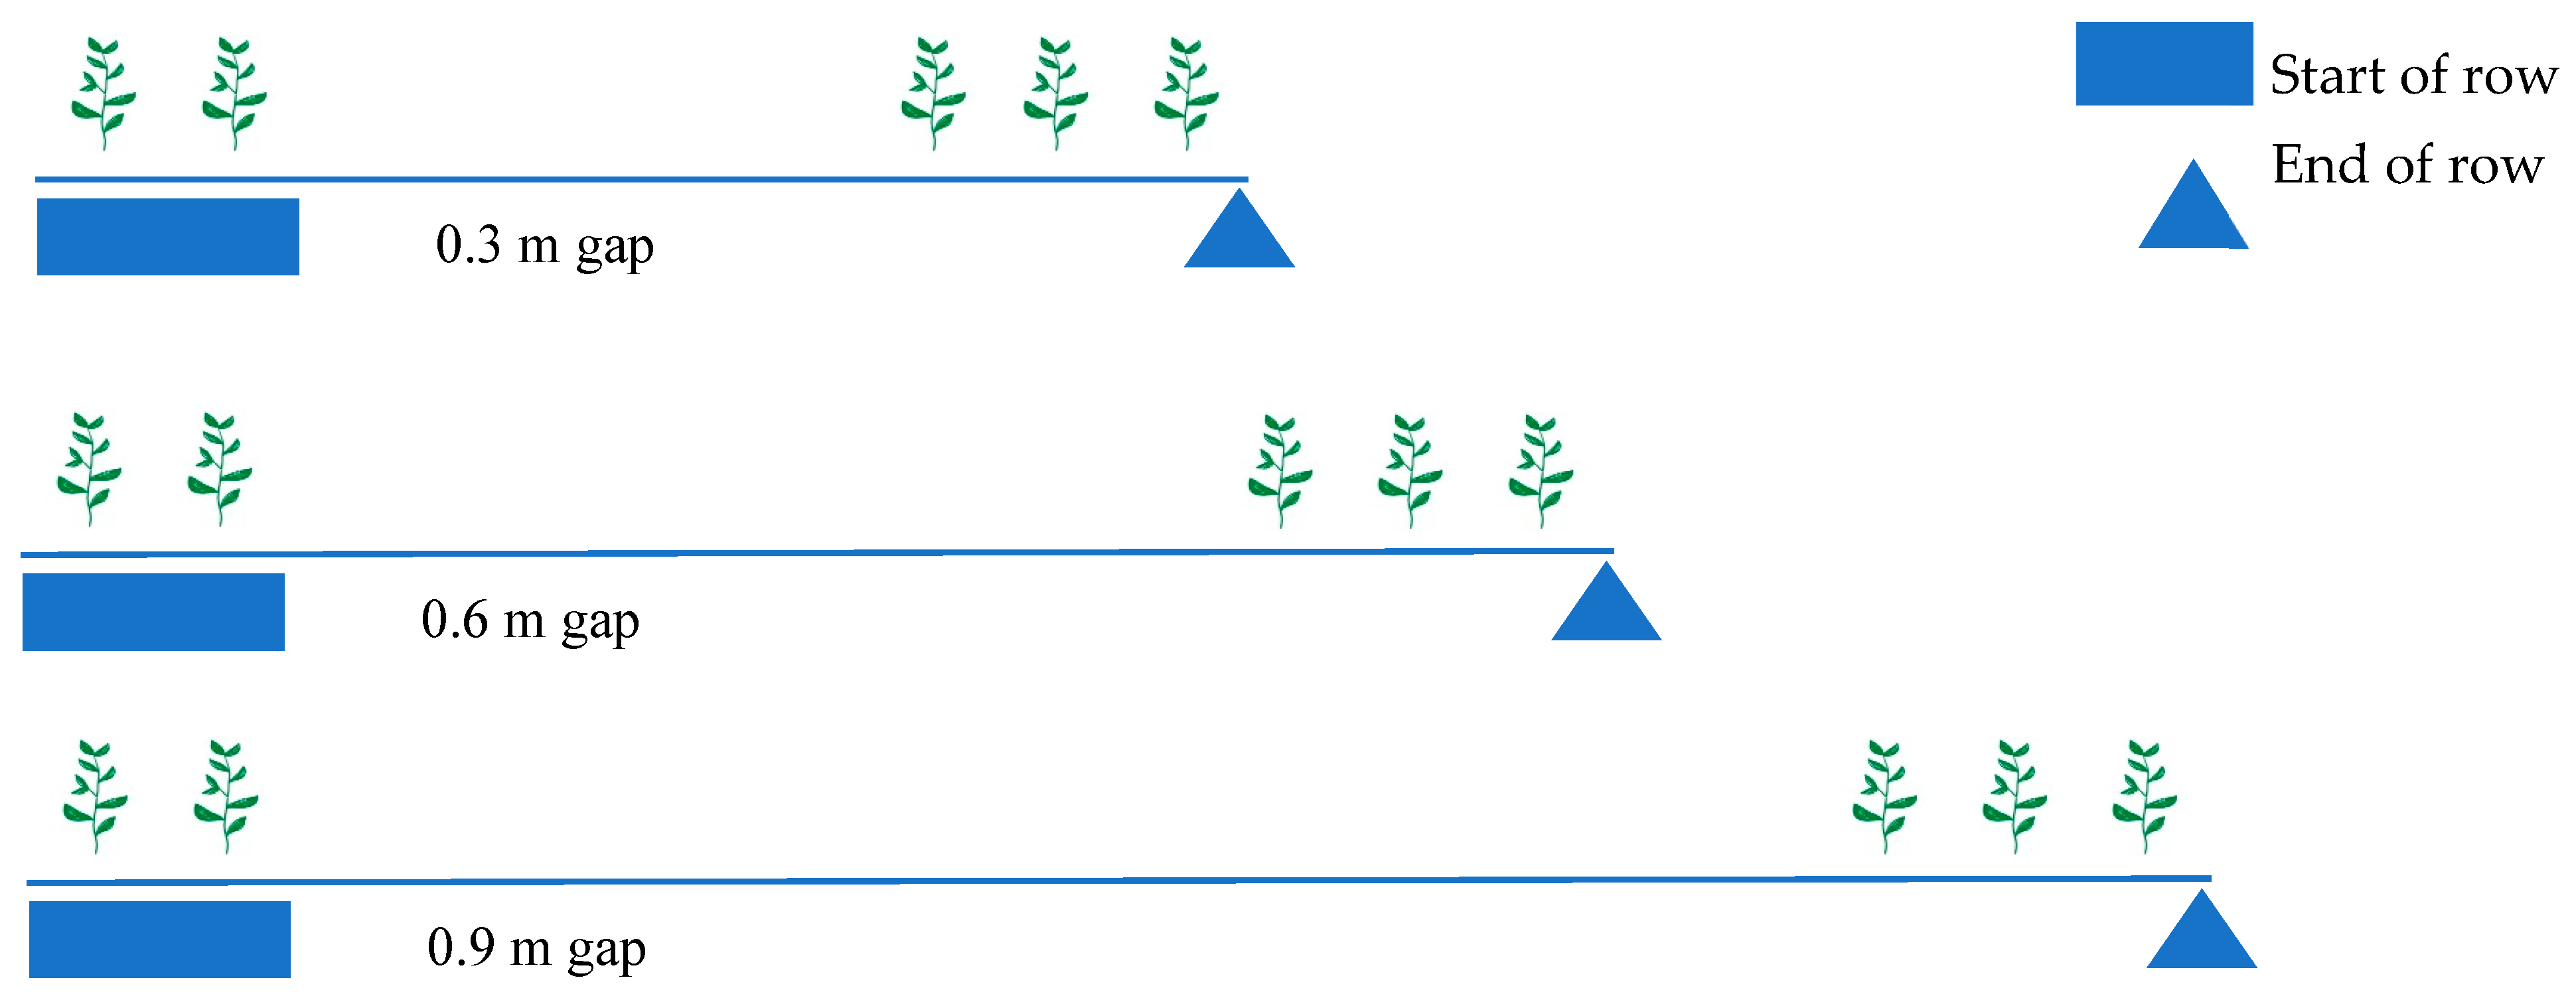
2.2. Experimental Design and Treatments

Field trials were arranged in a single factor randomized complete block design with four replications at each location. Six planting densities (43,225; 74,100; 111,150; 148,200; 185,250; 222,300 plants ha−1) were utilized to evaluate the influence of various planting densities. All plots were initially planted to a higher density and manually thinned to achieve the desired density while also achieving even plant spacing. Three additional treatments evaluating plant spacing were included in this study, in which plants were established at a density of 148,200 plants ha−1 with a single 0.3, 0.6, and 0.9 m gap within the row by manual removal of plants 30 days after planting to create the desired gap (Figure 2). The layout and design of the experiment were similar across locations and years. Plots measured 1.5 m wide and 9.1 m long with two rows per plot planted 0.76 m apart.

2.3. Agronomic Management

Agronomic management, including planting and harvest dates, as well as hybrid use, are outlined in Table 2. At planting, a combination of S-metolachlor (S-metolachlor) at 395 g a.i. L−1 and atrazine (Bicep Lite II Magnum) at 321 g a.i. L−1 (Syngenta; Basel, Switzerland) were applied at the rate of 4.23 L ha−1. In-season weed pressure was managed by physical control. Throughout the season, all agronomic management was conducted in accordance with the best management practices outlined by the Oklahoma Cooperative Extension Service.

2.4. Harvesting and Yield Management

Plants were desiccated once physiological maturity was reached with less than 30% grain moisture using glyphosate (Roundup PowerMAX; Monsanto; St. Louis, MO, USA) at 1728 g a.e. ha−1. Grain moisture was recorded every other day after the black layer was achieved. Moisture was determined by taking a sample of the grain and analyzing it with a hand-held Dickey-John moisture meter (Dickey-John Corporation, Auburn, IL, USA). Fifteen days following application, plots were harvested using a Wintersteiger small plot combine (Wintersteiger; Ried im Innkreis, Austria). Plot weights were used to estimate the yield on a per-hectare basis.

2.5. Statistical Analysis

Statistical analysis was conducted using SAS V9.4 (SAS Institute, Cary, NC, USA). An analysis of variance was performed to determine the impact of planting density on grain yield using a mixed procedure. Planting density was considered to be the only fixed effect, while replication, year, location, and their interactions were considered random effects. Due to significant interactions between both year and location within treatment, all site years were analyzed separately. A post hoc analysis was conducted using Tukey adjustment to determine differences between individual treatment means. All of the analyses and the mean separation were performed with an α = 0.05.

3. Results and Discussion

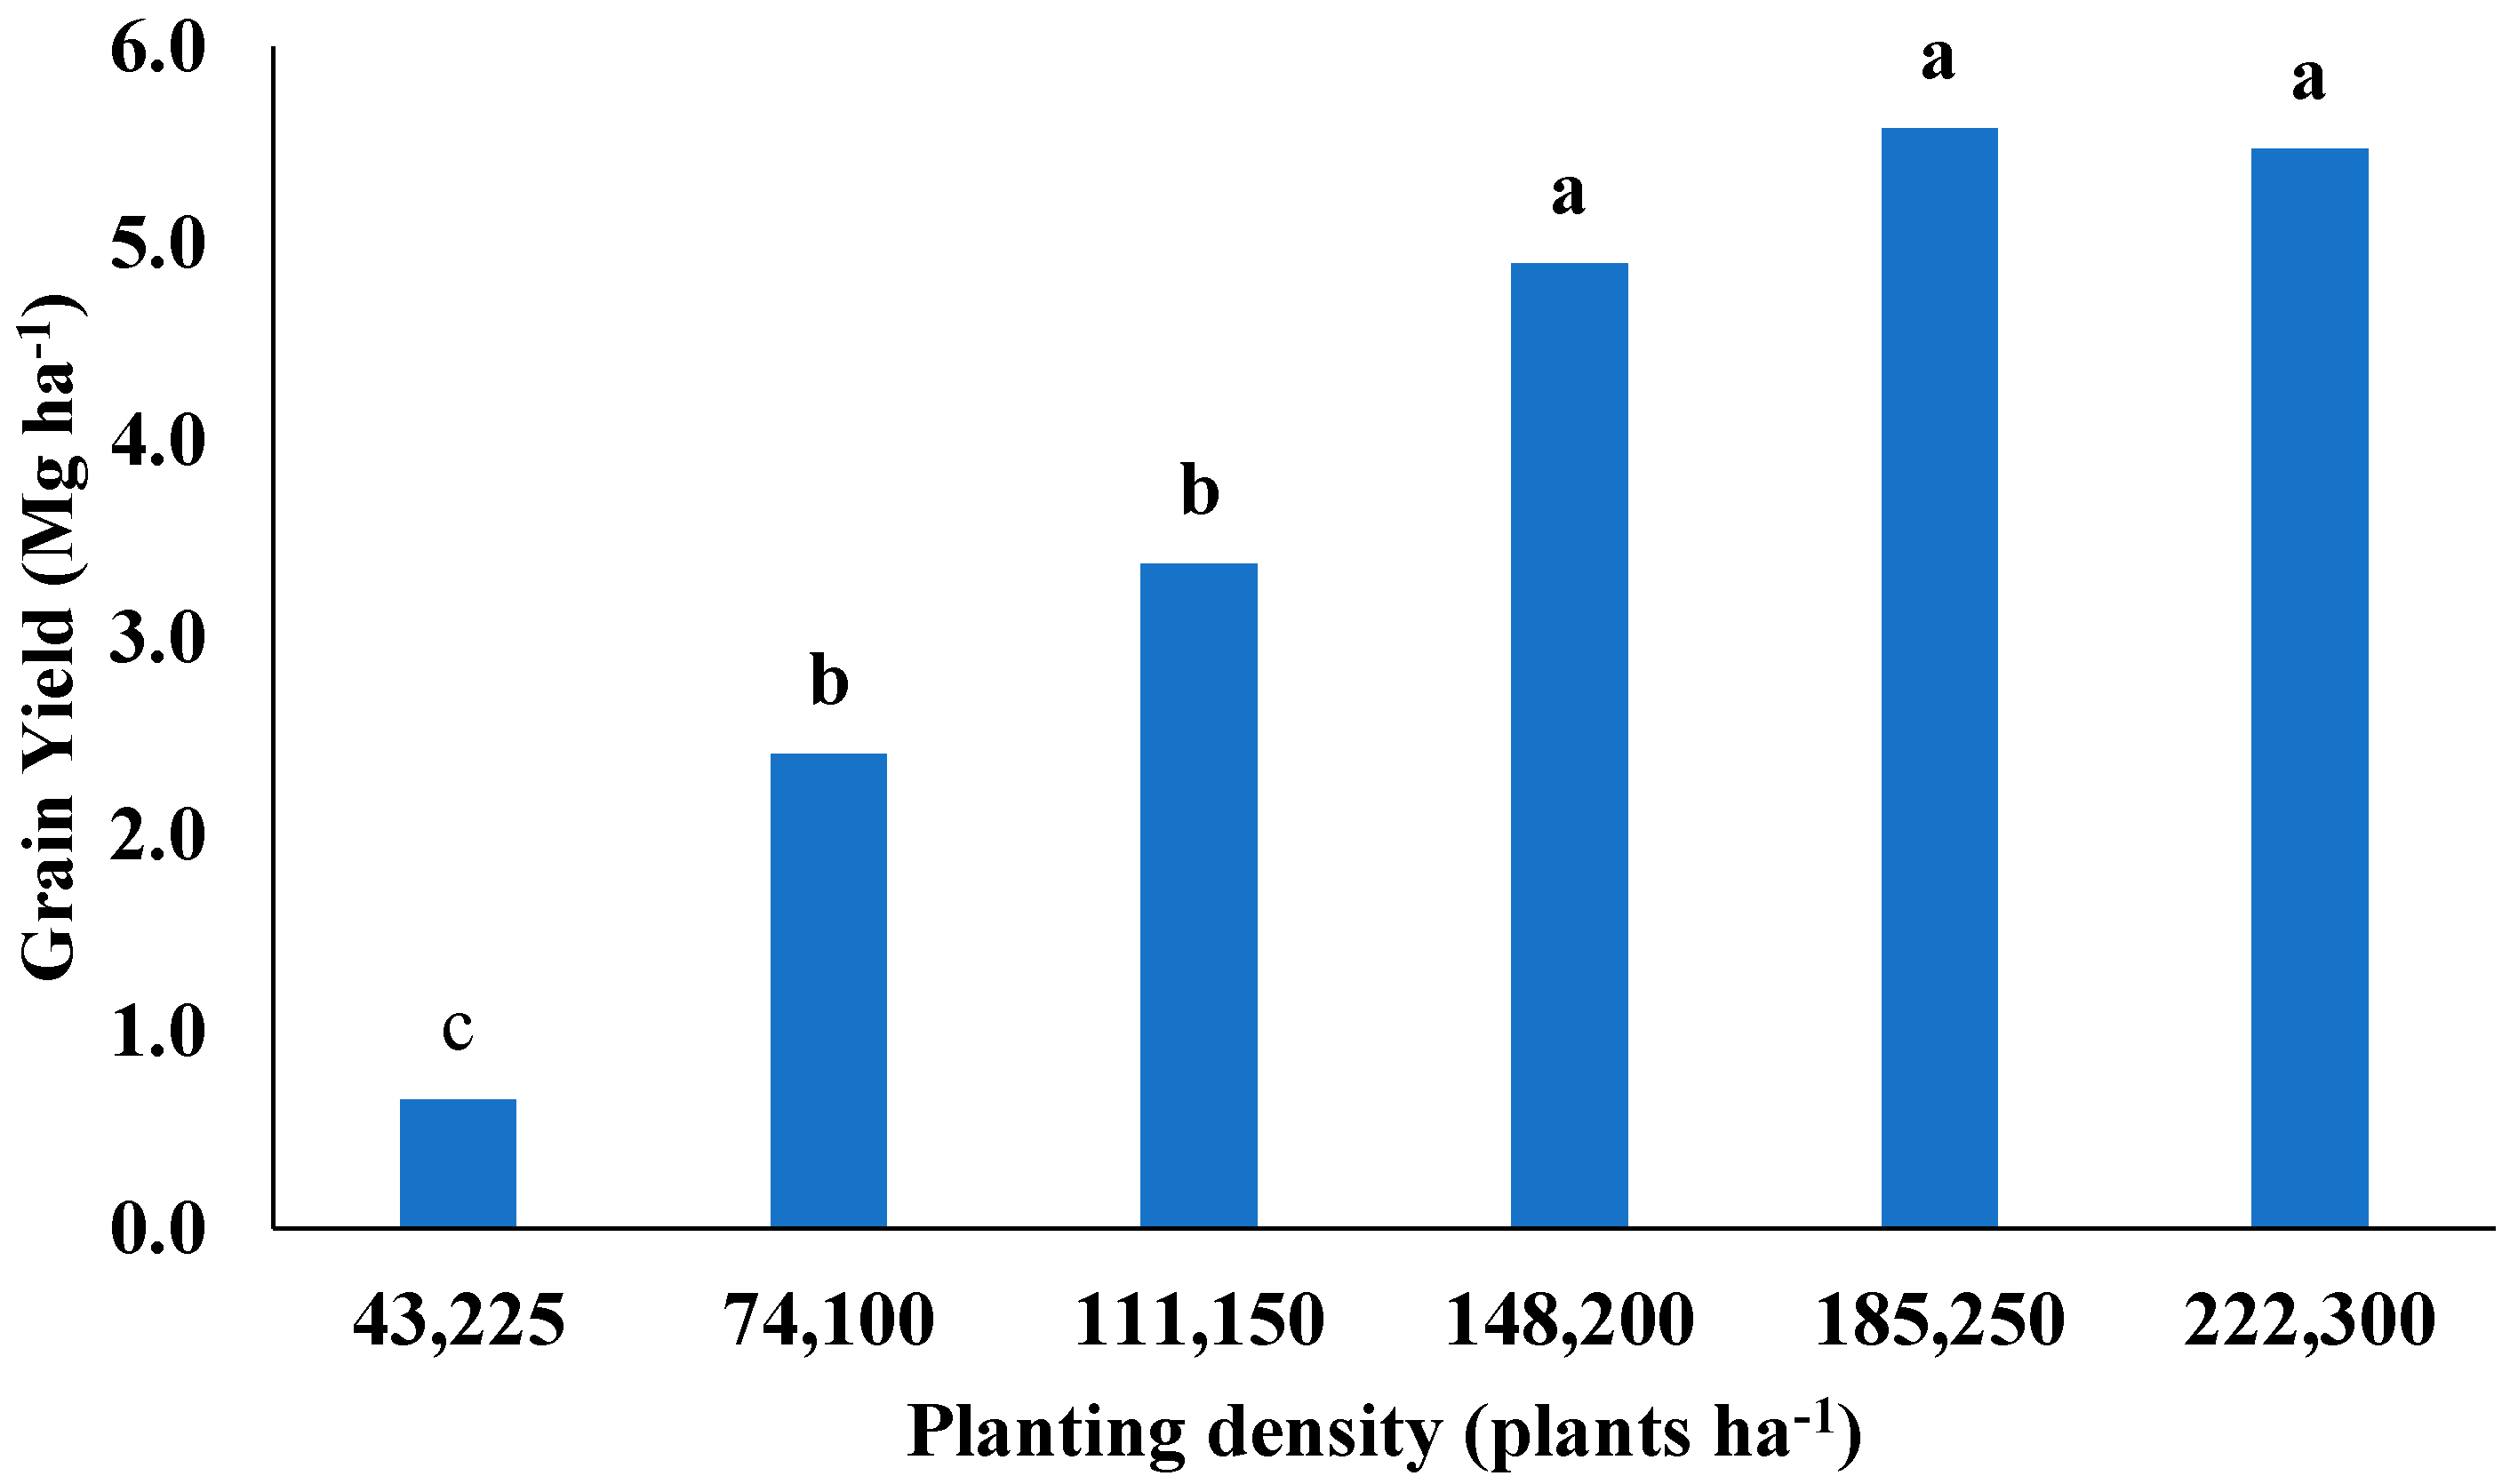
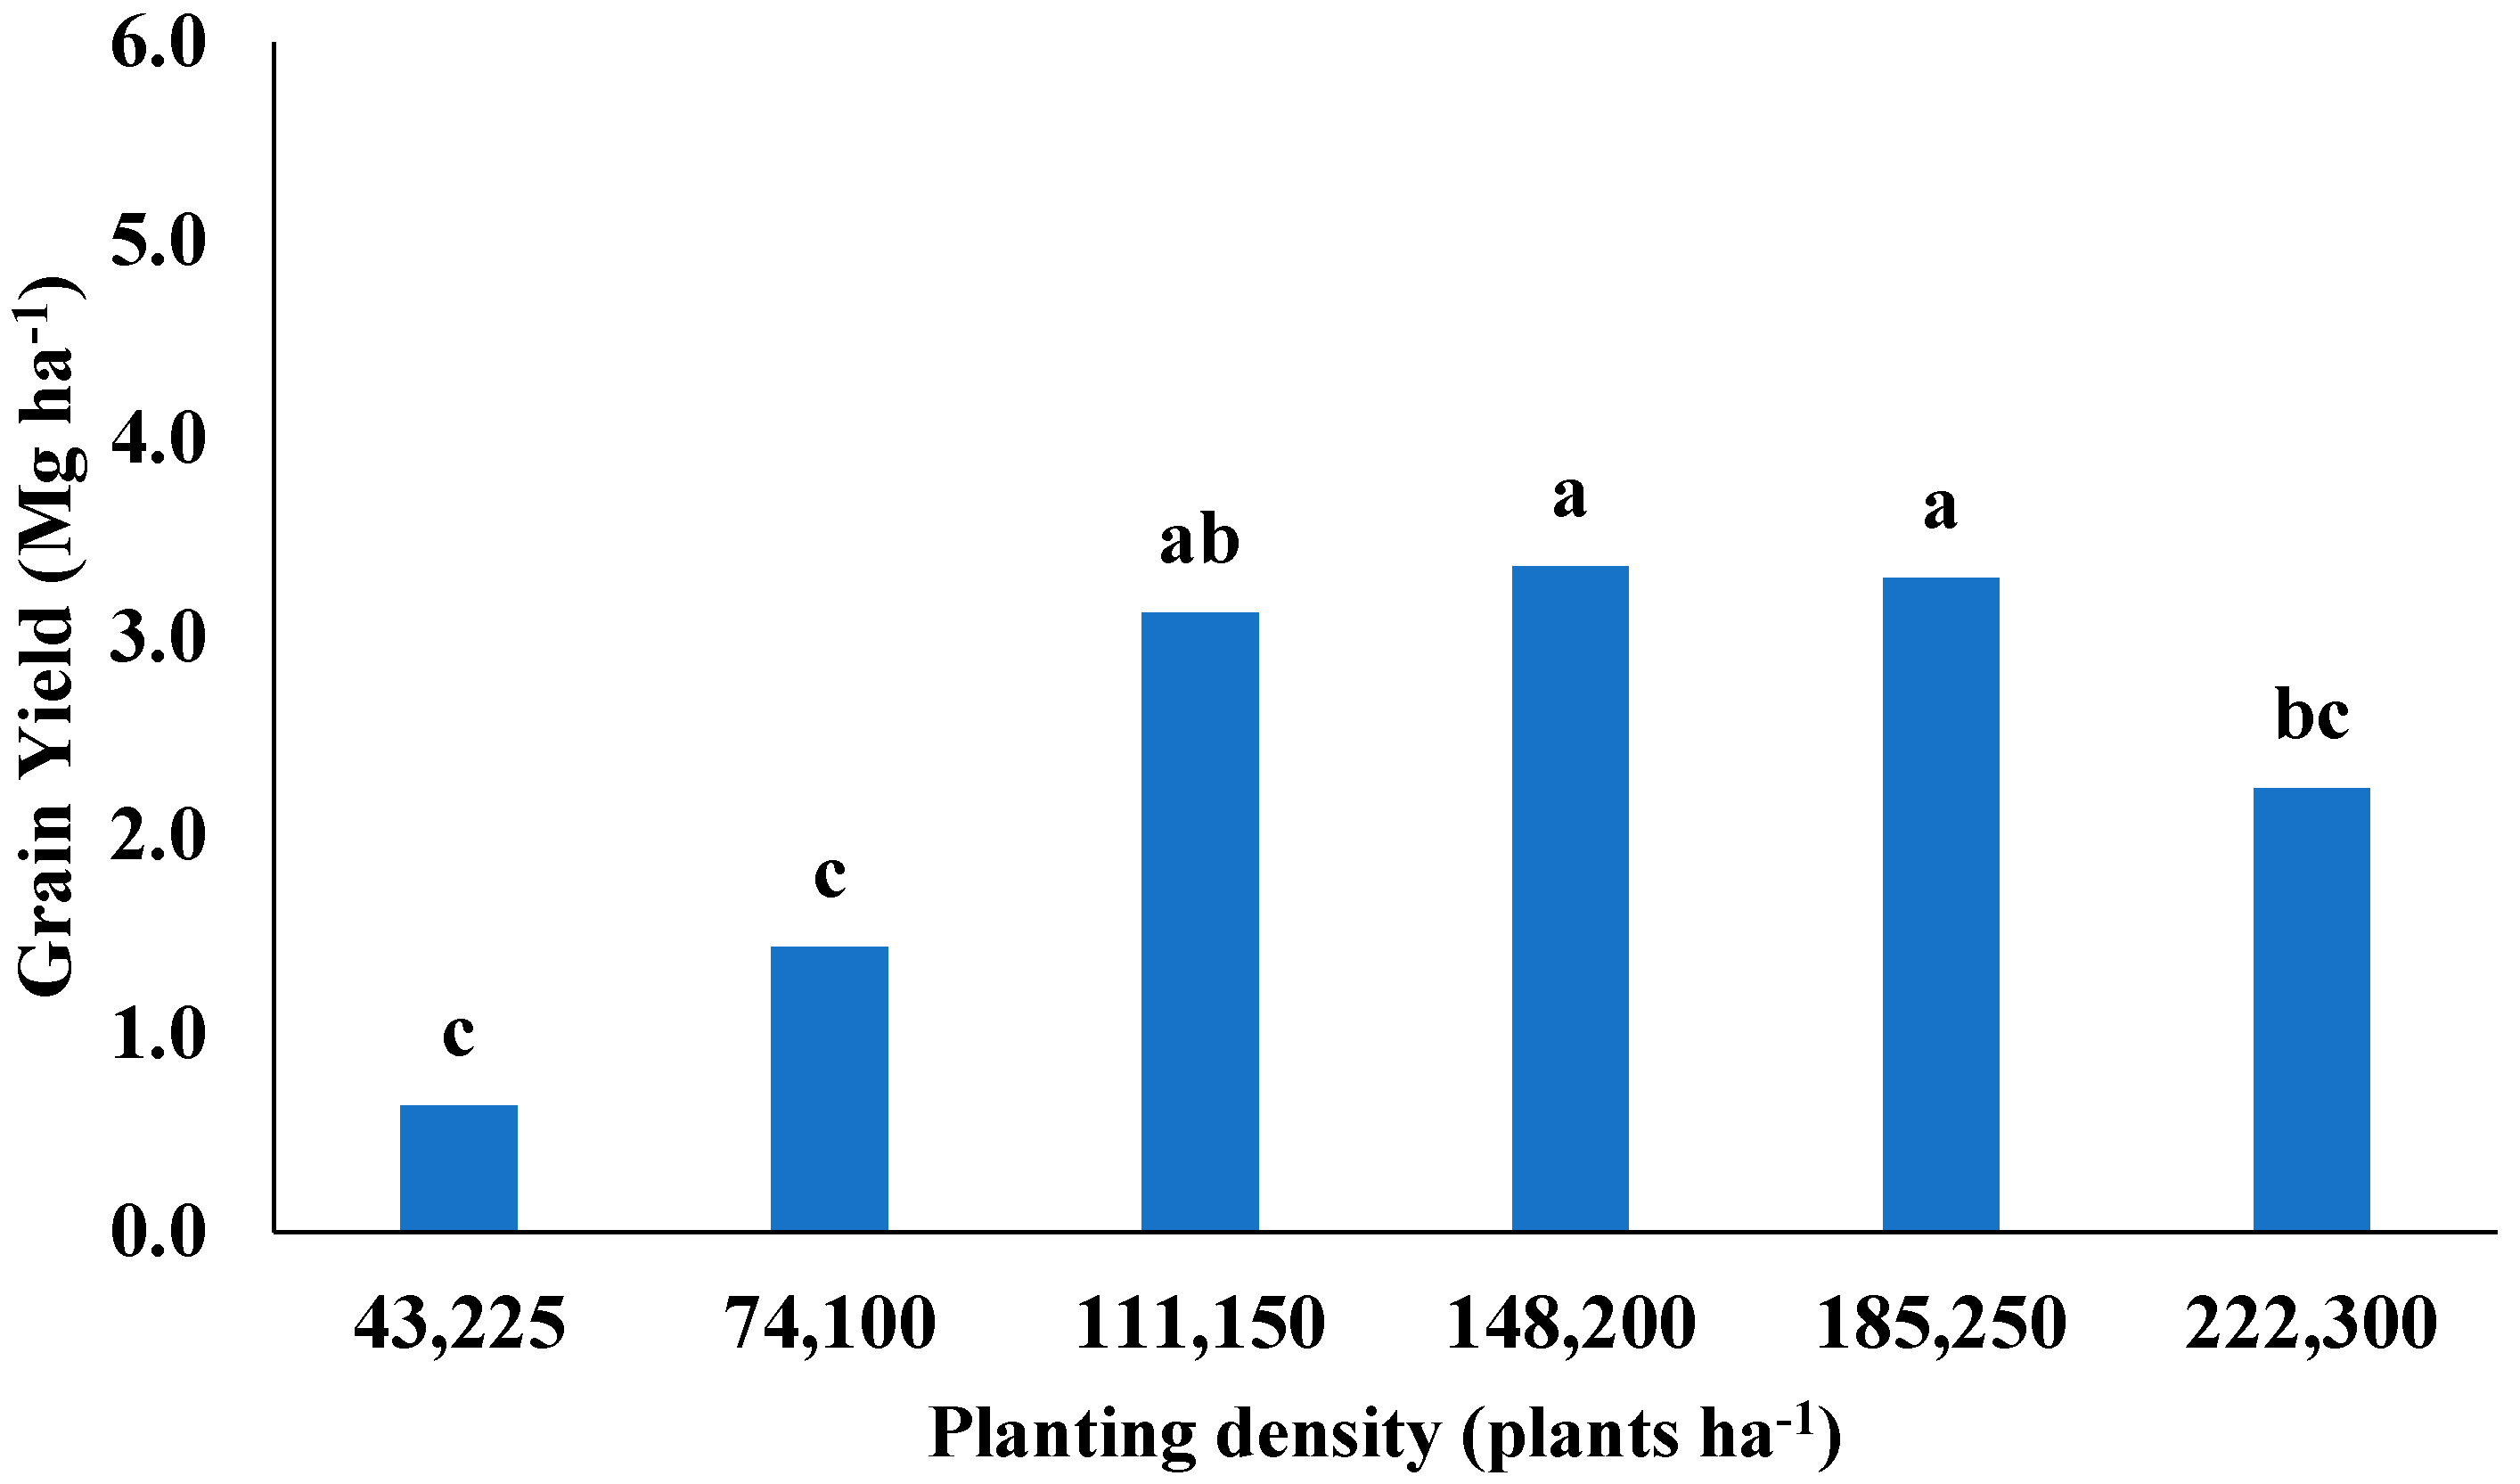
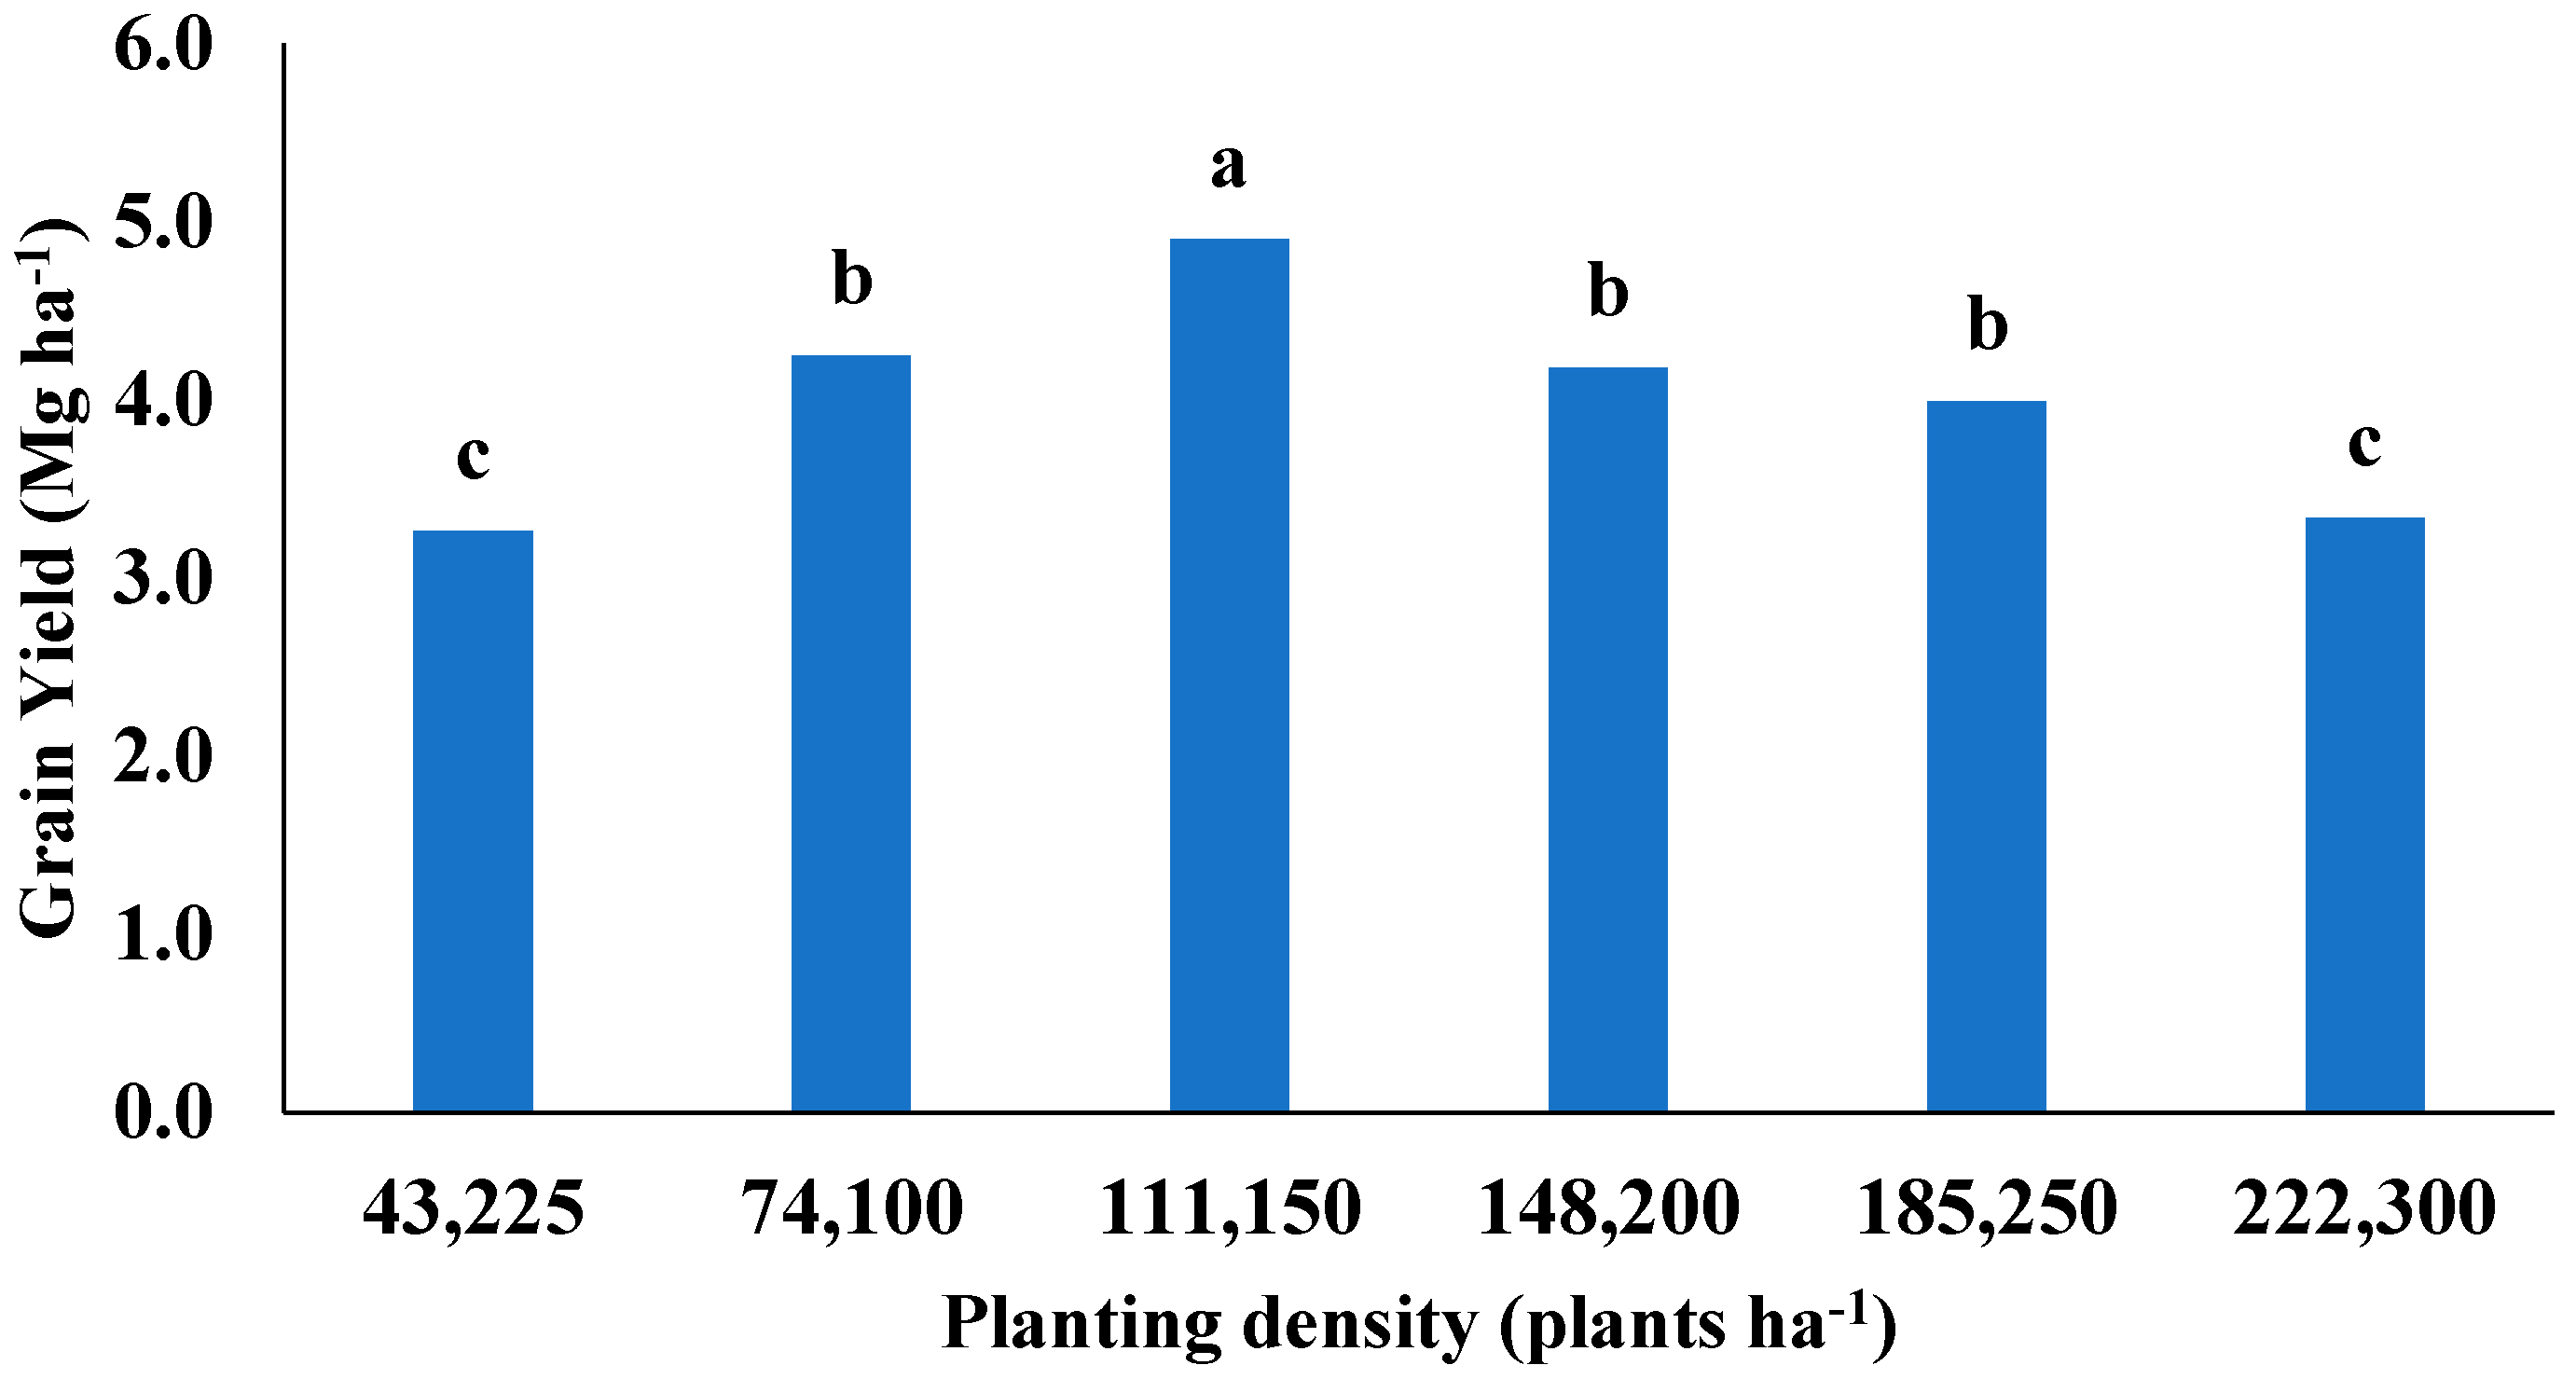
3.1. Grain Sorghum Yield from Planting Density

Yields were variable by year and location. Yields ranged from 0.6 to 5.6 Mg ha−1 at Lahoma in 2019, 0.6 to 3.4 Mg ha−1 at Perkins in 2019, and 3.2 to 4.8 Mg ha−1 at Perkins in 2020 (Figure 3, Figure 4, Figure 5, Figure 6, Figure 7 and Figure 8). The yield variation was a result of differences in environmental conditions (Figure 1) that were experienced at the respective locations. While all grain sorghum yields increased from the lowest planting density to an optimum density at each location, the highest density and impact of planting density varied between years and locations. Therefore, locations and years were analyzed separately.
The grain sorghum yield differed significantly with different planting densities at Lahoma in 2019. Generally, grain sorghum yield increased in tandem with increasing planting density (Figure 3). The lowest yield (0.7 Mg ha−1) was recorded at the 43,225 plants ha−1 treatment, which was significantly lower than all other planting densities. The highest yield was the 185,250 plants ha−1 treatment, which yielded 5.6 Mg ha−1. However, this was not significantly different from 148,200 and 223,500 plants ha−1 treatment, which yielded 4.9 and 5.4 Mg ha−1, respectively. Both the 74,000 and 111,150 plants ha−1 planting densities resulted in significantly lower yields than the highest-yielding planting densities but were not significantly different from each other.
Significant differences in yield between plant densities were observed at Perkins in 2019. The highest yield of 3.4 Mg ha−1 was observed at 148,200 plants ha−1. This was significantly different from that achieved at 43,225 plants ha−1, for which the lowest yield of 0.6 Mg ha−1 was recorded. Additionally, the 148,200 and 185,250 plants ha−1 planting densities provided a significantly higher yield than 222,300 plants ha−1 (Figure 4).
As was the case in 2019, grain sorghum yields varied significantly across plant densities in 2020. At Perkins in 2020, the 111,150 plants ha−1 planting density yielded 4.9 Mg ha−1, which was significantly higher than all other treatments (Figure 5). No significant differences were found among the 74,100, 148,200, and 185,200 plants ha−1 planting densities. Also, 43,225 and 223,500 plants ha−1 resulted in recorded yields that were not significantly different, yielding 3.2 and 3.3 Mg ha−1 respectively.
The highest planting densities resulting in the greatest yields at Lahoma in 2019 was unexpected. In the Oklahoma Grain Sorghum Performance Trialin 2017, a maximum yield of 4.5 Mg ha−1 was recorded with a plant density of 135,850 plants ha−1 [17]. This location is typically associated with more drought-prone soils, which often result in drier conditions during critical growth stages. This would benefit lower planting densities, as the crop would be able to take advantage of tiller production during optimal or above-average conditions [18]. The yields of this study are correlated with a higher planting density, which could be attributed to a greater accumulation of total biomass. This result was in agreement with the findings of Welch et al. [19] and Staggenborg et al. [20], who reported increased production of grain sorghum with increased densities in the presence of adequate growing conditions.
When optimum conditions, like above-average rainfall and temperatures, are present, higher planting densities can support a higher yield potential [19,20]. Lahoma received a high amount of rainfall during the active growing season, which was above the 30-year average [21]. This higher rainfall resulted in early-season flooding, which did not impact the overall integrity of the site location, but the lower planting densities were more severely impacted by late-season weed pressure that escaped early-season control measures. This resulted in the areas with higher planting densities being able to take advantage of more favorable moisture conditions; they were also better able to compete against late-season weed pressure, as early-season flooding events diminished herbicide activity. The lower densities could have also taken advantage of these conditions, but the competition due to weed pressure had a greater impact. While this was not a direct impact of planting densities, the indirect impact of the weed competition and moisture should be considered at these lower planting densities.
The optimum planting density for Perkins in 2019 was 111,100, 148,000, and 185,250 plants ha−1 as yield decreased to 2.2 Mg ha−1 when plant densities were 223,500 plants ha−1. In 2020, the grain sorghum yield for Perkins varied significantly, with the lowest density of 43,225 plants ha−1 and the highest density of 223,500 plants ha−1 both recording relatively low yields. A similar result was reported by Staggenborg et al. [19], who observed a consistent sorghum yield over a wide range of plant populations with either consistent or decreased yields at higher planting densities. Sorghum’s ability to maintain consistent yields over a wide range of planting densities was attributed to the plant’s ability to alter its panicle and seed number per panicle in response to growing conditions during development [20].
The lower yields for Perkins in 2019 could be due to the plant’s response to non-ideal growing conditions seen during the boot and grain fill stages in July that were not seen in these critical stages in 2020. A lack of available moisture during sorghum boot and grain fill has been attributed to a reduction in panicle head size, which may lead to a decrease in yield potential compared to moisture stress at early vegetative stages [22].
Consistent results of higher yield with increasing planting density were not expected for Lahoma in 2019, as this location experienced hot and dry conditions during critical growth stages. However, its high yields can be attributed to above-average seasonal rainfall early in the season that allowed sufficient soil moisture storage during the drought conditions experienced in July. Other critical stages of drought stress in grain sorghum include boot through bloom [23] the milk stage [24], and heading through grain filling [25].
Compared to the yields for Perkins in 2019, higher yields were recorded in Perkins in 2020 despite the low amount of rainfall, especially for early-season timely rainfall events. Although sorghum is a drought-tolerant crop, an adequate amount of rainfall during critical growth stages can increase yields. Similar results were reported by Liu et al. [26], who observed variations in the effects of planting density on soybean. He also reported that the effects of planting density on soybean yield varied from year to year depending on the variety and rainfall received during the growing season in a location.

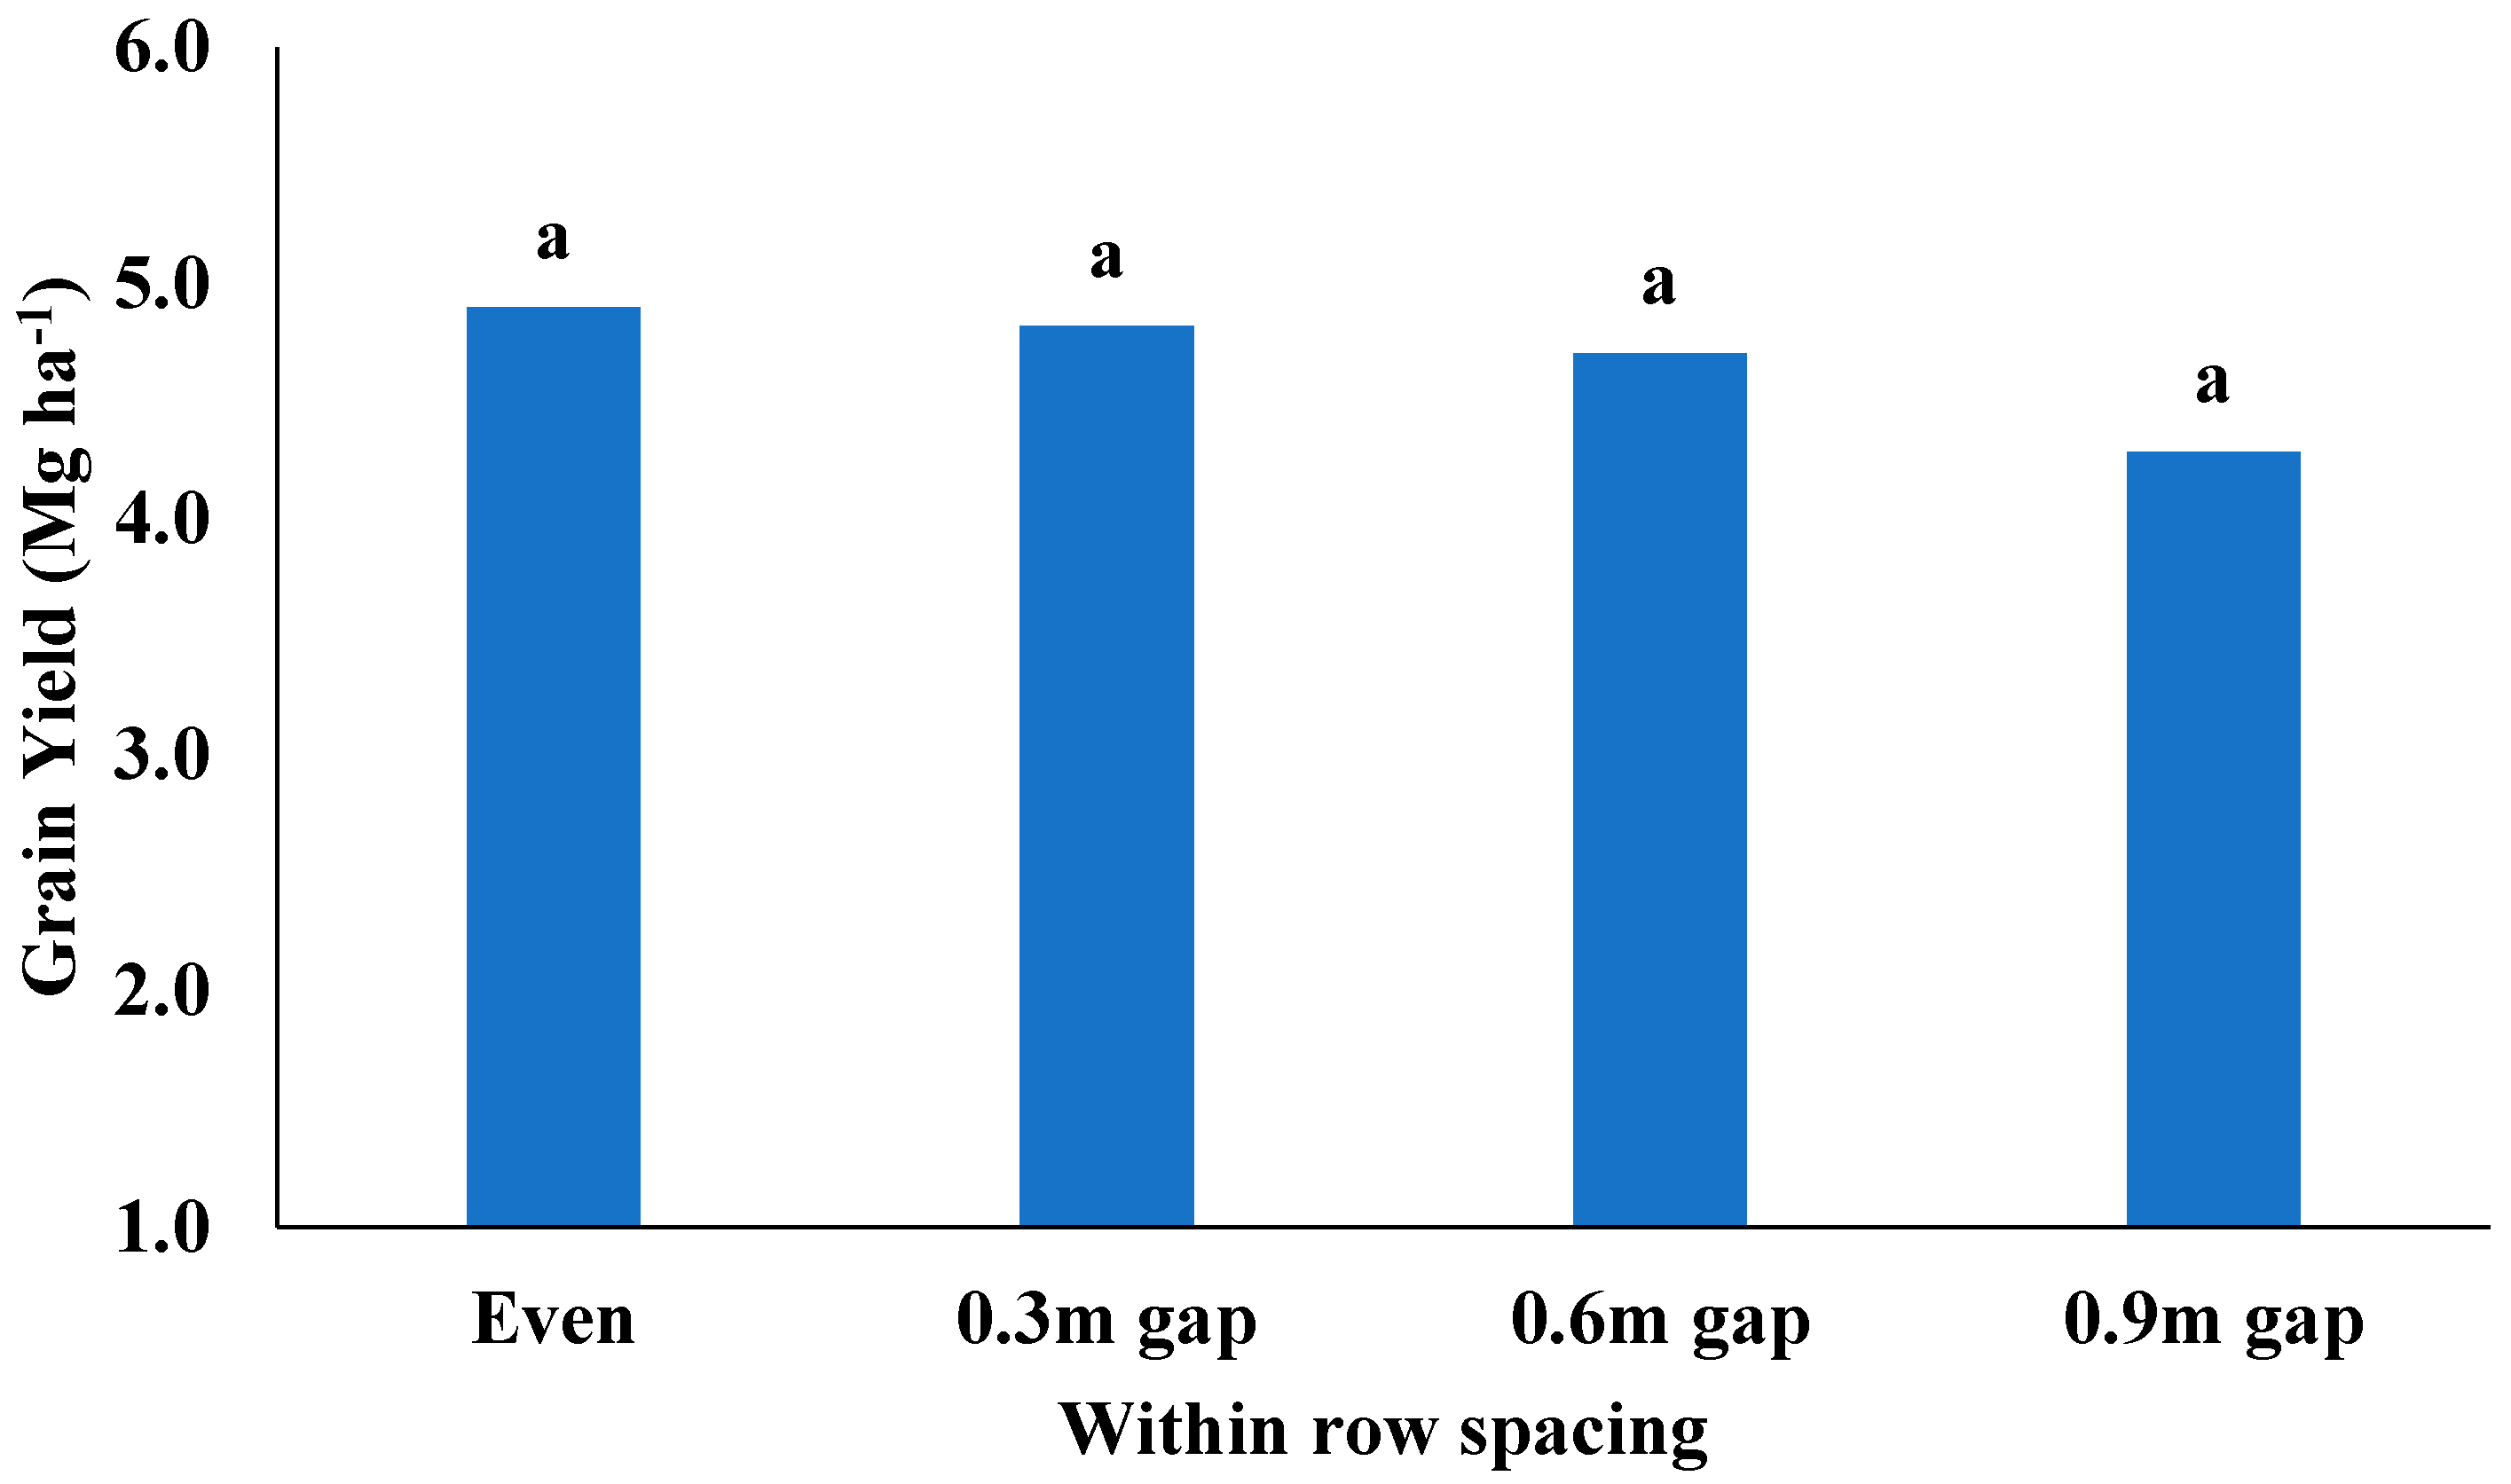
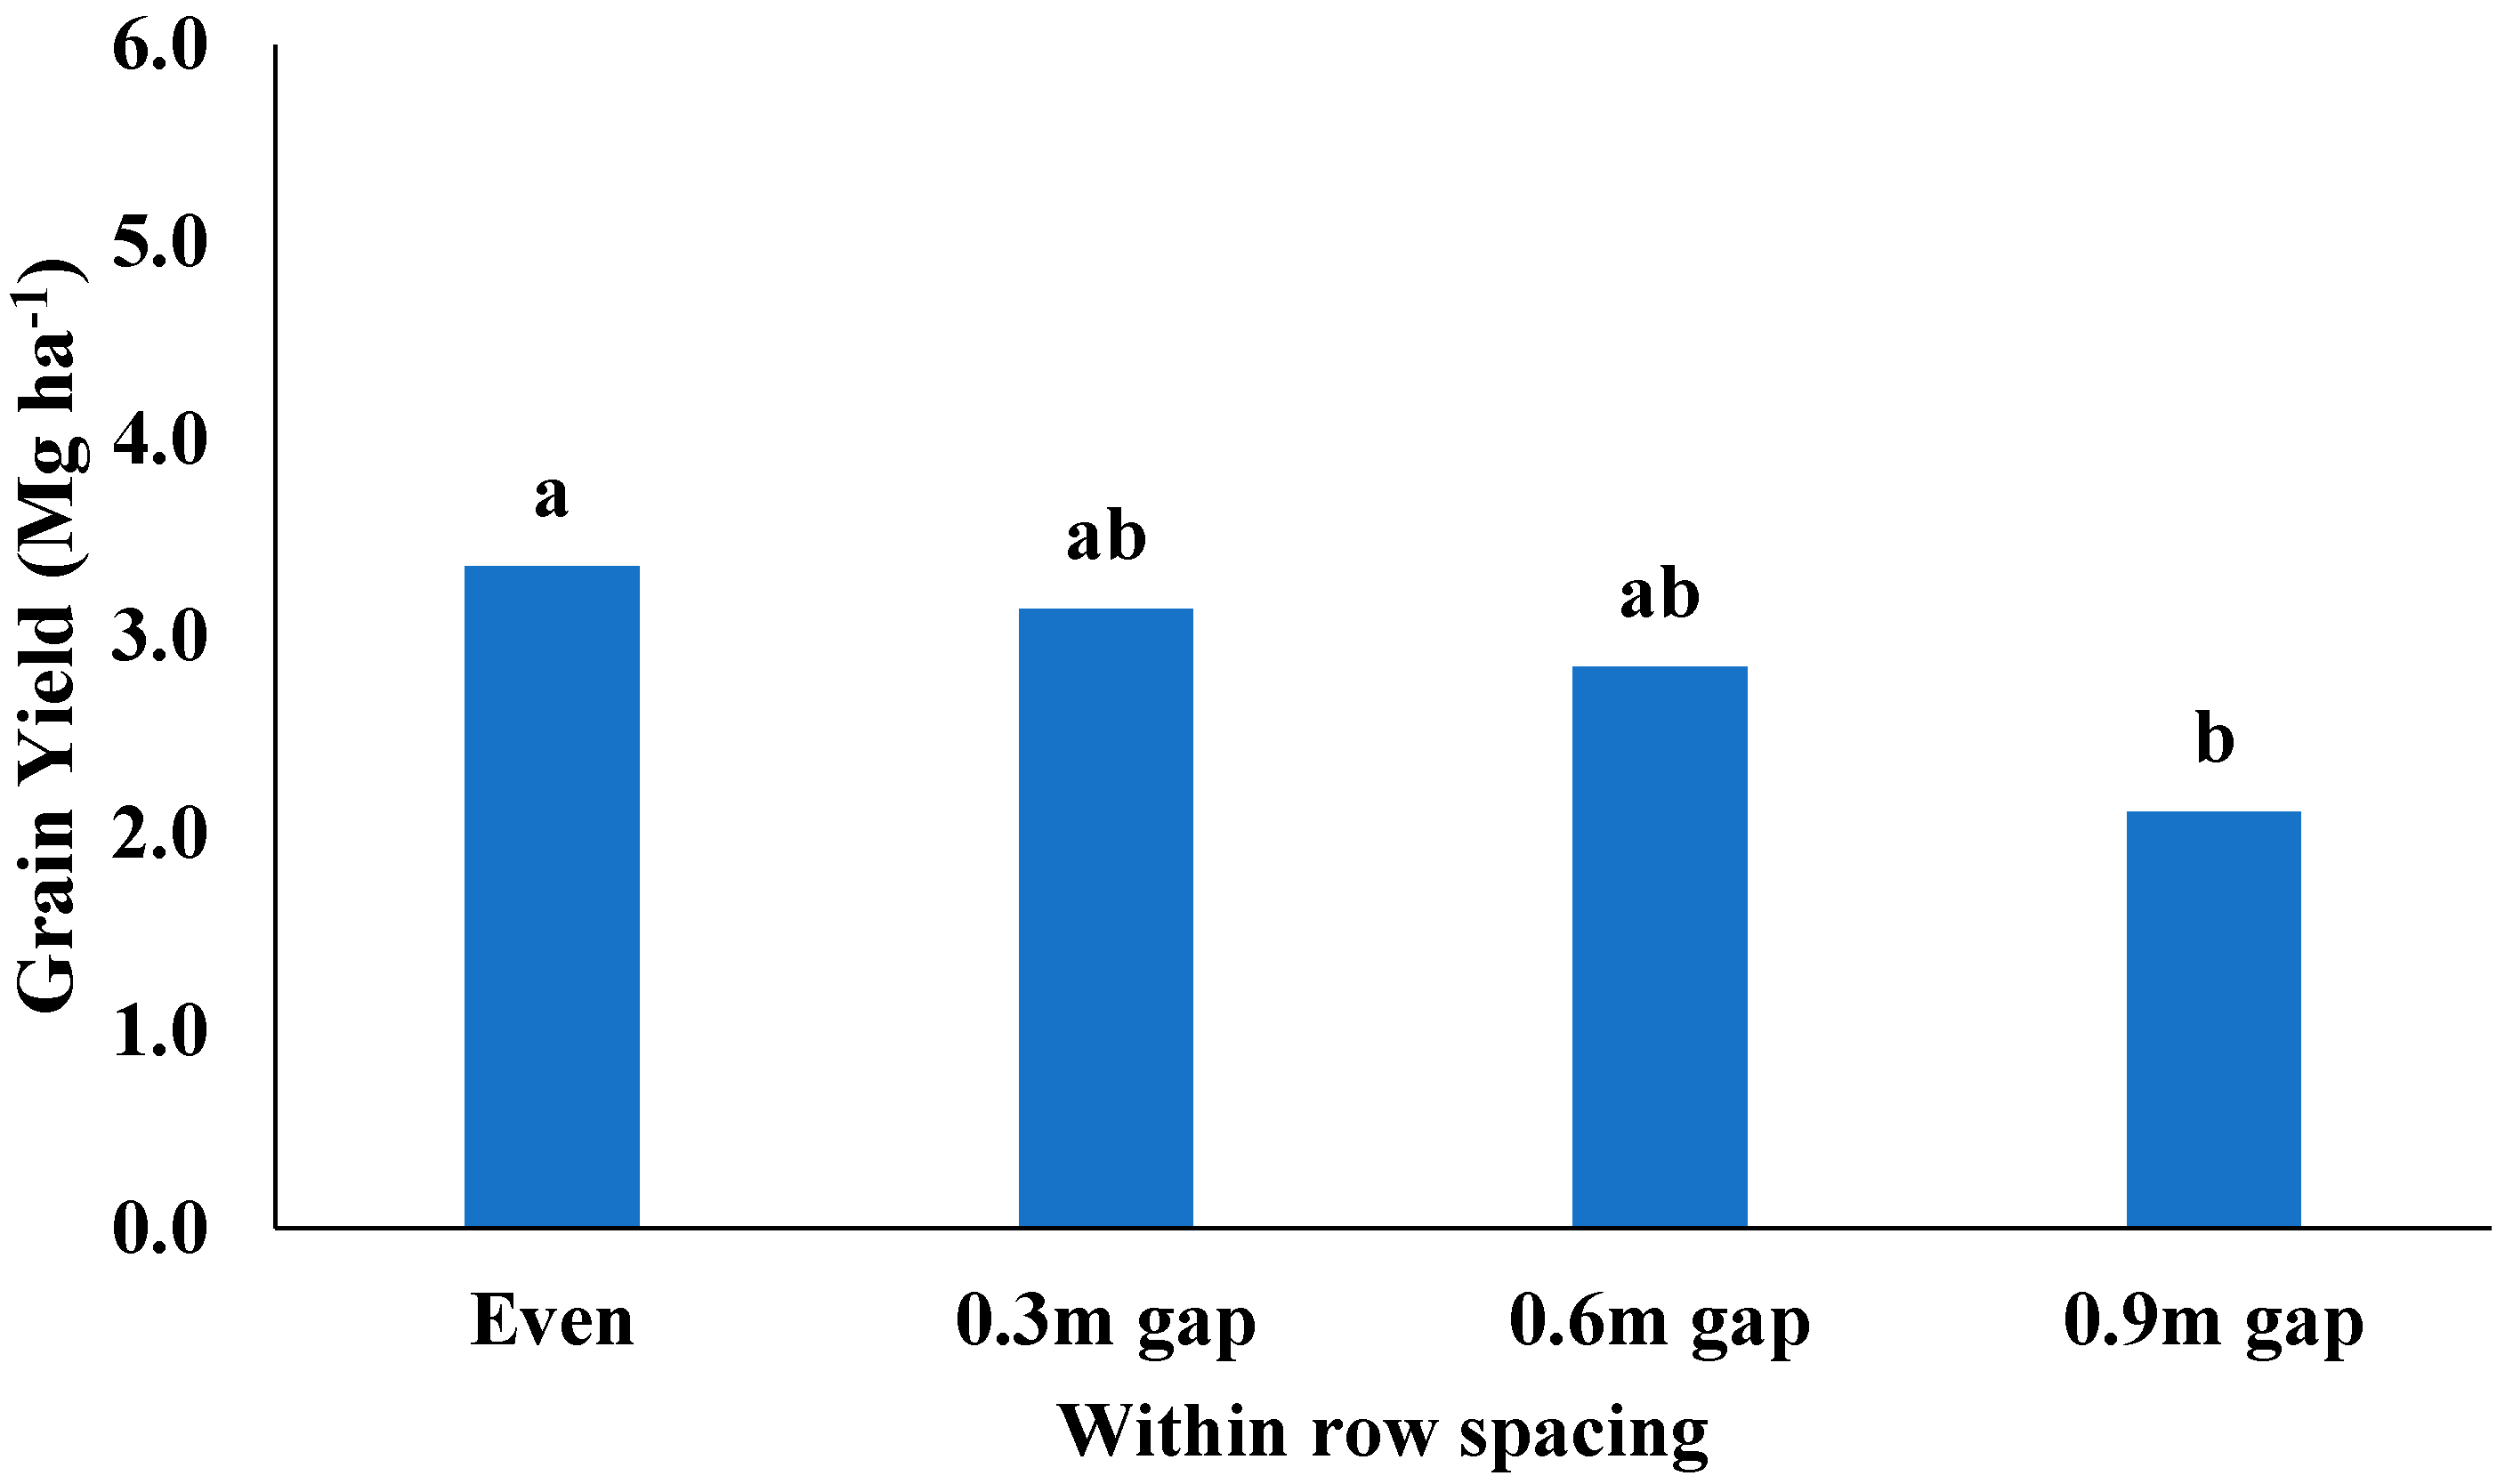
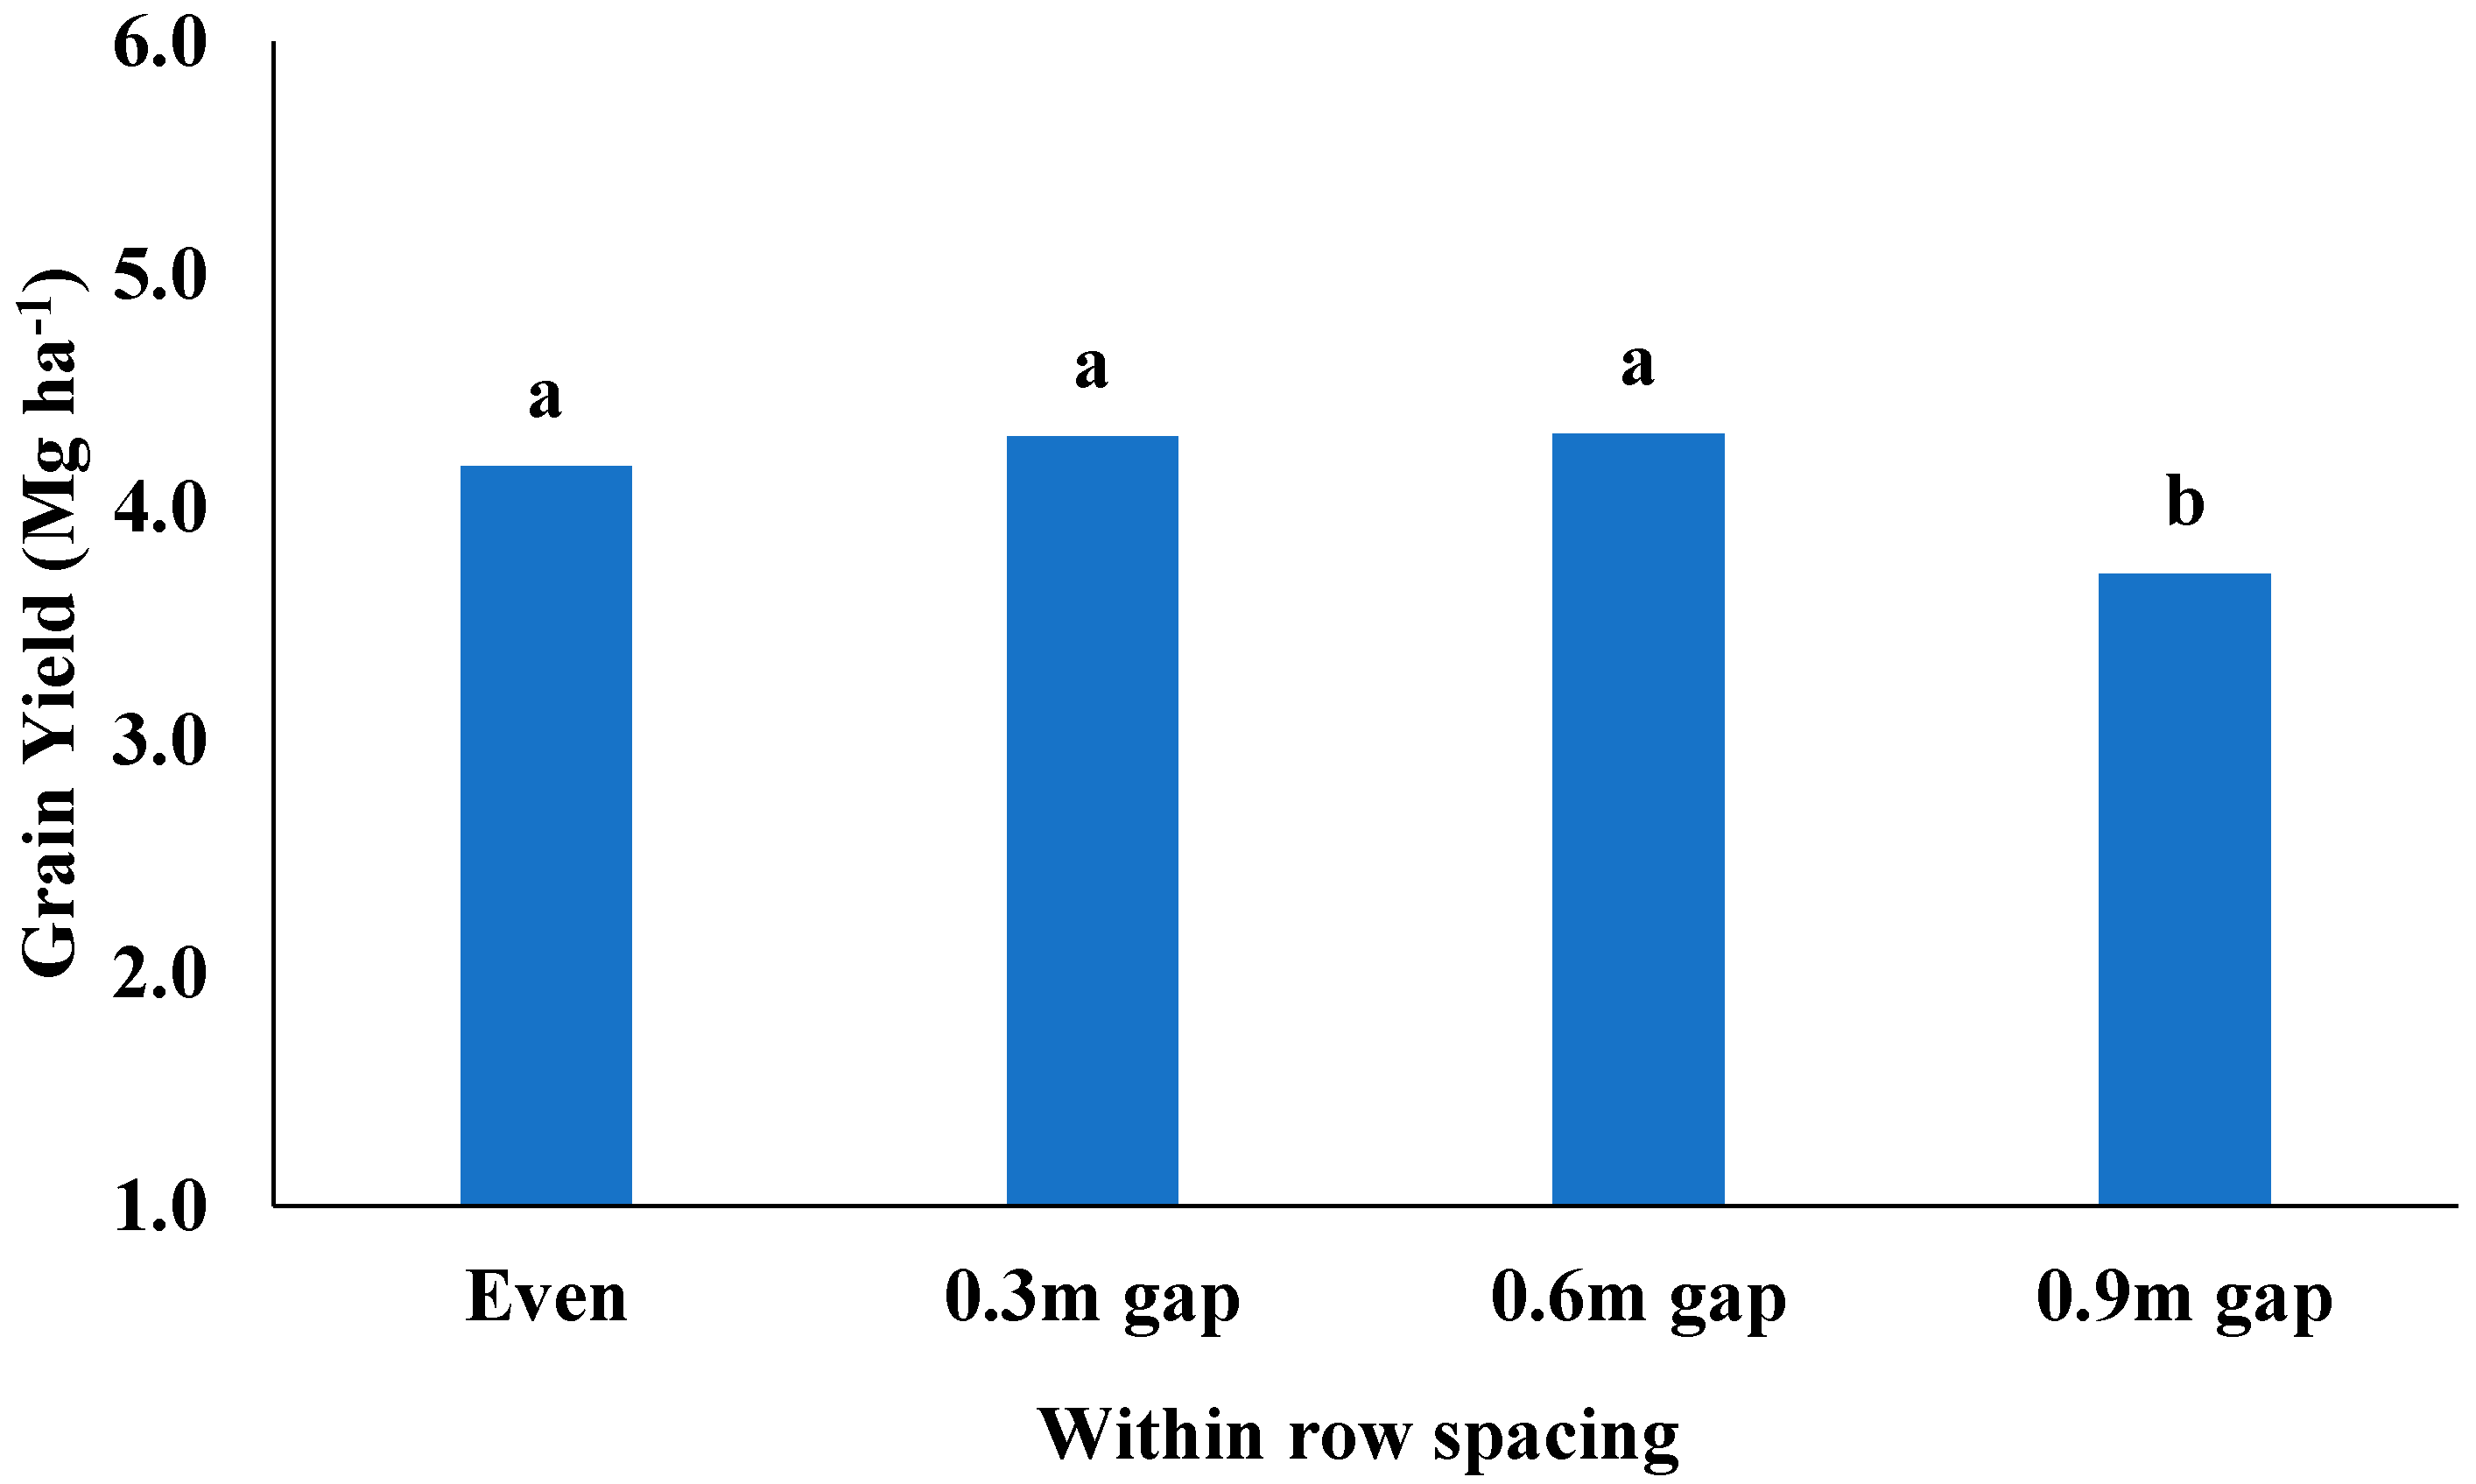
3.2. Grain Sorghum Yield from Within Row Spacing

In Lahoma, in 2019, no significant differences existed between treatments with imposed gaps compared to treatments without gaps. However, numerical differences were observed, with the yield decreasing by just over 0.6 Mg ha−1 with the 0.9 m gaps. Grain sorghum yields significantly decreased with the presence of gaps in Perkins in 2019 as opposed to the Lahoma location in 2019, specially with the 0.9 m gap. A significant yield difference was noted between the even stands and the 0.9 m gap. However, the yields from the 0.3 and 0.6 m gaps did not significantly differ from either. Significant differences were found among the within-row spacing in Perkins in 2020, which again can be attributed to the 0.9 m gaps with a significantly lower yield than all other treatments (Figure 6, Figure 7 and Figure 8).
The within-row spacing responded similarly across locations. In Lahoma in 2019, the within-row spacing had no significant impact on grain sorghum yield. However, in Perkins in 2019 and 2020, an extremely low yield was recorded for 0.9 m gaps. This was significantly lower than what was observed in 2020, where the even stand, 0.3 m gap, 0.6 m gap, and 0.9 m gap yielded 4.2, 4.3, 4.3, and 3.7 Mg ha−1 respectively. However, the 0.9 m gap was only significantly different from plant spacing in 2019, as seen with lower yields of the 0.9 m gap in Perkins of 2019. This is similar to the findings of Nafziger et al. [27] and Caravetta et al. [28], who reported significant yield reduction as plant spacing variability increased in corn and sorghum, respectively. Jones and Johnson [29] also observed a significant yield decrease with increasing row spacing. The environmental conditions during the growing season may also have affected this response. For years that had more favorable growing conditions (i.e., Lahoma in 2019), we observed that the in-row gap allowed for compensation from the surrounding plants. However, in resource-limited environments like the Perkins location in 2019 and, to a degree, 2020, the wider in-row gaps were too great for the surrounding plants to compensate.

4. Summary

The optimum planting densities recorded were 111,100, 148,000, and 185,250 plants ha−1 as the yield decreased to 2.2 Mg ha−1 at 223,500 plants ha−1 in Perkins in 2019. In addition, tillering in sorghum did not compensate for the low density because the number of plants per unit area was too low for the area of land. In Perkins in 2020, a relatively low yield was recorded at 43,225 and 223,500 plants ha−1. Within-row spacing had no significant influence on yield in Lahoma in 2019. However, the 0.9 m gap differed significantly from others in Perkins in 2019 and 2020.
In summary, a quantity of 111,150 plants ha−1 has been found to optimize productivity while limiting overplanting. Optimum yield is dependent on the environmental conditions prevalent in a location within a particular year.
Findings from these data show that the environment can significantly impact what should be considered “optimum” or “recommended” planting rates for a region. In resource-limited environments, lower planting densities can result in better yields and limit the risk associated with greater planting densities. However, uneven stands, like those found with in-row gaps, can have a greater impact on yields than environmental conditions that are closer to optimum.
Future research should further evaluate the in-row gaps to highlight the phenotypic and physiological response of the crop to these uneven stands. This can help guide future planting recommendations, especially for resource-limited environments.

Author Contributions

Conceptualization J.L.; methodology J.L. and I.B.; validation, J.L., I.B. and J.R.; formal analysis, I.B. and J.R.; investigation, J.L., I.B. and J.R.; writing, I.B. and J.R.; review and editing, J.L. and B.C.; supervision, J.L.; project administration, J.L.; funding acquistion, J.L. All authors have read and agreed to the published version of the manuscript.

Funding

Funding for the project was contributed by the Oklahoma Sorghum Commission.

Data Availability Statement

All data utilized can be obtained by contacting the corresponding author.

Conflicts of Interest

The authors declare no conflict of interest.

References

  1. Bandaru, V.; Stewart, B.; Baumhardt, R.; Ambati, S.; Robinson, C.; Schlegel, A. Growing dryland grain sorghum in clumps reduces vegetative growth and increases yield. Agron. J. 2006, 98, 1109–1120. [Google Scholar] [CrossRef]
  2. Srinivasa-Rao, P.; Belum, V.S.R.; Nagaraj, N.; Hari, D.U. Sorghum production for diversified uses. In Genetics, Genomics, and Breeding of Sorghum; CRC Press: Boca Raton, FL, USA, 2014; pp. 1–27. [Google Scholar]
  3. Moges, S.M.; Girma, K.; Teal, R.K.; Freeman, K.W.; Zhang, H.; Arnall, D.B.; Raun, W.R. In-season estimation of grain sorghum yield potential using a hand-held optical sensor. Arch. Agron. Soil Sci. 2007, 53, 617–628. [Google Scholar] [CrossRef]
  4. Ciampitti, I.A.; Prasad, P.V.V.; Schiegel, A.J.; Haag, L.; Schnell, R.W.; Arnall, B.; Lofton, J. Genotype × Environment × Management Interactions: US Sorghum Cropping Systems; In Sorghum: A state of the art and future perspectives; Ciampitti, I.A., Prasad, P.V., Eds.; Agronomy Monographs: Madison, WI, USA, 2019; Volume 1, pp. 273–396. ISBN 9780891186281. [Google Scholar] [CrossRef]
  5. Quinby, J.R.; Martin, J.H. Sorghum improvement. Adv. Agron. 1954, 6, 305–359. [Google Scholar] [CrossRef]
  6. FAOSTAT. Food and Agriculture Organization of the United Nations. 2017. Available online: http://www.fao.org/faostat/en/#data/QC (accessed on 19 January 2021).
  7. Mundia, C.W.; Secchi, S.; Akamani, K.; Wang, G. A regional comparison of factors affecting global sorghum production: The case of North America, Asia, and Africa’s Sahel. Sustainability 2019, 11, 2135. [Google Scholar] [CrossRef]
  8. Nik, M.M.; Babaeian, M.; Tavassoli, A.; Asgharzade, A. Effect of plant density on yield and yield components of corn hybrids (Zea mays). Sci. Res. Essay 2011, 6, 4821–4825. [Google Scholar] [CrossRef]
  9. Godsey, C.B.; Linneman, J.; Bellmer, D.; Huhnke, R. Developing row spacing and planting density recommendations for rainfed sweet sorghum production in the southern plains. Agron. J. 2012, 104, 280–286. [Google Scholar] [CrossRef]
  10. Bond, J.J.; Army, T.J.; Lehman, O.R. Row spacing, plant populations, and moisture supply as factors in dryland grain sorghum production. Agron. J. 1964, 56, 3–6. [Google Scholar] [CrossRef]
  11. Gerik, T.J.; Neely, C.L. Plant density effects on main culm and tiller development of grain sorghum. Crop Sci. 1987, 27, 1225–1230. [Google Scholar] [CrossRef]
  12. Kim, H.K.; Luquet, D.; Van Oosterom, E.; Dingkuhn, M.; Hammer, G. Regulation of tillering in sorghum: Genotypic effects. Ann. Bot. 2010, 106, 69–78. [Google Scholar] [CrossRef]
  13. Nielson, R.L. Stand Establishment Variability in Corn; AGRY-91-1; Purdue University: West Lafayette, IN, USA, 2001. [Google Scholar]
  14. Liu, W.; Tollenaar, M.; Stewart, G.; Deen, W. Within-row plant spacing variability does not affect corn yield. Agron. J. 2004, 96, 275–280. [Google Scholar] [CrossRef]
  15. Johnson, R.R.; Mulvaney, D.L. Development of a model for use in maize replants decisions. Agron. J. 1980, 72, 459–464. [Google Scholar] [CrossRef]
  16. Erbach, D.C.; Wilkins, D.E.; Lovely, W.G. Relationships between furrow opener, corn plant spacing, and yield. Agron. J. 1972, 64, 702–704. [Google Scholar] [CrossRef]
  17. Oklahoma Cooperative Extension Service CR-2162, Grain sorghum performance trials in Oklahoma. 2017. Available online: https://osucropsdotcom.files.wordpress.com/2018/01/2017-sorghum-performance-trial_final.pdf (accessed on 19 January 2021).
  18. Berenguer, M.J.; Faci, J.M. Sorghum (Sorghum bicolor L. Moench) yields compensation processes under different plant densities and variable water supplies. Eur. J. Agron. 2001, 15, 43–55. [Google Scholar] [CrossRef]
  19. Welch, N.H.; Burnett, E.; Eck, H.V. Effect of row spacing, plant population, and nitrogen fertilization on dryland grain sorghum production. Agron. J. 1966, 58, 160–163. [Google Scholar] [CrossRef]
  20. Staggenborg, S.A.; Fjell, D.L.; Devlin, D.L.; Gordon, W.B.; Marsh, B.H. Grain sorghum response to row spacings and seeding rates in Kansas. J. Prod. Agric. 2013, 12, 390–395. [Google Scholar] [CrossRef]
  21. Zander, A.; Lofton, J.; Harris, C.; Kezar, S. Grain sorghum production: Influence of planting date, hybrid selection, and insecticide application. Agrosystems Geosci. Environ. 2021, 4, e20162. [Google Scholar] [CrossRef]
  22. Inuyama, S.; Musick, J.T.; Dusek, D.A. Effect of plant water deficits at various growth stages on growth, grain yield, and leaf water potential of irrigated grain sorghum. Jpn. J. Crop Sci. 1976, 45, 298–307. [Google Scholar] [CrossRef]
  23. Lewis, R.B.; Hiler, E.A.; Jordan, W.R. Susceptibility of grain sorghum to water deficit at three growth stages. Agron. J. 1974, 66, 589–591. [Google Scholar] [CrossRef]
  24. Plaut, Z.; Blum, A.; Arnon, I. Effect of soil moisture regime and row spacing on grain sorghum production. Agron. J. 1969, 61, 344–347. [Google Scholar] [CrossRef]
  25. Musick, J.T.; Dusek, D.A. Grain sorghum response to number, timing, and size of irrigations in the Southern High Plains. Trans. ASAE 1971, 14, 401–0404. [Google Scholar] [CrossRef]
  26. Liu, X.; Jin, J.; Wang, G.; Herbert, S.J. Soybean yield physiology and development of high-yielding practices in Northeast China. Field Crops Res. 2008, 105, 157–171. [Google Scholar] [CrossRef]
  27. Nafziger, E.D. Effects of missing and two-plant hills on corn grain yield. J. Prod. Agric. 1996, 9, 238–240. [Google Scholar] [CrossRef]
  28. Caravetta, G.J.; Cherney, J.H.; Johnson, K.D. Within-row spacing influences on diverse sorghum genotypes: II. dry matter yield and forage quality. Agron. J. 1990, 82, 210–215. [Google Scholar] [CrossRef]
  29. Jones, O.R.; Johnson, G.L. Row width and plant density effects on Texas High Plains sorghum. J. Prod. Agric. 1991, 4, 613–621. [Google Scholar] [CrossRef]
Figure 1. Temperature (orange line) and rainfall (blue bars) were observed during the Lahoma, 2019 (A), Perkins, 2019 (B), and Perkins, 2020 (C) growing seasons at Lahoma and Perkins, Oklahoma (2019 and 2020, MESONET).
Crops 05 00025 g001
Figure 2. Depiction of how the intermediate skips were designed in the field.
Crops 05 00025 g002
Figure 3. Grain yield of sorghum planted at different densities in Lahoma in 2019. Different letters indicate significant differences between planting densities.
Crops 05 00025 g003
Figure 4. Grain yield of sorghum planted at different densities in Perkins in 2019. Different letters indicate significant differences between planting densities.
Crops 05 00025 g004
Figure 5. Grain yield of sorghum planted at different densities in Perkins in 2020. Different letters indicate significant differences between planting densities.
Crops 05 00025 g005
Figure 6. Grain yield of sorghum planted at 148,200 plants ha−1 planting density with varying imposed gaps at Lahoma in 2019. Different letters indicate significant differences between within row spacing.
Crops 05 00025 g006
Figure 7. Grain yield of sorghum planted at 148,200 plants ha−1 planting density with varying imposed gaps at Perkins in 2019. Different letters indicate significant differences between within row spacing.
Crops 05 00025 g007
Figure 8. Grain yield of sorghum planted at 148,200 plants ha−1 planting density with varying imposed gaps at Perkins in 2020. Different letters indicate significant differences between within row spacing.
Crops 05 00025 g008
Table 1. Classification of the soils used for the experiment.
LocationSoil Classification
Perkins Fine-loamy, mixed, active, thermic Ultic Haplustalf Teller; fine-loamy, mixed, active, thermic Udic Argiustoll
LahomaFine silty, mixed, superactive, thermic, Udic Argiustoll
Table 2. Planting date, variety, and seeding rates for all experimental sites.
LocationCrop YearPlanting DateVarietyPlant Densities
(Plants ha−1)
Harvest Date
Lahoma201916 April 2019SP68M5743,225–223,50011 September 2019
Perkins201914 May 2019SP68M5743,225–223,50012 September 2019
202020 May 2020SP68M5743,225–223,50027 August 2020
Disclaimer/Publisher’s Note: The statements, opinions and data contained in all publications are solely those of the individual author(s) and contributor(s) and not of MDPI and/or the editor(s). MDPI and/or the editor(s) disclaim responsibility for any injury to people or property resulting from any ideas, methods, instructions or products referred to in the content.

