Article

Proximate Composition and Nutritional Indices of Fenugreek Under Salinity Stress: The Role of Biocyclic Vegan and Other Organic Fertilization Systems in Forage Quality

by
Antigolena Folina
1,*,
Ioanna Kakabouki
1,
Panteleimon Stavropoulos
1,
Antonios Mavroeidis
1,
Eleni Tsiplakou
2 and
Dimitrios Bilalis
1
1
Laboratory of Agronomy, Department of Crop Science, Agricultural University of Athens, 11855 Athens, Greece
2
Laboratory of Nutritional Physiology & Feeding, Department of Animal Science, Agricultural University of Athens, 11855 Athens, Greece
*
Author to whom correspondence should be addressed.
Crops 2025, 5(3), 24; https://doi.org/10.3390/crops5030024
Submission received: 26 February 2025 / Revised: 9 April 2025 / Accepted: 18 April 2025 / Published: 1 May 2025

Abstract

Fenugreek (Trigonella foenum-graecum L.) is an emerging forage crop known for its high nutritional value and adaptability to diverse environmental conditions, making it a promising alternative in sustainable livestock feeding systems in the Mediterranean region. A field experiment was established at the Agricultural University of Athens during the growing season 2020–2021 in a split-plot design with five fertilization treatments (Biocyclic-Vegan Humus Soil; BHS, Farmyard Manure; FMA, Organic Compost; OCP, Inorganic Fertilizer; IFZ, and No Treatment Control; CTRL, and two main salinity treatments (High Salinity Level; HSL, and Normal Salinity Level; NSL). The Forage Quality Index (FQI) was the highest under BHS at NSL (45) and lowest under CTRL at HSL (32), emphasizing the positive impact of organic fertilization. Crude ash (CA) was higher under NSL (9.7%), with OCP and IFZ performing best, while salinity reduced CA under CTRL. Crude fiber (CF) increased under salinity, particularly with OCP and IFZ, whereas BHS and FMA at NSL showed the lowest CF (15.8%), enhancing digestibility. Total fat (TF) was the highest under BHS and FMA at NSL (5.8%) and lowest under IFZ and CTRL at HSL (4.0%), underscoring the importance of balanced fertilization in maintaining fat content. These results highlight the potential of organic amendments to improve nutrient availability, digestibility, and overall feed value.

1. Introduction

Soil salinization is an escalating global challenge driven by factors such as climate change, over-irrigation, and poor drainage, which collectively increase salt concentrations in the soil and compromise plant growth [1,2,3]. This phenomenon not only diminishes the productivity and nutritional quality of traditional forage species in grassland ecosystems but also threatens the sustainability of livestock production systems. Consequently, there is a pressing need to introduce new, salt-tolerant species into these environments. Such species have the potential to thrive under saline conditions, thereby enhancing forage quality and restoring degraded lands, while supporting sustainable agricultural practices and livestock nutrition [4,5,6].
Organic fertilization has been increasingly adopted as a sustainable agricultural practice that not only enhances soil fertility but also mitigates the adverse effects of salinity by improving nutrient availability and stimulating beneficial soil microbial activity [7]. Previous studies have demonstrated that organic amendments can bolster plant resilience under salinity stress, thereby potentially preserving or even enhancing the nutritional quality of forage crops [8]. Biocyclic-vegan agriculture is an emerging paradigm in sustainable farming that integrates closed-loop, nutrient-cycling principles with a commitment to vegan ethics by completely excluding animal-derived inputs. This approach relies solely on plant-based composts, green manures, and naturally occurring soil biota to maintain and enhance soil fertility, thereby reducing dependency on synthetic fertilizers and pesticides while mitigating risks associated with animal-based manures [9]. Moreover, by eliminating animal inputs, biocyclic-vegan systems promote ethical farming practices and foster biodiversity, contributing to a healthier ecosystem and improved crop quality [10]. As global agriculture faces mounting challenges from climate change and environmental degradation, the adoption of biocyclic-vegan agriculture presents a promising pathway toward resilient, sustainable, and ethically responsible food production [11,12].
Many medicinal plants or herbs could be used as feed additives for animals, poultry, and fish to increase feed efficiency and, consequently, production. Medicinal plants have the potential to enhance various physiological functions, such as combating stress, boosting the immune system, etc. The incorporation of 10% extract from a mixture of plant materials, including fenugreek seeds, reduced aflatoxin production by Aspergillus flavus by approximately 85–90% in animals [13]. Fenugreek stimulates bile secretion, increasing the conversion of cholesterol to bile salts [14]. Additionally, fenugreek produces high-quality animal feed at all stages of its development [15], as it is rich in many nutrients and phytochemicals (e.g., diosgenin) that promote growth and milk production in animals [16,17]. The nutritional value of its forage is comparable to that of alfalfa at all stages of development up to early flowering [18]. Its inclusion in cattle diets resulted in improved milk quality parameters and animal metabolism [19]. Moreover, increasing the addition of fenugreek seeds to sheep diets significantly improved their performance [20].
Fenugreek is a high-protein forage crop comparable to alfalfa [21,22]. However, its nutritional value decreases with plant maturity, as mature hay shows lower quality despite its moderate to high crude protein and digestibility [23,24,25]. Rainfall also plays a role, with frequent rains enhancing nutrient levels similar to or exceeding alfalfa, while dry conditions reduce biomass [26,27,28]. Genetic factors and fertilization practices are critical; studies in Canada reveal that forage quality is influenced by genotype and location, with yield being more affected by cutting dates than nitrogen levels, and optimal phosphorus doses (50–60 kg ha−1) further boost yield [29,30]. Additionally, while inorganic fertilization maximizes fresh and dry yield, organic methods improve qualitative traits, and intercropping with species like barley or sorghum can enhance overall forage performance [31,32,33].
Fenugreek is increasingly valued in modern fodder mixtures due to its nutritional benefits and versatility across different feed applications. In pasture mixtures, fenugreek seeds are blended with grasses such as ryegrass, clover, and alfalfa to enhance direct grazing and overall forage quality [34]. When sprouted, the seeds develop a nutrient-rich profile that makes them an excellent addition to fresh feed, providing enhanced digestibility and vitality to livestock [35]. Moreover, incorporating dried fenugreek plants into silage or hay not only boosts the nutritional content of these feed types but also improves palatability and storage characteristics [23]. Finally, as a powdered additive, crushed fenugreek seeds are mixed into the diets of poultry and dairy cattle to promote better digestion and overall performance [36].
Fenugreek is widely recognized for its nutritional benefits; however, its use as animal feed can be compromised by anti-nutritional factors. Compounds such as saponins, tannins, and alkaloids have been identified in fenugreek, which may impair protein digestibility and hinder nutrient absorption. Saponins, for example, can disrupt cellular membranes and inhibit enzyme activity, while tannins bind with dietary proteins, reducing their bioavailability. Moreover, certain alkaloids present in the seeds may affect animal metabolism when consumed in high amounts. Notably, processing methods like thermal treatment and fermentation have been shown to mitigate these effects, thereby improving fenugreek’s overall nutritive value as a forage crop [37,38].
Salinity stress negatively impacts plant growth and development by inducing osmotic imbalance, ion toxicity (particularly from Na+ and Cl), and interference with nutrient uptake, leading to reduced biomass and compromised physiological functions. In forage crops such as fenugreek (Trigonella foenum-graecum L.), elevated salinity levels have been shown to reduce crude protein content, impair mineral accumulation, and increase structural fiber fractions like lignin and cellulose, thereby lowering digestibility and overall feed quality [5,39].
Organic fertilization can alleviate the adverse effects of salinity through several mechanisms. Organic amendments improve soil structure, increase water-holding capacity, and stimulate microbial activity, which collectively enhance nutrient availability and root function under stress conditions [7]. They also contribute to better cation exchange capacity and buffering of excess salts, facilitating more stable uptake of essential nutrients such as nitrogen, calcium, and phosphorus. These effects promote plant resilience and help preserve nutritional traits even under moderate saline stress [8,40]. Given fenugreek’s adaptability and high nutritional potential, evaluating its response to organic fertilization in saline soils provides a promising pathway for sustainable forage production in degraded environments.
Globally, the demand for organic dairy products has motivated farmers to convert their land to organic feed production. Economic and environmental concerns have led to growing interest and demand for organically produced foods [41]. Νotably, one of the fastest-growing sectors of organic farming in Europe is organic milk production [42]. Fenugreek, prized for its high protein and nutritional value, is increasingly studied as animal feed. Evaluating the impact of both organic and inorganic fertilization and high soil salinity on its quality is essential for optimizing livestock nutrition and overall farm profitability. While its salt tolerance makes it a promising option for degraded, irrigated lands, there is a notable lack of research on its performance under organic cultivation. This study aims to fill that gap by assessing fenugreek forage quality under varied fertilization practices and saline conditions, ultimately guiding improved feed management strategies. It is hypothesized that organic fertilization can not only mitigate the negative effects of salinity but also enhance key nutritional indices, providing a distinct advantage over conventional inputs under stress conditions. To date, no studies have investigated the combined effects of salinity stress and biocyclic-vegan soil amendments on fenugreek or other forage crops, despite the growing interest in animal-free organic systems. This study directly addresses that gap.

2. Materials and Methods

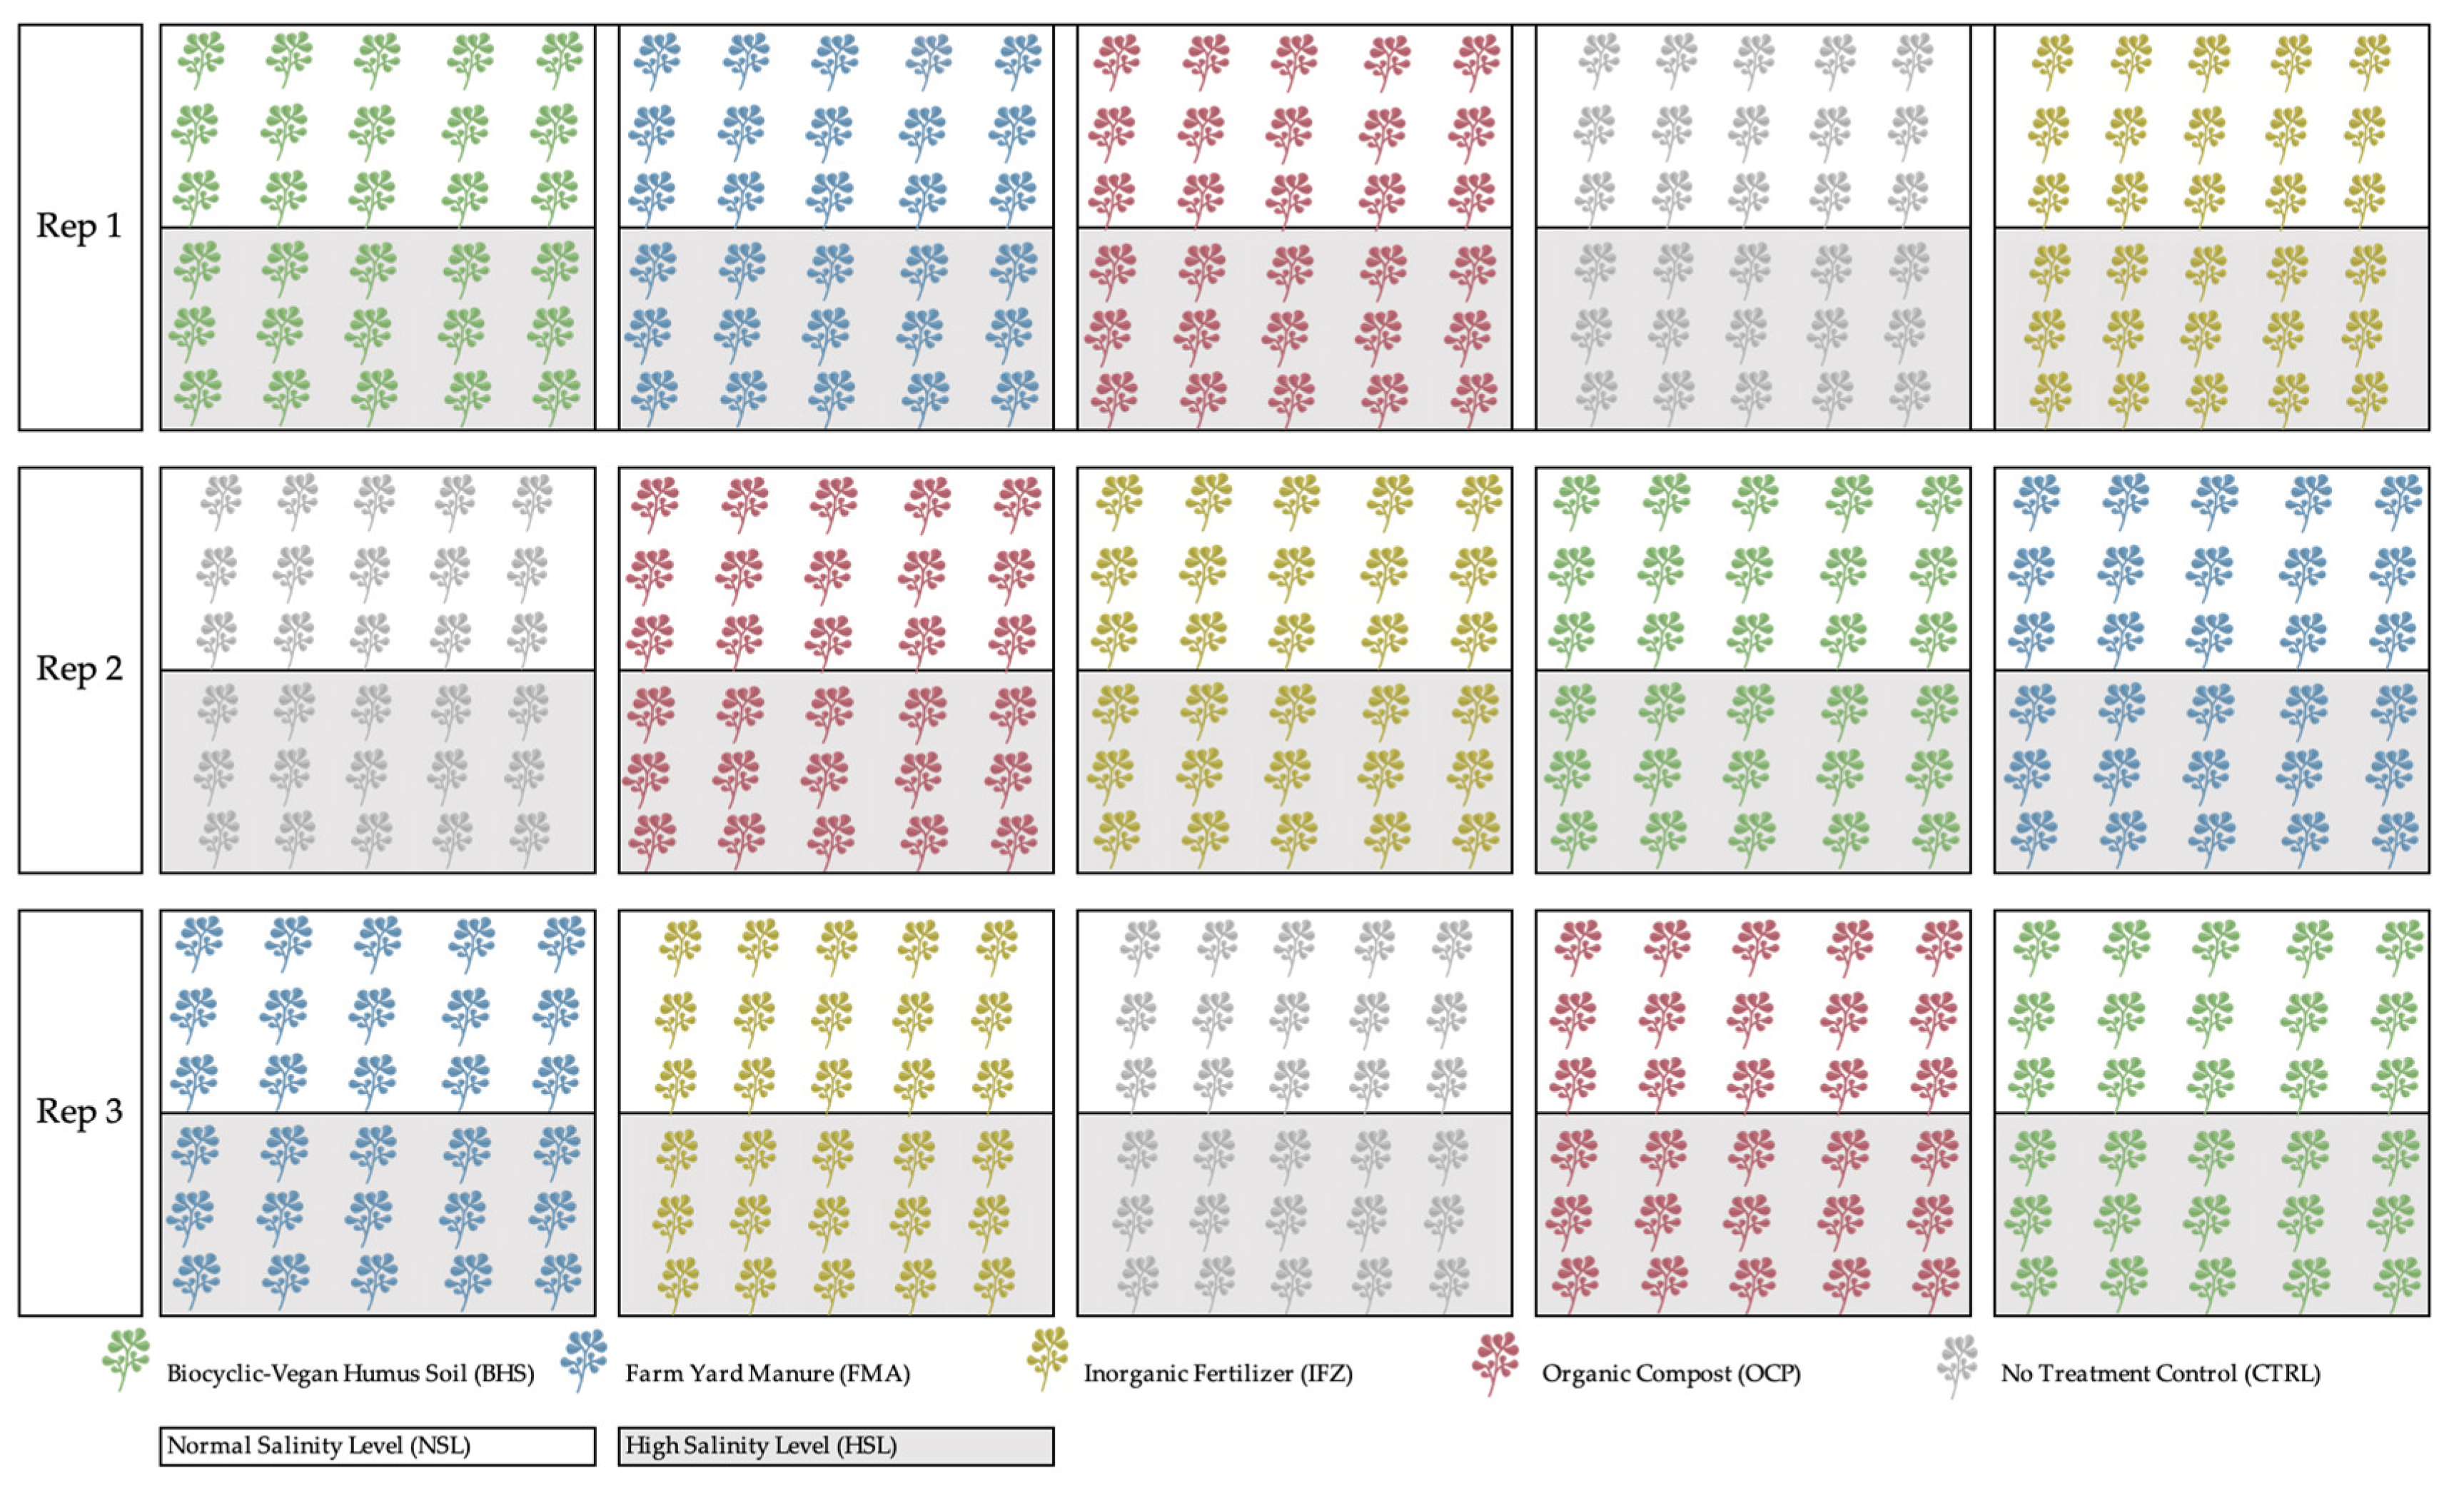
2.1. Experimental Design

The experiment follows a split-plot design with the main factor being fertilization type and the subplot factor being salinity level, organized in three replicates (blocks) to control environmental variability, including soil heterogeneity, microclimatic differences, and field position effects. This design helps minimize the impact of factors such as soil texture variations, moisture distribution, and nutrient availability across the experimental field, ensuring that differences in forage quality parameters are primarily due to the treatments rather than external environmental influences.
The experimental area covered a total of 367 m2, organized into 3 blocks (replicates) to control environmental variability, such as soil heterogeneity and microclimatic differences. Each block was divided into 5 main plots, corresponding to the fertilization treatments: Biocyclic-Vegan Humus Soil (BHS), Farmyard Manure (FMA), Organic Compost (OCP), Inorganic Fertilizer (11-14-14) (IFZ), and No Treatment Control (CTRL). Each main plot measured 4 m × 6 m (24 m2) and was subdivided into 2 subplots of 12 m2 each to test the salinity levels: High Salinity Level (HSL) and Normal Salinity Level (NSL) (Figure 1). To ensure ease of movement, effective management practices, and accurate data collection while preventing cross-treatment contamination, 0.5 m wide passageways were maintained between blocks and main plots. This strategic layout facilitated organized field operations and minimized any external influence on the experimental results.

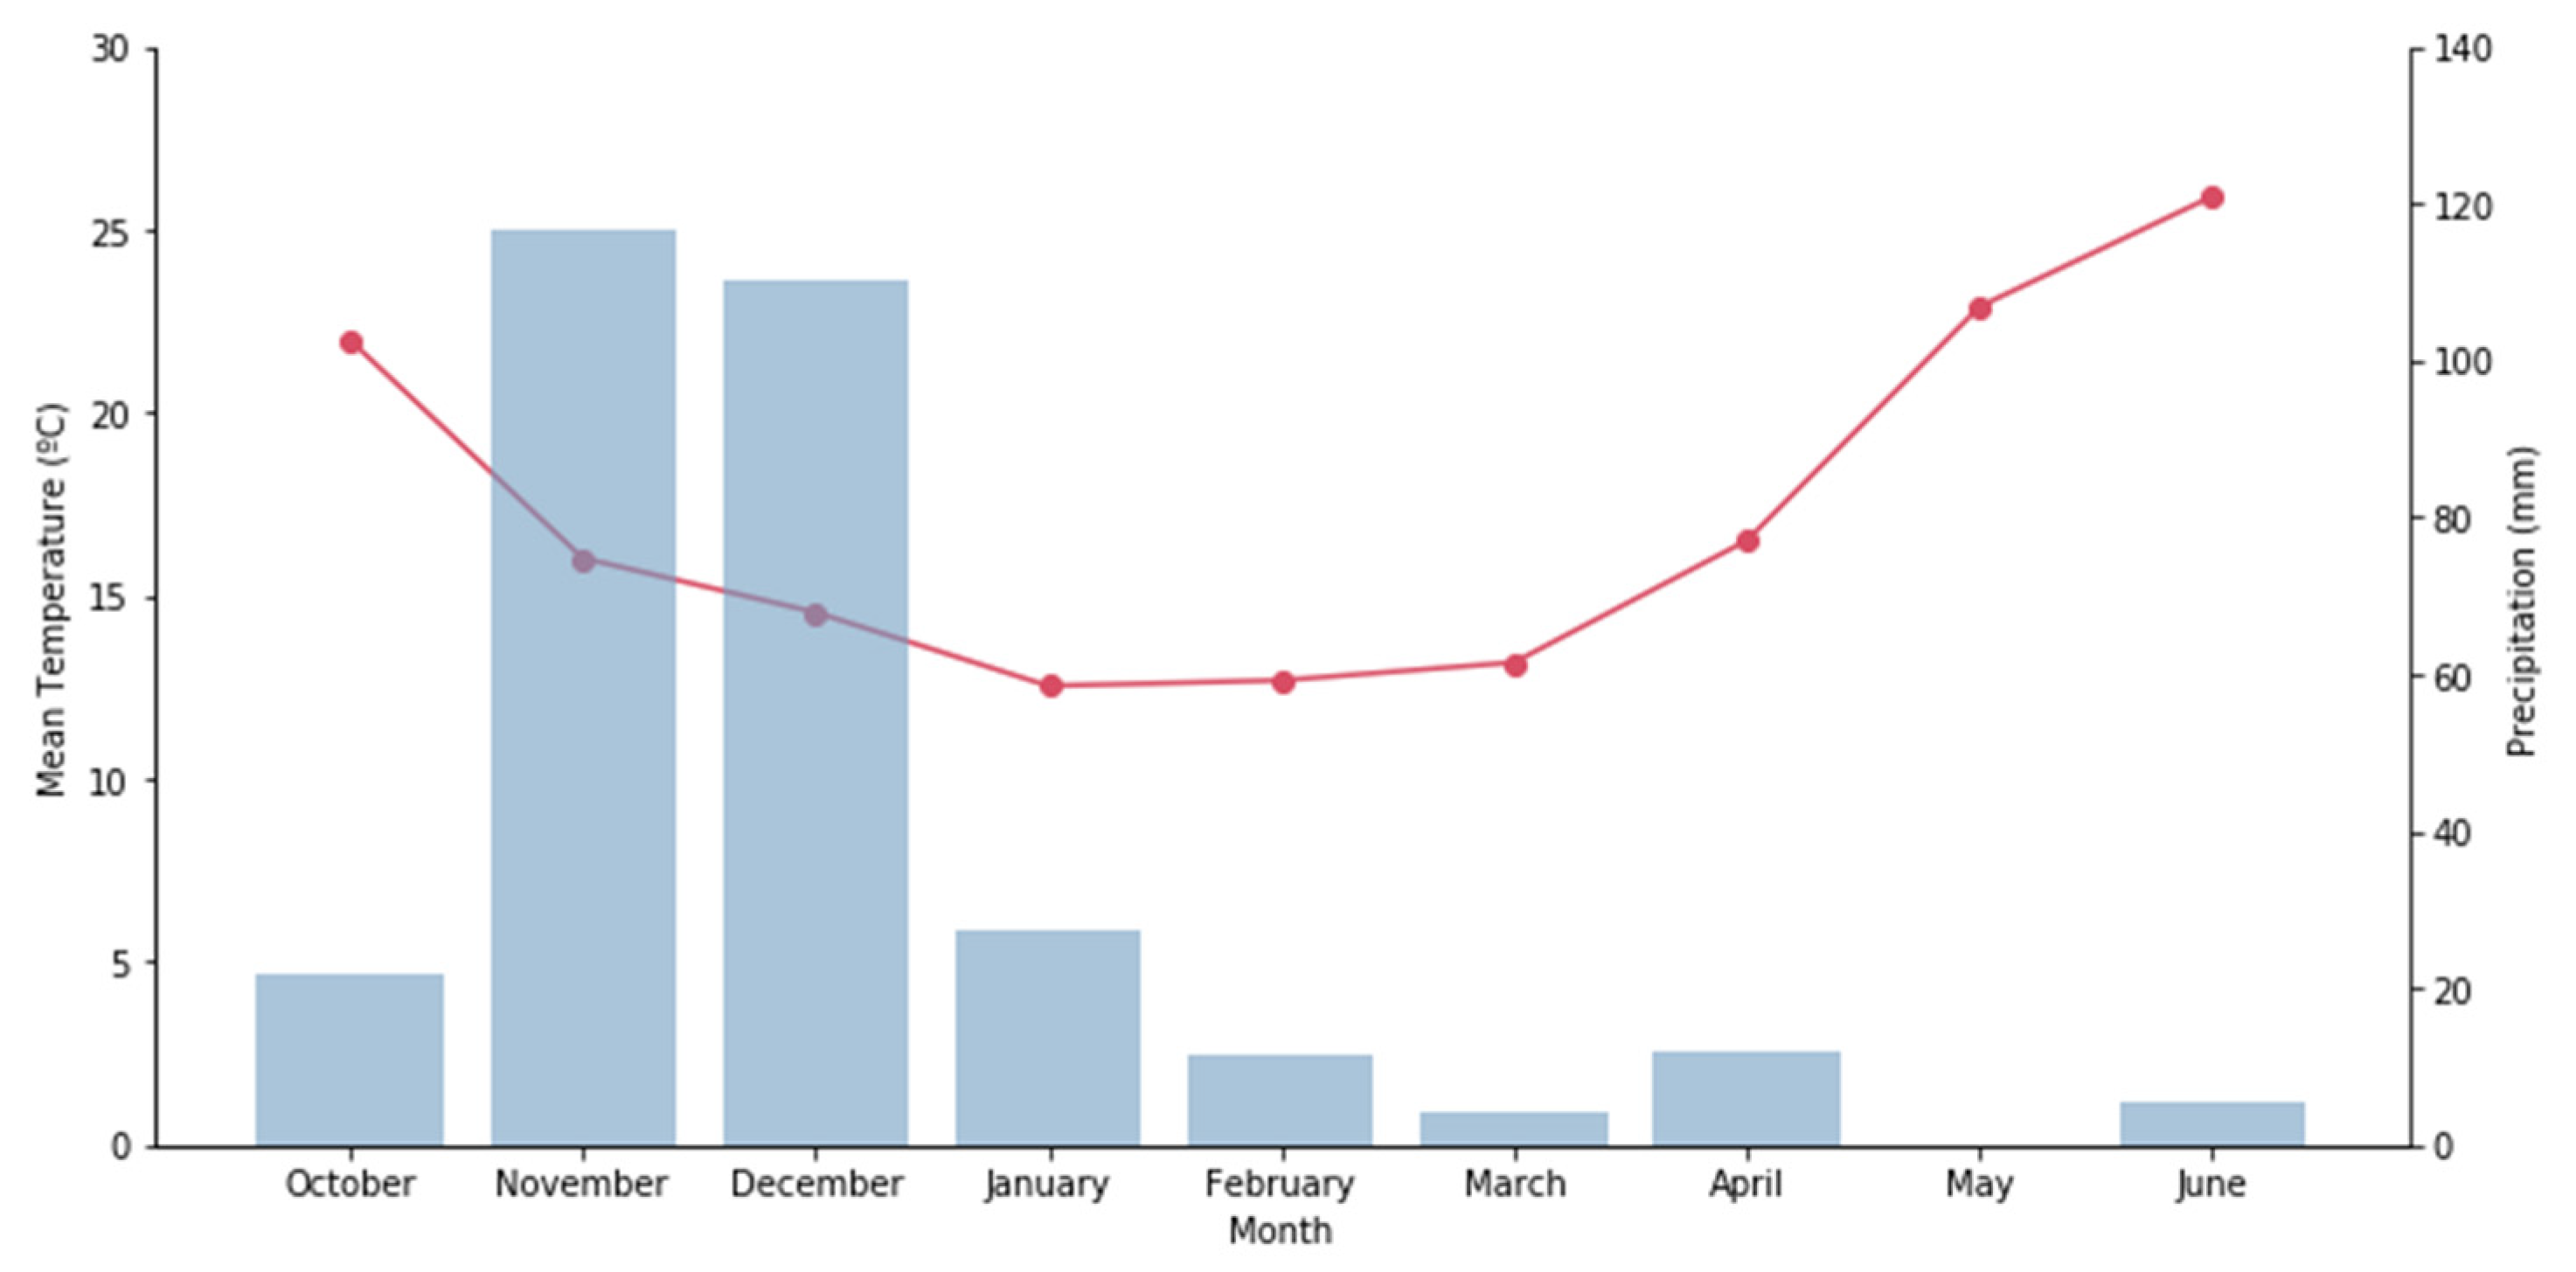
2.2. Experimental Site and Environmental Conditions

The experimental site for this study was located at the Agricultural University of Athens in Greece at 37°59′01.82″ N, 23°42′07.38″ E, and an altitude of 30 m. The experiment was conducted during the 2020–2021 winter growing period to evaluate the effects of different fertilization treatments and salinity levels on forage quality parameters of fenugreek.
The soil at the experimental site is characterized as clay loam (CL), with a composition of 35.9% sand, 29.8% clay, and 34.3% silt, providing a well-balanced texture for moisture retention and nutrient availability. The soil pH was measured at 7.29 using a 1:1 water (H2O) solution, indicating a neutral to slightly alkaline environment suitable for the growth of the selected forage species. The organic matter content was 2.37%, determined using the Wakley and Black method (1934), reflecting moderate fertility and adequate nutrient supply [43].
Climatic conditions during the growing period, including temperature and precipitation, are illustrated in Figure 2, which shows the monthly mean temperature (°C) and total precipitation (mm) recorded from October to June. The total precipitation during this period was 309 mm, which influenced crop growth and development. Understanding these environmental conditions is essential for accurately interpreting the impact of fertilization and salinity treatments on forage quality and productivity.

2.3. Plant Material

The study utilized fenugreek (Trigonella foenum-graecum L.) as the plant material due to its potential as a retro-innovative forage crop. Fenugreek has gained renewed interest in recent years for its suitability as high-quality forage, owing to its high protein content, moderate fiber levels, and palatability for livestock. Its adaptability to various environmental conditions and its role in enhancing soil fertility through nitrogen fixation make it an ideal candidate for sustainable forage systems.

2.4. Crop Management and Agronomic Practices

Sowing was performed manually at the start of November, with fenugreek sown at a row spacing of 30 cm and a seeding rate of 32 kg/ha, ensuring optimal plant density for forage production. The fertilization treatments included Biocyclic-Vegan Humus Soil (BHS), Farmyard Manure (FMA), Organic Compost (OCP), and Inorganic Fertilizer (11-14-14) (IFZ), each applied at a consistent nitrogen rate of 110 kg N/ha to standardize nitrogen input across treatments. The control treatment (CTRL) received no fertilization but was otherwise managed identically to the other treatments, including the same sowing method, plant density, salinity application (where applicable), and manual weed control, ensuring that any differences in plant performance were due solely to the absence of nutrient input.
Fertilization treatments, including Biocyclic-Vegan Humus Soil (BHS), Farmyard Manure (FMA), commercial compost (OCP), and inorganic NPK fertilizer, were all standardized to deliver 110 kg N ha−1. BHS, applied at 3.928 tons ha−1, is a certified plant-based amendment used as a substitute for animal-derived fertilizers under the Biocyclic-Vegan Standard. It contained 46.3% organic matter, 2.8% total nitrogen, and had a pH of 7.6. FMA, sourced from the university’s stables and applied at 6.875 tons ha−1, had a composition of 1.60% total N, 8.9 mg/L available phosphorus (P, Olsen), 4.4% organic carbon, and a pH of 7.39. The commercial compost (OCP), applied at 9.166 tons ha−1, was composed of 70% compost, 15% black peat, 10% perlite, and 5% soil, with a pH range of 5.5–6.8 and a total nitrogen content of 1.2%. Inorganic fertilizer (NPK, 11–15–15) was applied at 1 ton ha−1, delivering macronutrients in mineral form.
Farmyard Manure and compost were selected as they are commonly used organic fertilizers in Greece, while Biocyclic-Vegan Humus Soil (BHS) was included as a novel, animal-free amendment with potential for salinity stress mitigation.
Salinity treatment commenced one week after sowing. For the High Salinity Level (HSL) plots, 200 kg/ha of NaCl was uniformly applied to the soil surface to simulate moderately saline conditions typical of arid and semi-arid agricultural regions. In contrast, the Normal Salinity Level (NSL) plots received no NaCl. Soil electrical conductivity (EC) measurements confirmed the salinity levels, with EC values of 1.39 dS/m for NSL and 3.52 dS/m for HSL. These values reflect moderate salinity stress, comparable to soils influenced by irrigation with moderately saline water. The NaCl application rate was determined through preliminary trials to reliably induce this level of stress, as validated by the post-treatment EC reading of 3.52 dS/m—well within the established range for moderately saline soils [44,45].
No irrigation system was used during the experiment, as the crop was sown at the beginning of the growing season, relying entirely on natural rainfall to meet water requirements. This approach allowed the applied NaCl to dissolve and incorporate into the soil profile naturally. While this method risked surface salt accumulation, potentially impacting some plants, it was an intentional aspect of the experimental design to observe fenugreek’s resilience to salinity stress in a rain-fed system. Weed management was conducted manually to prevent competition for nutrients, light, and water, without the use of chemical herbicides. No significant pest or disease outbreaks were observed during the growing period, eliminating the need for pesticide applications. Harvesting occurred at 182 Days After Sowing (DAS), corresponding to the final maturity stage of the annual crop cycle, when fenugreek had reached full pod maturity.

2.5. Data Collection

2.5.1. Plant and Seed Composition

For proximate composition analysis, plant samples were collected at 115 DAS, corresponding to the fodder stage, while seed samples were collected at harvest (182 DAS) when fenugreek reached full pod maturity. Sampling for both plants and seeds was conducted using a 0.25 m2 quadrat, with one representative sample per treatment to ensure accurate and reliable data collection. The collected plant samples were dried at 72 °C for 48 h to reach a constant weight. After drying, both plant and seed samples were ground to a uniform particle size using a 1 mm Wiley mill screen (Thomas T4274.E15 Steel Model 4 Wiley Mill; Arthur H. Thomas, Philadelphia, PA, USA), ensuring consistency in sample preparation for chemical analysis.
The nitrogen content of the ground samples was determined using a fully automated Kjeldahl analyzer (Kjeltec 8400; Foss Tecator AB, Höganas, Sweden). Crude protein was calculated by multiplying the nitrogen concentration by 6.25, following the standard conversion factors outlined in the Association of Official Agricultural Chemists (AOAC) guidelines. In addition to crude protein, the ground samples were analyzed for crude ash, dry matter, total fat, and crude fiber using AOAC-approved methods, ensuring standardized and accurate evaluation of the forage’s chemical composition (Table 1).

2.5.2. Nutritional Composition

To assess the nutritional value and feeding potential of fenugreek as forage, a comprehensive analysis of its nutrient profile was conducted. This evaluation focused on key variables essential for understanding the energy content, carbohydrate availability, and mineral balance necessary for optimal livestock performance. All indices, including Total Digestible Nutrients (TDN), Non-Fiber Carbohydrate (NFC), and Calcium-to-Phosphorus Ratio (Ca:P), were calculated exclusively from forage samples, excluding the seeds, to provide an accurate assessment of the forage’s nutritional composition and feeding value.
One of the parameters measured was Total Digestible Nutrients (TDN), which estimates the overall energy content available to the animal. TDN was calculated using Acid Detergent Fiber (ADF) as a predictor of digestibility, as ADF is negatively correlated with energy availability (Equation (1)).
T D N = 105.2 ( 0.69 A D F )
where 105.2 is the intercept representing the theoretical TDN value when ADF is zero, and 0.69 is the slope indicating the rate at which TDN decreases as ADF increases. This empirical equation is derived from statistical correlations between ADF and TDN in forage samples, accurately reflecting the inverse relationship between indigestible fiber content and energy availability. Higher ADF values indicate lower digestible energy, while lower ADF values correspond to higher TDN, providing greater energy availability for livestock. The coefficients are forage-specific and provide a reliable estimate of the energy potential of different forage types, making this method widely used for assessing the feeding value of forages [50].
Another parameter assessed was Non-Fiber Carbohydrate (NFC), which represents the readily available carbohydrate portion influencing energy supply and rumen fermentation patterns in ruminants (Equation (2)).
N F C % = 100 ( N D F + C P + T F + C A )
This accounts for soluble carbohydrates, including sugars and starches, which are rapidly fermented in the rumen, impacting microbial protein synthesis and energy availability. Maintaining a balanced NFC level is essential to prevent ruminal acidosis while maximizing energy utilization [51].
The Calcium-to-Phosphorus Ratio (Ca:P ratio) was also measured to evaluate the mineral balance necessary for bone development, metabolic functions, and optimal animal growth. The ratio was calculated to ensure nutritional adequacy and optimal utilization [52].

2.5.3. Digestibility Indices

The Digestible Dry Matter (DDM), Dry Matter Intake (DMI), and Fiber-to-Protein Ratio (FPR) were calculated to evaluate the forage’s digestibility, intake potential, and nutrient balance. These indices provide essential insights into the feeding value of fenugreek forage, influencing livestock performance and productivity. Digestible Dry Matter (DDM) estimates the proportion of dry matter that is digestible by the animal, reflecting the forage’s overall quality and energy availability (Equation (3)) [53,54].
D D M = 88.9 ( 0.779 A D F )
where 88.9 is the intercept representing maximum potential digestibility, and 0.779 is the slope indicating the decline in digestibility as Acid Detergent Fiber (ADF) increases. This inverse relationship occurs because higher ADF values indicate greater lignin and cellulose content, which reduces overall digestibility.
Dry Matter Intake (DMI) evaluates the amount of forage an animal is likely to consume as a percentage of its body weight, providing an estimate of the forage’s intake potential (Equation (4)).
D M I ( % b o d y   w e i g h t ) = 120 N D F
This calculation is based on the negative correlation between Neutral Detergent Fiber (NDF) and intake potential, as higher NDF levels are associated with increased bulk and reduced voluntary intake. Therefore, forages with lower NDF are typically consumed in greater quantities [53,54].
The Fiber-to-Protein Ratio (FPR) was calculated to assess the balance between fiber content and crude protein, providing insights into the nutritional quality of the forage (Equation (5)).
F P R = C F C P
This ratio is crucial for evaluating the digestibility and nutritional balance of the forage, as a lower FPR indicates a better balance between fiber and protein, leading to improved digestibility and nutrient utilization. Conversely, a high FPR suggests a fiber-dense forage with lower protein content, which may limit animal productivity.
Protein density (PD) was calculated to evaluate the concentration of crude protein relative to the total dry matter content of the forage, providing an indication of the protein-richness of fenugreek forage (Equation (6)).
P r o t e i n   D e n s i t y   % = C P D M C 100
where CP represents the crude protein percentage of the forage, and DMC denotes the total dry matter content. This index provides insights into the protein efficiency and nutritional quality of the forage, influencing livestock performance and dietary formulation.

2.5.4. Forage Quality Indicators

The Relative Feed Value (RFV), Relative Forage Quality (RFQ), and Forage Quality Index (FQI) were calculated to provide a comprehensive evaluation of the feeding value and nutritional quality of fenugreek forage.
The Relative Feed Value (RFV) is an index that estimates forage quality by combining Dry Matter Intake (DMI) and Digestible Dry Matter (DDM) to predict animal intake and digestibility (Equation (7)).
R F V = ( 120 N D F ) D D M 100 100
where DMI is expressed as a percentage of body weight and represents the forage’s intake potential, and DDM is the proportion of dry matter that is digestible. The constant 1.29 is used to standardize the index, setting alfalfa hay with full bloom at RFV = 100. Higher RFVs indicate better forage quality, with RFV > 150 considered excellent, suitable for dairy cattle and growing animals, while RFV < 100 indicates lower-quality forage suitable for maintenance rations [54].
The Relative Forage Quality (RFQ) provides a more accurate estimation of forage quality by incorporating Total Digestible Nutrients (TDN) instead of DDM, accounting for the digestibility of fiber (Equation (8)).
R F Q = D M I T D N 1.23
The constant 1.23 adjusts the scale to be comparable with RFV. The RFQ provides a more precise evaluation of energy availability and animal performance because it considers fiber digestibility. It is particularly useful for comparing grasses and legume forages, which vary significantly in fiber composition and digestibility.
The Forage Quality Index (FQI) was calculated to assess the overall nutritional value of the forage by combining Total Digestible Nutrients (TDN) and crude protein (CP) (Equation (9)).
F Q I = T D N C P 100
This index integrates the energy content (TDN) and protein content (CP) to provide a single value reflecting the forage’s overall nutritional quality. A higher FQI indicates better feeding value, making it useful for comparing different forage species or management practices.

2.6. Statistical Analysis

The analysis of variance (ANOVA) was conducted using Statistica software 10.00 (StatSoft, Inc., Tulsa, OK, USA), employing a split-plot design to assess the significance of differences among fertilization and salinity treatments. ANOVA was chosen for its ability to partition variance among multiple sources, allowing for the evaluation of the main effects of fertilization type, salinity level, and their interaction on key forage quality parameters. This statistical approach enabled the identification of significant interactions between fertilization and salinity levels, ensuring robust and reliable comparisons across treatments.
The coefficient of variation (CV) was used to identify the relative variability and consistency of each measured trait across different fertilization and salinity treatments. It was calculated as the ratio of the standard deviation to the mean, expressed as a percentage (Equation (9)). A lower CV indicated more consistent responses, while a higher CV suggested greater variability in the data. This approach allowed for a more accurate comparison of treatment effects, regardless of differences in mean values among variables.
C V = S t a n d a r d   D e v i a t i o n   M e a n 100  
Tukey’s Honest Significant Difference (HSD) test was applied for post hoc comparisons to determine significant differences among treatment means at a significance level of p < 0.05. Assumptions of normality and homogeneity of variance were tested using the Shapiro–Wilk test and Levene’s test, respectively. Where necessary, data transformations were applied to meet ANOVA assumptions.

3. Results

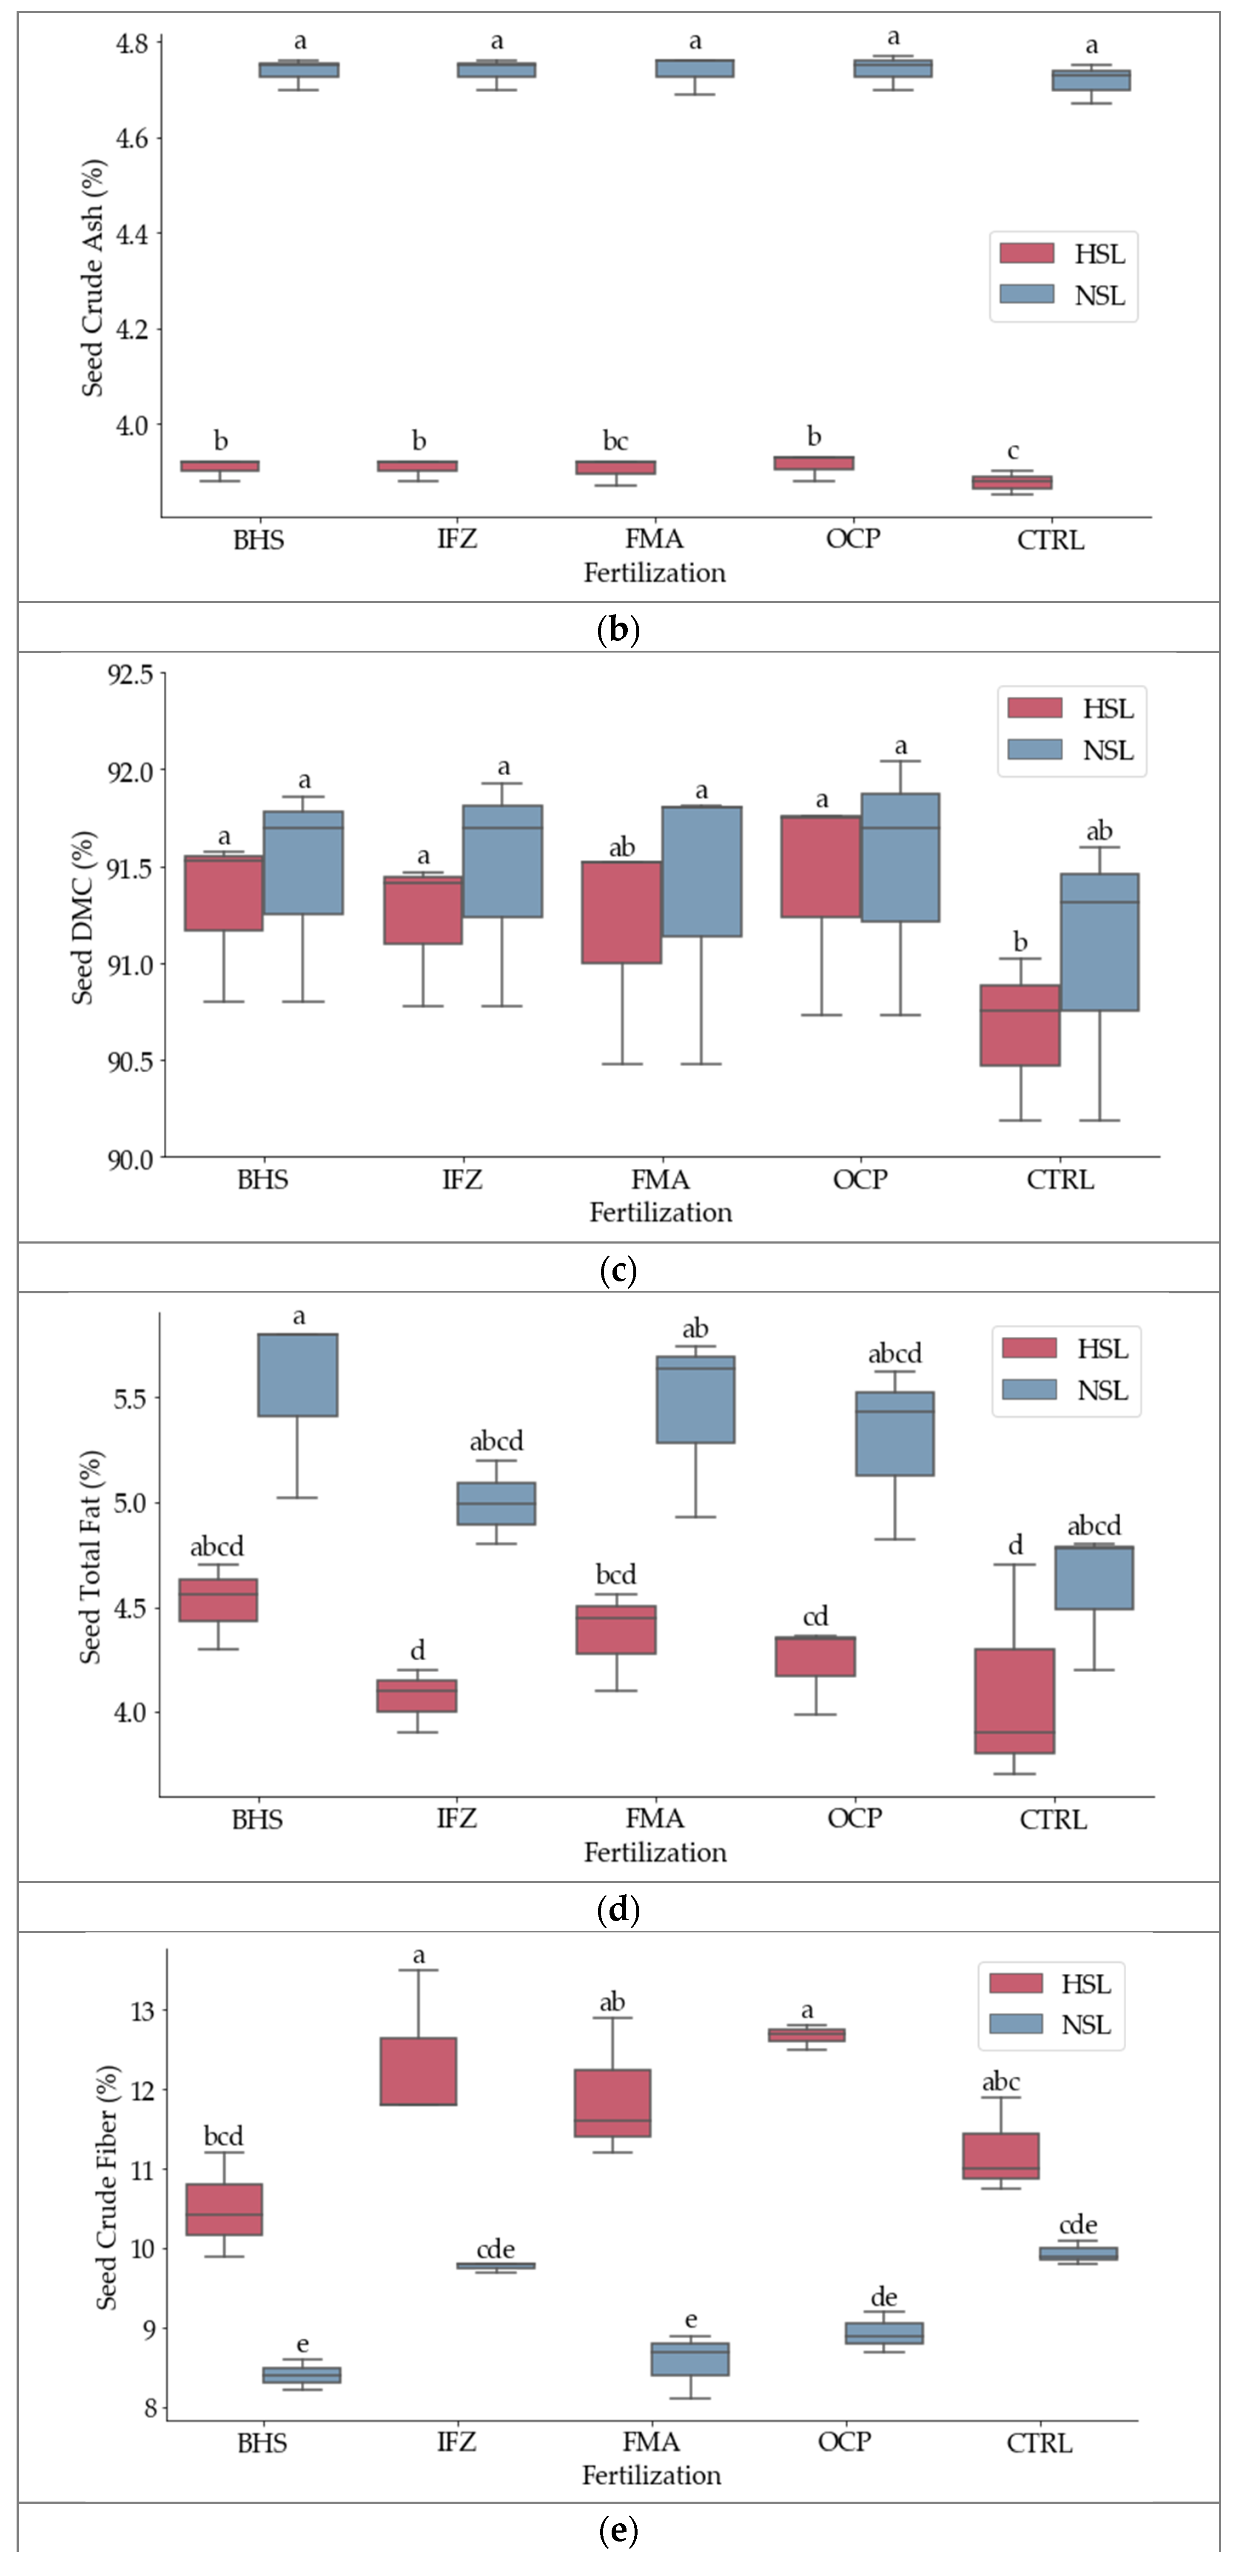
3.1. Nutritional Composition

ANOVA showed that fertilization type significantly affected seed CP (F = 107.07, p < 0.001), indicating substantial differences among treatments (Table 2). Salinity also had a significant effect (F = 5.89, p <0.05), though its impact was smaller. However, the interaction between fertilization and salinity was not significant (F = 0.18, p = 0.945), suggesting independent effects (Table 2). Additionally, Tukey’s HSD test for seed CP showed that fertilization type and salinity level significantly influenced CP content (Figure 3a). The highest CP values were observed under BHS at NSL (36.88%) and FMA at NSL (35.83%), which were not statistically different from each other. No significant differences were found among IFZ at NSL (35.21%), BHS at HSL (34.92%), IFZ at HSL (33.54%), FMA at HSL (33.33%), and OCP at NSL (32.50%) (Figure 3a). The data showed high consistency for IFZ with the narrowest IQR under NSL, indicating stable protein synthesis regardless of salinity. In contrast, OCP exhibited the highest variability under HSL, suggesting its effectiveness is more influenced by salinity stress (Figure 3a).
Moreover, ANOVA revealed a significant effect of fertilization type on seed CA content (F = 16.86, p = 0.0006), indicating notable differences among treatments. Salinity had an extremely strong effect (F = 59,495.62, p < 0.001), showing a dominant influence on seed CA (Table 2). The highest CA values were observed under OCP at NSL (4.74%), IFZ at NSL (4.74%), BHS at NSL (4.74%), FMA at NSL (4.73%), and CTRL at NSL (4.72%), which were not statistically different from each other (Figure 3b). No significant differences were found among OCP at HSL (3.92%), BHS at HSL (3.91%), and IFZ at HSL (3.91%). The lowest CA values were recorded under CTRL at HSL (3.88%), indicating a statistically significant difference compared to other treatments (Figure 3b).
Consistently, ANOVA revealed that fertilization significantly influenced seed DMC (F = 16.76, p < 0.001), indicating strong differences among treatments (Table 2). Salinity also had a significant effect (F = 10.2, p < 0.01), though its impact was smaller than fertilization. Tukey’s HSD test for seed DMC showed that fertilization type and salinity level significantly influenced DMC. The highest DMC values were observed under OCP at NSL (91.49%), IFZ at NSL (91.47%), BHS at NSL (91.45%), OCP at HSL (91.41%), and FMA at NSL (91.36%), which were not statistically different from each other. No significant differences were found among BHS at HSL (91.30%), IFZ at HSL (91.22%), FMA at HSL (91.17%), and CTRL at NSL (91.03%). The lowest DMC value was recorded under CTRL at HSL (90.65%), indicating a statistically significant difference compared to other treatments. The data showed high consistency for IFZ with the narrowest IQR under HSL (IQR = 0.345), indicating stable performance under saline conditions. In contrast, CTRL exhibited the highest variability under NSL (IQR = 0.705), suggesting that its effectiveness is more influenced by reduced salinity (Figure 3c).
Notably, the analysis of variance showed that both fertilization and salinity had significant effects on seed TF. Fertilization exhibited a strong influence (F = 11.8, p < 0.01), indicating that different fertilization treatments led to notable differences in fat accumulation. Salinity had an even greater impact (F = 34.3, p < 0.001), highlighting its dominant role in determining TF levels. The CV indicated relatively stable responses, with a lower CV at the fertilization level (4.19%) and a slightly higher variation when considering both factors (9.06%) (Table 2). These findings underscore salinity as the primary driver of TF content, with fertilization playing a secondary but significant role. The highest TF was under BHS at NSL (5.54%), followed closely by FMA at NSL (5.44%). No significant differences were observed among OCP at NSL (5.29%), IFZ at NSL (5.00%), CTRL at NSL (4.59%), and BHS at HSL (4.52%). The lowest TF values occurred under IFZ at HSL (4.07%) and CTRL at HSL (4.10%). BHS and FMA at NSL increased TF, while the lowest values were under IFZ and CTRL at HSL, indicating that optimal fertilization is crucial for maintaining fat content under salinity stress. The data showed high consistency for IFZ with the narrowest IQR under HSL (IQR = 0.15), indicating stable TF under saline conditions. In contrast, CTRL exhibited the highest variability under HSL (IQR = 0.5), suggesting that its TF content is more influenced by salinity stress (Figure 3d).
Furthermore, the ANOVA results indicate that both fertilization and salinity significantly influenced seed CF. Fertilization had a strong effect (F = 10.46, p < 0.01), suggesting notable differences among treatments. Salinity exhibited an even more pronounced impact (F = 136.39, p < 0.001), making it the dominant factor affecting crude fiber levels (Table 2). The CVs were relatively low, indicating consistent results across treatments (4.53% for fertilization and 5.87% for the combined effect). The highest CF values were observed under OCP at HSL (12.67%) and IFZ at HSL (12.37%). No significant differences were found among FMA at HSL (11.90%), CTRL at HSL (11.22%), and BHS at HSL (10.51%). The lowest CF values occurred under FMA at NSL (8.57%) and BHS at NSL (8.40%). The data showed high consistency for IFZ with the narrowest IQR under NSL (IQR = 0.05), indicating stable performance under reduced salinity. In contrast, FMA and IFZ exhibited the highest variability under HSL (IQR = 0.85), suggesting that their effectiveness is more influenced by salinity stress (Figure 3e).
The ANOVA results demonstrated that both fertilization and salinity significantly influenced plant CP. Fertilization had a strong effect (F = 15.06, p < 0.001), indicating substantial differences among treatments (Table 3). Salinity also had a significant impact (F = 5.83, p < 0.05), though its influence was less pronounced compared to fertilization. The CVs were higher than in previous traits, particularly for the combined effect of fertilization and salinity (18.19%), indicating more variability in response (Table 3). These findings highlight fertilization as the primary factor influencing crude protein levels, with salinity playing a secondary but significant role. The highest CP values were observed under BHS at NSL (17.92%) and FMA at NSL (17.19%). No significant differences were found among IFZ at NSL (16.38%), OCP at NSL (15.73%), and BHS at HSL (15.08%). The lowest CP values occurred under CTRL at NSL (11.38%) and CTRL at HSL (11.31%). The data showed high consistency for OCP with the narrowest IQR under HSL (IQR = 0.25), indicating stable crude protein content under saline conditions. In contrast, BHS exhibited the highest variability under NSL (IQR = 4.22), suggesting that its crude protein content is more influenced by reduced salinity (Figure 4a).
Fertilization significantly affected plant CA content (F = 16.86, p < 0.001), while salinity had an overwhelming impact (F = 14,206.33, p < 0.001), indicating its dominant role. The low CVs (0.17% for fertilization and 0.21% for the combined effect of fertilization and salinity) indicate minimal variability within treatments, meaning the differences observed were due to the treatments themselves rather than random variation (Table 3). In other words, the measured plant CA content showed strong stability across replicates, reinforcing the reliability of the observed effects. The highest CA values occurred under OCP at NSL (9.71%), IFZ at NSL (9.71%), BHS at NSL (9.71%), FMA at NSL (9.70%), and CTRL at NSL (9.66%). No significant differences were observed among OCP at HSL (8.88%), BHS at HSL (8.87%), and IFZ at HSL (8.86%). The lowest CA value was recorded under CTRL at HSL (8.80%). The data showed high consistency for IFZ with the narrowest IQR under HSL (IQR = 0.005), indicating stable crude ash content under saline conditions. In contrast, CTRL exhibited the highest variability under NSL (IQR = 0.05), suggesting that its crude ash content is more influenced by reduced salinity (Figure 4b).
Fertilization had a significant effect on plant DMC (F = 16.86, p < 0.001), while salinity also showed a strong influence (F = 10.2, p < 0.01). The CVs were very low, particularly for the combined effect of fertilization and salinity (0.2%), indicating highly consistent responses across treatments (Table 3). These findings highlight fertilization as the primary factor influencing DM content, with salinity playing a secondary but significant role. The highest DMC values were measured under OCP at NSL (90.32%), IFZ at NSL (90.30%), BHS at NSL (90.28%), OCP at HSL (90.24%), and FMA at NSL (90.19%). DMC values did not differ significantly among BHS at HSL (90.13%), IFZ at HSL (90.05%), and FMA at HSL (90.00%). The lowest DMC was observed under CTRL at HSL (89.48%). The data showed high consistency for IFZ with the narrowest IQR under HSL (IQR = 0.08), indicating stable dry matter content under saline conditions. In contrast, CTRL exhibited the highest variability under NSL (IQR = 0.44), suggesting that its dry matter content is more influenced by reduced salinity (Figure 4c).
Fertilization significantly influenced plant TF content (F = 14.11, p < 0.01), while salinity had an even stronger effect (F = 80.72, p < 0.001), confirming its dominant role. Additionally, the interaction between fertilization and salinity was significant (F = 5.57, p < 0.05), indicating that the response to salinity varied depending on the fertilization treatment (Table 3). The CVs were relatively low, particularly for the combined effect of fertilization and salinity (3.94%), suggesting stable responses across treatments. The results demonstrate that salinity is the dominant factor affecting total fat content, while fertilization also contributes significantly and interacts with salinity to shape the observed response. The highest plant TF value was recorded under BHS at NSL (2.00%), followed closely by CTRL at NSL (1.89%), OCP at NSL (1.85%), and FMA at NSL (1.85%). No significant differences were detected among IFZ at NSL (1.79%), BHS at HSL (1.78%), and FMA at HSL (1.74%). The lowest TF content was found under CTRL at HSL (1.43%). The data showed high consistency for CTRL with the narrowest IQR under NSL (IQR = 0.025), indicating stable total fat content under reduced salinity. In contrast, IFZ exhibited the highest variability under NSL (IQR = 0.11), suggesting that its total fat content is more influenced by reduced salinity (Figure 4d).
Fertilization had a highly significant effect on plant CF content (F = 50.24, p < 0.001), indicating strong differences among treatments. Salinity also had a significant impact (F = 31.31, p < 0.001), although its effect was smaller than that of fertilization. The CVs were very low, particularly for the combined effect of fertilization and salinity (2.09%), indicating highly consistent responses across treatments (Table 3). The results indicate that fertilization is the main factor affecting crude fiber content, while salinity also plays a secondary yet significant role. The highest CF value was noted under IFZ at NSL (19.10%), with no significant difference from IFZ at HSL (18.05%). Plant CF levels were similar among FMA at NSL (17.42%), BHS at NSL (17.15%), OCP at NSL (17.14%), and FMA at HSL (17.07%). The lowest CF content occurred under CTRL at HSL (15.50%). The data showed high consistency for IFZ with the narrowest IQR under HSL (IQR = 0.105), indicating stable crude fiber content under saline conditions. In contrast, FMA exhibited the highest variability under NSL (IQR = 0.66), suggesting that its crude fiber content is more influenced by reduced salinity (Figure 4e).

3.2. Nutritional Composition

Fertilization had a highly significant effect on TDN (F = 50.24, p < 0.001), indicating strong differences among treatments. Salinity also significantly influenced TDN (F = 31.31, p < 0.001), though its effect was smaller compared to fertilization. The CVs were very low (0.38% for fertilization and 0.39% for the combined effect of fertilization and salinity), indicating highly consistent responses across treatments (Table 4). Tukey’s HSD test for TDN revealed that fertilization type and salinity level significantly influenced TDN. The highest TDN was recorded under CTRL at HSL (90.14), followed by CTRL at NSL (89.57). No significant differences were observed among OCP at HSL (89.35), BHS at HSL (89.34), FMA at HSL (88.62), OCP at NSL (88.55), and BHS at NSL (88.55). The lowest TDN was noted under IFZ at NSL (86.65) (Figure 5a).
Fertilization had a highly significant effect on NFC (F = 57.89, p < 0.001), indicating substantial differences among treatments. Salinity also had a significant impact (F = 36.12, p < 0.001), though its effect was less pronounced than fertilization. The CVs were moderate, with a higher value for the combined effect of fertilization and salinity (7.49%), indicating some variability in response. The results indicate that fertilization is the main factor affecting NFC, while salinity also has a significant but independent impact. Tukey’s HSD test for NFC showed that fertilization type and salinity level significantly impacted NFC. The highest NFC was recorded under CTRL at HSL (37.44), followed by CTRL at NSL (35.10), indicating that the control treatment maintained higher carbohydrate levels under both salinity conditions. Intermediate NFC values were observed under OCP at HSL (33.72%), BHS at HSL (31.60%), and FMA at HSL (30.52%), showing moderate reductions compared to the control. The lowest NFC content was found under IFZ at NSL (22.73%), highlighting the combined effect of IFZ fertilization and non-saline conditions in reducing NFC (Figure 5b).
The Ca:P ratio was not statistically affected by treatments. The CVs were moderate, with a higher value for the combined effect of fertilization and salinity (8.38%), indicating some variability in response. The results reveal that neither fertilization nor salinity alone significantly affected the Ca:P ratio, but their interaction contributed to its variation. Tukey’s HSD test for the Ca:P ratio indicated no significant differences among the treatments, as all groups were statistically similar. The highest Ca:P ratio was observed under IFZ at HSL (4.24), followed closely by FMA at NSL (4.23) and CTRL at NSL (4.20).

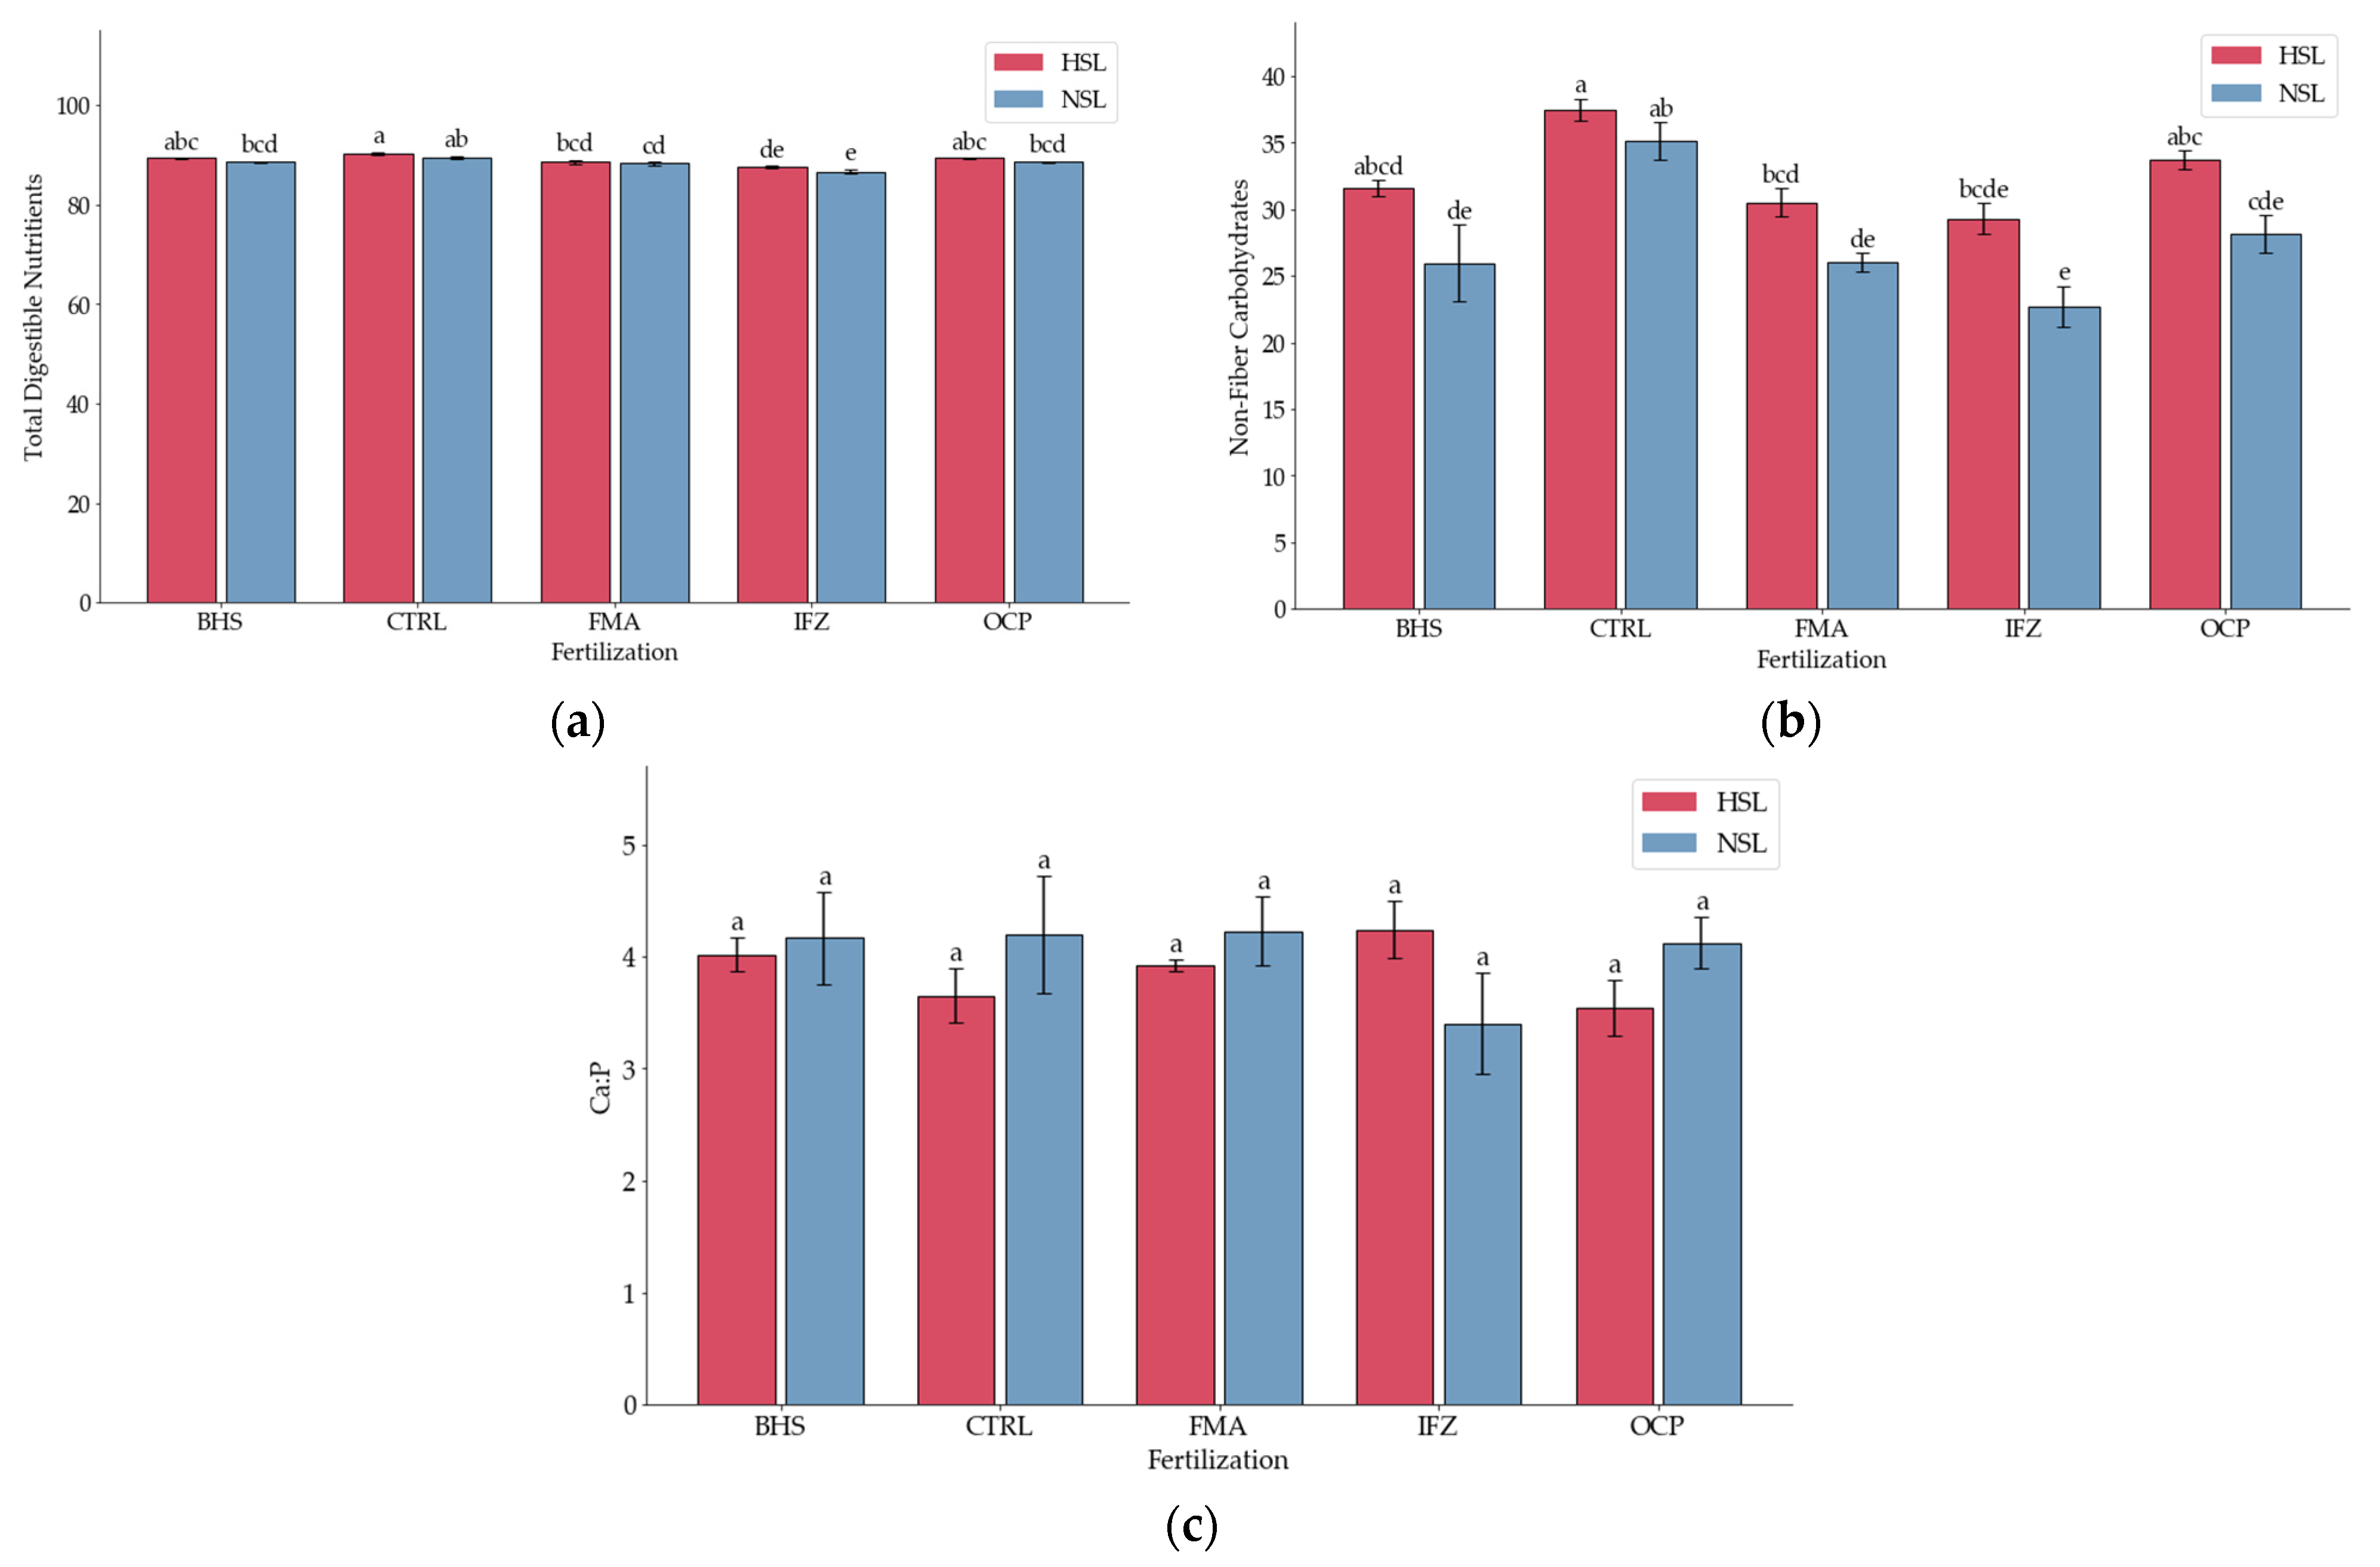
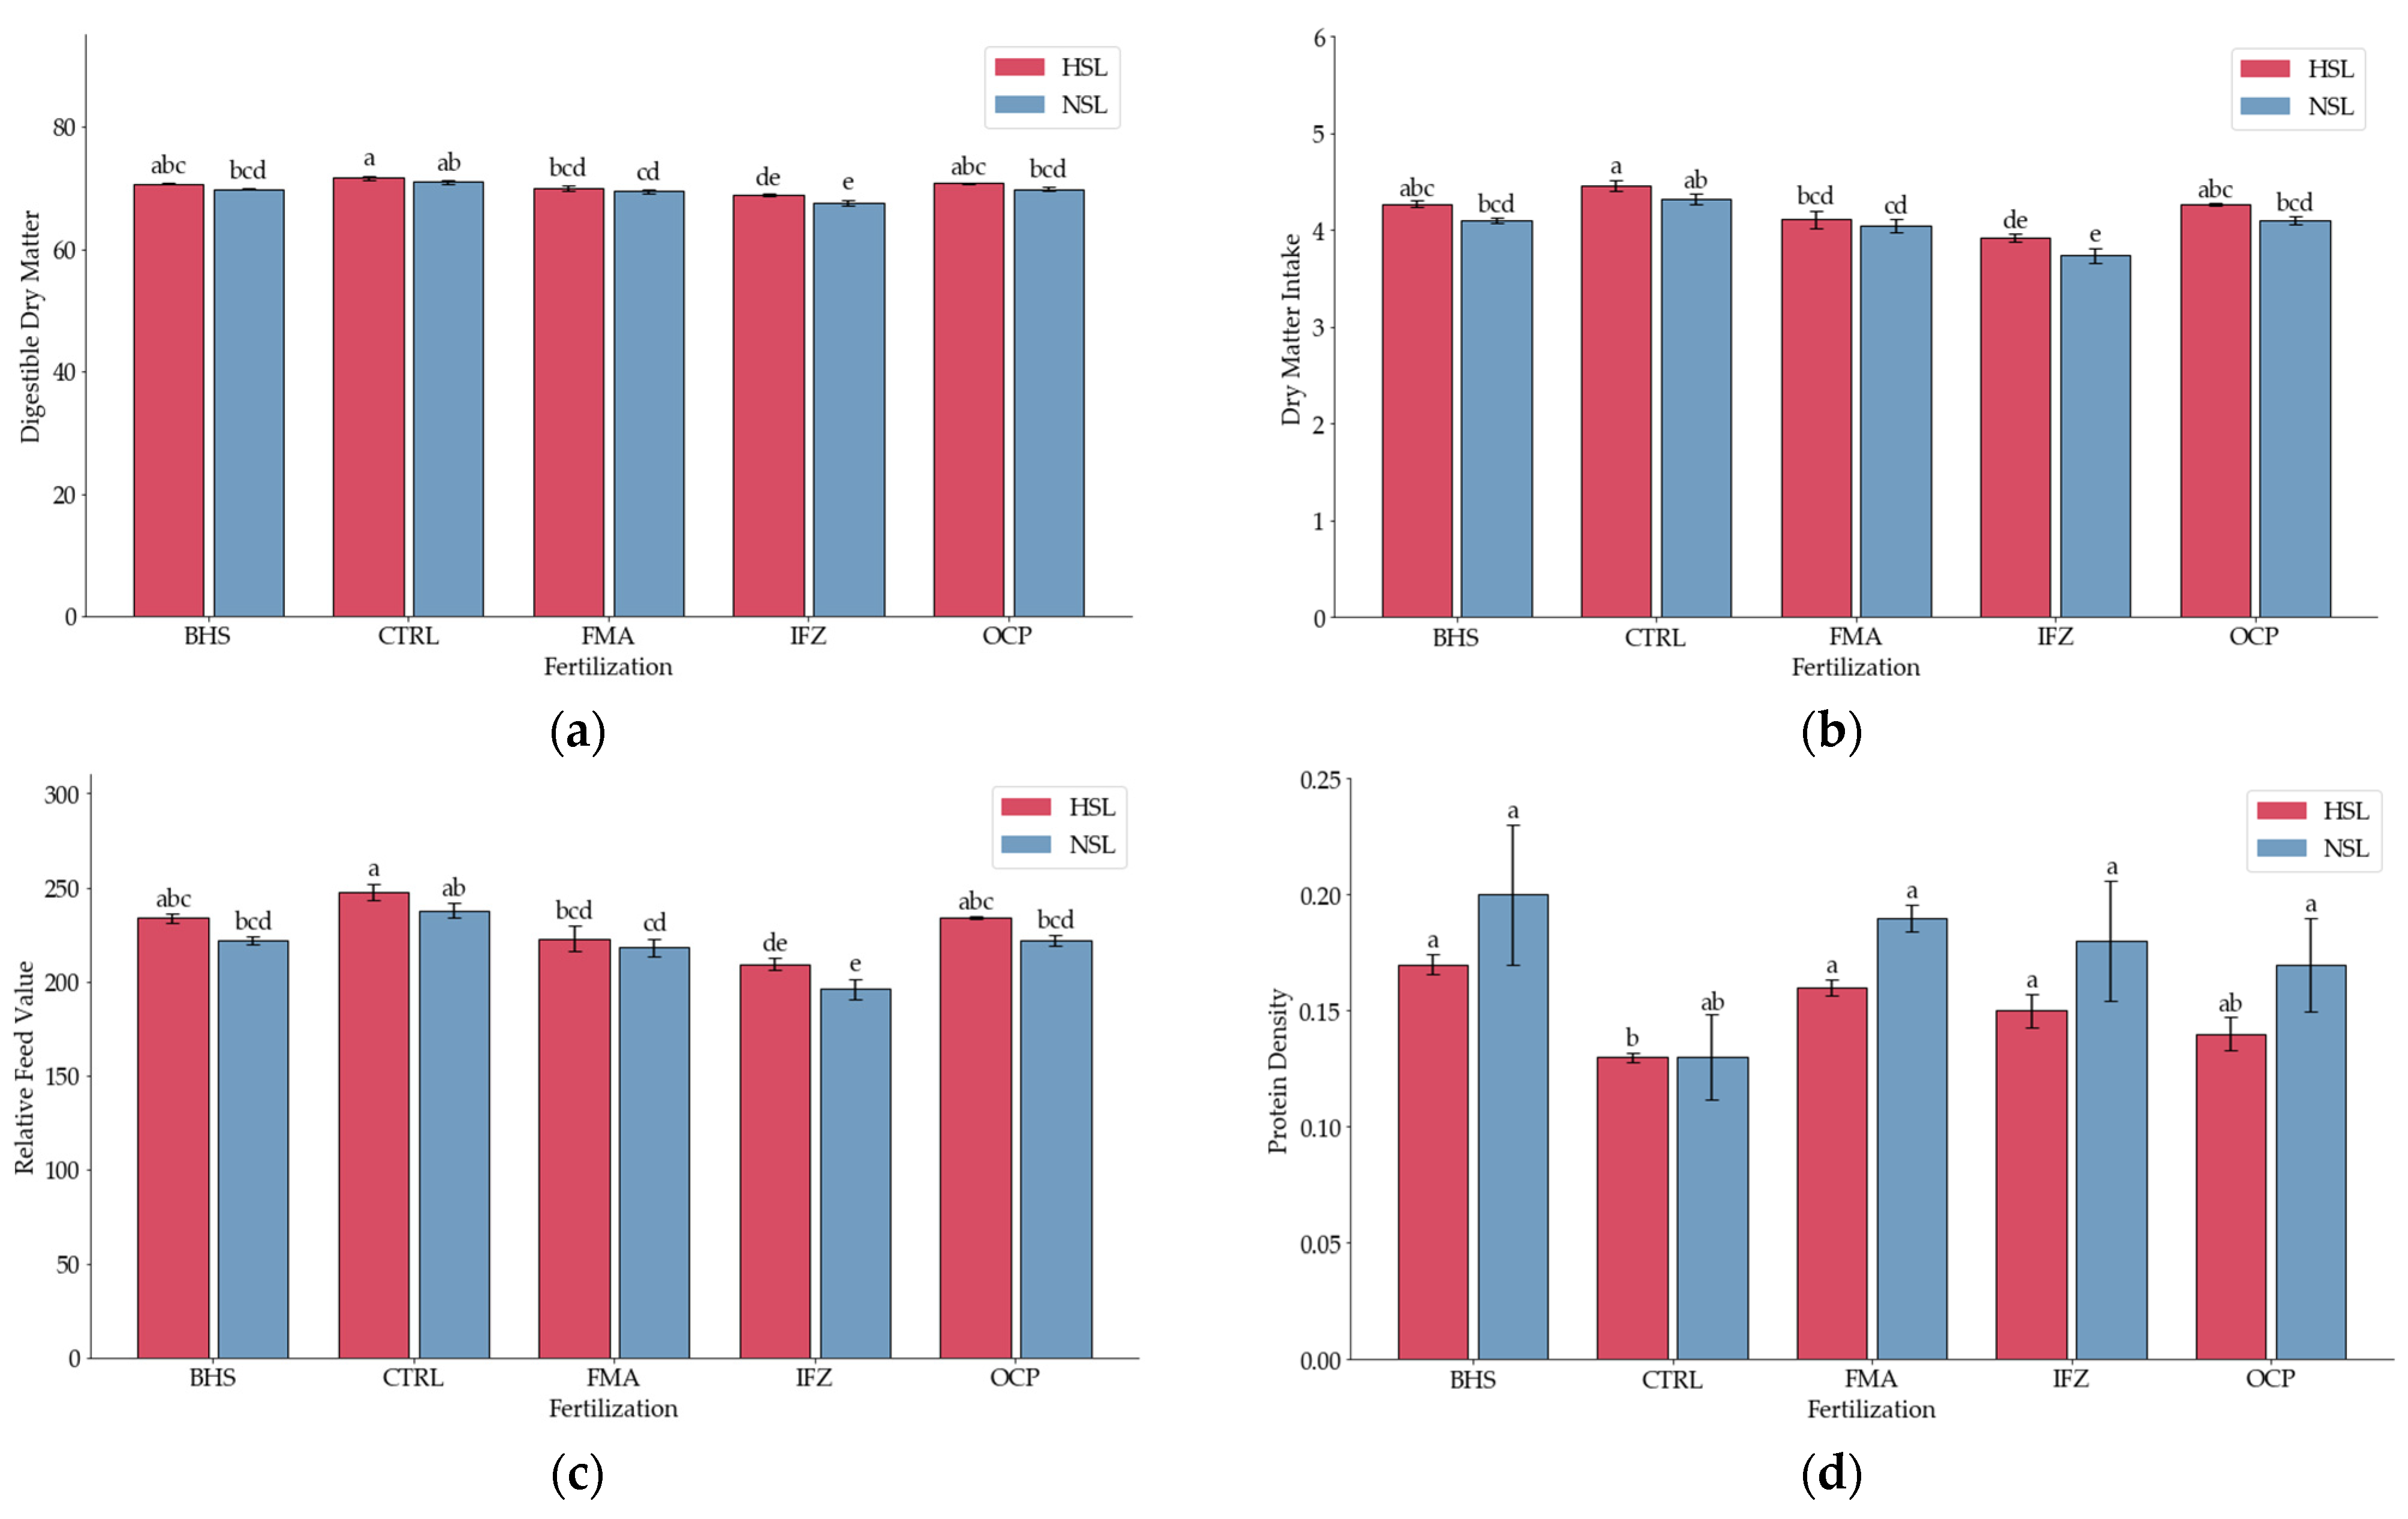
3.3. Digestibility Indices

Fertilization had a highly significant effect on DDM (F = 50.24, p < 0.001), indicating strong differences among treatments. Salinity also had a significant impact (F = 31.31, p < 0.001), though its effect was smaller compared to fertilization. The CVs were very low (0.56% for both fertilization and the combined effect of fertilization and salinity), indicating highly consistent responses across treatments (Table 4). The results reveal that fertilization is the main factor affecting DDM, while salinity also has a significant impact. The highest DDM value was observed under CTRL at HSL (71.65%), followed by CTRL at NSL (71.00%). No significant differences were identified among OCP at HSL (70.74%), BHS at HSL (70.73%), FMA at HSL (69.91%), OCP at NSL (69.83%), and BHS at NSL (69.82%). The lowest DDM was found under IFZ at NSL (67.64%) (Figure 6a).
Fertilization had a highly significant effect on DMI (F = 39.69, p < 0.001), indicating substantial differences among treatments. Salinity also had a significant impact (F = 31.15, p < 0.001), though its effect was less pronounced than that of fertilization. The CVs were relatively low (1.91% for fertilization and 1.73% for the combined effect of fertilization and salinity), indicating stable and consistent responses across treatments. These findings highlight fertilization as the primary factor influencing DMI, with salinity also playing a significant but independent role. The highest DMI was recorded under CTRL at HSL (4.46%), followed by CTRL at NSL (4.32%). DMI values were statistically similar among OCP at HSL (4.27%), BHS at HSL (4.27%), FMA at HSL (4.11%), OCP at NSL (4.10%), and BHS at NSL (4.10%). The lowest DMI occurred under IFZ at NSL (3.74%) (Figure 6b).
ANOVA for FPR showed that fertilization had a significant effect on FPR (F = 17.12, p < 0.001). The CV was 6.82% for Replication × Fertilization and 15.3% for Replication × Fertilization × Salinity, indicating moderate variability in the data (Table 4). The highest FPR was recorded under CTRL at NSL (1.42), followed by IFZ at HSL (1.38%) and CTRL at HSL (1.37%). All other treatments showed comparable FPR values, suggesting that fertilization type and salinity level did not significantly influence FPR content. No significant differences were observed, indicating a consistent balance between fiber and protein across all treatments (Figure 6c).
Fertilization had a significant effect on protein density (F = 14.95, p < 0.001), indicating notable differences among treatments. Salinity also had a significant impact (F = 5.71, p < 0.05), though its effect was smaller compared to fertilization. The CVs were higher than in previous traits, particularly for the combined effect of fertilization and salinity (18.07%), indicating more variability in response (Table 4). The results demonstrate that fertilization is the main factor affecting protein density, while salinity plays a secondary yet significant role. The highest protein density was observed under BHS at NSL (0.20), followed by FMA at NSL (0.19%) and IFZ at NSL (0.18%). No significant differences were found among the other treatments, except for CTRL at HSL (0.13%), which had the lowest protein density (Figure 6d).

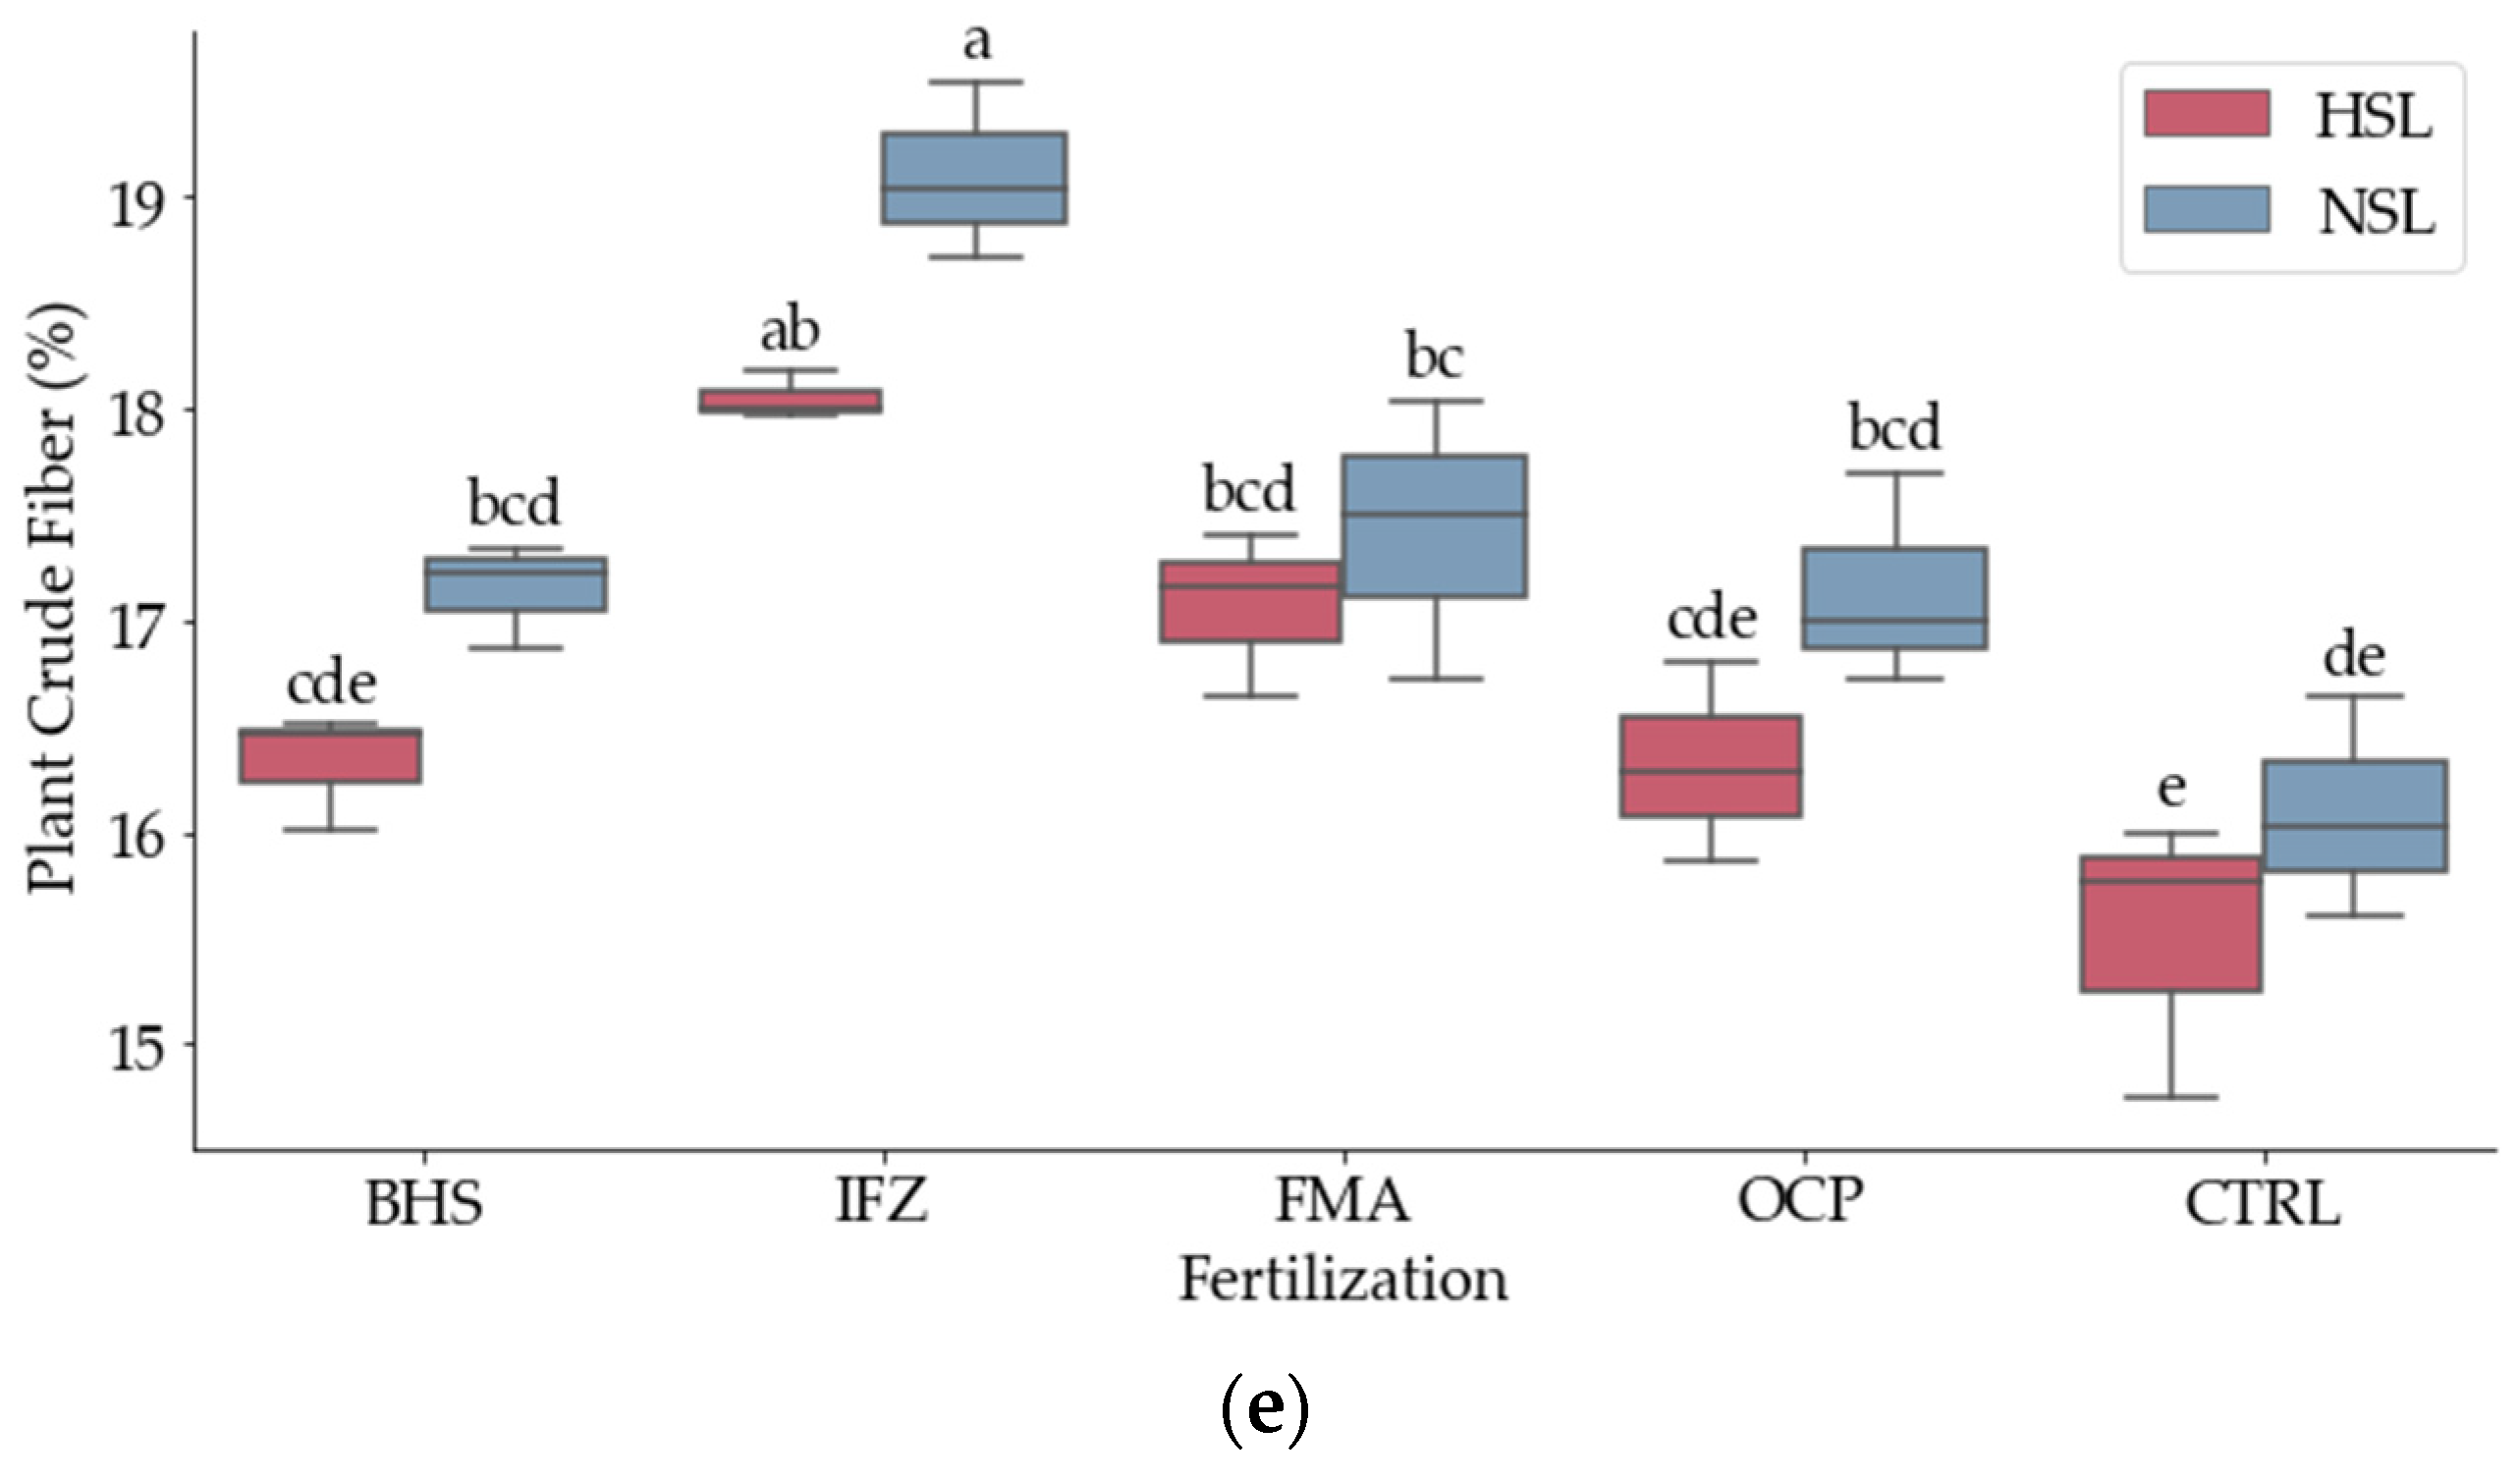
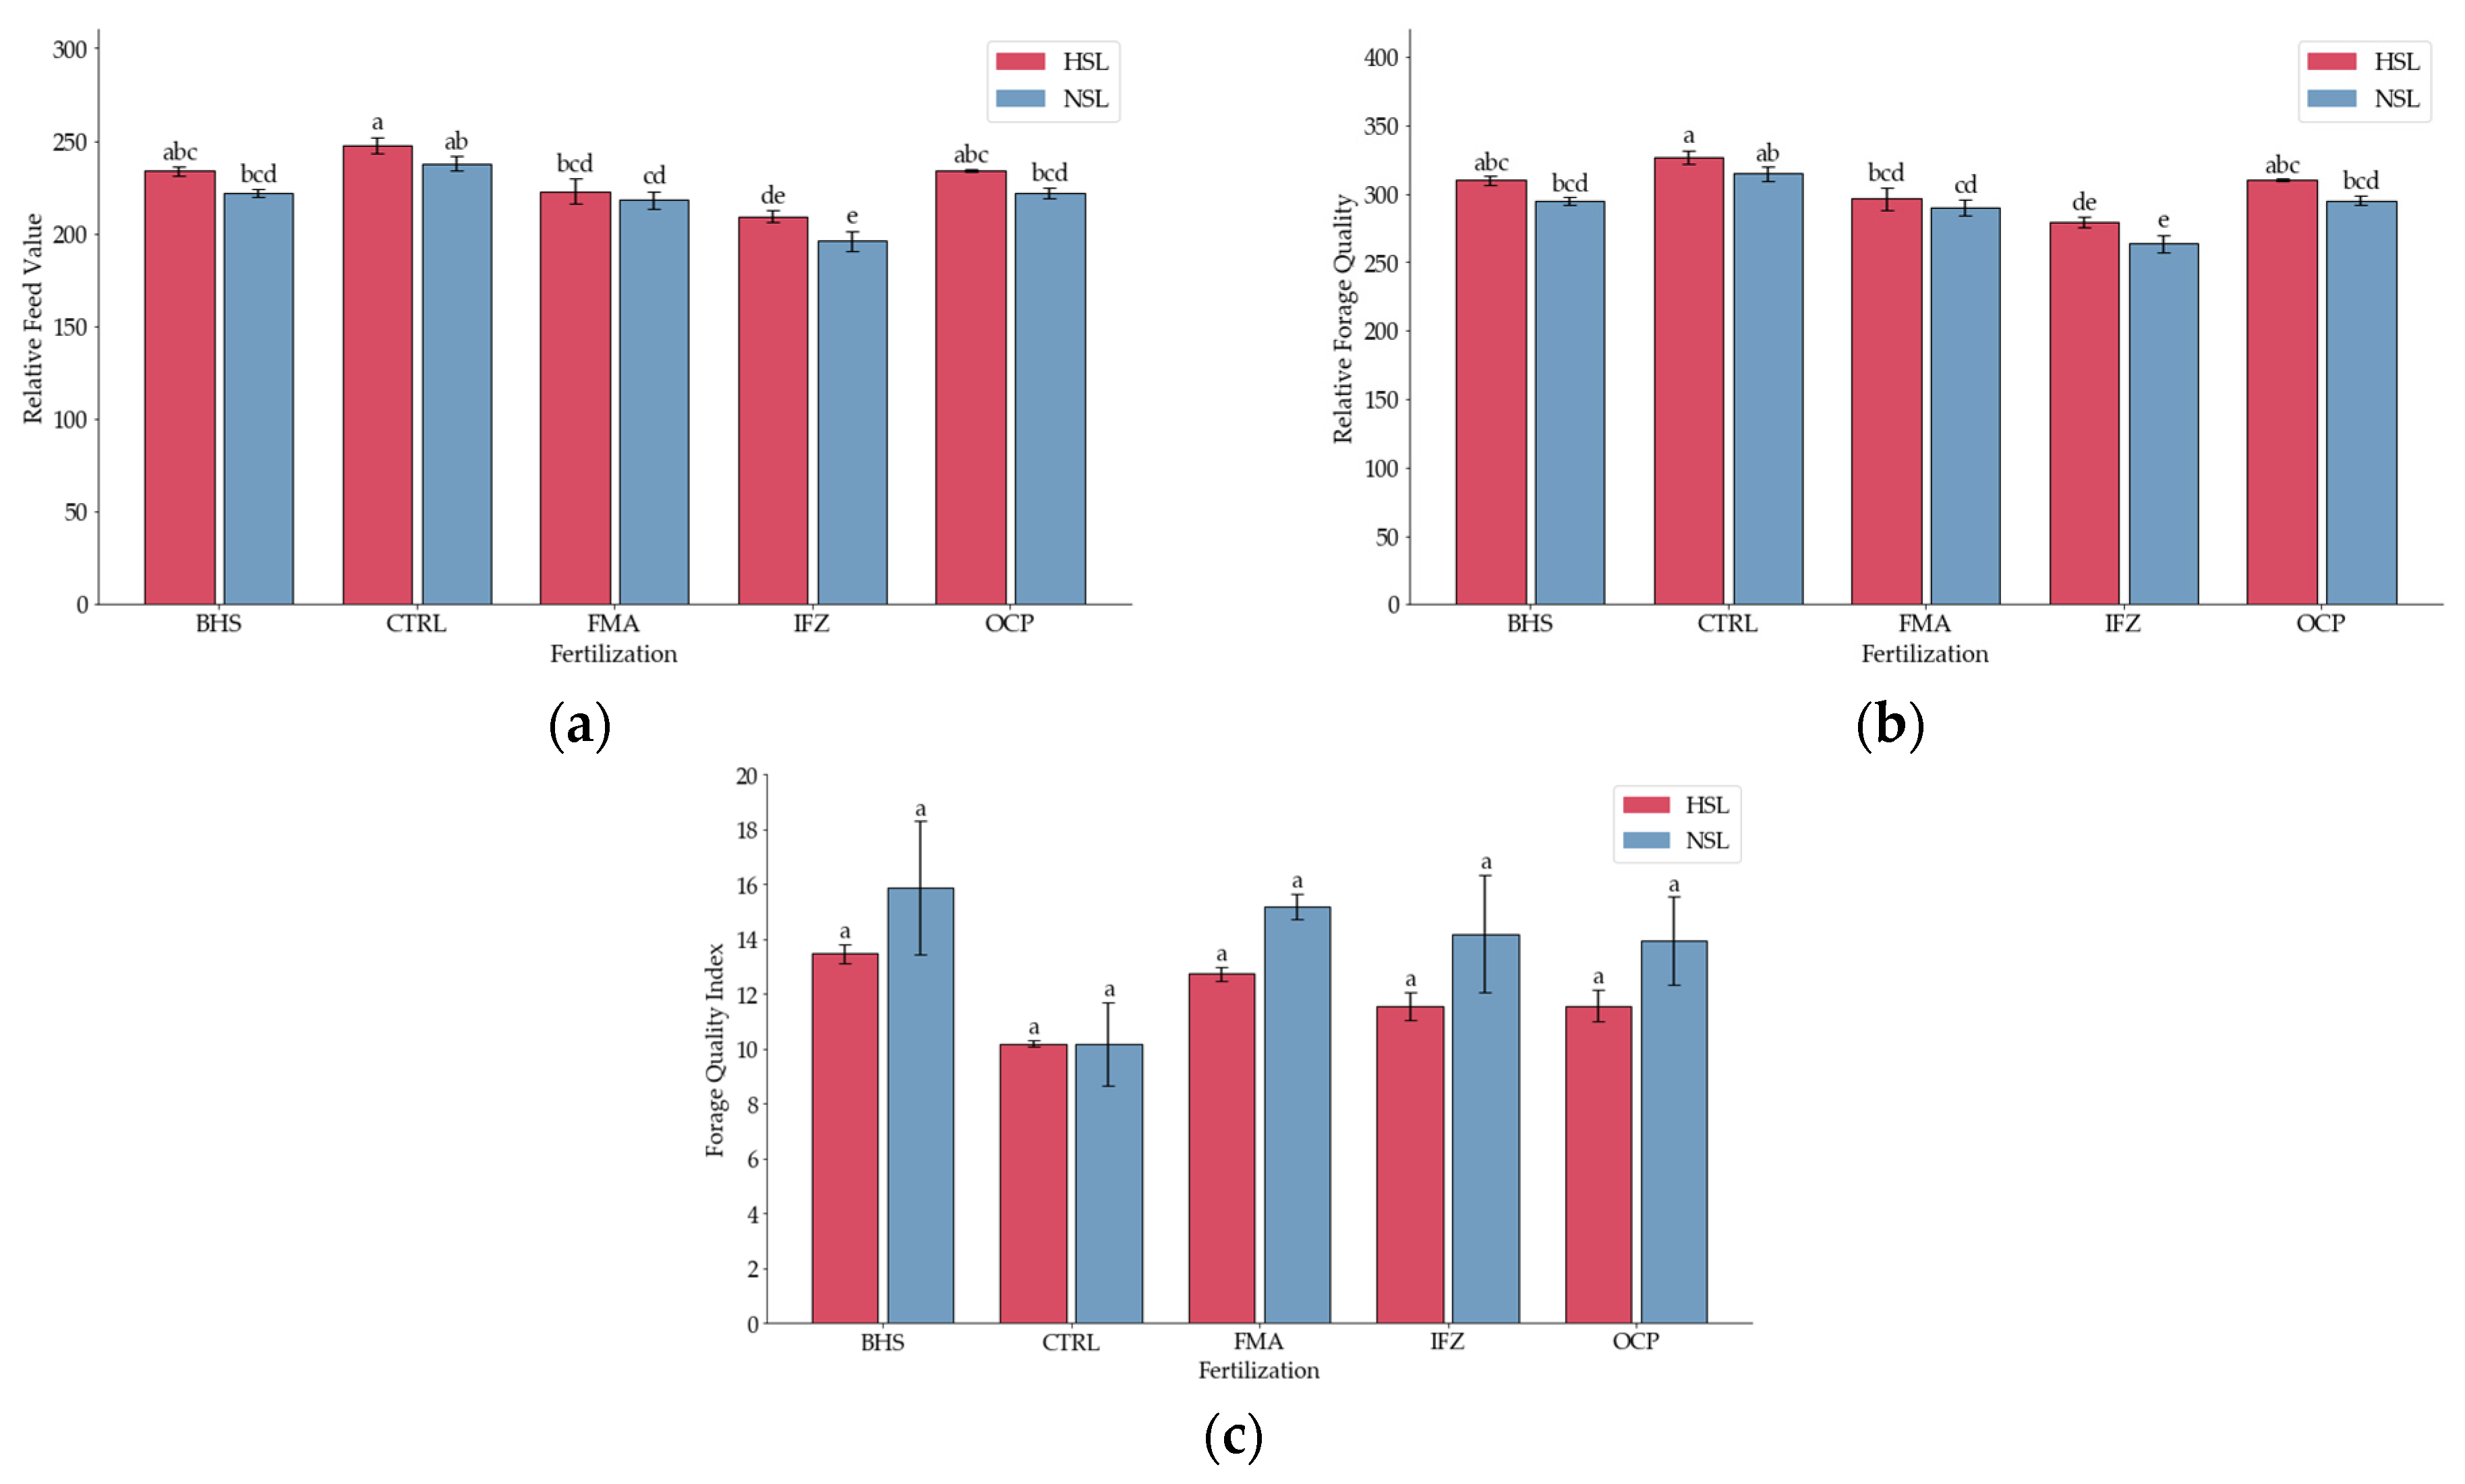
3.4. Forage Quality Indicators

Fertilization had a highly significant effect on RFV (F = 39.69, p < 0.001), demonstrating strong differences among treatments. Salinity also had a significant impact (F = 31.15, p < 0.001), though its effect was smaller compared to fertilization. The CVs were relatively low (2.52% for fertilization and 2.29% for the combined effect of fertilization and salinity), indicating consistent responses across treatments (Table 4). The results demonstrate that fertilization is the main factor affecting RFV, while salinity also has a significant but independent impact. The highest RFV was observed under CTRL at HSL (247.65), followed by CTRL at NSL (237.89). No significant differences were found among OCP at HSL (234.15), BHS at HSL (234.00), FMA at HSL (222.90), OCP at NSL (221.90), and BHS at NSL (221.75). The lowest RFV was recorded under IFZ at NSL (196.17) (Figure 7a).
Fertilization had a highly significant effect on RFQ (F = 39.69, p < 0.001), indicating strong differences among treatments. Salinity also had a significant impact (F = 31.15, p < 0.001), though its effect was less pronounced than that of fertilization. The CVs were relatively low (2.33% for fertilization and 2.11% for the combined effect of fertilization and salinity), indicating stable and consistent responses across treatments. These findings highlight fertilization as the primary factor influencing RFQ, with salinity also playing a significant but independent role. The highest RFQ was observed under CTRL at HSL (326.74), followed by CTRL at NSL (314.76). RFQ values were not significantly different among OCP at HSL (310.16), BHS at HSL (309.97), FMA at HSL (296.35), OCP at NSL (295.12), and BHS at NSL (294.93). The lowest RFQ was found under IFZ at NSL (263.52) (Figure 7b).
Fertilization had a significant effect on the FQI (F = 13.74, p < 0.01), indicating notable differences among treatments. Salinity also had a significant impact (F = 5.16, p < 0.05), though its effect was smaller compared to fertilization. The CVs were higher than in previous traits, particularly for the combined effect of fertilization and salinity (18.37%), indicating more variability in response (Table 4). The results demonstrate that fertilization is the main factor affecting the FQI, while salinity plays a secondary yet significant role. The highest FQI was observed under BHS at NSL (15.86), followed closely by FMA at NSL (15.19%), with no significant difference between them. Slightly lower values were noted under IFZ at NSL (14.20%) and OCP at NSL (13.93%). Salinity reduced the Forage Quality Index across all fertilization types, with the most pronounced decrease seen under CTRL at HSL (10.20%) and CTRL at NSL (10.19%) (Figure 7c).

4. Discussion

Fenugreek can be a valuable ingredient in animal feed, especially for cattle, poultry, and small ruminants, when used in appropriate quantities and with attention to certain parameters [55]. Its protein content is one of the primary quality factors that make fenugreek suitable as animal feed [56,57,58]. Fenugreek seeds are rich in protein, containing approximately 25–40% protein content [59,60], making fenugreek a good source of plant-based protein for animals. In this study, seed crude protein values ranged from 11% to 19%, which falls within the expected range and reflects the influence of both fertilization and salinity conditions. Fertilization can significantly affect the protein content of seeds and plants in fenugreek cultivation due to its impact on various physiological and biochemical processes within the plant [56,57,61]. This is confirmed by our experiment for both seed and plant protein content. In the study [62], the authors demonstrated that organic and inorganic fertilizers provide nitrogen in different forms, and the rate and timing of application can influence the overall nitrogen supply to the plant. This variation may be due to the uptake and utilization of nutrients by fenugreek plants. It may also be attributed to soil nutrient levels. The initial nutrient levels in the soil could have influenced the impact of additional fertilization. When the soil already contained sufficient nutrients, the additional fertilizer might not significantly affect protein composition [63,64]. The results of this study reveal that plant CP was statistically affected by both fertilization type and salinity levels. The highest CP was found under BHS and FMA at NSL. Salinity decreased CP across all treatments, but BHS and FMA were less affected, indicating better tolerance to stress. This improved performance may be attributed to enhanced nitrogen availability, soil microbial activity, and nutrient uptake associated with organic amendments, which help sustain protein synthesis even under saline stress.
The CA in fenugreek seeds and plants was significantly affected by both fertilization type and salinity. However, ash content was consistently lower under intense salinity conditions, indicating that increased salinity does not enhance ash accumulation in fenugreek. This suggests that salinity stress may impair nutrient uptake and translocation, leading to reduced mineral content in both leaves and seeds. Higher CA values were consistently observed under all fertilization treatments at normal salinity, while marked reductions occurred under saline conditions. This indicates that salinity stress limits mineral accumulation in plant tissues. However, organic and inorganic fertilizers appeared to buffer this effect to some extent, maintaining relatively stable CA levels under high salinity compared to the unfertilized control.
Nutrient uptake was restricted due to salinity, leading to increased accumulation of inorganic components in the plant, resulting in higher ash content. High soil salinity can create an osmotic imbalance, making it difficult for fenugreek plants to absorb essential nutrients from the soil. These nutrients include minerals such as calcium, magnesium, potassium, and others that contribute to the ash content [65]. Based on our findings, CA was statistically affected by fertilization type and salinity levels in seeds and plants. NSL treatments maintained higher seed CA, with OCP and IFZ showing the best results. Salinity reduced CA, particularly under CTRL, highlighting the need for nutrient supplementation under saline conditions. This could be due to enhanced nutrient availability and uptake efficiency under reduced salinity conditions, leading to increased mineral accumulation [66]. No significant differences were observed for plant CA except for slight reductions under salinity, particularly in CTRL treatments. This aligns with previous research showing that salinity stress can impair nutrient absorption and translocation, leading to reduced ash content [67].
Dry matter (DMC) is a crucial factor in fodder production and analysis because it directly influences the nutritional quality and density of feeds. Seeds with higher dry matter content generally contain more nutrients (e.g., proteins, carbohydrates, and fats) per unit weight [68]. Our data indicate that seed and plant DMC was statistically affected by fertilization type and salinity levels. Among fertilized treatments, organic inputs—especially BHS—maintained higher seed DMC under salinity, likely due to improved nutrient retention and water balance. Plant DMC showed smaller differences but followed a similar trend, with slight reductions in the unfertilized control under saline conditions. This aligns with previous findings that salinity stress limits water uptake and nutrient availability, reducing dry matter content [69].
Our analysis shows that seed and plant TF were statistically affected by both fertilization type and salinity levels. Fat is an essential component of fodder, providing a concentrated source of energy and supporting the absorption of fat-soluble vitamins [70]. BHS and FMA at NSL consistently increased TF, likely due to enhanced nutrient availability and balanced growth conditions, which promote lipid biosynthesis [71]. In contrast, the lowest TF values were observed under IFZ and CTRL at HSL, suggesting that salinity stress and inadequate fertilization limit fat accumulation by impairing nutrient uptake and metabolic processes. These findings align with previous research showing that optimal fertilization is crucial for maintaining fat content under salinity stress, as nutrient imbalances and osmotic stress reduce lipid synthesis [72].
Our observations suggest that seed and plant CF were statistically affected by both fertilization type and salinity levels. Salinity consistently increased CF content, particularly under OCP and IFZ at HSL, likely due to enhanced lignin and cellulose accumulation as a stress response [73]. Conversely, BHS and FMA at NSL showed the lowest CF, improving digestibility by maintaining lower structural fiber content. These findings are consistent with previous research indicating that salinity stress increases cell wall rigidity, thus elevating CF levels, while balanced nutrient supply under organic fertilization optimizes fiber composition and digestibility [74]. CF was mainly influenced by fertilization, with IFZ showing the highest values at both salinity levels. Salinity had a secondary but significant effect. Organic treatments maintained moderate CF levels, while the lowest value occurred under the unfertilized control in saline conditions, highlighting the importance of fertilization for structural quality.
DDM was highest under CTRL at HSL but lowest under IFZ at NSL. This unexpected result is likely since CTRL produced lower biomass with less structural fiber compared to the organic fertilization treatments, leading to higher DDM through a phenomenon known as the dilution effect, where increased biomass results in higher concentrations of structural fiber (NDF and ADF), thus reducing digestibility [75]. Previous studies have highlighted fenugreek’s potential as a forage crop with digestibility comparable to or even surpassing that of alfalfa. In [26], the authors reported that fenugreek harvested at different growth stages exhibited higher in vitro dry matter digestibility (IVDMD) than early-bloom alfalfa. Similarly, in [76] fenugreek haylage had ruminal degradability and whole-tract digestibility comparable to alfalfa in dairy cows. The observed DDM values can be attributed to fenugreek’s inherent characteristics as a leguminous plant. Legumes generally exhibit higher crude protein and lower fiber concentrations compared to grasses, contributing to increased digestibility [26]. Additionally, fenugreek’s resilience to salinity stress, possibly due to its ability to maintain ionic balance and antioxidant defense mechanisms, may play a role in sustaining its DDM levels across different treatments [77]. The ability of fenugreek to maintain consistent DDM under varying fertilization and salinity conditions suggests its suitability as a reliable forage source in diverse agricultural settings. This resilience can be particularly beneficial in regions facing soil salinization challenges, offering a viable alternative to traditional forages. Moreover, the comparable or superior digestibility of fenugreek to alfalfa indicates potential for its inclusion in livestock diets to enhance nutrient intake and performance [76].
CTRL treatments promoted the highest DMI, while the lowest was under IFZ at NSL, indicating that certain fertilization types may limit intake potential. Apart from the control, organic fertilizations yielded higher values of DMI compared to inorganic ones. The low CV values (1.91% for fertilization and 1.73% for the combined effect) indicated consistent responses across treatments. These findings are consistent with previous research demonstrating that fertilization impacts forage yield and quality, influencing DMI [78]. The higher DMI under CTRL is likely due to salinity stress can alter plant metabolism, affecting forage quality and intake [79]. These results suggest that minimal or no fertilization may enhance DMI due to improved palatability, which is particularly relevant in saline environments. However, this study is limited by its specific environmental conditions, and future research should investigate long-term effects across different fenugreek cultivars and agro-ecological zones.
According to our results, the RFV was statistically affected by fertilization type and salinity levels. The RFV was highest under CTRL and lowest under IFZ at NSL. However, excluding CTRL, organic fertilization yielded better RFVs than IFZ, suggesting that organic amendments improve forage quality by enhancing nutrient availability without excessively increasing structural fiber. This aligns with previous research showing that organic fertilizers enhance forage digestibility and the RFV by promoting balanced growth and reducing lignification compared to inorganic fertilizers [80].
The data obtained in this study show that FPR was statistically affected by fertilization type; however, no significant differences were observed, indicating a consistent balance between fiber and protein across all treatments. This suggests that fertilization strategies, whether organic or inorganic, did not substantially alter the fiber-to-protein ratio in fenugreek forage. Similar findings were reported to [78], in which the authors observed that while fertilization influences biomass yield and crude protein content, it does not necessarily affect the relative balance between fiber and protein. This consistency may be attributed to fenugreek’s inherent nutrient composition and adaptability to varying soil fertility levels.
The protein density helps determine the nutritional value of the fodder, ensuring it meets the dietary protein requirements of livestock for growth, reproduction, and milk production. A high protein density indicates nutrient-rich fodder, optimizing animal health and productivity while reducing the need for supplementary feeds. Based on our findings, protein density was statistically affected by fertilization type and salinity levels. BHS and FMA at NSL showed the highest protein density, while CTRL at HSL had the lowest, demonstrating the importance of fertilization under salinity stress. Our results demonstrate that there were no significant differences in protein density between organic and inorganic fertilization. The lack of significant differences in protein density between organic and inorganic fertilization can be attributed to the similar availability of nitrogen to plants from both sources once mineralization occurs. According to [81], both organic and inorganic fertilizers ultimately supply nitrogen in forms that plants can readily absorb, leading to comparable protein synthesis.
TDN is crucial for evaluating fodder quality because it measures the energy content available to livestock, influencing growth, reproduction, and productivity. TDN reflects the sum of digestible fiber, protein, lipid, and carbohydrate fractions, providing a comprehensive measure of nutritional value. In our study, TDN was affected by fertilization type and salinity levels because of differences in nutrient availability and digestibility. Organic fertilization improved TDN compared to inorganic fertilization (IFZ) due to enhanced soil health, leading to better nutrient cycling. In contrast, inorganic fertilizers supply nutrients rapidly but do not improve soil structure, resulting in lower TDN values. Additionally, salinity stress reduced nutrient uptake and carbohydrate synthesis, lowering digestibility under saline conditions, while non-saline conditions promoted better nutrient utilization and higher TDN. The highest TDN under CTRL likely resulted from optimal nutrient balance and soil conditions. These findings align with studies by Das Patel [82] who noted improved nutrient cycling with organic amendments, and Tokas Punia, who observed reduced digestibility under salinity stress [83].
RFQ is a vital metric for assessing fodder quality as it evaluates the balance of digestible nutrients and intake potential. RFQ was statistically affected by fertilization type and salinity levels. The highest RFQ was under CTRL, while the lowest was under IFZ at NSL, indicating superior forage quality under control conditions. Organic fertilization improved RFQ compared to inorganic fertilization (IFZ).
Our data indicate that the FQI was significantly affected by fertilization type and salinity levels, with the highest values recorded under BHS and FMA at NSL, while the lowest occurred under CTRL at HSL. Organic fertilization consistently resulted in a higher FQI compared to inorganic, likely due to enhanced soil health, nutrient cycling, and balanced nutrient supply associated with organic amendments [84]. These findings align with previous research showing that organic fertilizers improve forage quality by enhancing nutrient availability and microbial activity [85]. Conversely, inorganic fertilizers, while increasing yield, may not optimize nutrient density, impacting the FQI [78]. This improved performance may be partially explained by physiological mechanisms such as ion homeostasis and osmotic adjustment, which are supported by enhanced nutrient uptake and water retention under organic fertilization.
NFCs play a crucial role in livestock nutrition by supplying rapid energy essential for growth, lactation, and overall vitality. Our analysis shows that NFC levels were statistically affected by fertilization type and salinity levels. The highest NFC was under CTRL at HSL, while the lowest was under IFZ at NSL. Additionally, in this study, NFC values were higher under high salinity levels, likely due to osmotic adjustment mechanisms in plants. Under saline conditions, plants tend to accumulate soluble carbohydrates, such as sugars and starches, to maintain cellular osmotic balance and protect metabolic functions [86]. This increase in soluble carbohydrates enhances NFC content, thereby raising the energy value of the fodder. These findings align with [87], which reported an increase in carbohydrate accumulation as a salinity stress response in plants.
The Ca:P ratio is a key indicator of fodder quality as it directly influences bone health and metabolic functions [88]. In this study, Ca:P ratios remained stable across all treatments, showing no significant differences regardless of fertilization type or salinity levels. This consistency suggests that neither fertilization nor salinity impacted the mineral balance in the fodder, ensuring a reliable nutrient profile for maintaining livestock health.
The results of this study have practical relevance for field-scale applications, particularly in arid and semi-arid regions facing salinity challenges. Given that the experiment was conducted under rainfed and moderately saline conditions, the results support the use of organic fertilization—especially BHS—as a viable strategy for improving forage quality in low-input and degraded agricultural systems.

5. Conclusions

In conclusion, fenugreek (Trigonella foenum-graecum L.) demonstrates significant potential as a high-quality forage crop, particularly under varying fertilization and salinity conditions. Our findings reveal that fertilization type and salinity levels significantly impact key nutritional indices, including Crude Protein (CP), Crude Ash (CA), Dry Matter Content (DMC), Total Fat (TF), Crude Fiber (CF), Digestible Dry Matter (DDM), Dry Matter Intake (DMI), Relative Feed Value (RFV), Relative Forage Quality (RFQ), Forage Quality Index (FQI), Non-Fiber Carbohydrate (NFC), and Ca:P ratio. Organic fertilization (BHS and FMA) consistently improved nutritional quality, enhancing CP, TF, and digestibility while maintaining optimal fiber-to-protein ratios, compared to inorganic fertilization (IFZ), which showed the lowest values under salinity stress. Salinity, applied at 200 kg/ha NaCl (EC = 3.52 dS/m), generally decreased CP and CA but increased CF, affecting overall digestibility. However, organic amendments, BHS particularly, demonstrated better resilience to salinity stress, preserving nutritional value and enhancing forage quality. This study represents the first known evaluation of Biocyclic-Vegan Humus Soil as a fertilization strategy under saline conditions, offering insights into its potential role in sustainable forage production. These results underscore the importance of strategic nutrient management, favoring organic fertilization to optimize forage quality and support sustainable livestock feeding systems, particularly in saline-prone environments. Fenugreek’s ability to maintain high DDM, RFVs, and RFQ, coupled with its adaptability to challenging environmental conditions, confirms its suitability as a reliable, nutrient-dense forage option, offering a promising alternative to traditional forages. While this study offers practical insights into fenugreek forage quality under salinity and fertilization treatments, it is limited by its single growing season, single location, and the absence of biochemical or physiological analyses. Future research should incorporate multi-season and multi-site trials, as well as detailed biochemical assessments, to better understand the mechanisms behind salinity tolerance and to validate the broader applicability of organic fertilization strategies.

Author Contributions

Conceptualization, A.F. and I.K.; methodology, A.F. and I.K.; software, A.F. and P.S.; validation, A.F., E.T. and I.K.; formal analysis, A.F., E.T. and A.M.; investigation, A.F.; resources, A.F.; data curation, A.F; writing—original draft preparation, A.F. and A.M.; writing—review and editing, A.F. and D.B.; visualization, A.F.; supervision, A.F. and D.B.; project administration, A.F. and I.K.; All authors have read and agreed to the published version of the manuscript.

Funding

This research received no external funding.

Data Availability Statement

Data are contained within the article.

Conflicts of Interest

The authors declare no conflicts of interest.

References

  1. Ritzema, H. Drain for Gain: Managing salinity in irrigated lands—A review. Agric. Water Manag. 2016, 176, 18–28. [Google Scholar] [CrossRef]
  2. Otlewska, A.; Migliore, M.; Dybka-Stępień, K.; Manfredini, A.; Struszczyk-Świta, K.; Napoli, R.; Białkowska, A.; Canfora, L.; Pinzari, F. When salt meddles between plant, soil, and microorganisms. Front. Plant Sci. 2020, 11, 553087. [Google Scholar] [CrossRef] [PubMed]
  3. Valenzuela, F.J.; Reineke, D.; Leventini, D.; Chen, C.C.L.; Barrett-Lennard, E.G.; Colmer, T.D.; Dodd, I.C.; Shabala, S.; Brown, P.; Bazihizina, N. Plant responses to heterogeneous salinity: Agronomic relevance and research priorities. Ann. Bot. 2022, 129, 499–518. [Google Scholar] [CrossRef]
  4. Kefford, B.J.; Buchwalter, D.; Cañedo-Argüelles, M.; Davis, J.; Duncan, R.P.; Hoffmann, A.; Thompson, R. Salinized rivers: Degraded systems or new habitats for salt-tolerant faunas? Biol. Lett. 2016, 12, 20151072. [Google Scholar] [CrossRef]
  5. Ashraf, M.; Munns, R. Evolution of approaches to increase the salt tolerance of crops. Crit. Rev. Plant Sci. 2022, 41, 128–160. [Google Scholar] [CrossRef]
  6. Tarolli, P.; Luo, J.; Park, E.; Barcaccia, G.; Masin, R. Soil salinization in agriculture: Mitigation and adaptation strategies combining nature-based solutions and bioengineering. iScience 2024, 27, 108830. [Google Scholar] [CrossRef]
  7. Irin, I.J.; Hasanuzzaman, M. Organic amendments: Enhancing plant tolerance to salinity and metal stress for improved agricultural productivity. Stresses 2024, 4, 185–209. [Google Scholar] [CrossRef]
  8. Murtaza, G.; Ahmed, Z.; Iqbal, R.; Deng, G. Biochar from agricultural waste as a strategic resource for promotion of crop growth and nutrient cycling of soil under drought and salinity stress conditions: A comprehensive review with context of climate change. J. Plant Nutr. 2025, 1–52. [Google Scholar] [CrossRef]
  9. Mann, S. Could we stop killing?—Exploring a post-lethal vegan or vegetarian agriculture. World 2020, 1, 10. [Google Scholar] [CrossRef]
  10. Edberg, K. Farming Without Animals? The Outlook for Biocyclic Vegan Agriculture as an Alternative Approach to Food Production in Sweden. Master’s Thesis, LUCSUS (Lund University Centre for Sustainability Studies), Lund, Sweden, 2023. ID 9120376. [Google Scholar]
  11. Eisenbach, L.D.; Folina, A.; Zisi, C.; Roussis, I.; Tabaxi, I.; Papastylianou, P.; Kakabouki, I.; Efthimiadou, A.; Bilalis, D.J. Effect of biocyclic humus soil on yield and quality parameters of sweet potato (Ipomoea batatas L.). Sci. Papers. Ser. A Agron. 2018, LXI, 210–217. [Google Scholar]
  12. Folina, A.; Tsementzi, K.; Stavropoulos, P.; Mavroeidis, A.; Kakabouki, I.; Bilalis, D. Impact of salinity and fertilization on soil properties, and root development in fenugreek (Trigonella foenum-graecum) cultivation. Not. Bot. Horti Agrobot. Cluj-Napoca 2024, 52, 13868. [Google Scholar] [CrossRef]
  13. El-Shayeb, N.; Mabrouk, S. Utilisation of some edible and medicinal plants to inhibit aflatoxin formation. Nutr. Rep. Int. 1984, 29, 273–282. [Google Scholar]
  14. Bhat, B.G.; Sambaiah, K.; Chandrasekhara, N. The effect of feeding fenugreek and ginger on bile composition in the albino rat. Nutr. Rep. Int. 1985, 32, 1145–1151. [Google Scholar]
  15. Gupta, R.C.; Srivastava, A.; Lall, R. Nutraceuticals in Veterinary Medicine; Springer: Berlin/Heidelberg, Germany, 2019; Volume 120. [Google Scholar]
  16. Acharya, S.; Basu, S.; Thomas, J. Medicinal properties of fenugreek (Trigonella foenum-graecum L.): A review of the evidence based information. Adv. Med. Plant Res. 2007, 2007, 81–122. [Google Scholar]
  17. Żuk-Gołaszewska, K.; Wierzbowska, J. Fenugreek: Productivity, nutritional value and uses. J. Elem. 2017, 22, 1067–1080. [Google Scholar] [CrossRef]
  18. Mir, Z.; Mir, P.; Acharya, S.; Zaman, M.; Taylor, W.; Mears, G.; McAllister, T.; Goonewardene, L. Comparison of alfalfa and fenugreek (Trigonella foenum-graecum) silages supplemented with barley grain on performance of growing steers. Can. J. Anim. Sci. 1998, 78, 343–349. [Google Scholar] [CrossRef]
  19. Jat, H.; Taparia, A. Utilization of methi straw by cattle. Indian J. Anim. Sci. 1990, 60, 1380–1381. [Google Scholar]
  20. Attia-Ismail, S.A. Effect of fenugreek seeds (Trigonella foenum-graecum L.) as feed additive on 1 sheep performance in the north western coast of Egypt 2. Anal. Methods 2000, 32, 33. [Google Scholar]
  21. Solorio-Sánchez, F.; Solorio-Sánchez, B.; Basu, S.; Casanova-Lugo, F.; Sarabia-Salgado, L.; Ku-Vera, J.; Aguilar-Pérez, C.; Ramírez-Avilés, L.; Noguera-Savelli, E.; Cetzal-Ix, W. Opportunities to grow annual forage legume fenugreek (Trigonella foenum-graecum L.) under mexican sylvopastoral system. Am. J. Soc. Issues Humanit. 2014, 86–95. [Google Scholar]
  22. Montgomery, J. The potential of Fenugreek (Trigonella foenum-graecum) as a Forage for Dairy Herds in Central Alberta. Master’s Thesis, University of Alberta, Edmonton, AB, Canada, 2009. [Google Scholar]
  23. Alemu, A.; Doepel, L. Fenugreek (Trigonella foenum-graecum L.) as an alternative forage for dairy cows. Animal 2011, 5, 1370–1381. [Google Scholar] [CrossRef]
  24. Kamalak, A.; Atalay, A.I.; Özkan, Ç.Ö.; Kaya, E.; Tatlıyer, A. Determination of potential nutritive value of Trigonella kotschi fenzl hay harvested at three different maturity stages. Kafkas Üniversitesi Vet. Fakültesi Derg. 2011, 17, 635–640. [Google Scholar]
  25. Mir, P.; Mir, Z.; Townley-Smith, L. Comparison of the nutrient content and in situ degradability of fenugreek (Trigonella foenum-graecum) and alfalfa hays. Can. J. Anim. Sci. 1993, 73, 993–996. [Google Scholar] [CrossRef]
  26. Mir, Z.; Acharya, S.; Mir, P.; Taylor, W.; Zaman, M.; Mears, G.; Goonewardene, L. Nutrient composition, in vitro gas production and digestibility of fenugreek (Trigonella foenum-graecum) and alfalfa forages. Can. J. Anim. Sci. 1997, 77, 119–124. [Google Scholar] [CrossRef]
  27. Obour, A.; Obeng, E.; Holman, J. Influence of different seeding dates on fenugreek (Trigonella foenum-graecum L.) forage yield and nutritive value. Kans. Agric. Exp. Stn. Res. Rep. 2015, 1, 12. [Google Scholar] [CrossRef]
  28. Zgher, M.S.; Mahde, A.H. Effect of seed radial, number of irrigation peroids and nitrogen levels on growth and forage yield of Fenugreek (Trigonella foenum-graecum L.). Al-Qadisiyah J. Pure Sci. 2015, 20, 89–100. [Google Scholar]
  29. Muhammed, S.R. Response of Two Fenugreek Trigonella foenum-graecum Varieties to Different Cutting Dates and Nitrogen Fertilizer for Growth and Forage Yield Traits under Rainfed Condition. Tikrit J. Sci. Agric. 2017, 17, 134–142. [Google Scholar]
  30. Basu, S.K.; Acharya, S.N.; Thomas, J.E. A report on powdery mildew infestations caused by Erysiphe polygoni DC in North American grown fenugreek. J. Mycopathol. Res. 2006, 44, 253–256. [Google Scholar]
  31. Mohammad, A.A.; Rezvani, M.P.; Fallahi, J.; Boroumand, R.Z. Effect of chemical and organic fertilizers on quantitative and qualitative characteristics of fenugreek (Trigonella foenum-graecum L.) forage. J. Agroecol. 2011, 3, 491–499. [Google Scholar]
  32. Ghanbari, S.; Telavat, M.M.; Siadat, A. Effect of manure application on forage yield and quality of barley (Hordeum vulgare L.) and fenugreek (Trigonella foenum-graecum L.) in intercropping. Iran. J. Crop Sci. 2015, 17, Pe315–Pe328. [Google Scholar]
  33. Abbasdokht, H.; Chaichi, M.R.; Asadi, S.; Nazari, M.; Manafi Noran, M.; Khademi, H.R. Effects of types of nitrogenous fertilizer (biological, chemical, integrative) and cropping mixes on some forage-medicine characteristics in additive intercropping of sorghum (Sorghum bicolor [L.] Moench) with fenugreek (Trigonella foenum-graecum L.). Arch. Agron. Soil Sci. 2016, 62, 1741–1752. [Google Scholar] [CrossRef]
  34. McCartney, D.; Fraser, J. The potential role of annual forage legumes in Canada: A review. Can. J. Plant Sci. 2010, 90, 403–420. [Google Scholar] [CrossRef]
  35. Dahab, A.A.; Bayomy, H.M.; El-Salam, H.S.A.; Almasoudi, S.E.; Ozaybi, N.A.; Mahmoud, G.A.; Atteya, A.K.; El-Serafy, R.S. Seed disinfection treatments minimized microbial load and enhanced nutritional properties of fenugreek sprouts which alleviated diabetes-negative disorders in diabetic rats. Nutrients 2024, 16, 2635. [Google Scholar] [CrossRef]
  36. Mousallamy, A.; Samir, A. Effect of using dried Fenugreek seeds as natural feed additives on growth performance, feed utilization, whole-body composition and entropathogenic Aeromonas hydrophila-challinge of monsex Nile tilapia O. niloticus (L) fingerlings. Aust. J. Basic Appl. Sci. 2009, 3, 1234–1245. [Google Scholar]
  37. Singh, J.; Gupta, K.; Arora, S. Changes in the anti-nutritional factors of developing seeds and pod walls of fenugreek (Trigonella foenum graecum L.). Plant Foods Hum. Nutr. 1994, 46, 77–84. [Google Scholar] [CrossRef]
  38. Tewari, A.; Brar, J.K.; Singh, R.; Singh, A. Agronomic biofortification of fenugreek (Trigonella foenum-graecum) seeds with chromium: Implication on nutritional, anti-nutritional, mineral and in-vitro protein digestibility. Food Biosci. 2024, 60, 104481. [Google Scholar] [CrossRef]
  39. Dadresan, M.; Luthe, D.S.; Reddivari, L.; Chaichi, M.R.; Yazdani, D. Effect of salinity stress and surfactant treatment on physiological traits and nutrient absorption of fenugreek plant. Commun. Soil Sci. Plant Anal. 2015, 46, 2807–2820. [Google Scholar] [CrossRef]
  40. Punia, H.; Tokas, J.; Malik, A.; Yashveer, S. Reconnoitering bionanomaterials for mitigation of abiotic stress in plants. In Bionanotechnology: Emerging Applications of Bionanomaterials; Elsevier: Amsterdam, The Netherlands, 2022; pp. 101–126. [Google Scholar]
  41. Odhong, C.; Wahome, R.; Vaarst, M.; Kiggundu, M.; Nalubwama, S.; Halberg, N.; Githigia, S. Challenges of conversion to organic dairy production and prospects of future development in integrated smallholder farms in Kenya. Livest. Res. Rural Dev. 2014, 26, 14–21. [Google Scholar]
  42. McBride, W.D.; Greene, C. The profitability of organic soybean production. Renew. Agric. Food Syst. 2009, 24, 276–284. [Google Scholar] [CrossRef]
  43. Wakley, A.; Black, I.A. An examination of the Degtiareff methods for determining soil organic matter and a proposed modification of chromic acid titration method. Soil Sci. 1934, 37, 29–38. [Google Scholar] [CrossRef]
  44. Corwin, D.L.; Yemoto, K. Salinity: Electrical conductivity and total dissolved solids. Soil Sci. Soc. Am. J. 2020, 84, 1442–1461. [Google Scholar] [CrossRef]
  45. FAO. Global Map of Salt Affected Soils Version 1.0; FAO: Rome, Italy, 2021. [Google Scholar]
  46. ISO11261; Soil Quality: Determination of Total Nitrogen: Modified Kjeldahl Method. ISO: Geneva, Switzerland, 1995.
  47. Association of Official Analytical Chemists; Cunniff, P. Official Methods of Analysis of the Association of Official Analytical Chemists; Association of Official Analytical Chemists: Washington, DC, USA, 1990. [Google Scholar]
  48. Association of Official Analytical Chemists. Official methods of analysis of the AOAC International. Assoc. Off. Anal. Chem. Int. 1995, 10, 15563657608988149. [Google Scholar]
  49. ISO11260; Soil Quality: Determination of Cation Exchange Capacity and Base Saturation Method Using Barium Chloride Solution. International Organization for Standardization: Geneva, Switzerland, 1994.
  50. Moore, J.E.; Undersander, D.J. Relative forage quality: An alternative to relative feed value and quality index. In Proceedings of the 13th Annual Florida Ruminant Nutrition Symposium, Gainesville, FL, USA, 10–11 January 2002; pp. 16–29. [Google Scholar]
  51. Hall, M. Calculation of Non-Neutral Detergent Fiber Carbohydrate Content of Feeds that Contain Non-Protein Nitrogen; University of Florida: Gainesville, FL, USA, 2001. [Google Scholar]
  52. McDowell, L.R. Minerals in Animal and Human Nutrition; Elsevier: Amsterdam, The Netherlands, 1992. [Google Scholar]
  53. Schroeder, J.W. Interpreting Forage Analysis; North Dakota State University: Fargo, ND, USA, 1994. [Google Scholar]
  54. Undersander, D.; Mertens, D.; Thiex, N. Forage Analyses; Information Systems Division, National Agricultural Library (United States of America) NAL/USDA: Beltsville, MD, USA, 1993; p. 10301. [Google Scholar]
  55. Olaiya, C.O.; Soetan, K.O. A review of the health benefits of fenugreek (Trigonella foenum-graecum L.): Nutritional, Biochemical and pharmaceutical perspectives. Am. J. Soc. Issues Humanit 2014, 4, 3–12. [Google Scholar]
  56. Tunçtürk, R.; Celen, A.E.; Tunçtürk, M. The effects of nitrogen and sulphur fertilizers on the yield and quality of fenugreek (Trigonella foenum-graecum L.). Turk. J. Field Crops 2011, 16, 69–75. [Google Scholar]
  57. Tuncturk, R. Salinity exposure modifies nutrient concentrations in fenugreek (Trigonella foenum graecum L.). Afr. J. Agric. Res. 2011, 6, 3685–3690. [Google Scholar]
  58. El Nasri, N.A.; El Tinay, A. Functional properties of fenugreek (Trigonella foenum graecum) protein concentrate. Food Chem. 2007, 103, 582–589. [Google Scholar] [CrossRef]
  59. Rao, P.U.; Sharma, R. An evaluation of protein quality of fenugreek seeds (Trigonella foenum graecum) and their supplementary effects. Food Chem. 1987, 24, 1–9. [Google Scholar] [CrossRef]
  60. Kumari, N.; Kumar, P.; Wani, S.A. Effect of extraction parameters on the isolation of fenugreek seed protein and characterization of fenugreek protein concentrate. Qual. Assur. Saf. Crops Foods 2022, 14, 1–12. [Google Scholar] [CrossRef]
  61. Wierzbowska, J.; Zuk-Golaszewska, K. The impact of nitrogen fertilization and Rhizobium inoculation on the yield and quality of Trigonella foenum-graecum L. J. Elem. 2014, 19, 1109–1118. [Google Scholar] [CrossRef]
  62. Meena, S.; Mehta, R.; Bairwa, M.; Meena, R. productivity and profitability of fenugreek (Trigonella foenum-graecum l.) As influenced by bio-fertilizers and plant growth regulators. Legume Res.-Int. J. 2014, 37, 646–650. [Google Scholar] [CrossRef]
  63. Wang, Z.H.; Li, S.X.; Malhi, S. Effects of fertilization and other agronomic measures on nutritional quality of crops. J. Sci. Food Agric. 2008, 88, 7–23. [Google Scholar] [CrossRef]
  64. Folina, A.; Mavroeidis, A.; Stavropoulos, P.; Eisenbach, L.; Kakabouki, I.; Bilalis, D. Comparison of Organic and Inorganic Fertilization in Fenugreek Cultivation Using Nitrogen Indicators. Nitrogen 2024, 5, 712–731. [Google Scholar] [CrossRef]
  65. Okon, O.G. Effect of salinity on physiological processes in plants. In Microorganisms in Saline Environments: Strategies and Functions; Springer: Cham, Switzerland, 2019; pp. 237–262. [Google Scholar]
  66. Nawaz, F.; Shehzad, M.A.; Majeed, S.; Ahmad, K.S.; Aqib, M.; Usmani, M.M.; Shabbir, R.N. Role of mineral nutrition in improving drought and salinity tolerance in field crops. In Agronomic Crops: Volume 3: Stress Responses and Tolerance; Springer: Singapore, 2020; pp. 129–147. [Google Scholar]
  67. Weisany, W.; Sohrabi, Y.; Heidari, G.; Siosemardeh, A.; Badakhshan, H. Effects of zinc application on growth, absorption and distribution of mineral nutrients under salinity stress in soybean (Glycine max L.). J. Plant Nutr. 2014, 37, 2255–2269. [Google Scholar] [CrossRef]
  68. Bilalis, D.; Tabaxi, I.; Zervas, G.; Tsiplakou, E.; Travlos, I.S.; Kakabouki, I.; Tsioros, S. Chia (Salvia hispanica) fodder yield and quality as affected by sowing rates and organic fertilization. Commun. Soil Sci. Plant Anal. 2016, 47, 1764–1770. [Google Scholar] [CrossRef]
  69. Ehtaiwesh, A.F. The effect of salinity on nutrient availability and uptake in crop plants. Sci. J. Appl. Sci. Sabratha Univ. 2022, 9, 55–73. [Google Scholar]
  70. National Research Council; Committee on Animal Nutrition Subcommittee on Dairy Cattle Nutrition. Nutrient Requirements of Dairy Cattle: 2001; National Academies Press: Cambridge, MA, USA, 2001. [Google Scholar]
  71. Fields, M.W.; Hise, A.; Lohman, E.J.; Bell, T.; Gardner, R.D.; Corredor, L.; Moll, K.; Peyton, B.M.; Characklis, G.W.; Gerlach, R. Sources and resources: Importance of nutrients, resource allocation, and ecology in microalgal cultivation for lipid accumulation. Appl. Microbiol. Biotechnol. 2014, 98, 4805–4816. [Google Scholar] [CrossRef]
  72. Javed, S.; Bukhari, S.A.; Ashraf, M.Y.; Mahmood, S.; Iftikhar, T. Effect of salinity on growth, biochemical parameters and fatty acid composition in safflower (Carthamus tinctorius L.). Pak. J. Bot. 2014, 46, 1153–1158. [Google Scholar]
  73. Han, X.; Zhao, Y.; Chen, Y.; Xu, J.; Jiang, C.; Wang, X.; Zhuo, R.; Lu, M.-Z.; Zhang, J. Lignin biosynthesis and accumulation in response to abiotic stresses in woody plants. For. Res. 2022, 2, 9. [Google Scholar] [CrossRef]
  74. Khan, A.; Hussain, M.A.; Nawaz, H.; Muhammad, G.; Lang, I.; Ashraf, U. Physiological Interventions of Antioxidants in Crop Plants Under Multiple Abiotic Stresses. In Sustainable Agriculture in the Era of the OMICs Revolution; Springer: Berlin/Heidelberg, Germany, 2023; pp. 431–471. [Google Scholar]
  75. Lambers, H.; Chapin, F.S.; Pons, T.L. Plant Physiological Ecology; Springer: Berlin/Heidelberg, Germany, 2008; Volume 2. [Google Scholar]
  76. Doepel, L.; Montgomery, J.; Beauchemin, K.; King, J.; Acharya, S. Ruminal degradability and whole-tract digestibility of protein and fibre fractions in fenugreek haylage. Can. J. Anim. Sci. 2012, 92, 211–217. [Google Scholar] [CrossRef]
  77. Mohamadi, E.M.; Ebrahimi, A.; Amerian, M.R.; Alipour, H. Melatonin confers fenugreek tolerance to salinity stress by stimulating the biosynthesis processes of enzymatic, non-enzymatic antioxidants, and diosgenin content. Front. Plant Sci. 2022, 13, 890613. [Google Scholar] [CrossRef]
  78. Cherney, J.H.; Cherney, D.J. Impact of fertilization on forage production and animal performance. In Proceedings of the Colloque sur les Plantes Fourrageres, Drummondville, QC, Canada, 9 December 2015; pp. 1–7. [Google Scholar]
  79. Norman, H.C.; Masters, D.G.; Barrett-Lennard, E.G. Halophytes as forages in saline landscapes: Interactions between plant genotype and environment change their feeding value to ruminants. Environ. Exp. Bot. 2013, 92, 96–109. [Google Scholar] [CrossRef]
  80. Onte, S.; Singh, M.; Meena, V.; Kumar, S.; Meena, B.; Dutta, S. Organic Nutrient Management in Context to Sustainable Fodder Production: A Review. Int. J. Curr. Microbiol. App. Sci 2019, 8, 2434–2449. [Google Scholar] [CrossRef]
  81. Näsholm, T.; Kielland, K.; Ganeteg, U. Uptake of organic nitrogen by plants. New Phytol. 2009, 182, 31–48. [Google Scholar] [CrossRef]
  82. Dayal, G.; Patel, M.; Singh, H. 13. Plant nutrient. Basic introduction of soil science. 157.
  83. Tokas, J.; Punia, H.; Malik, A.; Sangwan, S.; Devi, S.; Malik, S. Growth performance, nutritional status, forage yield and photosynthetic use efficiency of sorghum [Sorghum bicolor (L.) Moench] under salt stress. Range Manag. Agrofor. 2021, 42, 59–70. [Google Scholar]
  84. Mäder, P.; Fliessbach, A.; Dubois, D.; Gunst, L.; Fried, P.; Niggli, U. Soil fertility and biodiversity in organic farming. Science 2002, 296, 1694–1697. [Google Scholar] [CrossRef]
  85. Edmeades, D.C. The long-term effects of manures and fertilisers on soil productivity and quality: A review. Nutr. Cycl. Agroecosystems 2003, 66, 165–180. [Google Scholar] [CrossRef]
  86. Singh, M.; Kumar, J.; Singh, S.; Singh, V.P.; Prasad, S.M. Roles of osmoprotectants in improving salinity and drought tolerance in plants: A review. Rev. Environ. Sci. Bio/Technol. 2015, 14, 407–426. [Google Scholar] [CrossRef]
  87. Pattanagul, W.; Thitisaksakul, M. Effect of salinity stress on growth and carbohydrate metabolism in three rice (Oryza sativa L.) cultivars differing in salinity tolerance. Indian J. Exp. Biol. 2008, 46, 736–742. [Google Scholar]
  88. Schlegel, P.; Gutzwiller, A. Dietary calcium to digestible phosphorus ratio for optimal growth performance and bone mineralization in growing and finishing pigs. Animals 2020, 10, 178. [Google Scholar] [CrossRef]
Figure 1. Experimental design. The experimental design included blocks (Rep) divided into five main plots, each representing different fertilization treatments: Biocyclic-Vegan Humus Soil (BHS), Farmyard Manure (FMA), Organic Compost (OCP), Inorganic Fertilizer (IFZ), and a Control with No Treatment (CTRL). Within each main plot, there were two subplots designated for different salinity levels: High Salinity Level (HSL) and Normal Salinity Level (NSL).
Crops 05 00024 g001
Figure 2. Monthly mean temperature (°C; red line) and mean precipitation (mm; blue bars) recorded at the experimental site during the 2020–2021 growing period.
Crops 05 00024 g002
Figure 3. Box plots of seeds’ (a) Crude Protein (CP), (b) Crude Ash (CA), (c) Dry Matter Content (DMC), (d) Total Fat (FT), and (e) Crude Fiber (CF) as affected by fertilization type, Biocyclic-Vegan Humus Soil (BHS), Farmyard Manure (FMA), Organic Compost (OCP), Inorganic Fertilizer (IFZ), and No Treatment Control (CTRL), and salinity levels, High Salinity Level (HSL) and Normal Salinity Level (NSL). Values that share the same letter are not significantly different, as determined by Tukey’s post hoc tests.
Crops 05 00024 g003aCrops 05 00024 g003b
Figure 4. Box plots of plant (a) Crude Protein (CP), (b) Crude Ash (CA), (c) Dry Matter Content (DMC), (d) Total Fat (FT), and (e) Crude Fiber (CF) as affected by fertilization type, Biocyclic-Vegan Humus Soil (BHS), Farmyard Manure (FMA), Organic Compost (OCP), Inorganic Fertilizer (IFZ), and No Treatment Control (CTRL), and salinity levels, High Salinity Level (HSL) and Normal Salinity Level (NSL). Values that share the same letter are not significantly different, as determined by Tukey’s post hoc tests.
Crops 05 00024 g004aCrops 05 00024 g004b
Figure 5. Mean values of (a) Total Digestible Nutrients (TDN), (b) Non-Fiber Carbohydrate (NFC), and Calcium-to-Phosphorus Ratio (Ca:P) as affected by fertilization type, Biocyclic-Vegan Humus Soil (BHS), Farmyard Manure (FMA), Organic Compost (OCP), Inorganic Fertilizer (IFZ), and No Treatment Control (CTRL), and salinity levels, High Salinity Level (HSL) and Normal Salinity Level (NSL). Values that share the same letter are not significantly different, as determined by Tukey’s post hoc tests.
Crops 05 00024 g005
Figure 6. Mean values of (a) Digestible Dry Matter (DDM), (b) Dry Matter Intake (DMI), (c) Fiber-to-Protein Ratio (FPR), and (d) Protein Density as affected by fertilization type, Biocyclic-Vegan Humus Soil (BHS), Farmyard Manure (FMA), Organic Compost (OCP), Inorganic Fertilizer (IFZ), and No Treatment Control (CTRL), and salinity levels, High Salinity Level (HSL) and Normal Salinity Level (NSL). Values that share the same letter are not significantly different, as determined by Tukey’s post hoc tests.
Crops 05 00024 g006
Figure 7. Mean values of (a) Relative Feed Value (RFV), (b) Relative Forage Quality (RFQ), and (c) Forage Quality Index (FQI) as affected by fertilization type, Biocyclic-Vegan Humus Soil (BHS), Farmyard Manure (FMA), Organic Compost (OCP), Inorganic Fertilizer (IFZ), and No Treatment Control (CTRL), and salinity levels, High Salinity Level (HSL) and Normal Salinity Level (NSL). Values that share the same letter are not significantly different, as determined by Tukey’s post hoc tests.
Crops 05 00024 g007
Table 1. Methods and equations for assessing the proximate composition.
ParameterUnitAnalysis Method/EquationReference
Nitrogen (N)(%)ISO, 1995 (11,261)[46]
Crude Protein (CP)(%)Multiplying N concentration by 6.25[47,48]
Crude Ash (CA)(%)924.05[47,48]
Dry Matter Content (DMC)(%)943.01[47,48]
Total Fat (TF)(%)920.39[47,48]
Crude Fiber (CF)(%)978.10[47,48]
ADF 978.10[47,48]
NDF 978.10[47,48]
Calcium (Ca)(g/100)ISO, 1994 (11,260)[49]
Phosphorus (P)(%)ISO, 1994 (11,263)[49]
Table 2. Analysis of Variance (ANOVA) and Coefficient of Variation (CV) for the effects of fertilization type and salinity levels on seeds’ Crude Protein (CP), Crude Ash (CA), Dry Matter Content (DMC), Total Fat (FT), and Crude Fiber (CF).
SourceDFSeed CP (%)Seed CA (%)Seed DMC (%)Seed TF (%)Seed CF (%)
ANOVA
Repitatio (A)2
Fertiliza (B)4107.07 ***16.86 ***16.76 ***11.8 **10.46 **
Error A*B8
Salinity (C)15.89 *59,495.62 ***10.2 ***34.3 ***136.39 ***
B*C4nsnsnsns3.8 *
Error A*B*C10
Total29
CV
Grand Mean32,0634.318391,2574.714710,426
CV (Repit*Fertil)3.540.170.164.194.53
CV (Repit*Fertil*Sal)6.240.220.29.065.87
F-test ratios are from ANOVA. Significance levels: * p < 0.05; ** p < 0.01; *** p < 0.001; ns, not significant (p > 0.05).
Table 3. Analysis of Variance (ANOVA) and Coefficient of Variation (CV) for the effects of fertilization type and salinity levels on plant Crude Protein (CP), Crude Ash (CA), Dry Matter Content (DMC), Total Fat (FT), and Crude Fiber (CF).
SourceDFPlant CP (%)Plant CA (%)Plant DMC (%)Plant TF (%)Plant CF (%)
ANOVA
Repitatio (A)2
Fertiliza (B)415.06 ***16.86 ***16.86 ***14.11 **50.24 ***
Error A*B8
Salinity (C)15.83 *14,206.33 ***10.2 **80.72 ***31.31 ***
B*C4nsnsns5.57 *ns
Error A*B*C10
Total29
CV
Grand Mean14.559.276790,0871.763317,016
CV(Repit*Fertil)8.590.170.163.282.07
CV(Repit*Fertil*Sal)18.190.210.23.942.09
F-test ratios are from ANOVA. Significance levels: * p < 0.05; ** p < 0.01; *** p < 0.001; ns, not significant (p > 0.05).
Table 4. Analysis of Variance (ANOVA) and Coefficient of Variation (CV) for the effects of fertilization type and salinity levels on Digestible Dry Matter (DDM), Dry Matter Intake (DMI), Relative Feed Value (RFV), Fiber-to-Protein Ratio (FPR), Protein Density, Total Digestible Nutrients (TDN), Relative Forage Quality (RFQ), Forage Quality Index (FQI), Non-Fiber Carbohydrate (NFC), and Calcium-to-Phosphorus Ratio (Ca:P).
SourceDFDDMDMIRFVFPRProtein DensityTDNRGQFQINFCCa:P
ANOVA
Repitatio (A)2
Fertiliza (B)450.24 ***39.69 ***39.69 ***17.12 ***14.95 ***50.24 ***39.69 ***13.74 **57.89 ***ns
Error A*B8
Salinity (C)131.31 ***31.15 ***31.15 ***ns5.71 *31.31 ***31.15 ***5.16 *36.12 ***ns
B*C4nsnsnsnsnsnsnsnsnsns
Error A*B*C10
Total29
CV
Grand Mean 69,9644.1335224.371.20660.161488.67298.1612,89230,0493.949
CV(Repit*Fertil) 0.561.912.526.828.510.382.338.734.177.26
CV(Repit*Fertil*Salin) 0.561.732.2915.318.070.392.1118.377.498.38
F-test ratios are from ANOVA. Significance levels: * p < 0.05; ** p < 0.01; *** p < 0.001; ns, not significant (p > 0.05).
Disclaimer/Publisher’s Note: The statements, opinions and data contained in all publications are solely those of the individual author(s) and contributor(s) and not of MDPI and/or the editor(s). MDPI and/or the editor(s) disclaim responsibility for any injury to people or property resulting from any ideas, methods, instructions or products referred to in the content.

