Article

Association and Interrelationship Among Agronomic Traits and Fungal Diseases of Sorghum, Anthracnose and Grain Mold

1
Southern Plains Agricultural Research Center, USDA-ARS, College Station, TX 77845, USA
2
Sustainable Perennial Crops Laboratory, Beltsville Agricultural Research Center, USDA-ARS, Beltsville, MD 20705, USA
3
Tropical Agriculture Research Station, USDA-ARS, 2200 Pedro Albizu Campos Avenue, Mayaguez 00680, Puerto Rico
4
Department of Plant Pathology & Microbiology, Texas A&M University, College Station, TX 77843, USA
*
Author to whom correspondence should be addressed.
Crops 2024, 4(4), 651-666; https://doi.org/10.3390/crops4040045
Submission received: 16 October 2024 / Revised: 22 November 2024 / Accepted: 29 November 2024 / Published: 5 December 2024

Abstract

Anthracnose and grain mold are two of the most significant diseases of sorghum, a versatile crop that plays an important part in the daily lives of millions of inhabitants, especially in the drier tropical regions. The aim of this study was to determine the influence of four agronomic traits in selected sorghum germplasms on the two diseases using Spearman’s ρ test to identify significant pairwise correlations. Both anthracnose and grain mold scores were significantly and negatively correlated with seed weight and germination rate. The grain mold infection score also demonstrated negative correlations with plant height (Spearman ρ = −0.61 and p-value = <0.0001) and panicle length (Spearman ρ = −0.27 and p-value = 0.0022). In this investigation, principal component analysis and clustering variables analysis revealed that seed weight and germination rate exhibited a directional alignment, suggesting a positive association. Similarly, panicle length and plant height clustered together, suggesting a shared variation pattern. Additionally, a support vector machine and random forest models effectively predicted the germination rate based on the studied traits, highlighting the potential of machine learning in understanding complex trait relationships in sorghum. This work provides insights into the relationship between agronomic traits and disease resistance, thus contributing to sorghum improvement efforts.

1. Introduction

Sorghum [Sorghum bicolor (L.) Moench] stands fifth behind maize, rice, wheat, and barley in terms of cereal acreage and production, and its uses vary from human consumption, animal feed, and biofuel to the health food industry [1,2,3,4]. In the drier tropical regions, this versatile crop supplies the daily caloric needs of hundreds of millions of inhabitants [5,6,7,8,9]. However, production of the crop is hindered by numerous biotic stresses such as anthracnose and grain mold, resulting in economic losses of hundreds of millions of dollars annually. Anthracnose and grain mold are the two most destructive sorghum diseases worldwide, and due to their negative impact on sorghum production and productivity, about 60% of published research papers in the past 20 years were devoted to pathogens causing these two maladies [10,11,12,13]. In fact, prevalence of anthracnose in production fields can reach up to 84% [14,15]. Colletotrichum sublineola P. Henn in Kabàt and Bubk (formerly C. graminicola) [16], the causal agent of sorghum anthracnose and the pathogen, infects all aerial plant parts such as panicle, stalk, and grain, as reported by Thakur and Mathur [17] and Acharya et al. [18]. Severely infected plants in the field may result in yield losses of up to 86% and stalk infections leading to stalk rot may lead to lodging and lower harvestable biomass [19,20]. Infection on the panicle can result in grain losses of up to 50% [17]. Although yield losses can be reduced through crop rotation and fungicide application, utilizing resistant cultivars is the most effective strategy for controlling anthracnose, as it reduces production costs and is environmentally friendly, as explained by Abreha et al. [2], Thakur and Mathur [17], Acharya et al. [18], Prom et al. [21], and Koima et al. [22]. Sources of anthracnose resistance, including gz93, A23, L402B, and 71708, have been documented by several researchers [23,24,25,26]. In addition, anthracnose resistance in some of these lines, such as BTx378 and SC748-5, has been reported to be controlled by a single dominant gene [27,28]. Sorghum grain mold is a disease complex associated with many fungal genera such as Fusarium thapsinum, Fusarium semitectum, Curvularia lunata, Alternaria alternata, C. sublineola, Phoma sorghina, Drechslera, Cladosporium, and Olpitrichum as reported by Bandyopadhyay and Chandrashekar [29], Little et al. [30], Singh and Bandyopadhyay [31], Navi et al. [32], and Das et al. [33]. Although the frequency of isolation of the different grain mold fungi varies from year to year and location to location due to several factors such as the cultivar and environment, the most important species are F. thapsinum, C. lunata, A. alternata, F. nygamai, Phoma sorghina, and C. sublineola [29,30,31,34]. The disease complex is considered the most limiting factor in sorghum production fields, especially later in the growing season when mature grains are exposed to frequent rainfall [29,32,35]. Under such conditions and when susceptible lines are planted, grain yield losses can reach 100%, according to Ibrahim et al. [36]. In addition to lower grain yield and quality, several of the fungi associated with grain mold have the capability to produce mycotoxins, which further limits the grain for use as food and feed [30,32,37,38]. Grain mold-resistant cultivars, lines, and landraces have been identified in different sorghum production regions [11,39,40,41,42]. Audilakshmi et al. [39] reported polygenic grain mold resistance in white-seeded sorghum line IS25017. The current use of tools such as genome-wide association studies to locate SNPs associated with anthracnose and grain mold resistance, coupled with knowledge of the interrelationships among agronomic traits and diseases, could aid in selecting and developing stable resistant sources [43,44,45,46]. However, the interaction between sorghum genotype and the environment will continue to pose challenges in the development of stable resistance [41,47]. Recently, the effect of plant architectural traits, including seed composition, panicle, plant height, and pericarp color in various plant populations, has been explored by Morris et al. [48], Rhodes et al. [49], Zhou et al. [50], and Girma et al. [51]. Studies on estimating correlations among agronomic traits, plant diseases, and pests continue to pose challenges due to the influence of the environment, as reported by Mariscal-Amaro et al. [52], Ribeiro and Maziero [53], Laidig et al. [54], Dendi et al. [55], and Li et al. [56]. The aim of this study was to report the association and interrelationship among four ago-morphological traits and two of the most destructive sorghum diseases, anthracnose and grain mold.

2. Materials and Methods

2.1. Study Site

In 2019 and 2020, experiments were conducted at the USDA–ARS Tropical Agriculture Experiment Station in Isabela, Puerto Rico. Isabela lies at 67.3 W longitude, 18.3 N latitude, and 128 m above sea level. The climate is tropical, and the research station has an oxisol series coto soil type [57]. Table 1 shows the average air temperature and total rainfall for the 2019–2020 period.
For the field trial, a total of 91 accessions and cultivars mainly from the Ethiopian sorghum germplasm collection maintained by the USDA–ARS, Plant Genetic Resources Conservation Unit, Griffin, Georgia (Table S1), and the US were evaluated for resistance to anthracnose and grain mold during the 2019 and 2020 seasons in Isabela, Puerto Rico. Seeds were planted in 1.8 m rows with 0.9 m row spacing in a randomized complete block design, and each line was replicated three times. The count per row was 25–30 plants. For fire ant control, Lorsban 15G (Chlorpyrifos) granulated insecticide (Dow AgroSciences, Indianapolis, IN, USA) was applied at 8 kg/ha prior to planting. At planting, fertilizer (15-5-10 NPK) was applied at 560 kg/ha and at 30 post-planting. Weeds were controlled with mechanical tillage and occasional hand hoeing.

2.2. Anthracnose Field Study

Prom et al. previously described the protocols for anthracnose field inoculation and disease assessment [58]. A mixture of two virulent C. sublineola isolates that may represent the pathotypes that exist in the field was inoculated on autoclaved sorghum grains and mixed periodically to allow the grains to be completely colonized by the fungus. The colonized grains were placed in the plant whorls 30 days after planting. Disease assessment was based on a 1–5 scale: 1 = no symptoms or chlorotic flecks on leaves; 2 = hypersensitive reaction (reddening) with no acervuli; 3 = infected bottom leaves with acervuli; 4 = necrotic lesions with acervuli on bottom leaves and spreading to middle and upper leaves but not the flag leaves; and 5 = most leaves are dead due to infection, including infection on the flag leaf. The symptom types were then categorized into two reaction classes: resistant = rated as 1 or 2; and susceptible = rated as 3, 4, or 5.

2.3. Grain Mold Field Study

Plants were exposed to natural field infection. A grain mold severity scale of 1–5, where 1 = no mold observed on the seeds. 2 = 1 to 9%, 3 = 10 to 24%, 4 = 25 to 49%, and 5 = 50% or more of the seeds molded, was used as previously described by Prom et al. [59].

2.4. Agronomic Traits

At maturity, plant height was measured (centimeters) from the soil to the top of the plant and panicle length was measured (centimeters) from the first branch with racemes to the top of the panicle. Seed weight was based on the weight in grams of 100 randomly selected seeds from each panicle, and percent germination rates were based on the number of seeds that germinated in 7 days out of 100 seeds placed on Anchor seed germination paper (Anchor Paper CO., St. Paul, MN, USA).

2.5. Statistical Analysis

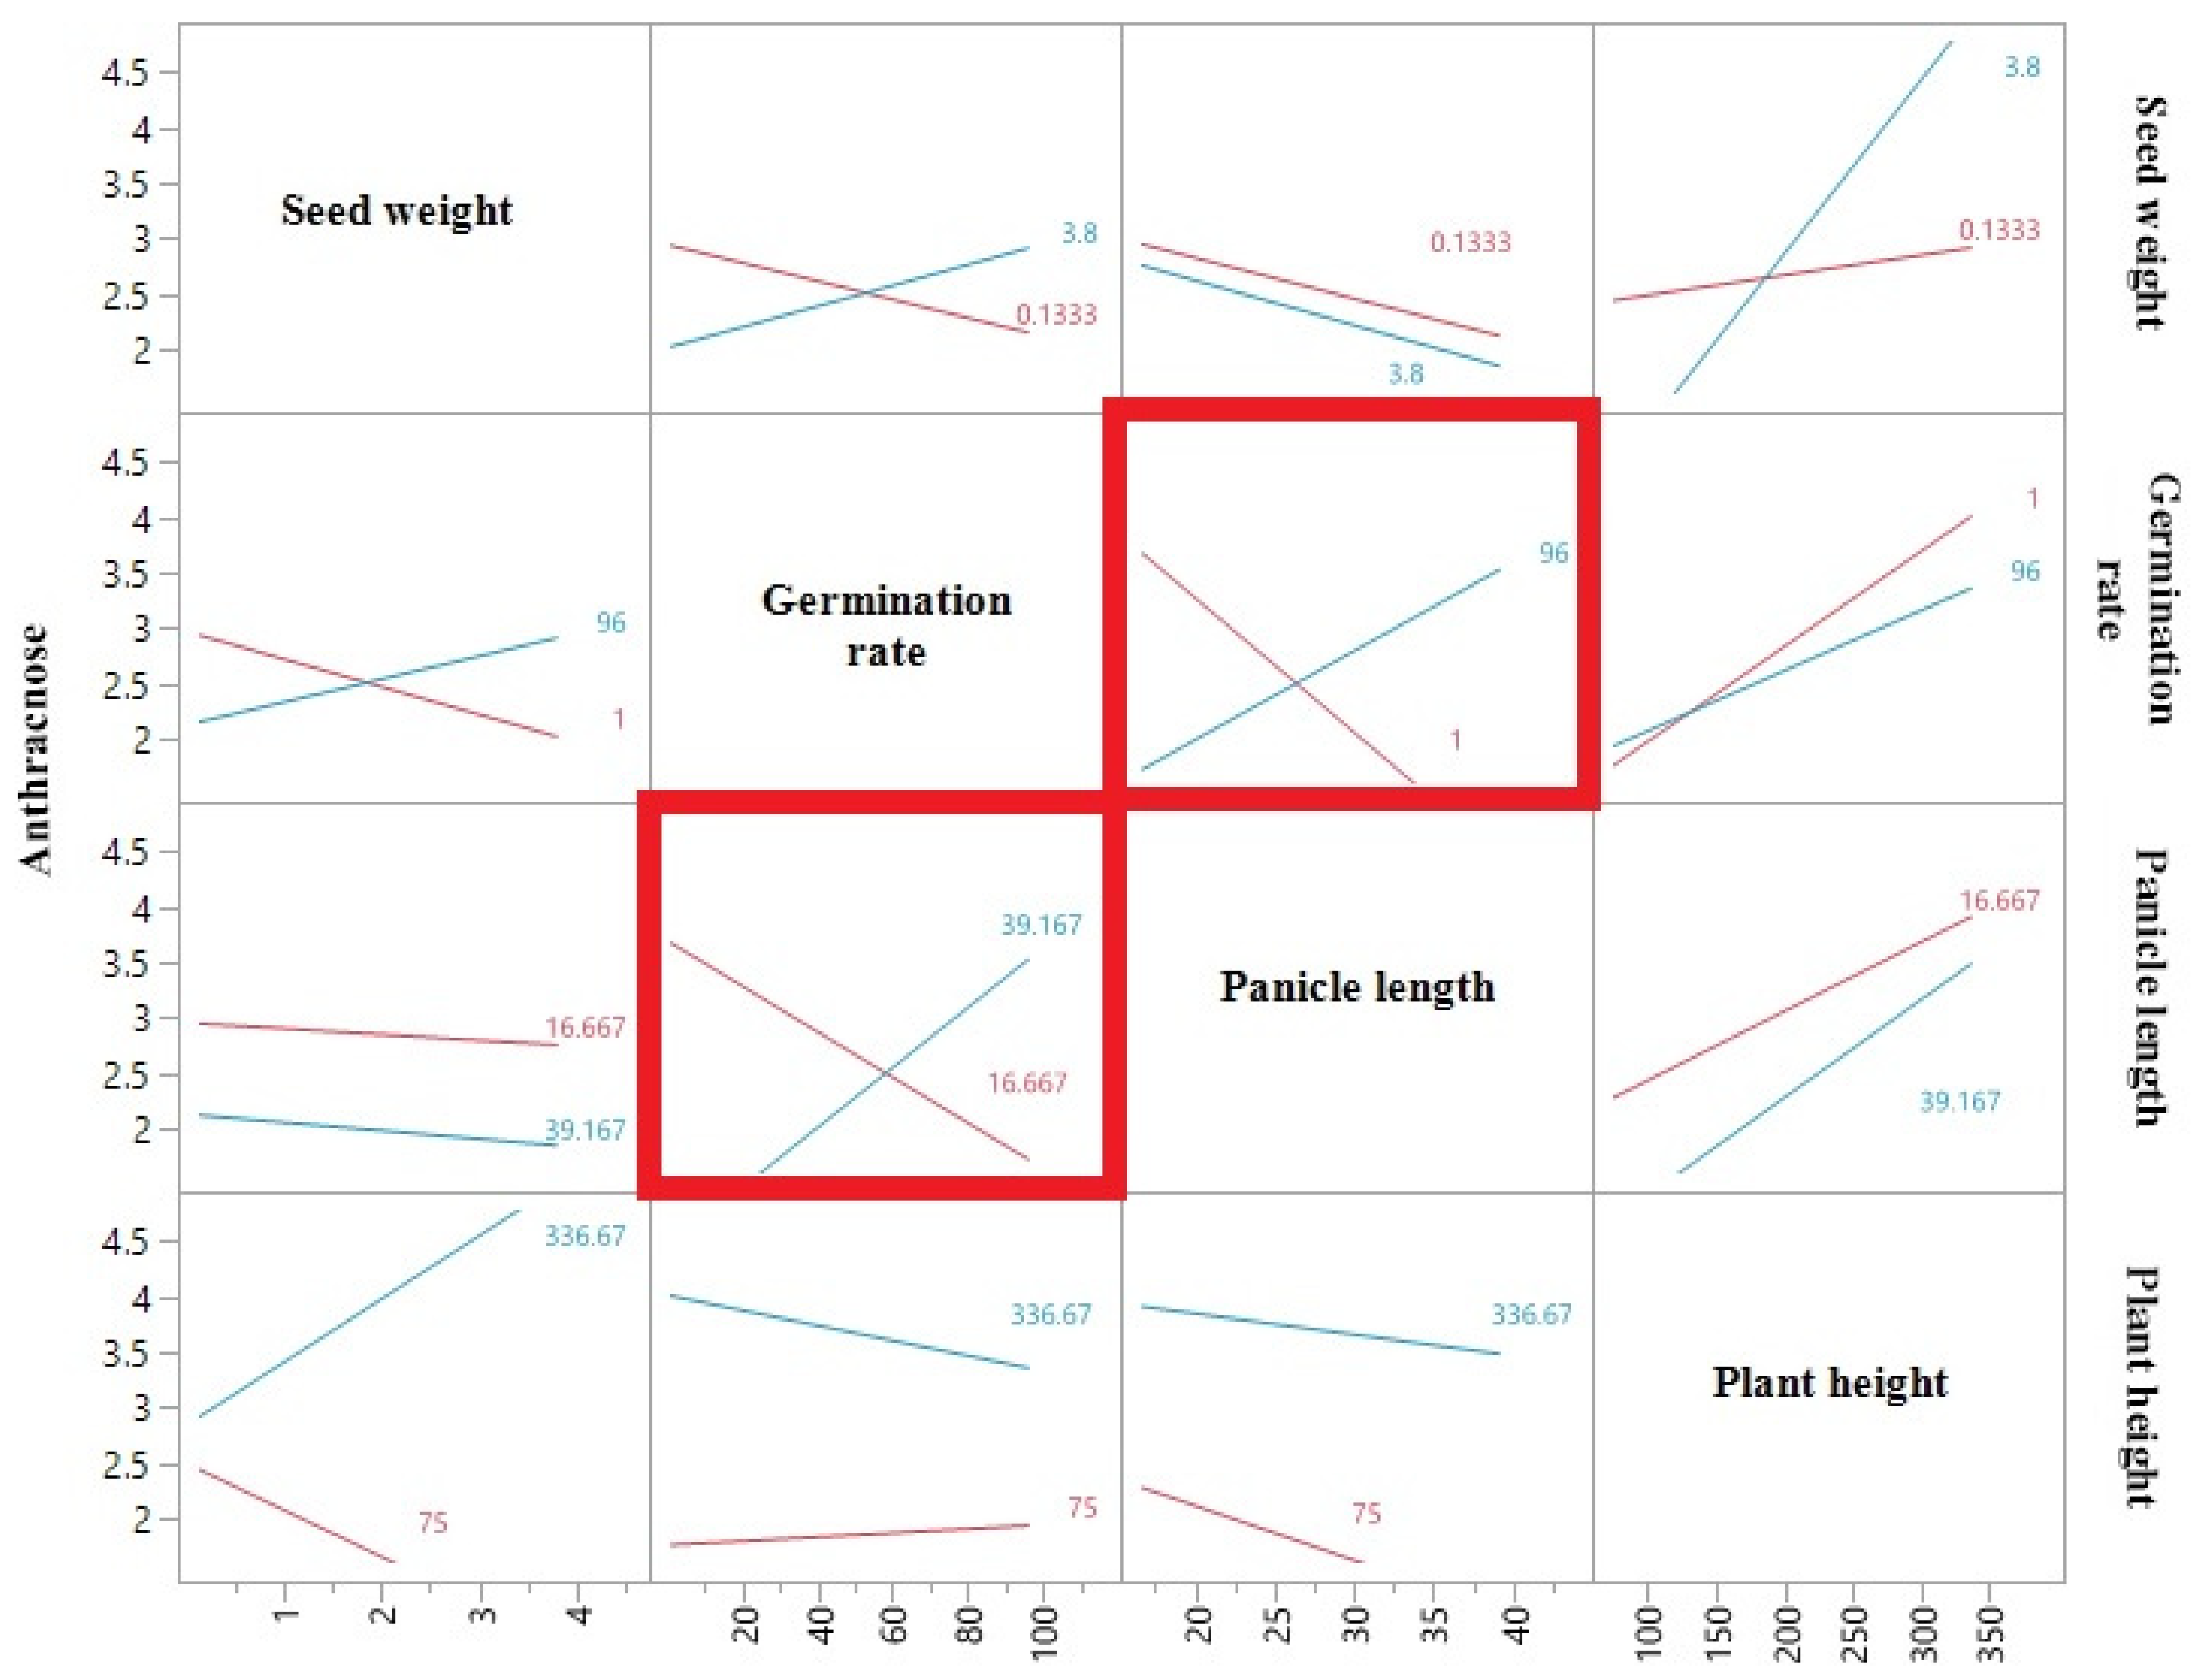
Statistical analyses of the phenotypic data for the six traits were conducted in JMP Pro 17 (SAS Institute, Cary, NC, USA). Missing data were addressed through imputation Multivariate Normal Imputation. The primary goal was to explore potential relationships among all the traits. Spearman’s ρ test was used to identify significant pairwise correlations. Principal component analysis (PCA) and clustering variables analysis (hierarchical clustering with Ward’s method and K-means clustering) were implemented to investigate these relationships further and identify patterns within the data. The ‘fit model’ function in JMP Pro 17 generated interaction profiling plots to assess potential linear relationships between traits. The model was constructed with the effect set to full factorial, personality set to Standard Least Squares, and emphasis set to Effect screening.

2.6. Machine Learning Analysis

In JMP 17 Pro, we employed a Support Vector Machine (SVM) with a Radial Basis Function (RBF) kernel to predict the germination rate using all available features. This approach leveraged JMP’s visualization and exploratory data analysis strengths to uncover complex feature interactions. We retained the default SVM hyperparameters (Cost = 1, Gamma = 0.17) and implemented holdback validation (33% holdout, random seed 0) for model assessment. To further understand the SVM Models with the RBF model’s behavior and feature relationships, we generated a prediction profiler, interaction profiles, and surface plots within JMP. The RBF kernel has an equation as follows:
k ( x i , x j ) = exp   exp   ( γ x i   x j 2 )
Furthermore, random forest (equivalent to Bootstrap Forest in JMP) was also used to predict germination rates. Random forests are known for their robustness and ability to handle high-dimensional data. The model was built with 100 trees, 12 terms sampled per split, and a bootstrap rate of 1. The data were divided into a 75:25 split for training and validation sets.

3. Results and Discussions

The expected increase in the global human population will require an increase in crop production, especially of cereals. Sorghum, a versatile cereal crop, will play an important part in mitigating food insecurity, especially in drier tropical regions. However, sorghum production faces challenges from various biotic stresses, notably anthracnose and grain mold. Therefore, identifying agronomic traits that can contribute to disease resistance is paramount.
Results from correlation analysis could be useful in the selection and development of genotypes, especially if certain traits have a direct effect on yield. Herein, correlations are reported among four agro-morphological traits and fungal diseases, sorghum anthracnose, and grain mold. Analysis of the six traits revealed significant correlations in 12 out of 15 possible pairs, with six positive correlations and six negative correlations (Figure 1 and Table 2). Germination rate exhibited positive correlations with plant height (Spearman ρ = 0.40 and p-value = <0.0001), panicle length (Spearman ρ = 0.23 and p-value = 0.0105), and seed weight (Spearman ρ = 0.56 and p-value = <0.0001). Similarly, Prom et al. [59] noted significant and positive associations between germination rate and seed weight. Hou and Romo also reported a positive correlation between germination rate and seed weight [60]. A highly significant and positive correlation between germination rate and seed weight was also noted when sorghum accessions were inoculated with A. alternata alone and a mixture of A. alternata, F. thapsinum, and C. lunata [59]. Further, the results of this study and others indicate a positive correlation between germination rate and seed weight, suggesting that the larger/heavier the seed, the higher the germination rate. Compared to smaller seeds, Mao et al. [61] noted that larger seeds with higher 1000-used weight contained more soluble sugar, higher germination index, vigor index, and seedling biomass. It was reported by Gupta et al. [62] that the higher germination rate of larger seeds may be due to the larger food reserve of larger seeds compared to smaller seeds. Higher field establishment of bird’s-foot trefoils was also attributed to planting larger seed sizes, as McKensie et al. observed [63]. This work showed that plant height positively correlated with seed weight and panicle length, while Zhao et al. [64] revealed a positive correlation between sorghum plant height with panicle exertion and leaf angle. Adepoju et al. [65] revealed that the weight of coffee seeds per tree was positively correlated with trunk height. A weak correlation was also observed between panicle length and seed weight. The significant and positive association between seed weight and germination rate noted in this study and others indicate that selecting disease-resistant sorghum accessions with larger/heavier seeds could be useful because of their effect on plant stand and, thereby, increase yield.
Conversely, the anthracnose score negatively correlated with seed weight (Spearman ρ = −0.19 and p-value = 0.032) and germination rate (Spearman ρ = −0.21 and p-value = 0.020). A negative correlation between crop yield and diseases has long been demonstrated. Laidig et al. [54] noted a strong negative correlation between relative yields of wheat and triticale with yellow rust. Also, a negative correlation between grain yield and damaged leaf area was recorded on wheat sprayed with fungicides to control spots and leaf blight in Central Mexico [52]. Grain mold infection score demonstrated negative correlations with germination rate (Spearman ρ = −0.52 and p-value < 0.0001), plant height (Spearman ρ = −0.61 and p-value< 0.0001), panicle length (Spearman ρ = −0.27 and p-value = 0.0022), and seed weight (Spearman ρ = −0.29 & p-value = 0.001) (Table 1). These findings are consistent with observations in the Sorghum Association Panel (SAP) lines by Prom et al. [59], which reported negative associations between grain mold infection and both germination rate and seed weight. Germination was negatively affected when sorghum seeds were challenged with Fusarium spp. as documented by Garud et al. [66]. This study further expands upon these findings by suggesting potential associations between grain mold infection and other physical traits like plant height and panicle length. Based on Spearman’s rank correlation analysis, no significant correlations were detected between the anthracnose score and panicle size-related traits. According to Ribeiro and Maziero [53], common beans planted in four experiments and different growing seasons and years revealed a significant interaction between genotype and environment, indicating that variation for most traits may result in changes in the correlation estimates. The environment is also critical in disease development and severity, influencing the correlations between the disease and various agronomic traits. Currently, a genome-wide association study (GWAS) to identify single-nucleotide polymorphic (SNP) loci associated with plant agronomic traits has been utilized by several researchers, including Morris et al. [48], Rhodes et al. [49], Girma et al. [51], Zhao et al. [64], Gali et al. [67], Tao et al. [68], Czembor and Czembor [69], and Dikshit et al. [70]. Gali et al. [67] identified many SNPs associated with plant height and other agronomic and seed traits using a diverse panel of pea germplasm. In a soybean association mapping panel, 11, 17, and 50 SNP-based haplotypes associated with 100-seed weight, seed yield, and plant height were identified by Contreas-Soto et al. [71]. A GWAS of 431 genetically diverse barley accessions revealed 143 marker-trait associations with several agronomic traits, including 1000-grain weight, days to heading, plant height, and grain per spike [69]. Variability for flowering time, leaf angle, and plant height from a panel of 315 sorghum accessions was shown to be associated with few markers or SNPs: for example, on chromosome 9 (Single Nucleotide Polymorphism (SNP) S9_57236778) and chromosome 6 (SNP S6_39106643) for plant height as noted by Zhao et al. [64].
The interaction profile in Figure 2 shows a noteworthy connection between panicle length and germination rate with anthracnose susceptibility. Although the individual effects of panicle length (p-value = 0.05) and germination rate (p-value = 0.06) alone have minimal significance, their combined effect (p-value = 0.03) provides the strongest evidence for their interconnected influence on disease occurrence. Additionally, the interaction profile suggests a potential three-way interaction among seed weight, germination rate, and grain mold (p-value = 0.03). Although the individual effects of these traits on anthracnose are not statistically significant (seed weight: p-value = 0.36, germination rate: p-value = 0.50, grain mold: p-value = 0.24), their combined influence indicates a more complex interplay beyond single-factor effects.
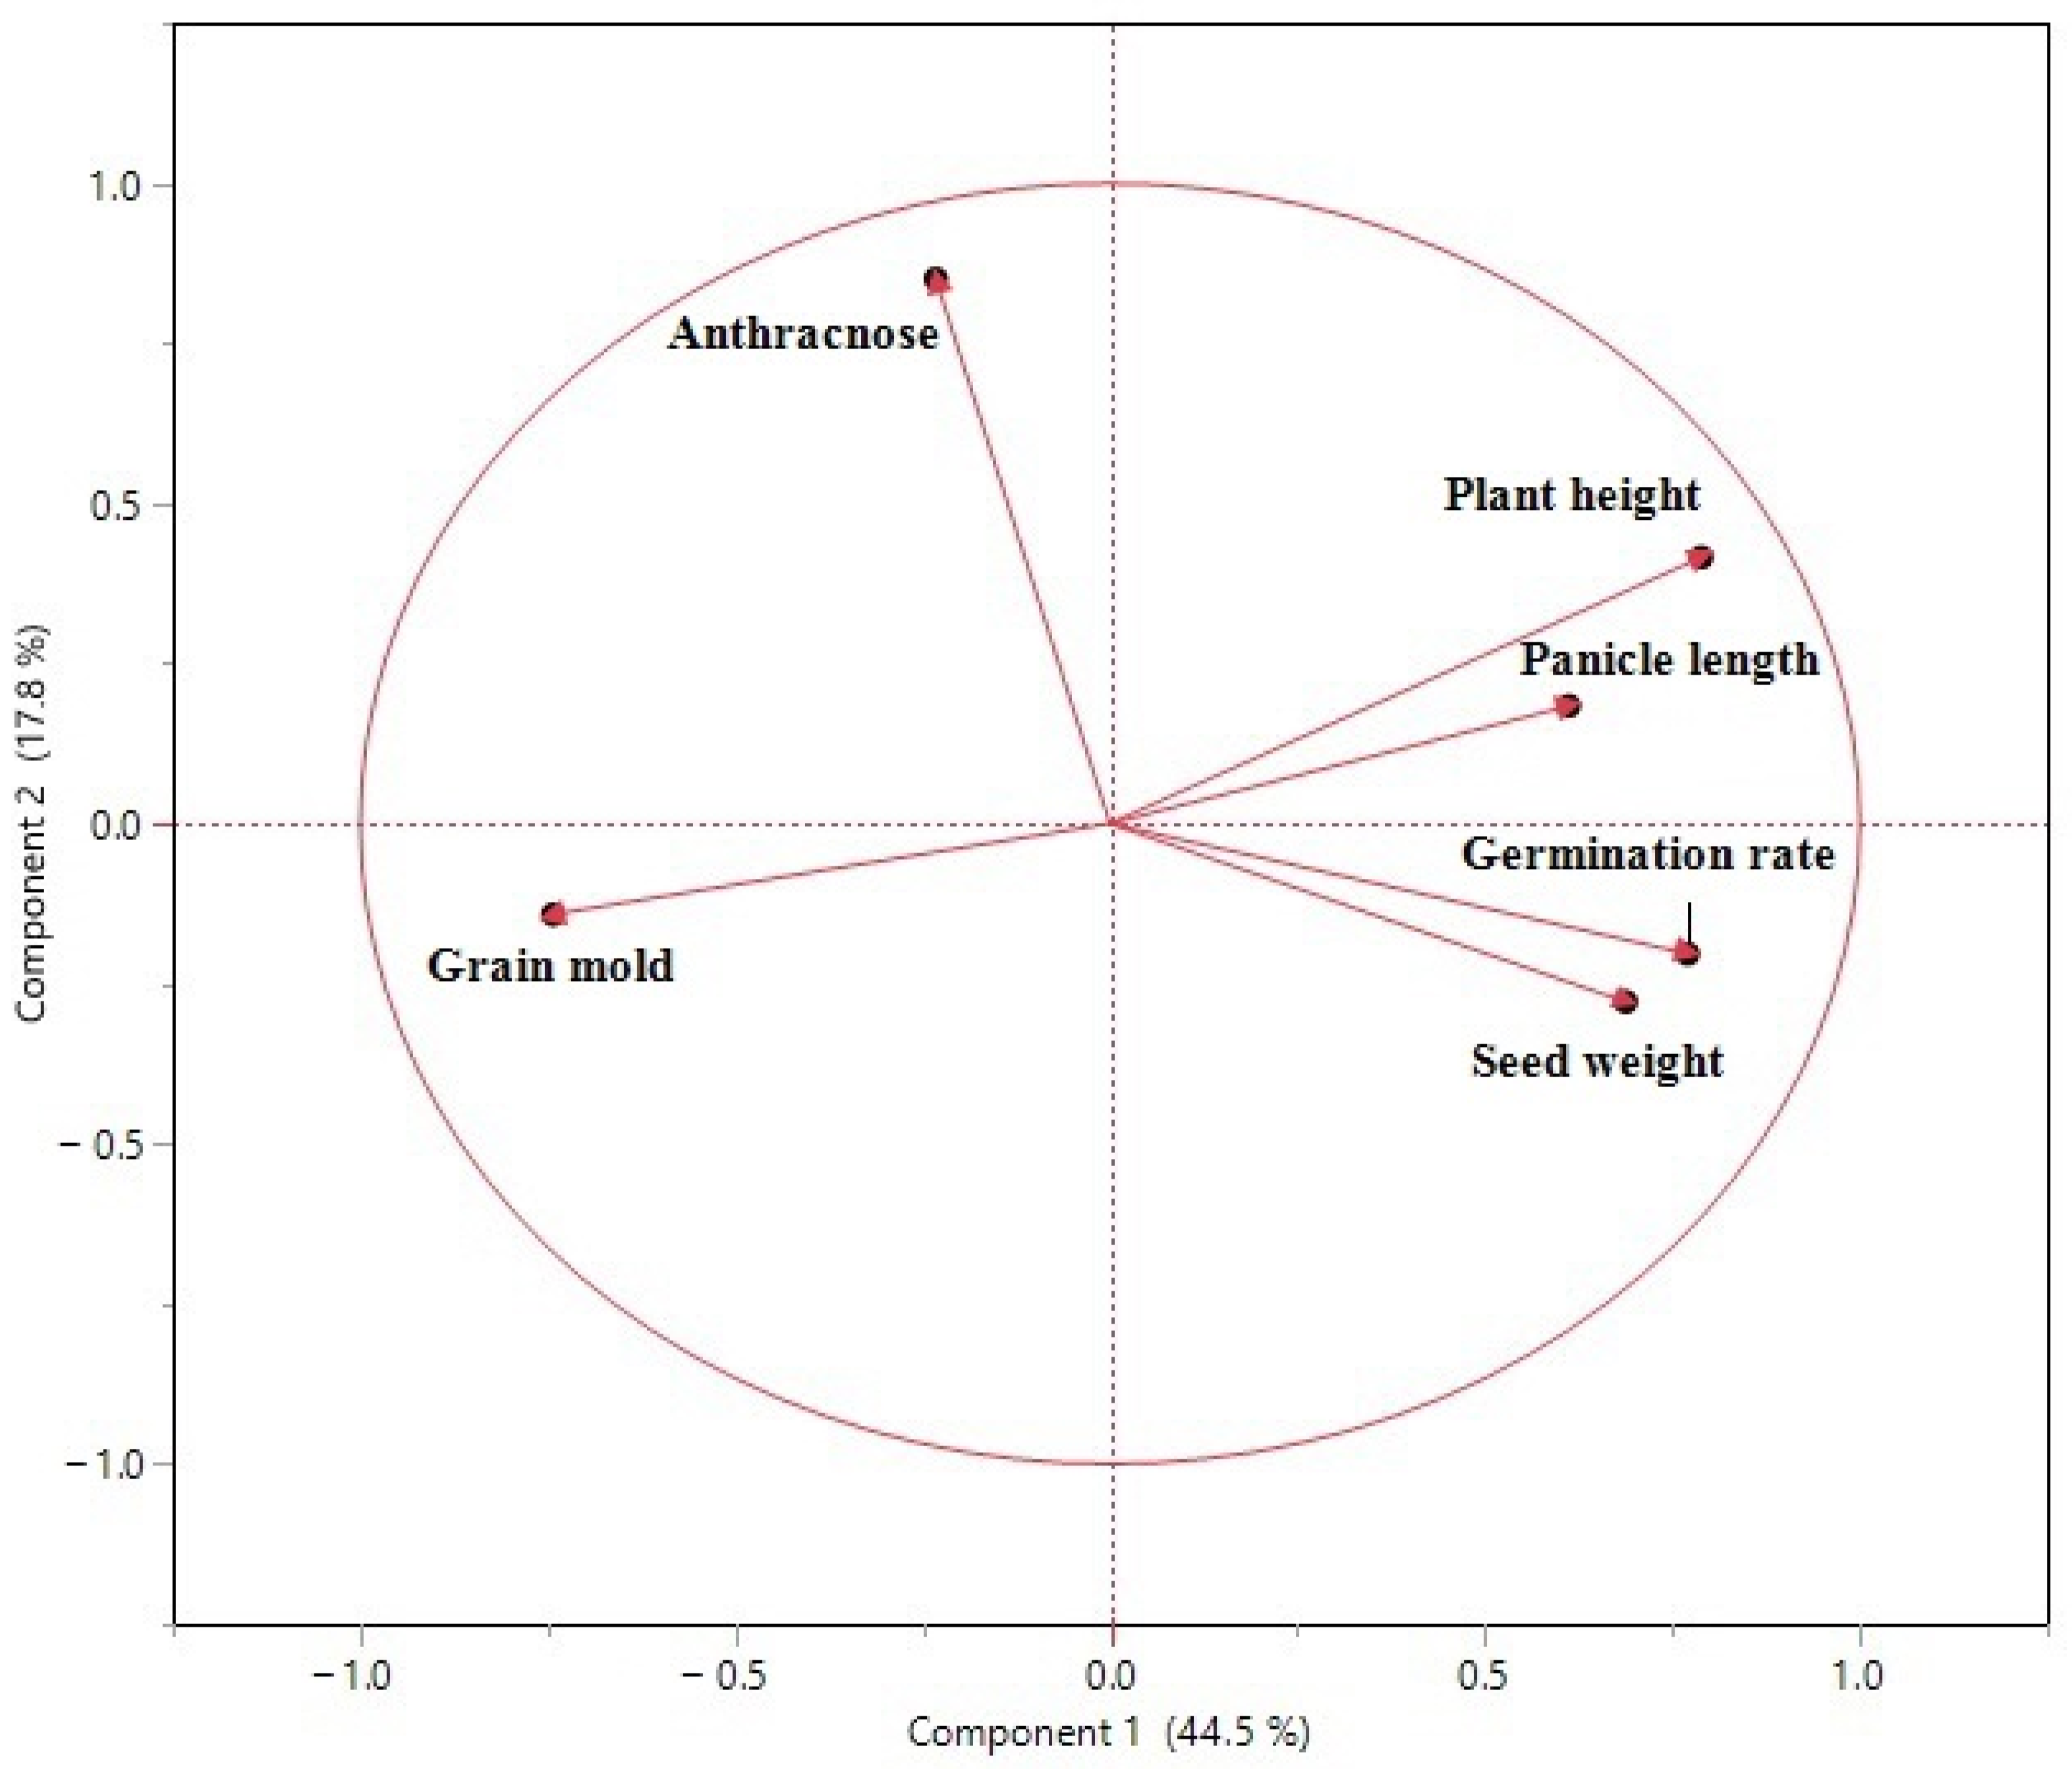
PCA analysis revealed two key components (PC1 and PC2) that together accounted for 62.3% of the variability in six sorghum traits (Figure 3). The relationship between seed weight and germination rate appeared to be positively associated, as they were aligned in a specific direction. Similarly, panicle length and plant height showed close grouping, indicating a shared pattern of variation. When all six traits were considered, there was no distinct separation or clustering of sorghum cultivars from Ethiopia and additional lines from India, Sudan, and the US based on the two principal components (Figure 4a). However, when visualizing the accessions by their country of origin (Figure 4b), a degree of separation became apparent, with Ethiopian accessions tending to cluster apart from those originating from India, Sudan, and the US. This suggests that geographic origin may contribute to the observed trait variation, although factors such as genetic diversity within countries and environmental influences likely also play a role. Further investigation into the specific environmental factors and genetic differences between these regions could help to explain the observed patterns.
Figure 4a shows that each accession is labeled, showcasing their diverse distribution across the first two principal components (PC1 and PC2), which capture 44.5% and 17.8% of the total variation, respectively. This widespread indicates significant variation in the measured traits among the accessions (Figure 4b). Geographic origin of sorghum accessions. Accessions from the US are colored in blue, while accessions from Ethiopia are colored in green. Sudan and India accessions, with only one accession each, are represented by a red dot indicating their average position on the plot. The plot highlights the countries of origin for the accessions, revealing their relationship to the observed trait variation captured by PC1 and PC2.
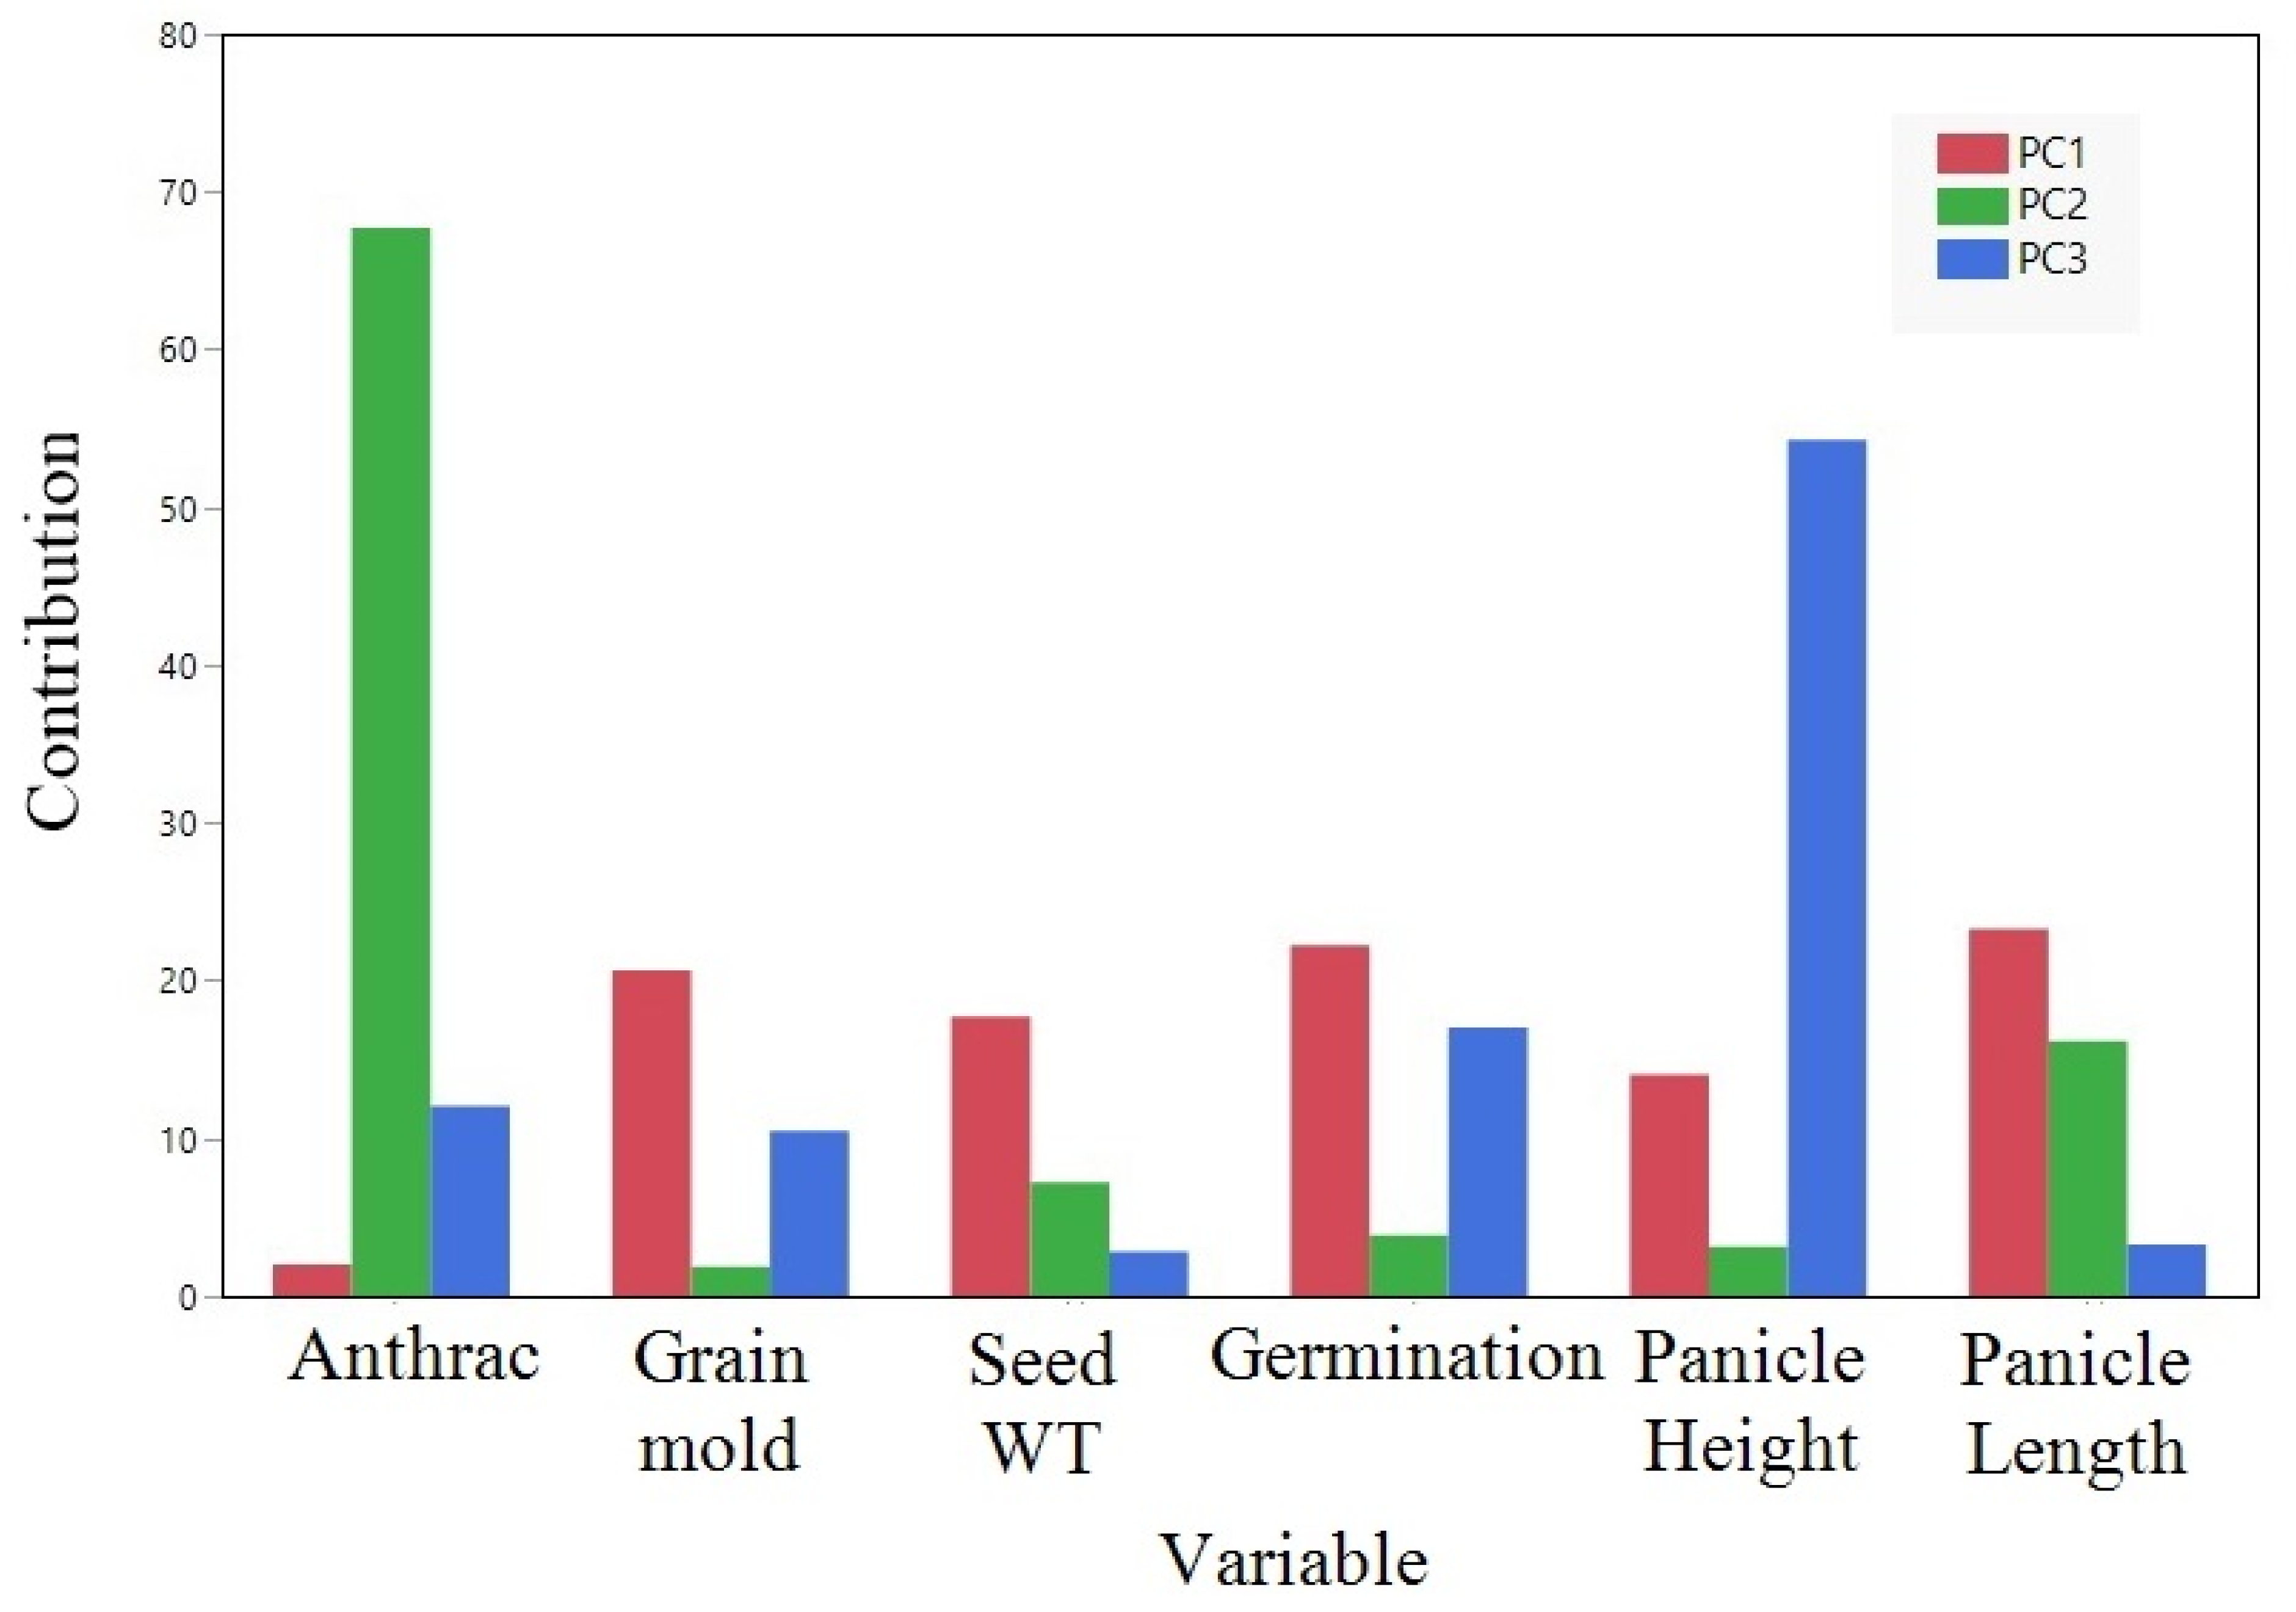
The partial contribution of variables shown in Figure 5 unveiled the individual contributions of traits to the principal components. Notably, PC1 is heavily influenced by a mix of factors, including plant height, grain mold, seed weight, and germination rate. PC2 reveals a more distinct separation among the traits, with anthracnose score emerging as the primary driver for this differentiation. Similarly, the primary driver for panicle length predominantly lies within PC3. Likewise, the cluster analysis of the phenotypic data in Table 3 revealed the formation of two distinct groups. The anthracnose score was separated from the other five traits, mirroring the findings obtained from the PCA analysis.
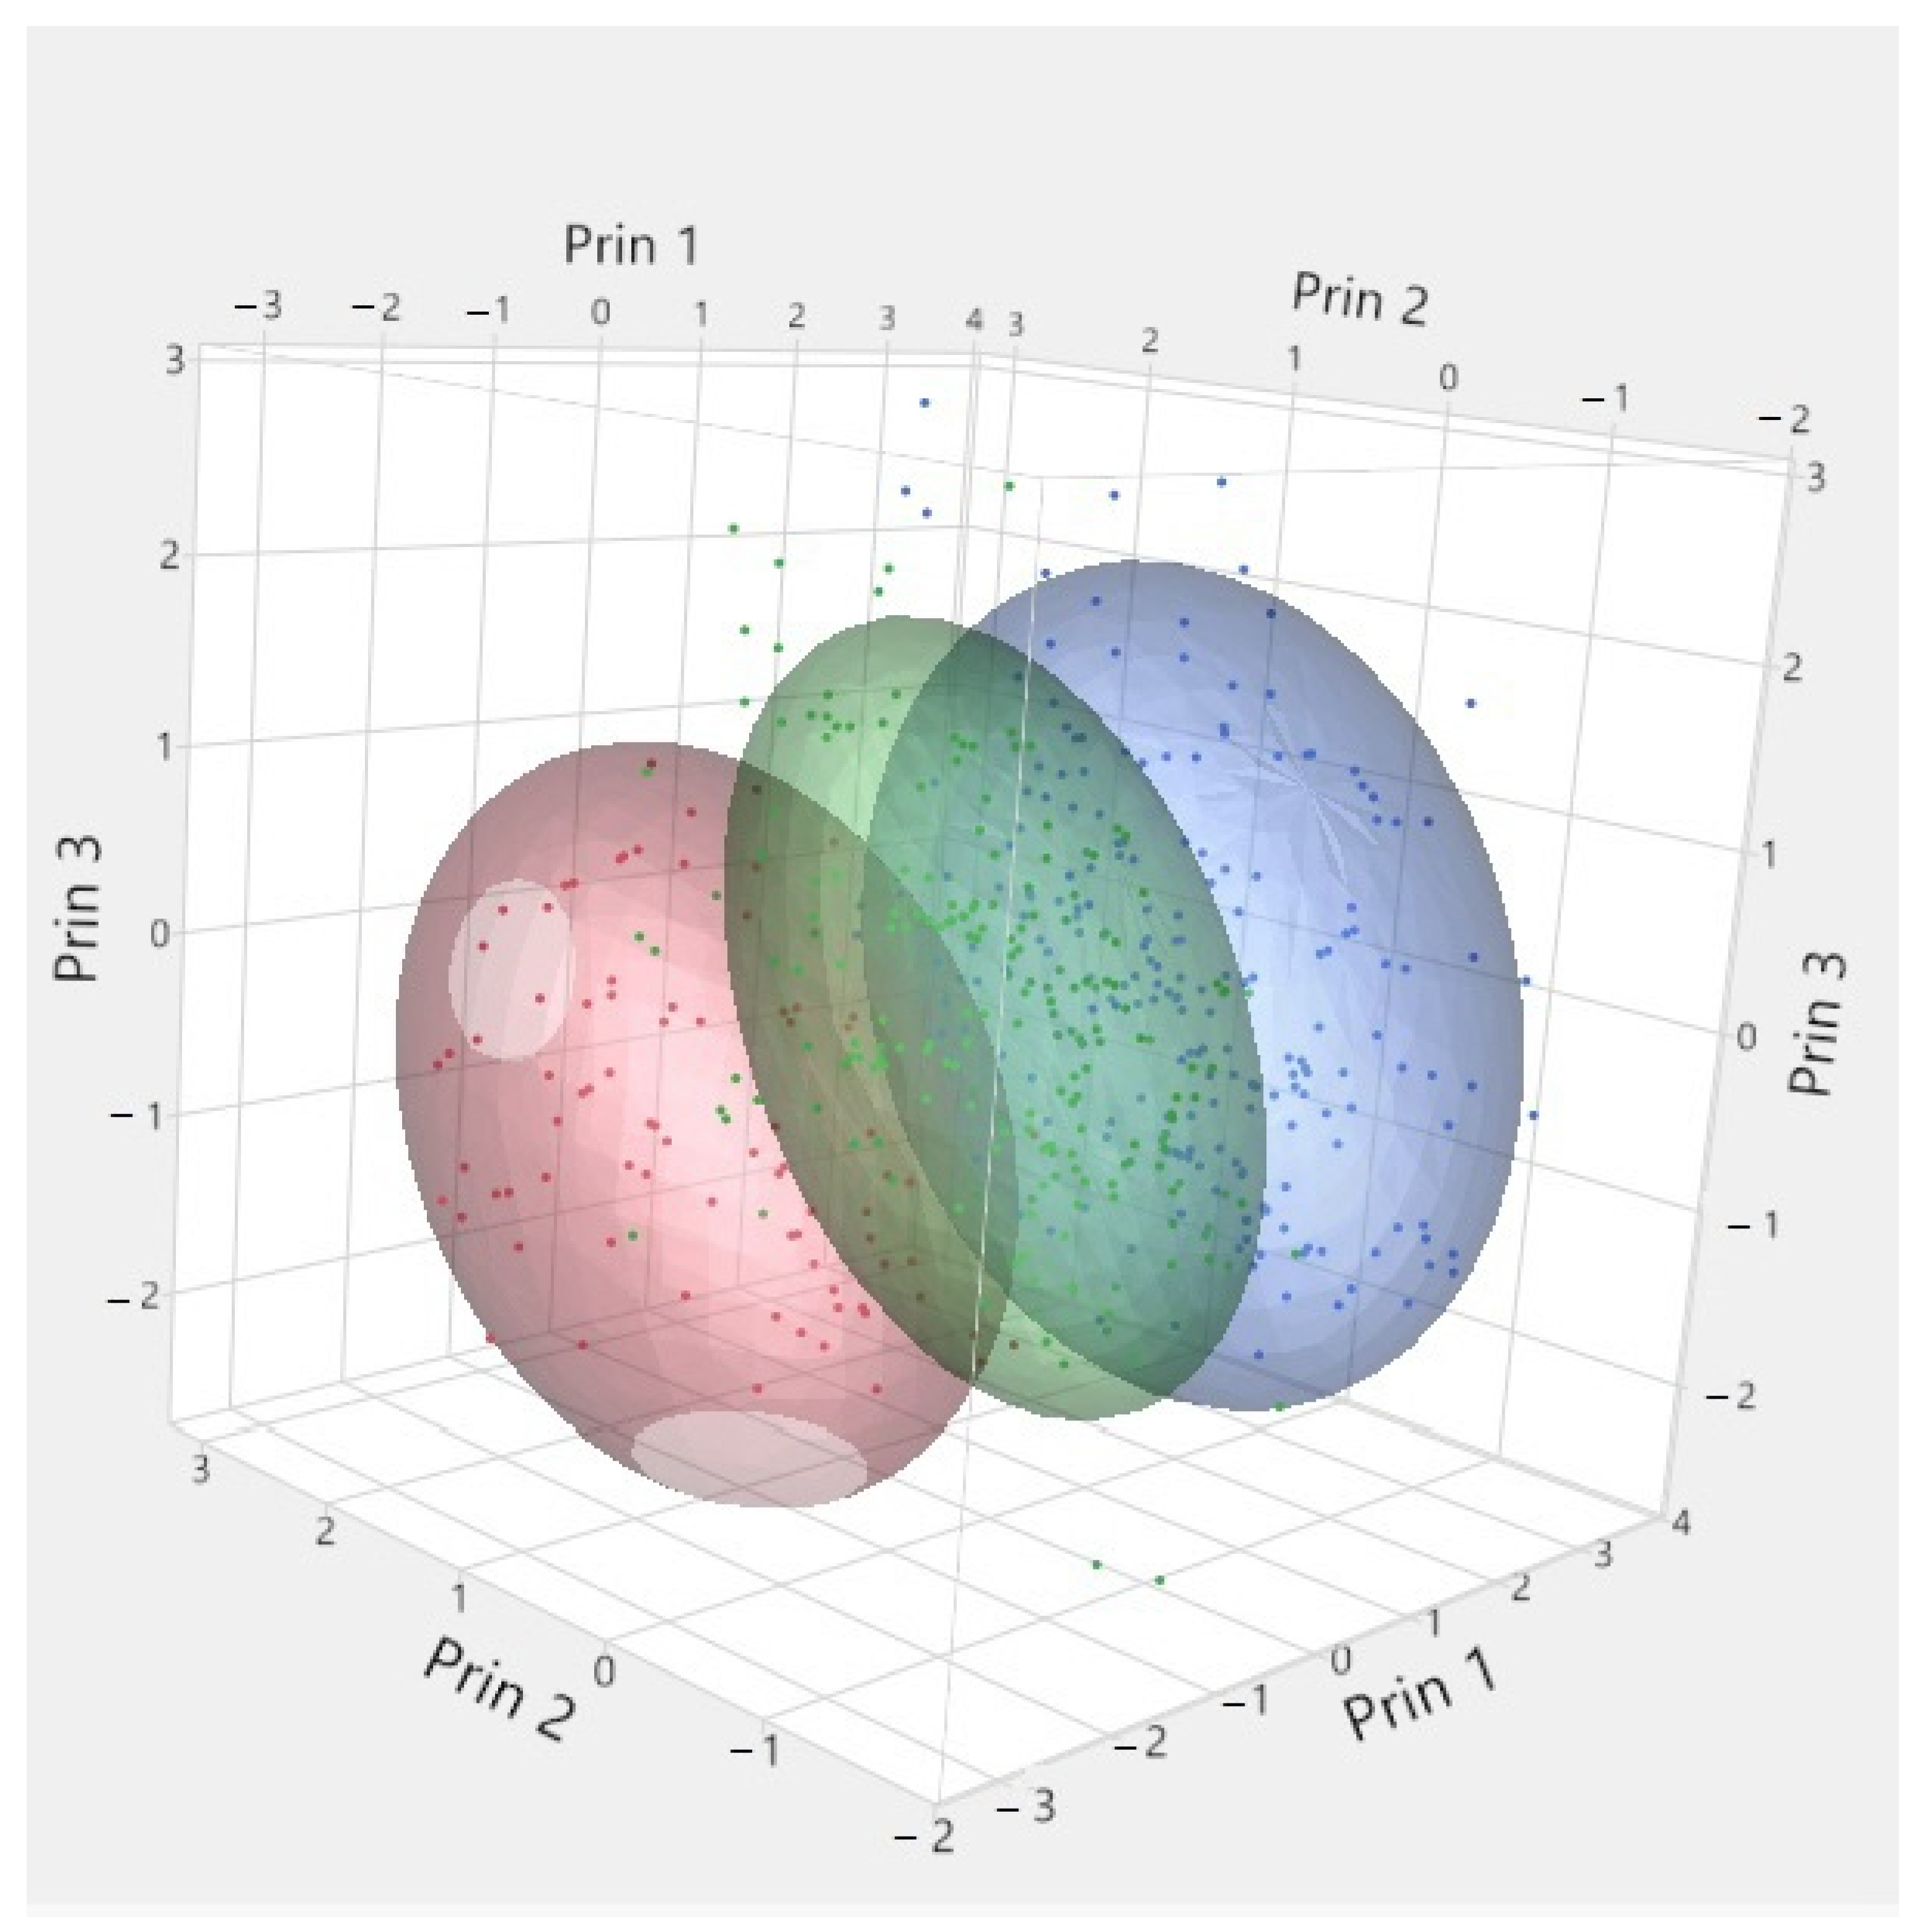
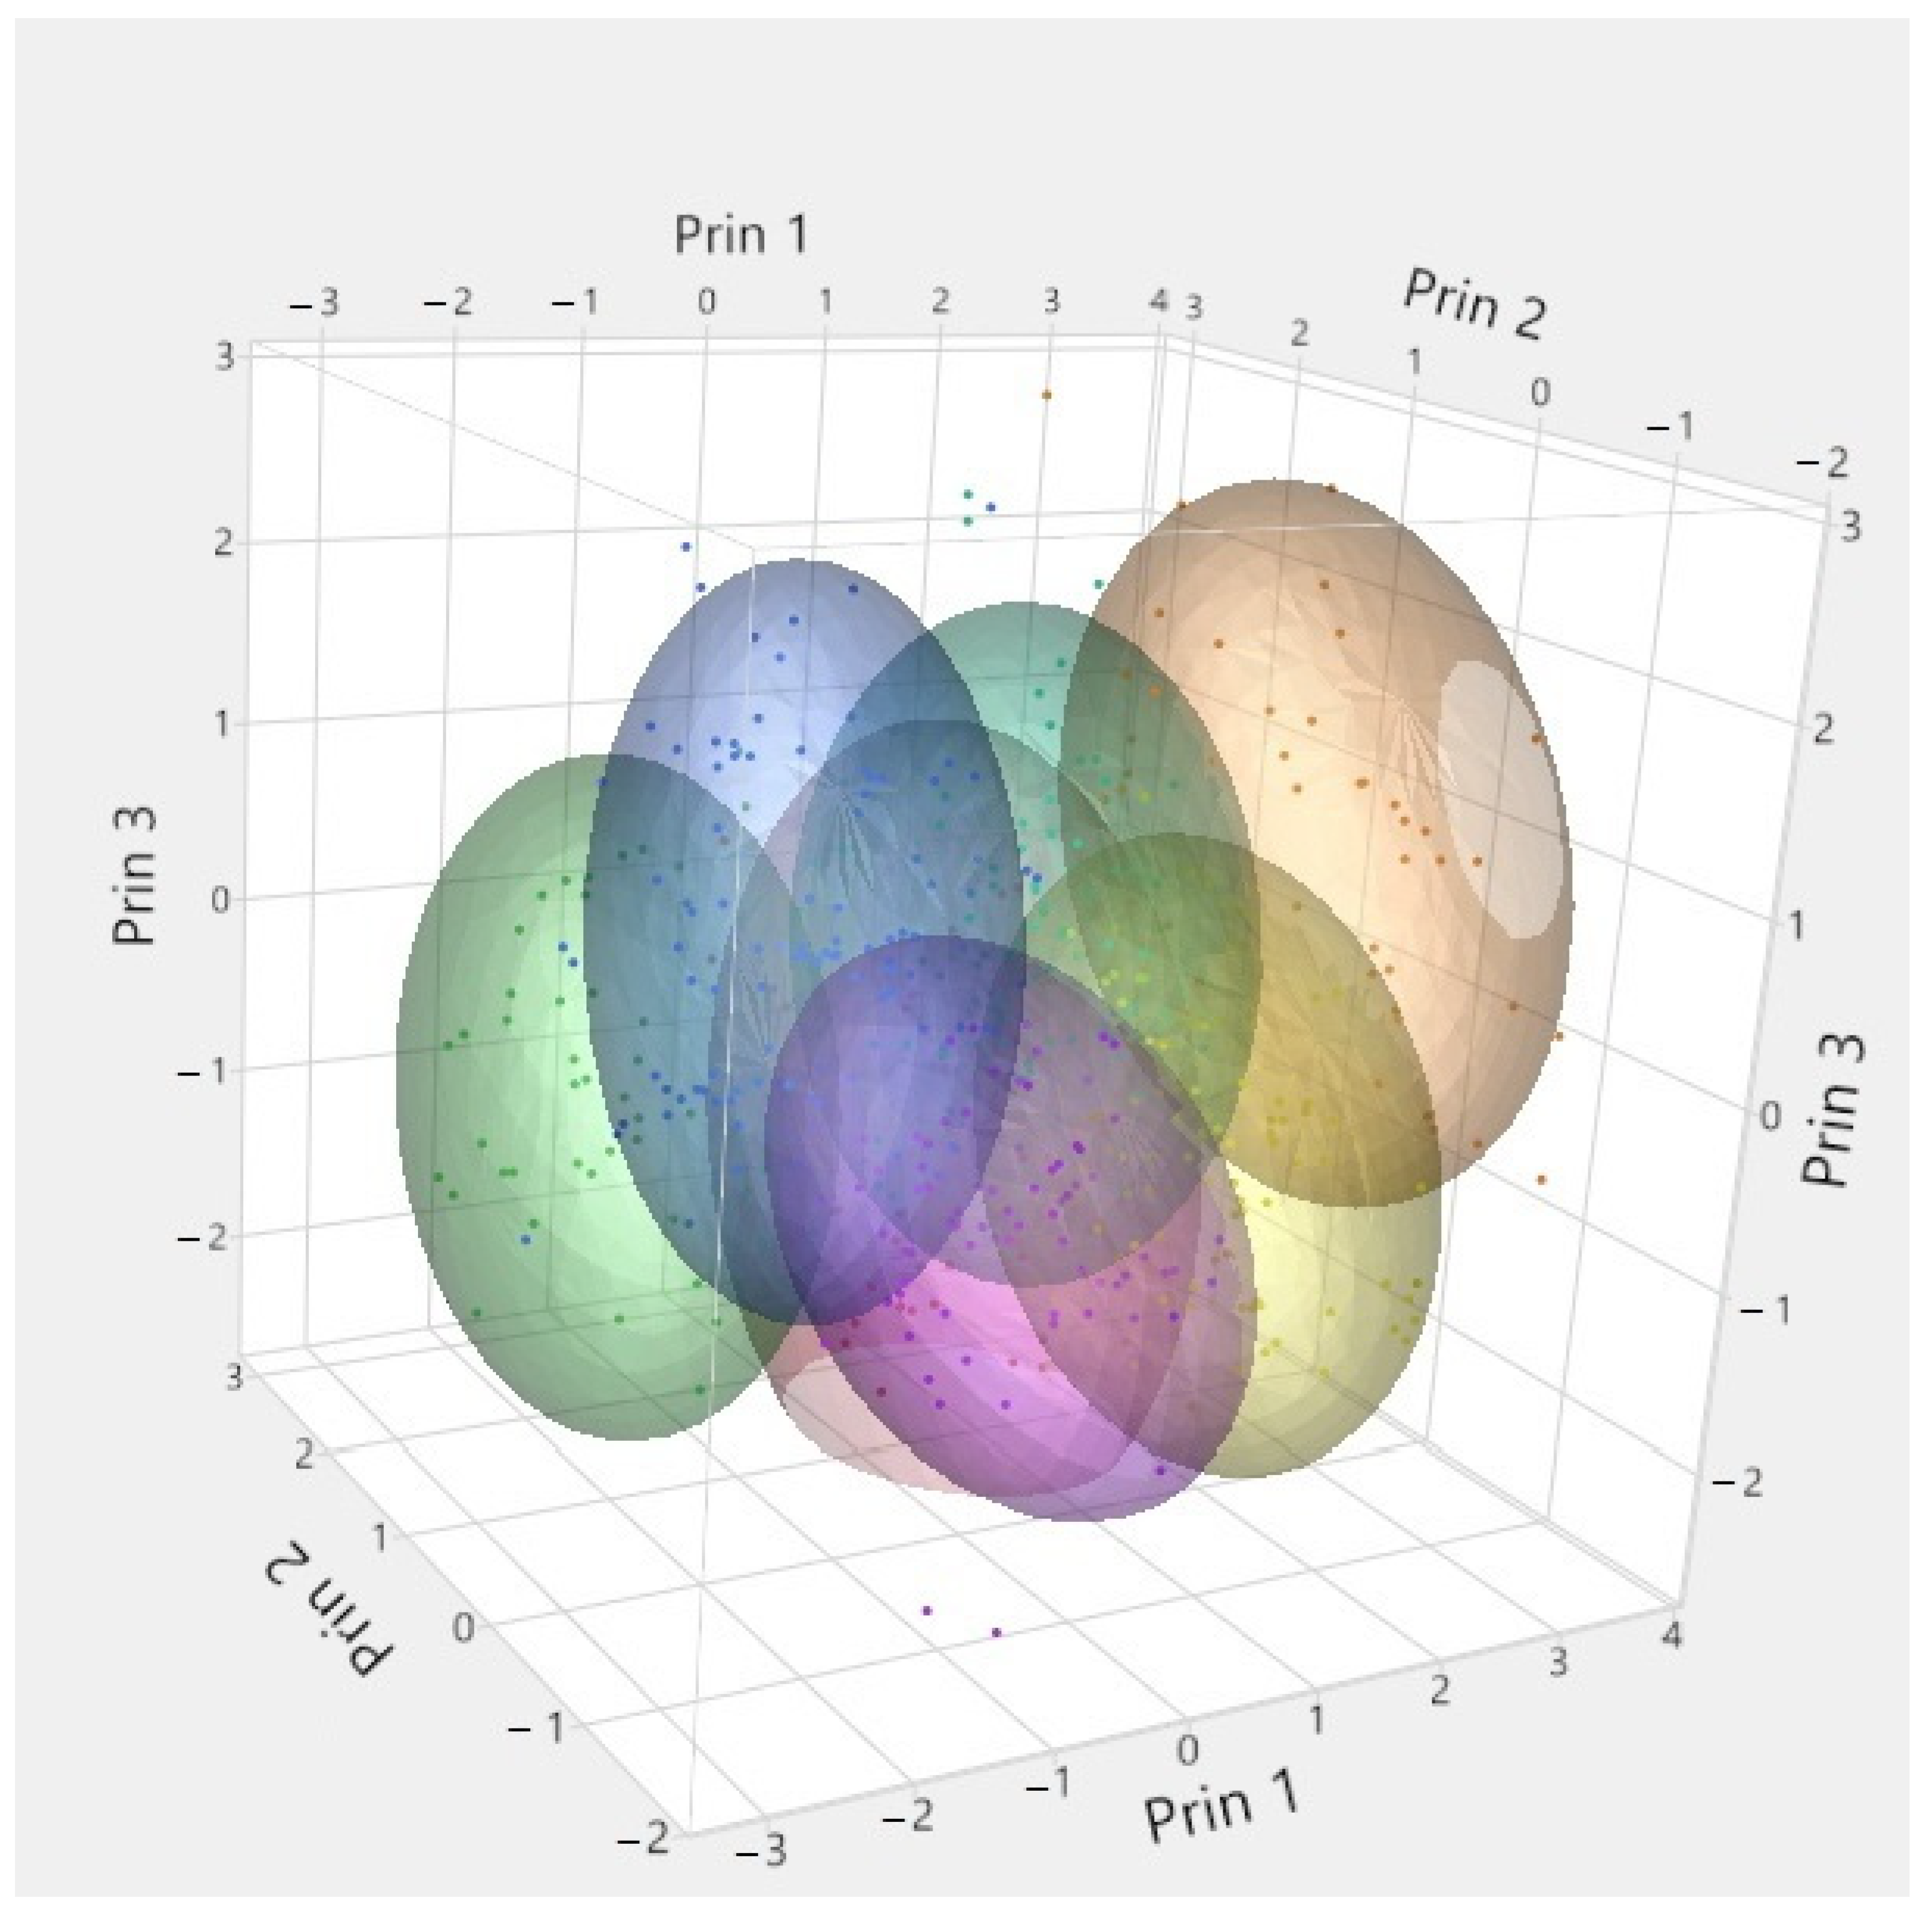
To gain a deeper understanding of potential patterns within the data, we employed hierarchical and K-means clustering techniques. K-means clustering failed to identify distinct clusters with three cluster settings and all six traits as input, suggesting significant redundancy between these traits (Figure 6). After restricting K-means clustering to the two disease-related traits, our analysis revealed an optimal grouping of seven distinct clusters. These clusters are presented in detail in Figure 7. This suggests that disease scores are valuable for differentiating sorghum lines, supporting their use as informative phenotypic data.
SVM with an RBF kernel (non-linear kernel) has emerged as a crucial computational tool in plant biology, especially for tasks related to classifying and regressing complex biological datasets [72]. SVMs are adept at identifying patterns in high-dimensional data, which makes them highly effective for analyzing plant genomics, species identification, and predicting phenotypes, according to Hesami et al. [73]. Random forest is a powerful and versatile machine learning algorithm that has gained immense popularity due to its ability to deliver accurate and robust predictions [74].
In this study, we leveraged the power of machine learning to explore the complex relationships between sorghum pathology and yield-related traits further. Specifically, we employed SVM with an RBF kernel and random forest to model the germination rate as a function of all other traits, including sorghum accessions.
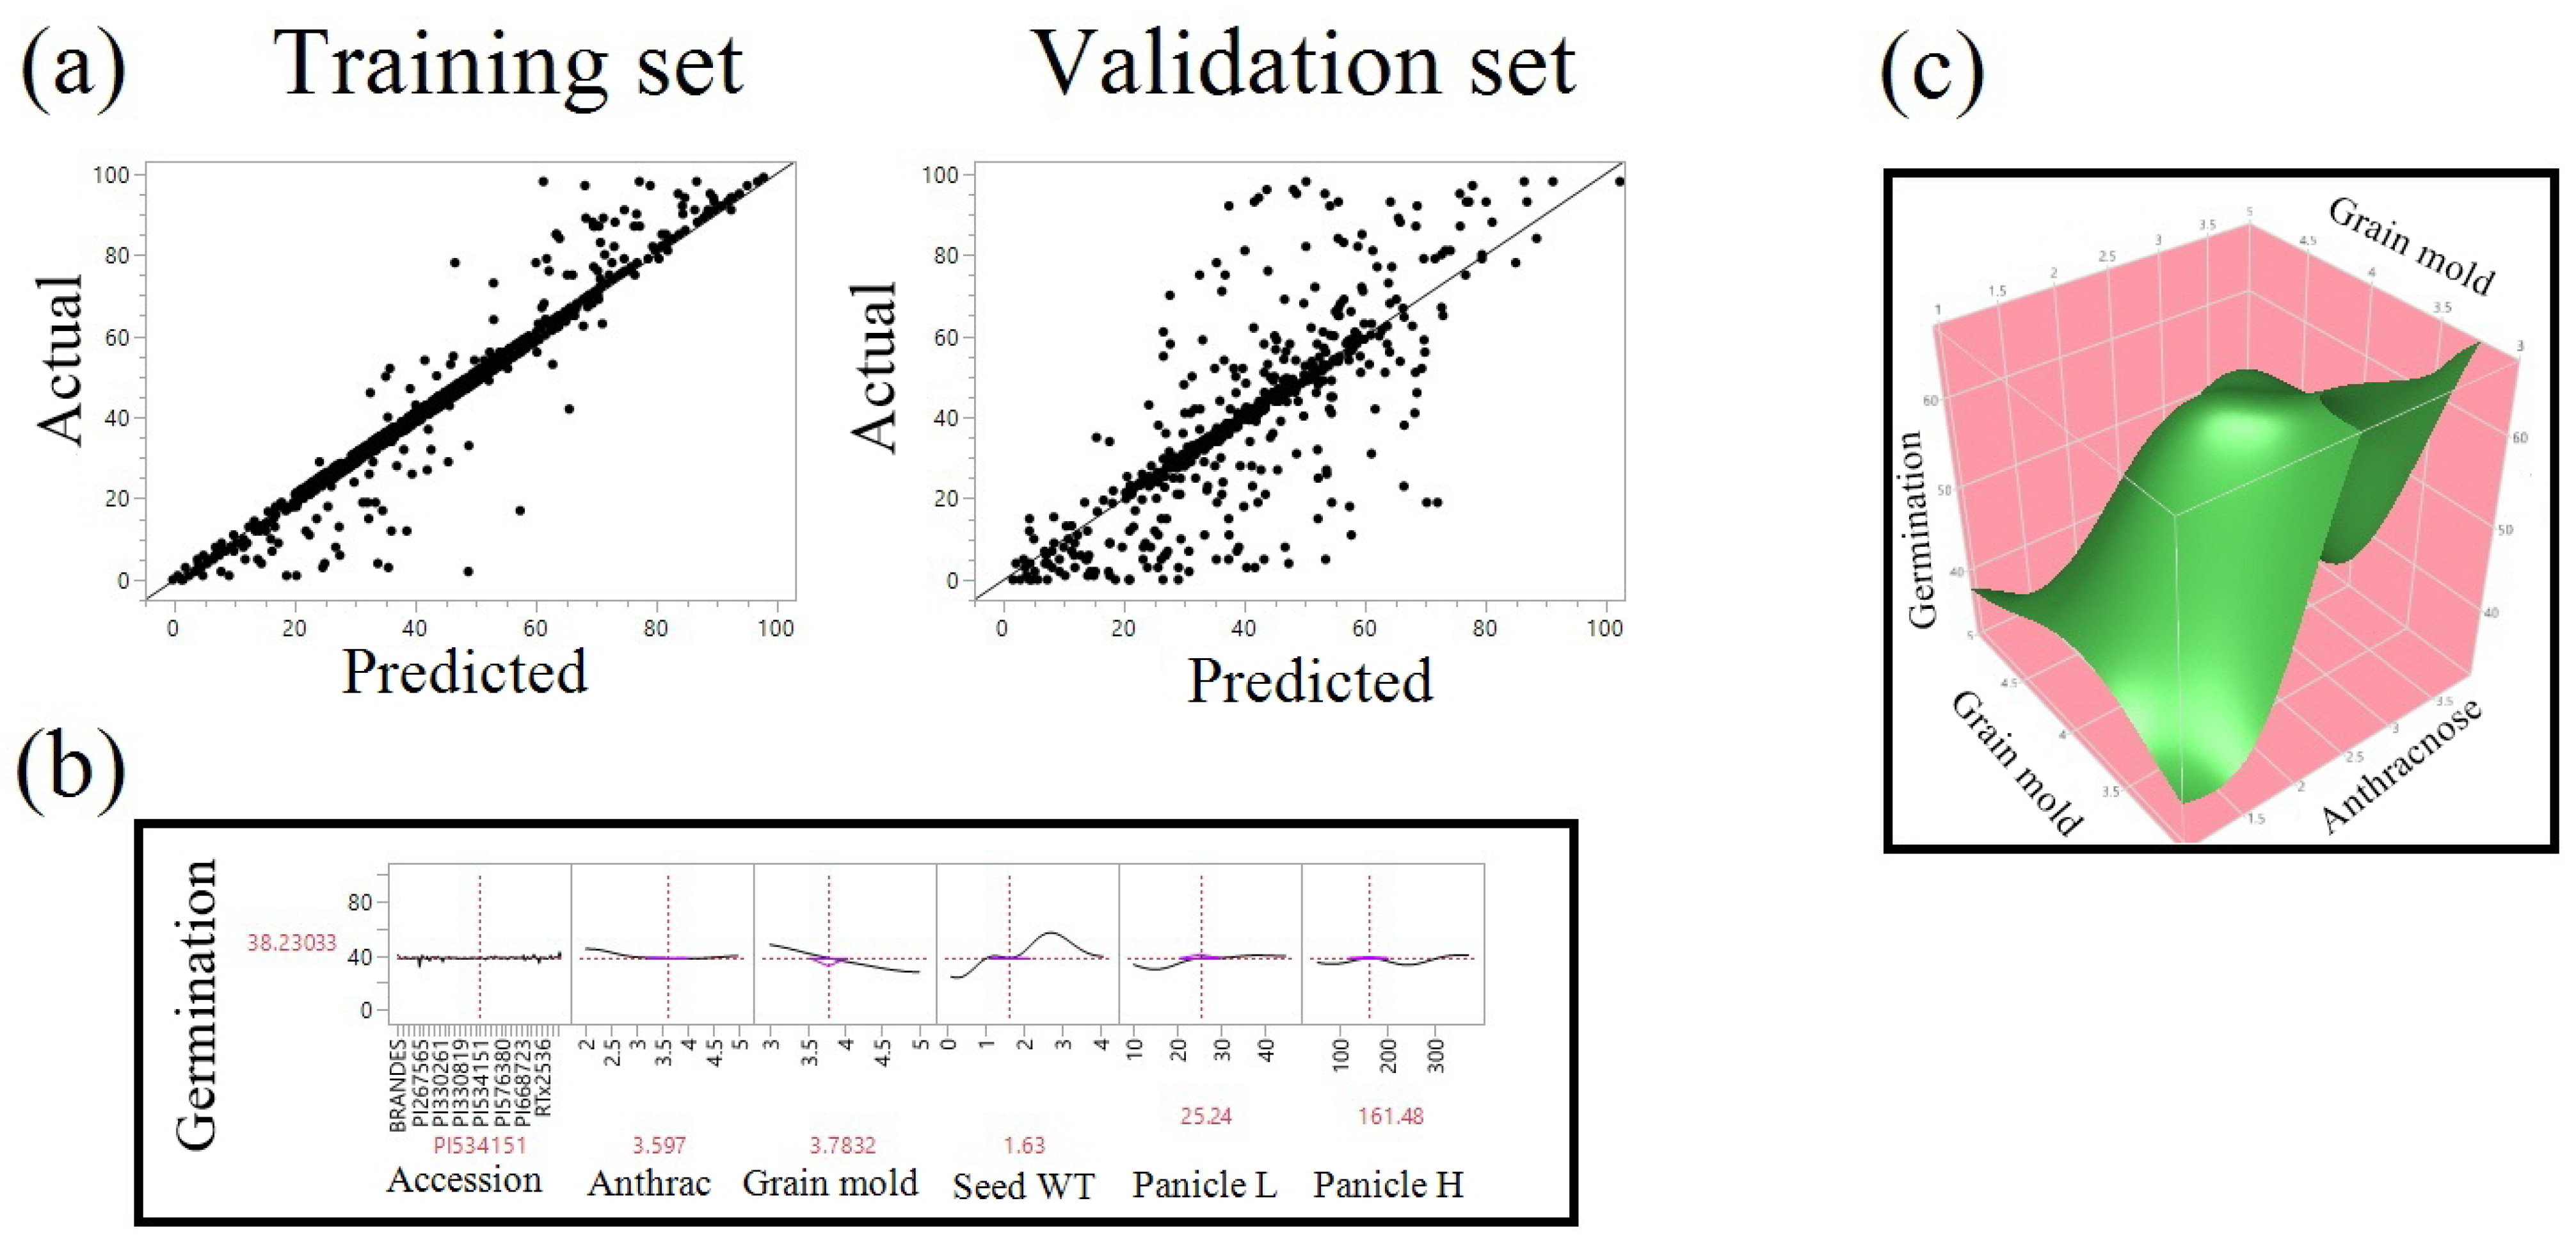
The SVM-generated model showed a strong and clear fit on the training set (R-square = 0.95, RASE = 2.99) but a moderate fit on the validation set (R-square = 0.62, RASE = 8.31). This outcome indicates potential overfitting of the data, where the model may capture noise in the training data rather than generalizable patterns. Figure 8a visually reinforces this observation, with the training set prediction plot showing a clearer relationship than the validation set. The predicted profiler in Figure 8b highlights the non-linear influence of seed weight on germination rate. The surface plot in Figure 8c further demonstrates the intricate interplay between germination rate, anthracnose, and grain mold response.
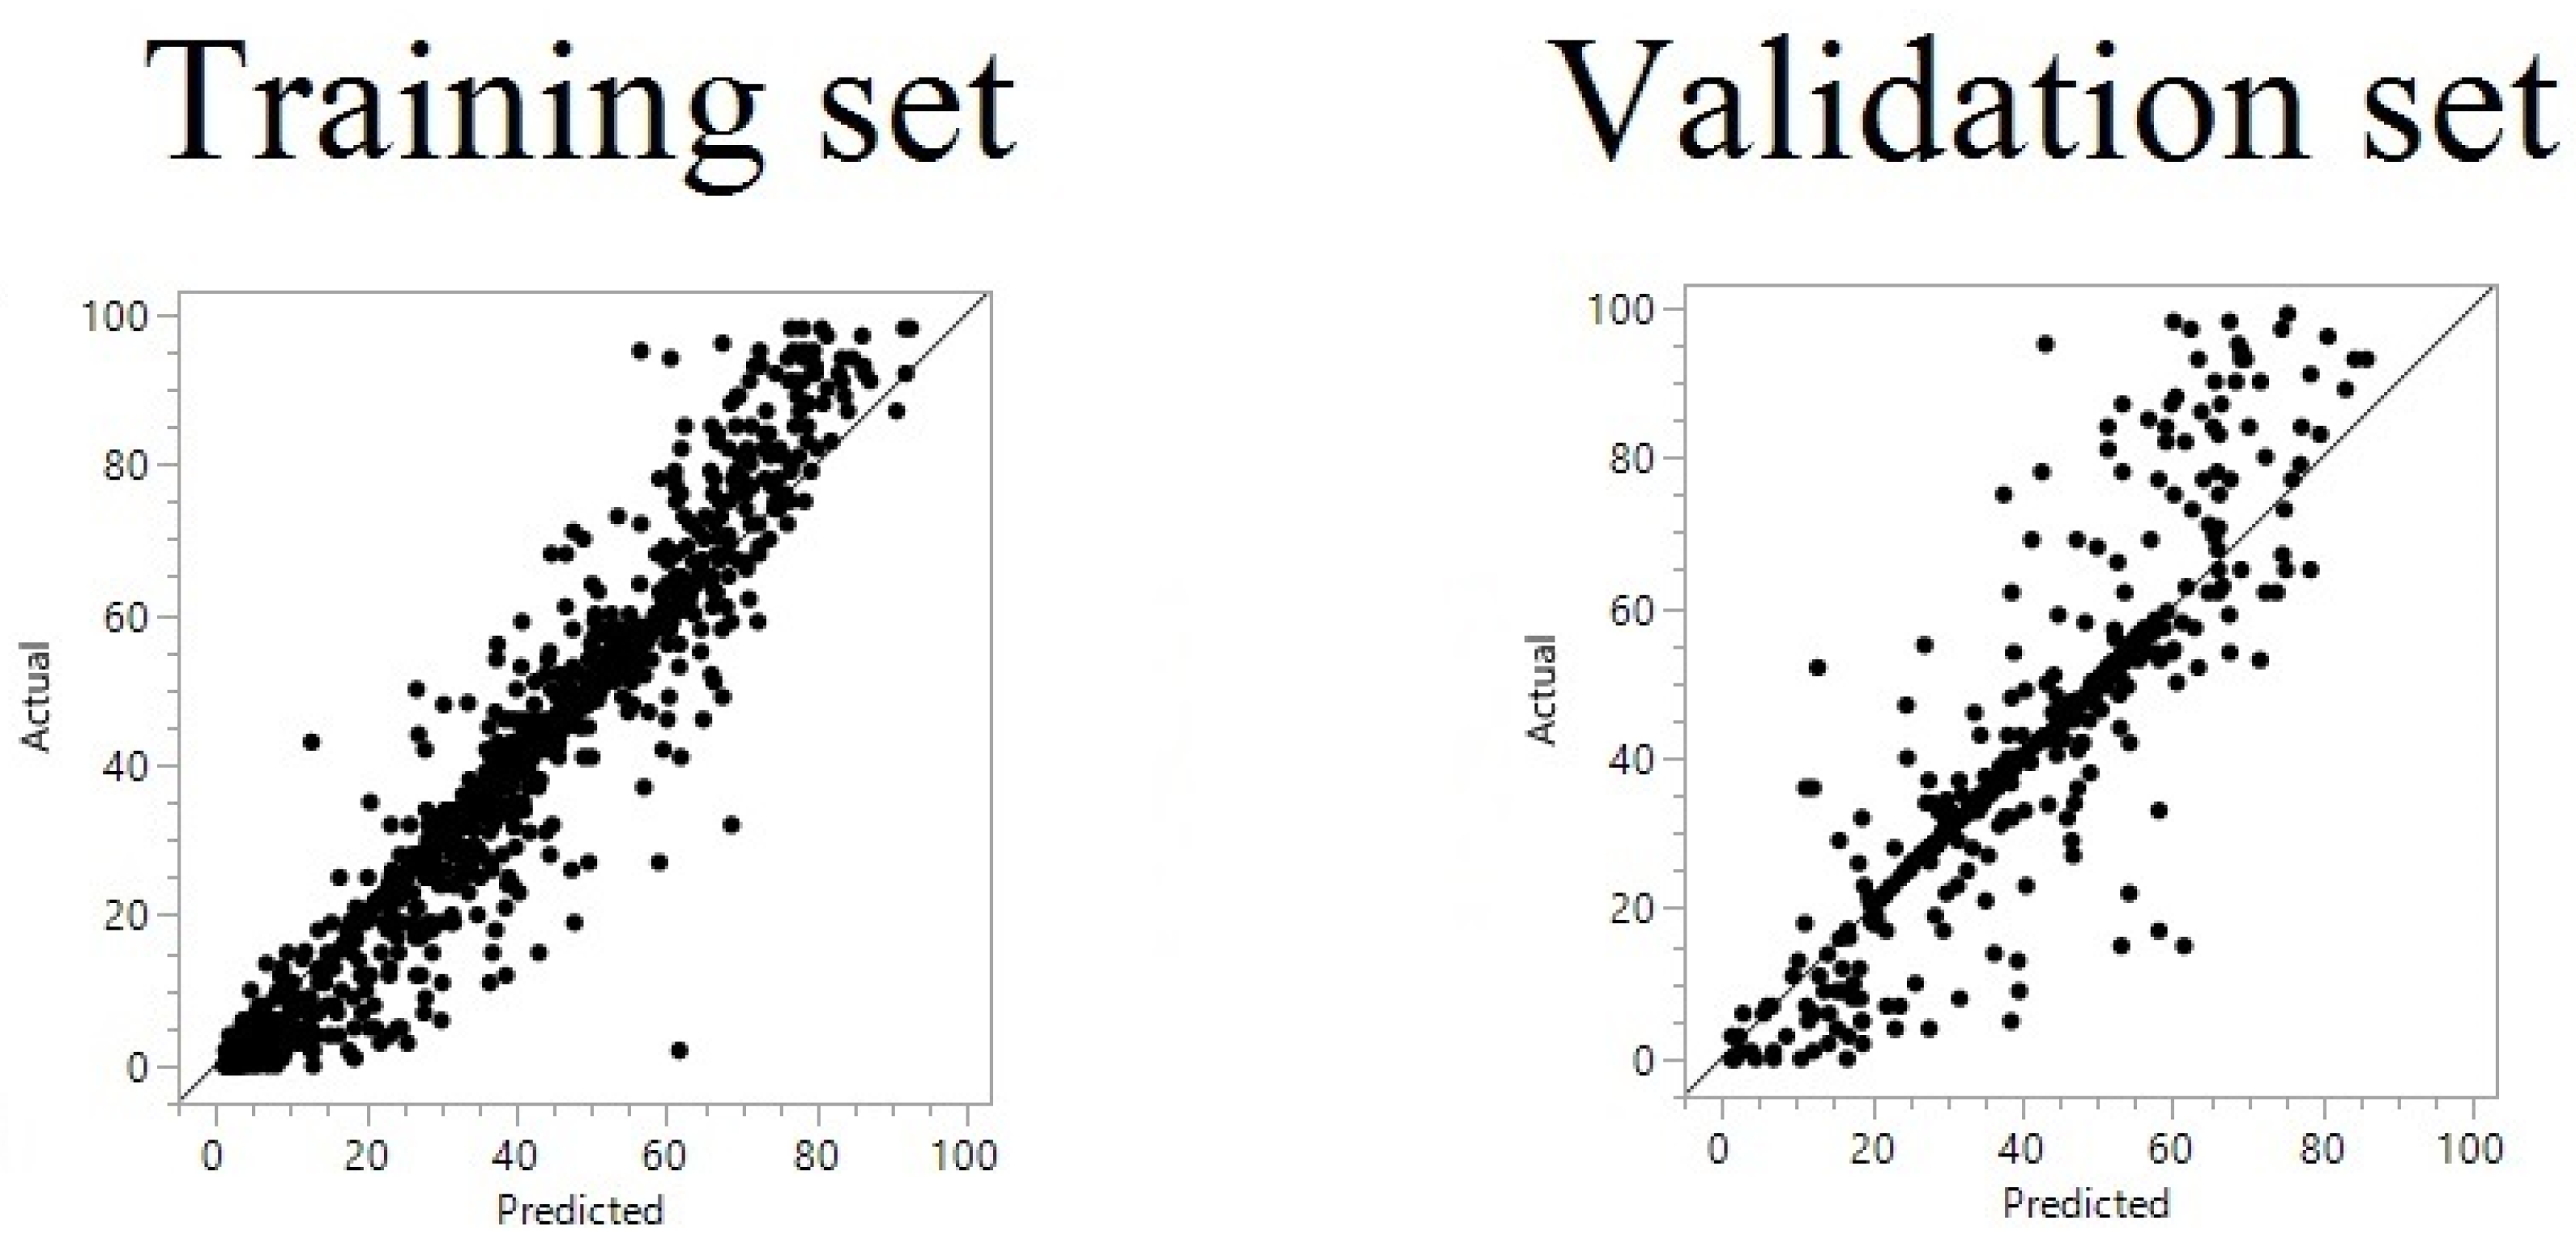
Similarly, random forest presented a strong and clear fit on the training set (R-square = 0.90, RASE = 4.08) and an even better fit on the validation set compared to SVM (R-square = 0.76, RASE = 6.71) (Figure 9). The random forest model identified grain mold as the most important predictor of germination rate (Table 4). Grain mold alone accounted for nearly 34% of the model’s predictive power, suggesting the disease’s great impact on sorghum germination. Likewise, the genotype greatly impacted the germination rate by presenting nearly 31% of the predictive power, followed by other indicators.

4. Conclusions

This study uncovers complex relationships among key sorghum characteristics, including disease resistance, seed weight, germination rate, and panicle morphology. Notably, anthracnose resistance displayed a unique pattern compared to the other traits. The integration of machine learning, particularly the SVM with an RBF kernel and random forest, further deepened the understanding of these relationships, showcasing the potential of predictive modeling in unraveling intricate trait interactions, especially agriculturally important traits like germination rate. Despite the limited availability of genomic data, the observed correlations among seemingly unrelated traits and the successful utilization of machine learning emphasize the intricate biological interconnections in sorghum. The identified associations and predictive models offer a promising avenue for future research, potentially leading to significant improvements in breeding programs and contributing to developing sorghum varieties with enhanced yield and disease resistance when combined with genomic data in the future. The study also revealed significant negative correlations between anthracnose or grain mold with seed weight and germination rate and a significant positive association between seed weight and germination rate. The random forest model further emphasized the substantial impact of grain mold on sorghum germination. Therefore, selecting disease-resistant sorghum accessions with larger/heavier seeds could be useful for improving plant establishment and overall yield.

Supplementary Materials

The following supporting information can be downloaded at: https://www.mdpi.com/article/10.3390/crops4040045/s1, Table S1: Accessions from Ethiopia, Mali, and Sudan sorghum germplasm collections.

Author Contributions

Conceptualization: L.K.P., E.J.S.A. and C.W.M.; methodology: L.K.P., E.J.S.A., H.E.C., T.S.I. and J.L.; formal analysis: E.J.S.A., H.E.C. and L.K.P.; investigation, L.K.P., H.E.C., T.S.I., C.W.M. and J.L.; writing—original draft: L.K.P. and E.J.S.A.; writing—review and editing: L.K.P., E.J.S.A., H.E.C., T.S.I., J.L. and C.W.M.; data curation: L.K.P., E.J.S.A., H.E.C. and T.S.I. All authors have read and agreed to the published version of the manuscript.

Funding

This research (CRIS Project numbers 3091-22000-040-000-D, 8042-21220-258-00-D, and 6090-21000-062-000-D) was supported by the U.S. Department of Agricultural Research Service.

Data Availability Statement

The dataset associated with this paper will be made available upon reasonable request from the corresponding author.

Acknowledgments

We would like to extend our gratitude to Savanna Martinez, Coumba Fall, and Saradha Erattaimuthu for their technical assistance. USDA is an equal opportunity provider and employer.

Conflicts of Interest

The authors declare no conflicts of interest.

References

  1. Frederiksen, R.; Odvody, G. Compendium of Sorghum Diseases, 2nd ed.; American Phytopathological Society (APS Press): St. Paul, MN, USA, 2000; ISBN 978-0-89054-240-8. [Google Scholar]
  2. Abreha, K.B.; Ortiz, R.; Carlsson, A.S.; Geleta, M. Understanding the sorghum–Colletotrichum sublineola interactions for enhanced host resistance. Front. Plant Sci. 2021, 12, 641969. [Google Scholar] [CrossRef]
  3. Khalid, W.; Ali, A.; Arshad, M.S.; Afzal, F.; Akram, R.; Siddeeg, A.; Kousar, S.; Rahim, M.A.; Aziz, A.; Maqbool, Z. Nutrients and bioactive compounds of Sorghum bicolor L. used to prepare functional foods: A review on the efficacy against different chronic disorders. Int. J. Food Prop. 2022, 25, 1045–1062. [Google Scholar] [CrossRef]
  4. Sirany, T.; Tadele, E.; Aregahegn, H.; Wale, D. Economic potentials and use dynamics of sorghum food system in Ethiopia: Its implications to resolve food deficit. Adv. Agric. 2022, 2022, 4580643. [Google Scholar] [CrossRef]
  5. Fall, R.; Cissé, M.; Sarr, F.; Kane, A.; Diatta, C.; Diouf, M. Production and use sorghum: A literature review. J. Nutr. Health Food Sci. 2016, 4, 1–4. [Google Scholar] [CrossRef]
  6. Mundia, C.W.; Secchi, S.; Akamani, K.; Wang, G. A regional comparison of factors affecting global sorghum production: The case of North America, Asia and Africa’s Sahel. Sustainability 2019, 11, 2135. [Google Scholar] [CrossRef]
  7. Upadhyaya, H.D.; Reddy, K.N.; Vetriventhan, M.; Ahmed, M.I.; Krishna, G.M.; Reddy, M.T.; Singh, S.K. Sorghum germplasm from West and Central Africa maintained in the ICRISAT genebank: Status, gaps, and diversity. Crop J. 2017, 5, 518–532. [Google Scholar] [CrossRef]
  8. Hossain, M.S.; Islam, M.N.; Rahman, M.M.; Mostofa, M.G.; Khan, M.A.R. Sorghum: A prospective crop for climatic vulnerability, food and nutritional security. J. Agri. Food Res. 2022, 8, 100300. [Google Scholar] [CrossRef]
  9. Welderufael, S.; Abay, F.; Ayana, A.; Amede, T. Genetic diversity, correlation and genotype × yield × trait (GYT) analysis of grain yield and nutritional quality traits in sorghum (Sorghum bicolor [L.] Moench) genotypes in Tigray, northern Ethiopia. Discov. Agric. 2024, 2, 4. [Google Scholar] [CrossRef]
  10. Chala, A.; Brurberg, M.B.; Tronsmo, A.M. Incidence and severity of sorghum anthracnose in Ethiopia. Plant Pathol. J. 2010, 9, 23–30. [Google Scholar] [CrossRef]
  11. Sharma, R.; Rao, V.P.; Upadhyaya, H.D.; Reddy, V.G.; Thakur, R.P. Resistance to Grain Mold and Downy Mildew in a Mini-Core Collection of Sorghum Sermplasm. Plant Dis. 2010, 94, 439–444. [Google Scholar] [CrossRef]
  12. Ackerman, A.; Wenndt, A.; Boyles, R. The Sorghum Grain Mold Disease Complex: Pathogens, Host Responses, and the Bioactive Metabolites at Play. Front. Plant Sci. 2021, 12, 660171. [Google Scholar] [CrossRef] [PubMed]
  13. Somantri, S.; Somantri, R.U. A bibliometric analysis of sorghum disease research using VOS viewer. AIP Conf. Proc. 2024, 2957, 090003. [Google Scholar] [CrossRef]
  14. Pande, S.; Harikrishnan, R.; Alegbejo, M.; Mughogho, L.; Karunakar, R.; Ajayi, O. Prevalence of sorghum diseases in Nigeria. Int. J. Pest. Manag. 1993, 39, 297–303. [Google Scholar] [CrossRef]
  15. Ngugi, K.; King, B.; Abayo, O.; Reddy, R. Prevalence, incidence and severity of sorghum diseases in Western Kenya. J. Plant Dis. 2002, 86, 65–70. [Google Scholar] [CrossRef] [PubMed]
  16. Mims, C.W.; Vaillancourt, L.J. Ultrastructural characterization of infection and colonization of maize leaves by Colletotrichum graminicola, and by a C. graminicola pathogenicity mutant. Phytopathology 2002, 92, 803–812. [Google Scholar] [CrossRef]
  17. Thakur, R.P.; Mathur, K. Anthracnose. In Compendium of Sorghum Diseases; Frederiksen, R.A., Odvody, G.N., Eds.; The American Phytopathological Society: St. Paul, MN, USA, 2000; pp. 10–12. [Google Scholar]
  18. Acharya, B.; O’Quinn, T.N.; Everman, W.; Mehl, H.L. Effectiveness of fungicides and their application timing for the management of sorghum foliar anthracnose in the mid-atlantic u.s. Plant Dis. 2019, 103, 2804–2811. [Google Scholar] [CrossRef]
  19. Waniska, R.D.; Venkatesha, R.T.; Chandrashekar, A.; Krishnaveni, S.; Bejosano, F.P.; Jeoung, J.; Jayaraj, J.; Muthukrishnan, S.; Liang, G.H. Antifungal Proteins and Other Mechanisms in the Control of Sorghum Stalk Rot and Grain Mold. J. Agric. Food Chem. 2001, 49, 4732–4742. [Google Scholar] [CrossRef]
  20. Cota, L.V.; Souza, A.G.C.; Costa, R.V.; Silva, D.D.; Lanza, F.E.; Aguiar, F.M.; Figueiredo, J.E.F. Quantification of yield losses caused by leaf anthracnose on sorghum in Brazil. J. Phytopathol. 2017, 165, 479–485. [Google Scholar] [CrossRef]
  21. Prom, L.K.; Cuevas, H.E.; Ahn, E.; Isakeit, T.; Magill, C. Response of sorghum accessions from three African countries to anthracnose, grain mould, and rust. Plant Pathol. J. 2022, 21, 12–23. [Google Scholar] [CrossRef]
  22. Koima, I.N.; Kilalo, D.C.; Orek, C.O.; Wagacha, J.M.; Nyaboga, E.N. Identification and Characterization of Colletotrichum Species Causing Sorghum Anthracnose in Kenya and Screening of Sorghum Germplasm for Resistance to Anthracnose. J. Fungi 2023, 9, 100. [Google Scholar] [CrossRef]
  23. Erpelding, J.E. Field Assessment of Anthracnose disease response for the Sorghum germplasm collection from the Mopti region. Am. J. Agri. Biol. Sci. 2010, 5, 363–369. [Google Scholar] [CrossRef]
  24. Mengistu, G.; Shimelis, H.; Laing, M.; Lule, D. Assessment of sorghum genetic resources of Ethiopia for anthracnose (Colletotrichum sublineolum Henn.) resistance and agronomic traits. J. Phytopathol. 2019, 167, 667–678. [Google Scholar] [CrossRef]
  25. Xu, J.; Qin, P.; Jiang, Y.; Hu, L.; Liu, K.; Xu, X. Evaluation of sorghum germplasm resistance to anthracnose by Colletotrichum sublineolum in China. Crop Prot. 2020, 134, 105173. [Google Scholar] [CrossRef]
  26. Chen, S.; Zhao, Z.; Liu, X.; Li, K.; Arif, M.; Zhang, B.; Dong, L.; Wang, R.; Ren, M.; Xie, X. Response and disease resistance evaluation of sorghum seedlings under anthracnose stress. Sci. Rep. 2024, 14, 21978. [Google Scholar] [CrossRef]
  27. Erpelding, J.E. Inheritance of anthracnose resistance for the sorghum cultivar redlan. Plant Pathol. J. 2007, 6, 187–190. [Google Scholar] [CrossRef]
  28. Mehta, P.; Wiltse, C.; Rooney, W.; Collins, S.; Frederiksen, R.; Hess, D.; Chisi, M.; TeBeest, D.O. Classification and inheritance of genetic resistance to anthracnose in Sorghum Field. Crops Res. 2005, 93, 1–9. [Google Scholar] [CrossRef]
  29. Bandyopadhyay, R.; Chandrashekar, A. Biology and management of sorghum grain mold. In Proceedings of the Consultative Group Meeting on Technical and Institutional Options for Sorghum Grain Mold Management, Patancheru, India, 18–19 May 2000; Chandrashekar, A., Bandyopadhyay, R., Hall, A.J., Eds.; International Crops Research Institute for the Semi-Arid Tropics: Patancheru, India, 2000; p. 1. [Google Scholar]
  30. Little, C.R.; Perumal, R.; Tesso, T.; Prom, L.K.; Odvody, G.N.; Magill, C.W. Sorghum pathology and biotechnology—A fungal disease perspective: Part I. grain mold, head smut, and ergot. Eur. J. Plant Sci. Biotechnol. 2012, 6, 10–30. [Google Scholar]
  31. Singh, S.D.; Bandyopadhyay, R. Grain Mold. In Compendium of Sorghum Diseases; Frederiksen, R.A., Odvody, G.N., Eds.; The American Phytopathological Society: St. Paul, MN, USA, 2000; pp. 38–40. [Google Scholar]
  32. Navi, S.S.; Bandyopadhyay, R.; Reddy, R.K.; Thakur, R.P.; Yang, X.B. Effects of wetness duration and grain development stages on sorghum grain mold infection. Plant Dis. 2005, 89, 872–878. [Google Scholar] [CrossRef]
  33. Das, I.K.; Aruna, C.; Tonapi, V.A. Sorghum grain mold. In ICAR-Indian Institute of Millet Research, Hyderrabad, India; ICAR: Hyderabad, India, 2020; 86p, ISBN 81-89335-93-6. [Google Scholar]
  34. Prom, L. The Effects of Fusarium thapsinum, Curvularia lunata, and Their Combination on Sorghum Germination and Seed Mycoflora. J. New Seeds 2004, 6, 39–49. [Google Scholar] [CrossRef]
  35. Thakur, R.P.; Rao, V.P.; Reddy, B.V.S.; Reddy, S.P. Grain mold. In Screening Techniques for Sorghum Diseases; Thakur, R.P., Reddy, B.V.S., Mathur, K., Eds.; Bull. 76; ICRISAT: Patancheru, India, 2007; pp. 5–14. [Google Scholar]
  36. Ibrahim, O.E.; Nyquist, W.E.; Axtell, J.D. Quantitative inheritance and correlations of agronomic and grain quality traits of sorghum. Crop Sci. 1985, 25, 649–654. [Google Scholar] [CrossRef]
  37. Siame, B.A.; Mpuchane, S.F.; Gashe, B.A.; Allotey, J.; Teffera, G. Occurrence of aflatoxins, fumonisin B1, and zearalenone in foods and feeds in Botswana. J. Food Prot. 1998, 61, 1670–1673. [Google Scholar] [CrossRef] [PubMed]
  38. Leslie, J.F.; Zeller, K.A.; Lamprecht, S.C.; Rheeder, J.P.; Marasas, W.F.O. Toxicity, pathogenicity, and genetic differentiation of five species of Fusarium from sorghum and millet. Phytopathology 2005, 95, 275–283. [Google Scholar] [CrossRef] [PubMed]
  39. Audilakshmi, S.; Stenhouse, J.W.; Reddy, T.P. Genetic analysis of grain mold resistance in white seed sorghum genotypes. Euphytica 2005, 145, 95–101. [Google Scholar] [CrossRef]
  40. Mpofu, L.T.; McLaren, N.W. Ergosterol concentration and variability in genotype-by-pathogen interaction for grain mold resistance in sorghum. Planta 2014, 240, 239–250. [Google Scholar] [CrossRef]
  41. Aruna, C.; Das, I.K.; Reddy, P.S.; Ghorade, R.B.; Gulhane, A.R.; Kalpande, V.V.; Kajjidoni, S.T.; Hanamaratti, N.G.; Chattannavar, S.N.; Mehtre, S.; et al. Development of sorghum genotypes for improved yield and resistance to grain mold using population breeding approach. Front. Plant Sci. 2021, 12, 687332. [Google Scholar] [CrossRef] [PubMed]
  42. Tayea, W.; Dejene, M.; Ayalew, A.; Chala, A. Evaluation of sorghum genotypes for their reaction to major grain molds and mycotoxin-producing fungi in two climates of Ethiopia. Isr. J. Plant Sci. 2022, 69, 87–89. [Google Scholar] [CrossRef]
  43. Nida, H.; Girma, G.; Mekonen, M.; Lee, S.; Seyoum, A.; Salegn, K.D.; Tadesse, T.; Ayana, G.; Senbetay, T.; Tesso, T.; et al. Identification of sorghum grain mold resistance loci through genome wide association mapping. J. Cereal Sci. 2019, 85, 295–304. [Google Scholar] [CrossRef]
  44. Olatoye, M.O.; Hu, Z.; Morris, G.P. Genome-wide mapping and prediction of plant architecture in a sorghum nested association mapping population. Plant Genome 2020, 13, e20038. [Google Scholar] [CrossRef]
  45. Gichile, H. Review on sorghum grain mold and its sustainable management methods through host resistance. J. Agric. Res. Advs. 2023, 5, 33–39. [Google Scholar]
  46. Birhanu, C.; Girma, G.; Mekbib, F.; Nida, H.; Tirfessa, A.; Lule, D.; Bekeko, Z.; Ayana, G.; Bejiga, T.; Bedada, G.; et al. Exploring the genetic basis of anthracnose resistance in Ethiopian sorghum through a genome-wide association study. BMC Genom. 2024, 25, 677. [Google Scholar] [CrossRef]
  47. Rana, M.; Singh, Y.; Srivastava, D.; Srivastava, S. Effect of weather parameters on the severity of sorghum anthracnose. Environ. Ecology 2021, 39, 1236–1241. [Google Scholar]
  48. Morris, G.P.; Ramu, P.; Deshpande, S.P.; Hash, C.T.; Shah, T.; Upadhyaya, H.D.; Riera-Lizarazu, O.; Brown, P.J.; Acharya, C.B.; Mitchell, S.E.; et al. Population genomic and genome-wide association studies of agroclimatic traits in sorghum. Proc. Natl. Acad. Sci. USA 2012, 110, 453–458. [Google Scholar] [CrossRef]
  49. Rhodes, D.H.; Hoffmann, L.; Rooney, W.L.; Herald, T.J.; Bean, S.; Boyles, R.; Brenton, Z.W.; Kresovich, S. Genetic architecture of kernel composition in global sorghum germplasm. BMC Genom. 2017, 18, 1–8. [Google Scholar] [CrossRef]
  50. Zhou, Y.; Srinivasan, S.; Mirnezami, S.V.; Kusmec, A.; Fu, Q.; Attigala, L.; Fernandez, M.G.S.; Ganapathysubramanian, B.; Schnable, P.S. Semiautomated Feature Extraction from RGB Images for Sorghum Panicle Architecture GWAS. Plant Physiol. 2019, 179, 24–37. [Google Scholar] [CrossRef] [PubMed]
  51. Girma, G.; Nida, H.; Seyoum, A.; Mekonen, M.; Nega, A.; Lule, D.; Mengiste, T. A large-scale genome-wide association analyses of Ethiopian sorghum landrace collection reveal loci associated with important traits. Front. Plant Sci. 2019, 10, 691. [Google Scholar] [CrossRef] [PubMed]
  52. Mariscal-Amaro, L.A.; Héctor, E.; Villaseñor-Mir, H.E.; Solís-Moya, E.; Hortelano-Santa Rosa, R.; Martínez-Cruz, E. Effect of fungicides on agronomic traits, yield and leaf blights in rainfed wheat in Mexico. Rev. Fitotec. Mex. 2020, 43, 71–78. [Google Scholar]
  53. Ribeiro, N.D.; Maziero, S.M. Environmental variability in indirect selection for grain yield in common bean lines. Sci. Agric. 2023, 80, e20220082. [Google Scholar] [CrossRef]
  54. Laidig, F.; Feike, T.; Macholdt, J.; Miedaner, T.; Rentel, D.; Piepho, H.P. Yield Reduction Due to Diseases and Lodging and Impact of Input Intensity on Yield in Variety Trials in Five Cereal Crops. Euphytica 2022, 218, 150. [Google Scholar] [CrossRef]
  55. Dendi, A.; Khan, M.A.; Mir, R.R.; Bhat, M.A.; Wani, F.J.; Bhat, M.A. Trait phenotyping and Inheritance of leaf blight resistance in wheat (Triticum aestivum L.) under temperate conditions of Kashmir valley. J. Cereal Sci. 2023, 15, 202–211. [Google Scholar] [CrossRef]
  56. Li, G.M.; Liu, P.; Zhao, J.H.; Su, L.Y.N.; Zhao, M.Y.; Jiang, Z.J.; Zhao, Y.; Yang, X.P. Correlation of microbiomes in “plant-insect-soil” ecosystem. Front. Microbiol. 2023, 14, 1088532. [Google Scholar] [CrossRef]
  57. Porch, T.G.; Valentin, S.; Estevez de Jensen, C.; Beaver, J.S. Identification of soil-borne pathogens in a common bean root rot nursery in Isabela, Puerto Rico. J. Agric. Univ. Puerto Rico 2014, 98, 1–14. [Google Scholar] [CrossRef]
  58. Prom, L.; Perumal, R.; Erpelding, J.; Isakeit, T.; Montes, N.; Magill, C. A pictorial technique for mass screening of sorghum germplasm for anthracnose (Colletotrichum sublineolum) resistance. Open Agric. 2009, 3, 20–25. [Google Scholar] [CrossRef]
  59. Prom, L.K.; Ahn, E.; Isakeit, T.; Magill, C. Correlations among grain mold severity, seed weight, and germination rate of sorghum association panel lines inoculated with Alternaria alternata, Fusarium thapsinum, and Curvularia lunata. J. Agric. Crops 2022, 8, 7–11. [Google Scholar] [CrossRef]
  60. Hou, J.; Romo, J.T. Seed weight and germination time affect growth of two shrubs. J. Range Manag. 1998, 51, 699–703. [Google Scholar] [CrossRef]
  61. Mao, P.; Guo, L.; Gao, Y.; Qi, L.; Cao, B. Effects of seed size and sand burial on germination and early growth of seedlings for coastal Pinus thunbergii Parl. in the Northern Shandong Peninsula, China. Forests 2019, 10, 281. [Google Scholar] [CrossRef]
  62. Gupta, K.; Mandal, S.M.; Chakraborty, D. Seed Size Variation: Influence on Germination and Subsequent Seedling Performance in Hyptis suaveolens (Lamiaceae). Res. J. Seed Sci. 2008, 1, 26–33. [Google Scholar] [CrossRef]
  63. McKersie, B.D.; Tomes, D.T.; Yamamoto, S. Effect of seed size on germination, seedling vigor, electrolyte leakage, and establishment of Bird’s- Foot Trefoil [Lotus corniculatus (L.)]. Can. J. Plant Sci. 1981, 61, 337–343. [Google Scholar] [CrossRef]
  64. Zhao, J.; Mantilla Perez, M.B.; Hu, J.; Salas Fernandez, M.G. Genome-wide association study for nine plant architecture traits in sorghum. Plant Genome 2016, 9, 1–14. [Google Scholar] [CrossRef]
  65. Adepoju, A.F.; Adenuga, O.O.; Dada, K.E.; Odey, C.F.; Balogun, S.T.; Nitsa, M.B. Association and interrelationship of yield and agronomic characters in coffee (Coffea sp L). J. Plant Breed. Crop Sci. 2020, 12, 299–309. [Google Scholar]
  66. Garud, T.B.; Ismail, S.; Shinde, B.M. Effect of two mold-causing fungi on germination of sorghum seed. Intern. Sorghum and Millet Newl. 2000, 41, 54. [Google Scholar]
  67. Gali, K.K.; Sackville, A.; Tafesse, E.G.; Lachagari, V.; McPhee, K.; Hybl, M.; Miki’c, A.; Smýkal, P.; McGee, R.; Burstin, J.; et al. Genome-wide association mapping for agronomic and seed quality traits of field pea (Pisum sativum L.). Front. Plant Sci. 2019, 10, 1538. [Google Scholar] [CrossRef] [PubMed]
  68. Tao, Y.; Zhao, X.; Wang, X.; Hathorn, A.; Hunt, C.; Cruickshank, A.W.; van Oosterom, E.J.; Godwin, I.D.; Mace, E.S.; Jordan, D.R. Large-scale GWAS in sorghum reveals common genetic control of grain size among cereals. Plant Biotechnol. J. 2020, 18, 1093–1105. [Google Scholar] [CrossRef] [PubMed]
  69. Czembor, J.H.; Czembor, E. Genome-Wide Association Study of Agronomic Traits in European Spring Barley from Polish Gene Bank. Agronomy 2022, 12, 2135. [Google Scholar] [CrossRef]
  70. Dikshit, H.K.; Manjunatha, P.B.; Aski, M.S.; Mishra, G.P.; Gupta, S.; Devate, N.B.; Singh, A.; Bansal, R.; Kumar, S.; Nair, R.M. Genome-wide association studies for phenological and agronomic traits in mungbean (Vigna radiata L. Wilczek). Front. Plant Sci. 2023, 14, 1209288. [Google Scholar] [CrossRef]
  71. Contreras-Soto, R.I.; Mora, F.; de Oliveira, M.A.R.; Higashi, W.; Scapim, C.A.; Schuster, I. A genome-wide association study for agronomic traits in soybean using SNP markers and SNP-based haplotype analysis. PLoS ONE 2017, 12, e0171105. [Google Scholar] [CrossRef]
  72. Suruliandi, A.; Mariammal, G.; Raja, S.P. Crop Prediction Based on Soil and Environmental Characteristics Using Feature Selection Techniques. Math. Comput. Model. Dyn. Syst. 2021, 27, 117–140. [Google Scholar] [CrossRef]
  73. Hesami, M.; Naderi, R.; Tohidfar, M.; Yoosefzadeh-Najafabadi, M. Development of support vector machine-based model and comparative analysis with artificial neural network for modeling the plant tissue culture procedures: Effect of plant growth regulators on somatic embryogenesis of chrysanthemum, as a case study. Plant Methods 2020, 16, 112. [Google Scholar] [CrossRef]
  74. Biau, G.; Scornet, E. A random forest guided tour. Test 2016, 25, 197–227. [Google Scholar] [CrossRef]
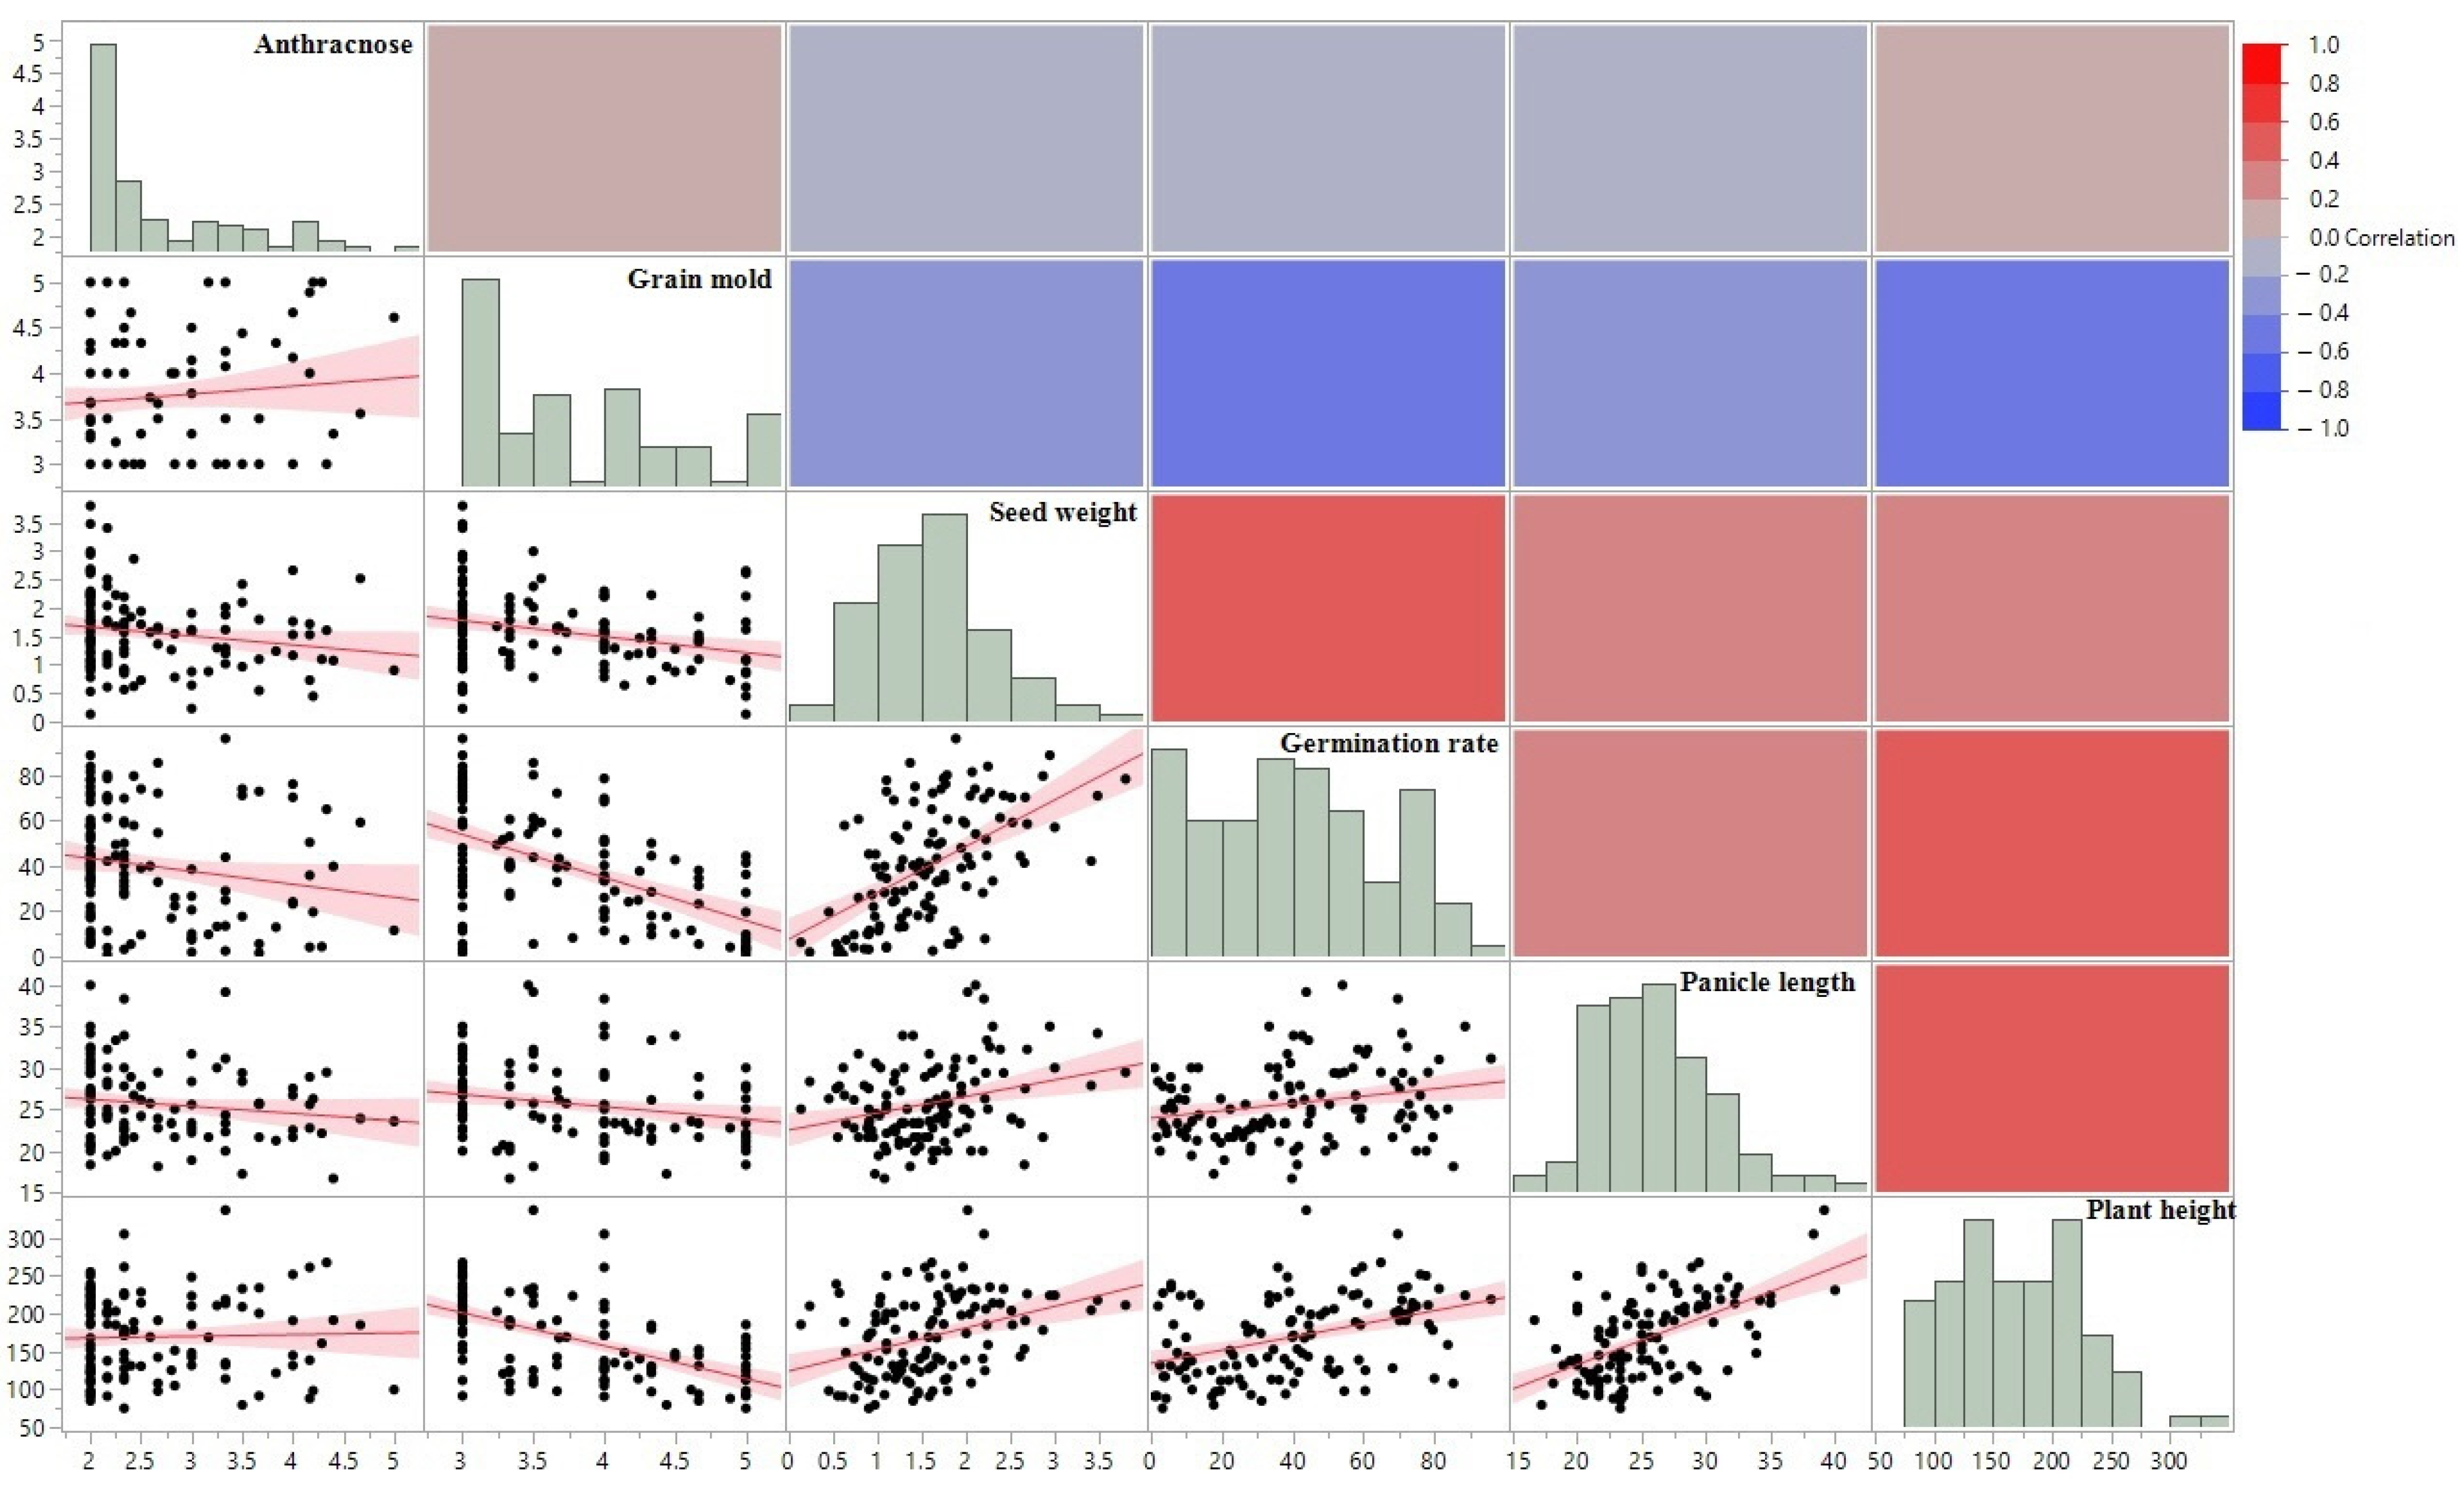
Figure 1. Visualized correlations between the six sorghum traits. Scatter plots visualize the correlations among anthracnose score, germination rate, grain mold score, plant height, panicle length, and seed weight. The correlations are visually depicted further using fit lines and a heatmap.
Crops 04 00045 g001
Figure 2. Interaction profile plots illustrating anthracnose scores. The presence of interaction between two traits is indicated when the red and blue lines deviate from parallel. Notably, statistically significant interaction is highlighted within the red boxes, specifically between the traits of germination rate and panicle length.
Crops 04 00045 g002
Figure 3. The principal component analysis of six traits in sorghum. The plot displays PC1 vs. PC2.
Crops 04 00045 g003
Figure 4. Principal Component Analysis of the tested sorghum accessions. (a) Distribution of sorghum accessions based on six quantitative traits and (b) geographic origin of sorghum accessions.
Crops 04 00045 g004
Figure 5. The partial contributions of variables to six traits. The partial contributions of variables to the six traits among the sorghum germplasms are shown in the plot. Each trait’s contribution toward PC1 is highlighted in red, PC2 in green, and PC3 in blue.
Crops 04 00045 g005
Figure 6. K-means clustering was performed on all six phenotypic traits. Although three clusters were shown through a 3D biplot, they lack clear separation, indicating a high degree of overlap between the groups.
Crops 04 00045 g006
Figure 7. K-means clustering of anthracnose and grain mold scoring data. K-means clustering with the two disease scores identified that seven clusters were optimal for the six input traits.
Crops 04 00045 g007
Figure 8. Predicted relationships among the traits to germination rate. (a) Prediction plot of training set and validation set. (b) Predicted profiler illustrating the non-linear relationships between germination rate and the other traits. (c) Surface plot visualizing the complex interaction between germination rate, anthracnose, and grain mold score.
Crops 04 00045 g008
Figure 9. Predicted relationships among the traits to germination rate based on random forest. Prediction plots of the training set and validation sets are shown.
Crops 04 00045 g009
Table 1. Monthly average air temperature (°C) and total rainfall (mm) during the 2019–2020 period.
Year/Month 123456789101112
2019Air temperature22.722.9- a24.424.725.826.126.026.225.425.324.3
Total rainfall52.346.2-67.3226.160.530.5108.7189.5133.17.168.8
2020Air temperature23.423.623.424.825.326.626.326.525.725.424.323.4
Total rainfall157.768.8182.971.194.214.793.097.551.323.4182.925.9
a Missing data.
Table 2. Detailed correlations in the six traits. Significant positive correlations are highlighted in green, while significant negative correlations are highlighted in red.
TraitsSpearman ρProb > |ρ|
Anthracnose–Grain mold0.07080.4311
Anthracnose–Seed weight−0.19030.0328
Anthracnose–Germination rate−0.20670.0202
Anthracnose–Panicle length−0.11130.2145
Anthracnose–Plant height0.03560.6926
Germination rate–Grain mold−0.5159<0.0001
Germination rate–Plant height0.4031<0.0001
Germination rate–Panicle length0.22740.0105
Germination rate–Seed weight0.5615<0.0001
Grain mold–Plant height−0.6113<0.0001
Grain mold–Panicle length−0.27010.0022
Grain mold–Seed weight−0.2890.001
Plant height–Seed weight0.389<0.0001
Plant height–Panicle length0.525<0.0001
Panicle length–Seed weight0.25750.0036
Table 3. Cluster Analysis of Six Sorghum Traits. The analysis revealed two distinct clusters, with anthracnose scores being distinctly separated.
ClusterMembersR-Square with Its Own ClusterR-Square with the Next Closest1-R-Square Ratio
1Plant height0.6530.0010.348
Germination rate0.5860.030.427
Grain mold0.560.0090.443
Seed weight0.4630.0320.555
Panicle length0.3720.020.64
2Anthracnose10.0210
Table 4. Feature importance in the random forest model. Importance is calculated by the number of splits and the sum of squares. The ‘Portion’ column represents the relative contribution of each trait to the overall model, summing to 1.0.
TermNumber of SplitsSum of SquaresImportancePortion
Grain mold616120,944.23Crops 04 00045 i0010.3396
Accession1447108,634.499Crops 04 00045 i0020.3051
Seed weight108664,907.3179Crops 04 00045 i0030.1823
Panicle height78936,383.6986Crops 04 00045 i0040.1022
Panicle length63913,592.7099Crops 04 00045 i0050.0382
Anthracnose66511,649.3571Crops 04 00045 i0060.0327
Disclaimer/Publisher’s Note: The statements, opinions and data contained in all publications are solely those of the individual author(s) and contributor(s) and not of MDPI and/or the editor(s). MDPI and/or the editor(s) disclaim responsibility for any injury to people or property resulting from any ideas, methods, instructions or products referred to in the content.