1. Introduction
Healthy, high-quality seeds of plant varieties are the basis of sustainable agriculture [
1]. Plant varieties with improved traits ensure high productivity, and, thereby, food and nutritional security. The registration of new plant varieties is a crucial step in obtaining market authorization for agricultural crops and is an essential prerequisite for the marketing of seeds [
2]. In the European Union (EU), the registration process comprises tests for distinctness, uniformity, and stability (DUS), and, for agricultural crops, value for cultivation and use (VCU) [
2,
3]. Varieties are listed in both national official catalogues and the Common Catalogue of Varieties maintained by the European Commission [
4].
The Convention of the International Union for the Protection of New Varieties of Plants (UPOV) stipulates the conditions for obtaining Plant Breeders’ Rights (PBR) [
5]. According to this Convention, protection can only be granted when a new variety is distinct from any other variety of common knowledge, sufficiently uniform, and stable. Variety protection by PBR supports variety development by giving breeders exclusive intellectual property (IP) rights for new varieties of plants. In the EU, the Community Plant Variety Office (CPVO) manages the Community Plant Variety Rights (CPVR) system, which ensures IP rights in all EU member states [
6,
7]. On behalf of the CPVO, the administrative council entrusts examination offices (EOs) of the Member States with the technical examination [
8]. This protection is granted upon successful application, subject to a fee, and—for most species—remains valid for 25 years. The process includes testing for DUS [
9], for which UPOV and the CPVO provide test guidelines [
10] and technical protocols [
11]. DUS experts are staff of the EOs, who typically work on specific species and decide on the DUS of candidate varieties based on these guidelines and protocols. Candidate varieties are new varieties that applicants submit for national listing or Plant Breeders’ Rights and that must undergo a DUS test. DUS tests typically span two years and take place at one or two locations and are based upon the evaluation of various mainly botanical–morphological plant and grain characteristics, as outlined by UPOV and CPVO [
10,
11]. DUS testing results in a Final Report on distinctness, uniformity, and stability and a variety description. Each candidate variety must be compared with the existing varieties of common knowledge, including varieties from the official lists [
4], and with those varieties that have been granted Community Plant Variety Rights (CPVR) [
12]. In the growing trials, side-by-side comparisons must be established if the similarity of a candidate variety and varieties of common knowledge is anticipated based on the Technical Questionnaire provided by the breeders or on the observations made during the first growing cycle [
9].
Due to the growing number of varieties of common knowledge, DUS trials are becoming increasingly challenging in terms of the money and time requirement. Strategies to overcome these challenges have been sought and employed [
13]. A commonly used approach to establish distinctness is the GAIA method that calculates pairwise phenotypic distances based on DUS characteristics [
14]. While the GAIA method has improved phenotypic comparisons, its use is neither harmonized nor mandatory. Its reliance on phenotypic data limits its ability to fully account for genetic variation. In contrast, molecular data provide fast and complete information on the varieties, including information on the candidate varieties that is usually not available at this early stage of testing. Thus, the integration of molecular data into DUS testing is expected to enhance the quality and overall efficiency of DUS testing. Both UPOV and CPVO have established working groups to elaborate on the use of techniques that facilitate the integration of molecular data into DUS testing [
15,
16]. Their aims are to explore DNA profiling using molecular markers and to coordinate the development and harmonization of approaches. In addition, the CPVO regularly co-funds projects with this objective [
15].
Molecular markers are DNA sequences with known physical locations on chromosomes. They serve as points of variation to identify individuals. Single-nucleotide polymorphism (SNP) markers have become increasingly important. SNPs are single base-pair changes in the genome sequence to be used for variety identification. They are analyzed using various detection techniques [
17], such as SNP microarrays. Currently, molecular data may only be used as supporting information in DUS testing [
8] and as described in the approved models [
18,
19]. These models include the use of molecular markers for the assessment of specific characteristics (e.g., disease or herbicide resistances), and for the selection of similar varieties of common knowledge. This selection (often referred to as “management of the reference collection”) can either combine phenotypic and molecular distances (f.i., in maize, lettuce, wheat, and barley), or rely only on molecular data with the application of a genetic similarity threshold (f.i., in French bean and potato) [
20].
The growing numbers of varieties call for solutions regarding the management of reference collections and the planning of DUS field trials. Field trials are influenced by environmental factors and need a lot of resources, including seed, for implementation. Molecular data have proven to support the work of DUS experts that is currently based on phenotypic observations, but their integration in DUS testing is often limited by technical complexity and infrastructure demands. Moreover, DUS experts are not necessarily familiar with the interpretation of molecular data. DurdusTools addresses these challenges as an easily accessible and innovative online tool that DUS experts designed, tailor-made to their needs. The aim is to integrate molecular data into DUS testing in durum wheat (Triticum turgidum L. subsp. durum (Desf.) Husn.). The work is based on two CPVO-co-funded projects, DURDUS and DURDUStools (2018–2023). DURDUS aimed at evaluating the use of a commercially available SNP wheat microarray for investigating the genetic distance (GD) calculation to identify similar varieties to compare to the candidate variety under investigation. The follow-up project made the results readily available to DUS experts providing an easy-to-use online tool outputting tailor-made information.
DurdusTools was developed based on field trials according to DUS testing and investigated current varieties and candidate varieties. During the development work, continuous feedback from the experts ensured that their requirements were fully met. For instance, the DurdusTools approach neither requires laboratory infrastructure nor molecular expert knowledge. Thus, DUS experts can take advantage of using molecular data without specific prerequisites. Genotyping is fast and economic compared to phenotyping in field trials. A constantly updated molecular database provides DUS experts with previously unavailable information on the candidate varieties under examination in other EOs. The GD calculation is not influenced by environmental factors as typically encountered in phenotypical assessments. The GD complements the phenotyping results to select similar varieties for side-by-side comparisons in the second year of DUS testing. While not completely replacing field trials, DurdusTools supports the planning of these trials and the management of reference collections.
2. Materials and Methods
2.1. Plant Material and Molecular Database
In total, seeds of 893 different durum wheat varieties and candidate varieties were collected for genotyping. The seeds were obtained from the CPVO-entrusted examination offices in Austria (AT), France (FR), Hungary (HU), Italy (IT), and Spain (ES). Most of the genotypes were obtained from IT (37%), followed by FR (20%), ES (18%), AT (10%), and HU (5%). Furthermore, varieties that were unavailable in the inventories of the entrusted EOs were obtained from EOs of the maintaining countries (Others). Then, 651 of all genotypes were documented as registered varieties (V), 163 as non-varieties (nV), meaning that the candidate variety under examination was not registered as variety, and 79 as candidate varieties (C) (
Table 1).
The completeness of the molecular database for all varieties of common knowledge was checked in 2018 and 2021. For this, all durum wheat varieties that have been granted CPVR [
12], and/or were listed in the Common Catalogue of the European Commission [
4] were identified. In 2018, 22 out of 522 varieties (4%), and, in 2021, 56 out of 580 varieties (10%) of common knowledge were missing, indicating almost completeness of the molecular database. The molecular database is updated annually to meet the specification that a candidate variety must be distinct from any other variety of common knowledge [
5].
2.2. Variety File
The variety file is an integral part of DurdusTools and contains selected information of all the 893 durum wheat varieties and candidate varieties. This file is directly accessible for the users of the tool and updated regularly. To minimize the effort for keeping the variety file updated, the information columns were developed together with the DUS experts. They include Year of genotyping, Denomination, Breeder’s reference, Responsible EO, Status, Year of registration, Name of Breeder, and Comment. The variety file can be filtered by using a search textbox. The download features comprise complete variety file download, filtered variety file download, or only the download of varieties that the user is responsible for. The column “Responsible EO” indicates which entrusted EO has sent the genotype to the coordinator and is responsible for keeping the information up to date. The most important requirement is to update the status of the varieties and candidate varieties as candidate, registered or non-registered as described above. Data are updated with a modified variety file upload. Only users belonging to the responsible EO can change the variety information.
2.3. Genotyping
Genotyping was performed by SGS Institut Fresenius GmbH TraitGenetics Section, Gatersleben, Germany, in the following called the service provider, using a commercial wheat microarray. In contrast to wheat, durum wheat has no D genome; thus, the D genome markers cannot be scored. In this study, two Illumina Infinium SNP marker microarrays were used for collecting the genetic data, due to an add-on of 5000 markers by the service provider. Concretely, a 20 K SNP microarray (in 2018) and an updated 25 K SNP microarray [
21] were used (in 2019, 2020, 2021, and 2022;
Table 2). The 20 K SNP Illumina array had a good genome coverage and highly informative and genome-wide polymorphic loci. The 20 K wheat SNP microarray consisted of the 15 K wheat Illumina microarray designed by the service provider [
22], which was an optimized and reduced version of the 90 K array [
23], and a 5 K add-on array from various sources. The 25 K microarray contains most of the markers from the previous 20 K wheat microarray plus additional SNPs from the 135 K Axiom wheat microarray developed by the service provider, and some candidate markers for specific genes of breeding relevance. Add-ons to the service provider’s proprietary arrays are performed regularly to cover more or new variability in the customer material, to include new marker sources, and, finally, to extend the trait-specific marker set with newly published markers. While the 20 K microarray used the Infinium HD technology, the 25 K microarray was updated to the HTS and, finally, to the Infinium XT technology, reducing costs and hands-on time as the arrays now accommodate 96 samples (compared to 24 samples for HD and HTS technologies).
The service provider received 20 seeds per genotype in seed packages that were anonymized with an assigned code. The service included growing ten seeds per genotype, DNA extraction, DNA quality check, and subsequent genotypic analysis. The results of the genotyping process are presented as a genotype table in Excel format.
2.4. Data Curation and Quality Control
Based on the genotyped collection of durum wheat varieties, the most stable and reproducible SNP markers across different years and microarrays were determined. In addition, two defined control samples are included in each analysis as a quality control feature and to ensure the technical consistency of the data between years. These controls, managed by the service provider, involve maintaining the DNA over the years and conducting regular checks on the resulting genotype data for consistency and reproducibility. The genotyping data of these controls are stored in the service provider’s database and verified within and between each batch of samples analyzed. Technical consistency and reproducibility across years are furthermore ensured by genotyping defined varieties in each genetic analysis. This is standard for all microarray analyses in the service provider’s laboratory using commercial varieties, which are also checked against the database as described above for the durum wheat controls.
2.5. SNP Marker Selection
SNP marker selection was performed in the program R version 4.1.3 with the package adegenet version 2.1.8 [
24,
25]. From the initial 16,128 SNP markers that were functional in durum wheat both 20 K and 25 K microarrays, 3928 high-quality, polymorphic, and consistent SNP markers with high discriminatory power between the tested durum wheat lines were obtained based on several filter parameters (
Figure S1). First, a high discriminatory power of the SNP markers was ensured by a GenTrain Score > 0.4. The GenTrain Score (GTS) is a statistical score based on a clustering algorithm used by the Illumina GenCall software [
26]. SNP markers with a GTS below 0.4 tend to indicate more diffuse clusters or clusters that are very close to each other, increasing the likelihood that a sample will migrate into a neighboring cluster and, thus, be incorrectly genotyped.
Furthermore, the SNP markers were selected for functionality, missing values < 10%, and polymorphism rate (Minor Allele Frequency, MAF > 1%). To select the most stable and reproducible SNP markers across different years and microarrays, the following quality criteria were used: Minor Allele Frequency (MAF > 3%), Frequency of heterozygous genotypes (AB < 0.1), Call Frequency (CF > 0.9), and GenTrainScore (GTS > 0.2). Then, 879 SNP markers were excluded from the previous SNP marker selection (
Figure S1). A statistical analysis of the control samples analyzed in the service provider’s laboratory over many projects has shown that the marker sets selected with these thresholds had a very high reproducibility score of over 0.99 in the control samples while maintaining the necessary discriminatory power for the durum wheat genotypes.
The genome coverage of the selected SNPs was assessed using chromosome assignment information provided by the service provider, which was obtained by aligning the marker sequence against the latest version of the International Genome Sequencing Consortium (IWGSC) wheat genome sequence [
27].
2.6. Calculation of Genetic Distance (GD)
The genetic distance (GD) is calculated using the modified Roger’s distance (MRD) due to its suitable properties and successful use in similar studies [
28,
29,
30,
31,
32], including a maize study with reference to the UPOV model [
33]. The MRD calculation was automated by adapting the R script developed by the Beissinger lab [
34], using the sum of differences of allele counts for all markers. The method of pairwise deletion is used for the calculation of the GD for missing values (non-available values, NAs). As the number of SNP markers varies between each pairwise comparison, the final number of SNP markers that are used for the calculation of the GD between two varieties is indicated in the output of GD calculation (SNP markers used).
2.7. Setup of the GD Calculation Tool and GD Calculation Output
The online tool was programmed with the open-source programming language R [
24] and the R software package Shiny [
35]. It uses information from the molecular database and a variety file containing selected information on the varieties. The output is created by combining the GD calculation results and the information in the variety file through an assigned code. In the GD panel in DurdusTools, the user can download the results of the GD calculation, and may filter for specific GDs, individuals, or status before downloading. The output of the GD calculation tool is an Excel workbook with the result of the GD calculation for each individual (genotype) in a separate sheet. It contains the GDs, the number of SNP markers used in the pairwise calculation, and relevant information about the individual that has been used for the comparison. The individuals are sorted by their GDs, so that the most similar varieties are located at the top.
2.8. Data Security
The tool is hosted on a server to which incoming connections are restricted to website access only. Access to the server is managed through a whitelist, and only partners can access the tool. Password and login credentials are stored in an obscured, encrypted file. The login password is hashed. Hashed values are compared to validate the login and the password cannot be decrypted. The server is protected by standard security measures such as firewalls. No folders are accessible from the Internet. Important data, such as variety information and genotypic data, are stored in a database. For raw genotypic data, both SNP designations and variety names are further encrypted for added security.
2.9. Field Trials and Distinctness Evaluation
From 2018 to 2019 and from 2019 to 2020, field trials were conducted to evaluate and test the use of DurdusTools for DUS trials. The decisions on which varieties to include into the field trials were made based on their calculated GDs, considering only genotypes of the spring durum wheat type. Only varieties that are currently on the market were chosen. Establishment of the field trials, including plot size and field trial management, was according to the standard procedure for DUS field tests for spring durum wheat at each participating EO (AT, HU, IT, and ES). The same set of durum wheat variety pairs was sown in all trials.
From 2018 to 2019, 23 variety pairs were selected based on their GDs, with the aim to capture the whole genetic diversity present in the collection of durum wheat genotypes. Field trials with the selected varieties were established during autumn 2018 (in ES and IT) and spring 2019 (in HU and AT). From 2019 to 2020, 12 pairs were selected, and field trials were established during autumn 2019 (in ES and IT) and during spring 2020 (in AT). In the second trial season, no field trial was established in HU. The results in 2018–2019 had confirmed that the climatic conditions in Hungary, in particular, drought, are not suitable for growing spring type varieties.
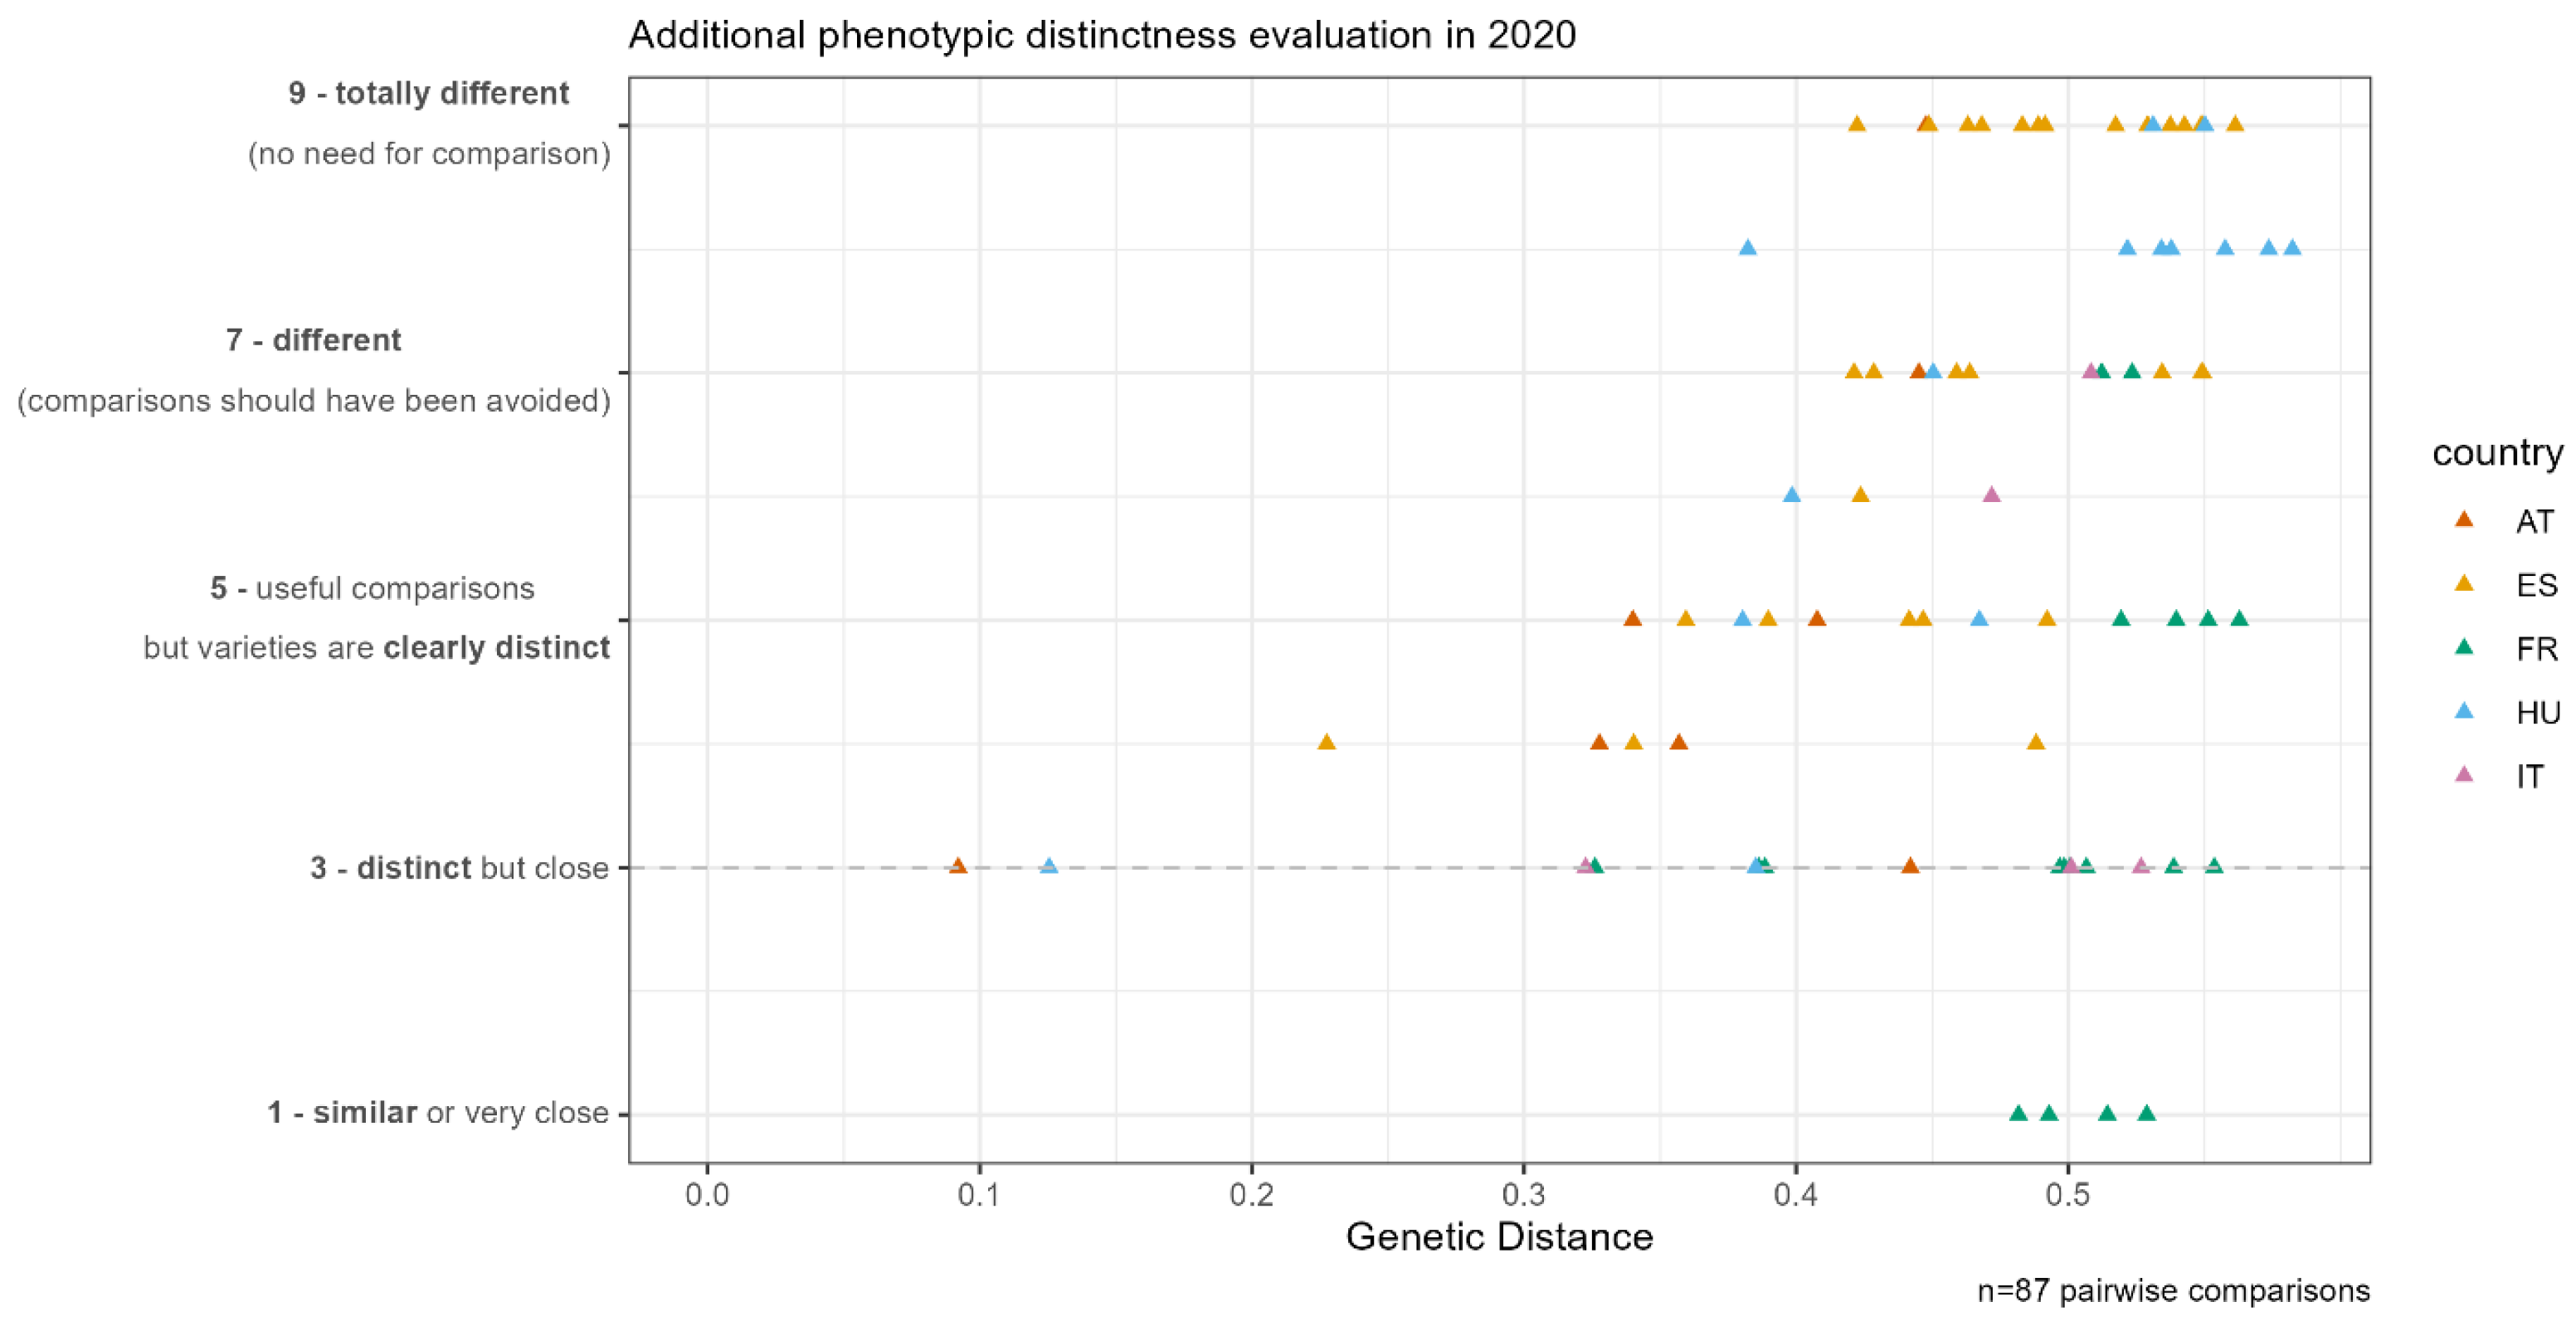
In addition to the field trials, the DUS experts evaluated the use of DurdusTools in routine DUS trials. The participating EOs investigated candidate varieties and similar varieties in 2019–2020. In total, 87 pairwise comparisons were made at all five participating EOs: 17 in AT, 31 in ES, 19 in FR, 5 in IT, and 15 in HU.
The in-field observations, complemented by the laboratory characteristics [
36], were scored according to a “Global note”. The Global note is a subjective observation of pairs of similar varieties and describes, on a scale, whether they are distinct or not. The scale is orientated on the usually used scales of characteristics defined in the Technical Protocols. Variation from 1 to 9 is used, for example, to describe an anthocyanin coloration from absent to very strong. When two varieties are described with a Global note of 7 to 9, the varieties are very clearly distinct, and a side-by-side comparison would not have been essential. According to this principle, the scale followed the “scale of similarity” as defined for maize [
18]: 1. The two varieties are similar or very close; 3. The two varieties are distinct but close; 5. The comparison was useful, but the varieties are clearly distinct; 7. The comparison should have been avoided because the varieties are very different; 9. The comparison should have been avoided because the varieties are totally different.
3. Results
3.1. SNP Marker Selection and Genetic Distance (GD) Calculation
The molecular database serves as a molecular reference collection of varieties and must allow for comparable data over the years. Thus, specific care had to be taken to avoid inconsistencies of the data potentially caused by different microarrays and technologies. After having selected the SNPs using standard quality parameters, the selection was refined based on the genotyped durum wheat collection as specified in detail in the Material and Methods section.
The final SNP selection consisted of 3928 high-quality, polymorphic, and consistent SNP markers with high discriminatory power. These markers were evenly distributed across the A and B genomes of durum wheat and all 14 chromosomes were well-represented (
Figure S2). Based on a selection threshold of 10% for missing values, we found that 3735 or 95% of the selected SNPs had less than 2% missing values, and 152 (4%) had no missing values.
The number of SNP markers used for the GD calculation varies between each pairwise comparison as the GD calculation is based on the pairwise deletion method, which was preferred over imputation to avoid potential bias. For the calculation of the GDs within the collection of 893 durum wheat genotypes, an average amount of 3864 (or 98%) of SNP markers was used. The minimum amount of SNP markers used for the calculation of the GD between two varieties was 2944 (75%) of SNP markers. The final number of SNPs used for the GD calculation is given in the output file to ensure quality and transparency.
The GD within the high-quality genotypic data collection of 893 durum wheat genotypes displayed a normal distribution with an average GD among pairs of 0.54 (minimum = 0.00, maximum = 0.68;
Figure S3); 4898 pairs or 1.3% had a GD less than 0.4.
3.2. Assigning a Global Note in Field Trials and Associating It with the GD
To check for a potential correlation between the GD of variety pairs and their overall difference in phenotype observed by DUS experts, field trials were designed and conducted in 2018–2019 and 2019–2020. The aim was to identify a potential threshold of distinctness combining molecular and phenotypic data. The same set of durum wheat variety pairs of the spring type was sown in all participating examination office (EOs, i.e., AT, HU, IT, and ES). As the results from 2018 to 2019 clearly showed that the climatic conditions, in particular, drought, in Hungary were not suitable for the spring type, the Hungarian EO did not participate in the 2019–2020 trials.
The varieties were selected based on their calculated GDs. In the years 2018 and 2019, the aim was to capture the whole genetic diversity in the collection of durum wheat genotypes. Of the 23 selected variety pairs, five pairs were in the range [0.0–0.1], two in the range [0.1–0.2], seven in the range [0.2–0.3], seven in the range [0.3–0.4], and two had a GD > 0.5. From 2019 to 2020, the aim was to refine the genetic threshold; thus, varieties with GDs within the range [0.2–0.45] were chosen. Of the 12 selected variety pairs, one pair had a GD of 0.23, two were in the range [0.30–0.35], two in the range [0.35–0.39], and seven in the range [0.40–0.45].
For the standardized phenotypic evaluation of field trials, a Global note (see Materials and Methods for details) was introduced. As the GAIA method is not mandatory and not harmonized between the different EOs, the Global note provided more uniform values than the GAIA method and ensured that the assessments were comparable across different EOs. In the field trials 2018–2019 and 2019–2020, the GD and the phenotypic distance recorded as a Global note were positively associated. From a total of 128 pairwise comparisons that were made at four EOs in two years of field trials, no pairs of varieties with GD > 0.35 were considered as similar or very close according to DUS-expert evaluations (
Figure 1).
The additional genotypic and phenotypic distance evaluation of 87 pairwise comparisons between candidate varieties and varieties that were under investigation in routine DUS trials in 2019–2020 at all EOs had GDs between 0.1 and 0.6 and Global notes between 1 and 9. Four pairs compared at the French EO were detected that had a GD higher than 0.35 (0.48–0.53) and were phenotypically similar or very close according to the French DUS expert evaluation (
Figure 2).
3.3. The GD Calculation Online Tool
With the aim of providing a user-friendly experience, the tool was developed in close collaboration with the DUS experts as the users of DurdusTools. The experts also contributed to the testing of the tool and were continuously asked to provide feedback that helped to improve the tool. The result is an easily accessible online tool that was designed according to the users’ needs. The tool can be accessed online via a link, which gives password-protected access only to DUS experts of entrusted EOs for durum wheat. After login, a toolbar with the following panels is available: Variety Management, Genetic Distances, User, and Information. The tool combines the information from the GD calculation, which uses the molecular database, with the information from the variety file. The content of the variety file was defined by the DUS experts. The aim was to keep the need for input low while sustaining a high informative value to enhance the immediate usability of the tool output. In the variety file, the information is organized in columns. A central component for structuring and organizing the database is the “Responsible EO” column. This attribute identifies the EO that submitted the genotype to the coordinator and in which the variety is listed. The “Responsible EO” must keep the variety information up to date. It starts with adding the identifier of a new candidate variety, which is the breeder’s reference. Most importantly, when the EO receives the DUS test results, the status of the candidate varieties must be changed to either “Variety (V)” if it is registered or “No variety (nV)” if it is not registered, and additional information such as the year of registration and the breeder should be added. The user can only change the information of the varieties for which he is responsible. The responsible EO is displayed for each user so that the EO can be easily contacted should clarification be needed.
The tool contains warning and notification functions to support automatic maintenance. For example, warnings are triggered in the event of duplicate denominations and outdated information on new candidate varieties. In the case of duplicate denominations, the responsible EOs receive a warning, and the issue must be resolved by choosing a reference sample. To avoid unforeseen disruptions of the database, the duplicates are kept in the molecular database but further excluded from the GD calculation (marked as “Excluded for genetic distance calculation”). Warnings are also issued when genotypes with a “C” status have not been updated two years post-entry. To resolve this, users need to update the status (V or nV) and provide the “Name of Breeder”, “Year of Registration”, and “Denomination” for the respective genotype.
To keep the database complete, the coordinator actively seeks the inclusion of missing reference varieties listed in the Common Catalogue [
4] from non-consortium countries. However, in specific cases, it may be difficult to obtain seeds for some varieties of common knowledge; thus, the aim is to achieve completeness to the largest possible extent but without exceeding the effort required for traditional DUS testing.
3.4. Defining a Molecular Threshold
Implementing a clear molecular threshold defining distinctness between two varieties before the first year of DUS trials emerges as the most efficient strategy for reducing the number of varieties in the fields and, thereby, the costs of the DUS trials. However, the implementation of such a threshold in the first year is limited not only by time constraints, but also by increasing the risk of excluding genetically different but phenotypically similar varieties, which, per definition, should be included for side-by-side comparisons.
While a clear threshold of 0.35 could be defined after the 2018–2019 and 2019–2020 field trials (
Figure 1), the additional assessment of the phenotypic distance in the 2019–2020 DUS trials showed that four pairs of varieties compared at the French EO had a large genetic distance but were phenotypically similar or very similar (
Figure 2). French DUS experts confirmed the need to see these pairs side-by-side in the field and that they are not to be eliminated from the field trials based on the GD.
The GD, along with phenotypic assessments, guides the selection of comparators for the upcoming year’s DUS trials. While a flexible GD threshold is maintained, a GD threshold of 0.35, with a safety margin up to 0.40, serves as general guidance. Notably, the specific application of this threshold varies among EOs, influenced by factors such as country specifics and the nature of the material under investigation.
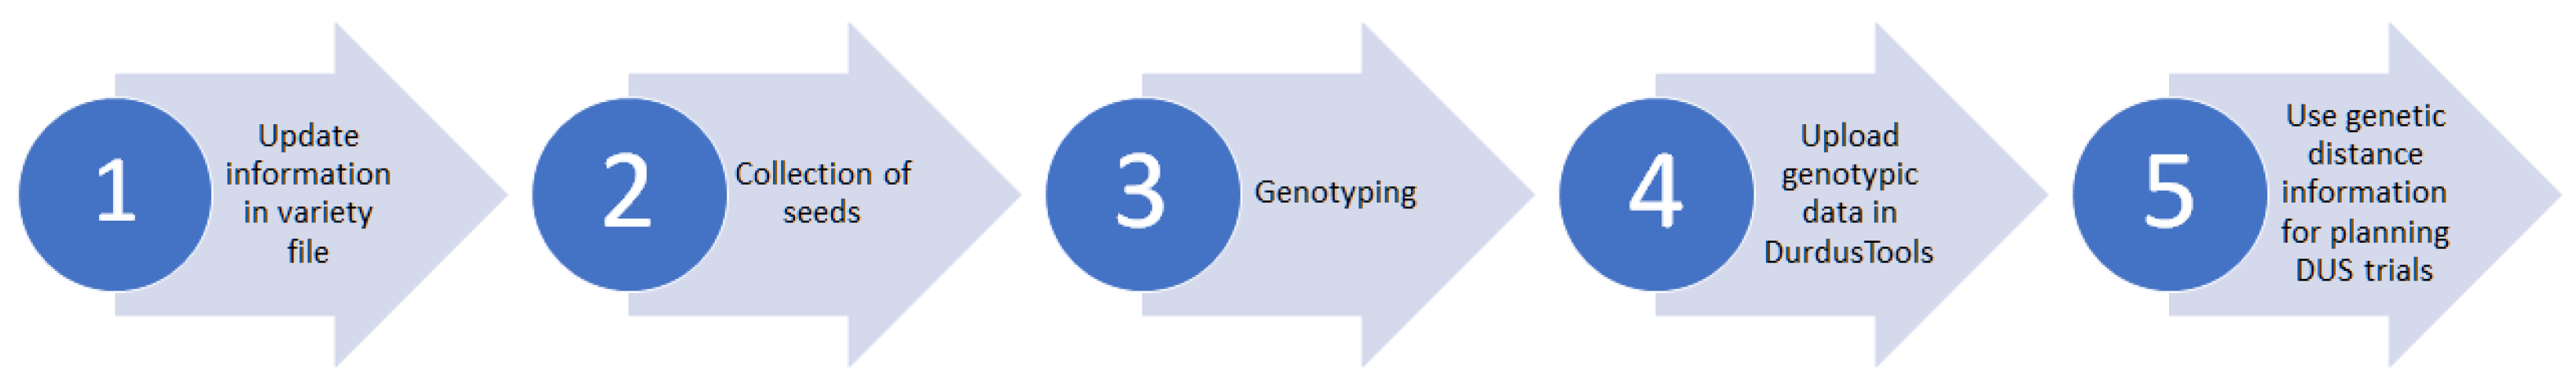
3.5. Definition of the DurdusTools Workflow
Harmonization between EOs requires the definition of a common workflow. DurdusTools is employed to calculate the GDs, and EOs retrieve the GD output, presenting the most similar varieties and candidate varieties sorted by the GDs. The DUS experts of entrusted EOs for durum wheat utilize information from DurdusTools in conjunction with phenotypic assessments following the first year of DUS trials to select the comparators to be grown in the field next to the candidate varieties under investigation during the second year, following a harmonized workflow (
Figure 3).
3.6. Harmonized Standard Procedures in DurdusTools
The tool coordinator acts as an intermediary between the service provider and the EOs, which improves error prevention. Each EO sends 20 seeds per candidate variety to the coordinator, encoding them based on the automatically assigned code in DurdusTools, and uploads the basic information to the variety file. The coordinator collects all seeds from the EOs and sends them to the service provider. Upon receipt, the service provider grows the seeds, extracts DNA from ten individual plants, and conducts genotyping. Raw genotypic data are provided to the coordinator within 6–8 weeks after seed shipment and uploaded to the molecular database. As the single point of contact, the coordinator receives the raw genotypic data from the service provider and uploads it to the tool. The raw genotypic data are stored securely on a dedicated server using the coordinator’s IT infrastructure with well-established security features, e.g., restricted incoming connections to the server and standard security measures. No folders can be accessed from the Internet. Moreover, access to the server where DurdusTools is hosted is restricted to partners only, and only granted upon approval. The database containing variety information and genotypic data is similarly protected. For raw genotypic data stored in the database, both SNP designations and variety names are encrypted for added security.
3.7. Quality Controls to Ensure Consistency and Comparability over Multiple Years
Selecting a suitable, stable, and high-quality set of SNP markers is crucial and was supported by creating an individual high-quality cluster file based on the genotyped collection of durum wheat varieties, facilitating reliable and sustainable clustering and allele calling. In addition to the two technical controls that are routinely included in each microarray by the service provider, the DNA of two defined varieties is added as additional quality control for technical consistency and reproducibility across years. These measures aim to provide stable and reproducible data over different years to ensure comparability and consistency when new genotypes are added to the molecular database. An additional quality control has been established by adding two varieties of choice per EO for the internal control of the overall genotyping and GD calculation process. These seeds, collected annually for every new genotyping process, originate from the same reference sample stored at the respective EO. It is the EO’s responsibility to validate the GD of control varieties for plausibility. In cases of implausible data, the consortium is informed, and the issue is investigated.
4. Discussion
Integrating molecular data into DUS tests may substantially support the choice of varieties for side-by-side comparisons, thus contributing to the efficient management of reference collections and potentially leading to savings due to smaller DUS field trials. Molecular data provide objective and stable information on the genetic background of the varieties under investigation [
37]. Its integration into a system that, by definition, relies on the evaluation of phenotypic characteristics [
9,
38] remains challenging. Working groups discuss the power but also the challenges of endeavors aiming for this purpose [
15,
16], and diverse approaches have resulted in the identification and approval of suitable models [
19,
20]. DurdusTools, enabling the genetic selection of similar varieties, was designed in line with these models. As a fundamental principle, it allows us to use molecular data without the need for laboratory equipment and molecular expert knowledge. It is, thus, an integrative and easily accessible tool that paves the way to taking advantage of integrating molecular data into DUS testing also for EOs with limited resources.
4.1. Key Features and Benefits of DurdusTools as an Innovative, Inclusive, and Resource-Efficient Tool
DurdusTools is based on the principles of resource efficiency, completeness of data, and harmonization. An important element of this approach is using a commercially available SNP microarray that is already standardized and cost-efficient, and does not require laboratory facilities in the EOs. As a result, DurdusTools provides a GD calculation tool and a workflow that allows for the direct and efficient use of molecular data in the DUS testing of durum wheat. It is harmonized and involves all EOs entrusted by the CPVO for this species in the EU. The online tool supports the requirements of DUS testing as it collects molecular information in a database that virtually comprises the varieties of common knowledge [
10]. The molecular database is also continuously updated by adding the candidate varieties that are under examination in the participating EOs. Keeping a database complete and up to date is crucial in a context of official tests leading to market authorizations and IP rights. Here, emphasis was placed on efficiency and simplification. The responsibilities for updating are shared among the participating EOs, reducing the workload for each individual EO. DurdusTools’ automation of various features, such as automatic emails, warnings, information signs, search filters, and templates for coding varieties, minimizes maintenance efforts and enhances functionality. This approach supports the validity and usefulness of the tool over time.
4.2. Defining a Harmonized Workflow
In a genuinely collaborative approach, the participating EOs defined the process and a common workflow. Thus, the tool is tailor-made to the needs of the experts, facilitating its user value and effective implementation. The workflow was designed considering the procedures in the participating EOs. Potential challenges such as timely updates of the variety file and the submission of seeds were resolved. User-friendliness, utility for DUS trial planning, and the focus on molecular data without integrating into the database harmonized phenotypic information (in contrast to, e.g., the potato database [
39,
40]) contribute to the tool’s simplicity and ease of use. Confidentiality is essential when handling data from intensely competing actors. For that matter, genotypes are assigned a code upon first upload that serves to provide the anonymization of the genotypes and to support the consistency of the database. Seeds are submitted to the coordinator using the respective code, collected, and sent to the service provider for genotyping. The molecular data are processed in a way that is easily accessible, readily available, and directly applicable for the DUS experts in their daily work. The tool issues the GD calculation data in a familiar format, namely, Excel workbooks. The output helps to make qualified decisions on precise side-by-side comparisons in the field and reduces the risk of missing relevant reference varieties. The DUS experts use the information in conjunction with phenotypic data after the first year of trials. A thus refined selection of varieties to be grown side-by-side in the second year of testing enhances the safety and quality of DUS trials. As an additional benefit, the EOs obtain information on all candidate varieties under examination and are notified in the case of similar breeder’s references. Thus, one of DurdusTools’ standout features is that it enhances the circulation of information, and, thereby, collaboration and knowledge exchange between EOs. In alignment with DUS testing requirements, DurdusTools significantly contributes to the efficiency, collaboration, and success of DUS trials in durum wheat.
4.3. Challenges of Harmonization Across EOs Due to Country-Specific Procedures
Integrating molecular data into DUS tests in a harmonized way remains a challenge in international collaborations. However, it was successfully achieved, for instance, when establishing a common European potato database [
39]. Similarly, a harmonized workflow for the use of DurdusTools was established by the participating EOs. Despite standardized protocols for DUS testing and the limited number of EOs entrusted for durum wheat, country-specific procedures posed a considerable challenge to the establishment of a harmonized workflow. First and foremost, the diverse climatic conditions and the cultivation of both spring and winter durum wheat types entail different timelines in the participating EOs. The experts concluded that the effort exceeds the expected benefit of fully harmonizing the timelines and workflow. Consequently, the GD calculation can only be used in the second year of DUS trials. Unfortunately, this limits the resource-saving effects potentially occurring, when excluding varieties from field trials already in the first year of DUS testing. Currently, before the first year of DUS trials, reference varieties are selected based on Technical Questionnaires filled in by the applicants, and this information is then complemented with the phenotypic data. Phenotypic data are gathered during the first year of testing and used (following, for example, the GAIA method [
38]) to select the reference varieties to be compared side-by-side during the second year. By using DurdusTools, the GD serves as an additional criterion to make the selection of the side-by-side comparators in a more reliable and a more efficient way than based on phenotypic data only. Importantly, molecular data provide information on the varieties that is not influenced by environmental factors or country-specific procedures. Harmonization requires carefully analyzing the similarities and differences between the EOs. This aim was achieved in DurdusTools by involving the EOs in all steps of the development of the tool. Continuous feedback loops throughout the process ensured a harmonized workflow that was suitable for all participating EOs.
4.4. Challenges and Limitations to Define a Common Molecular Threshold
It was a major challenge to define a molecular threshold that is applicable in all countries and climatic conditions, and for all growth types. This becomes evident from the GD calculation results that are higher in winter types than in spring ones. Various approaches were applied to define and validate a common GD threshold. Different approaches in implementing the GAIA method [
20] in the different EOs (e.g., weighting of characteristics or computing of the phenotypic distance) did not allow for the direct comparability of GAIA values across different EOs. For this reason, field trials that were specifically conducted for this purpose were evaluated with a Global note for describing variety distinctness. The results led to the definition of a GD threshold of 0.35, with a safety margin of up to 0.40, that was applicable in all EOs and, thus, was agreed upon as a general guidance for the exclusion from the second growing cycle of reference varieties that could be reliably considered as sufficiently distinct from the candidate. This threshold is implemented and individually assessed in each EO in conjunction with the phenotypic distance. The gaining of experience by routinely using the tool is expected to increase confidence in further defining the GD threshold, potentially reducing the amount of pairwise comparisons in the field. Although it was not possible to set exact thresholds that are applicable in all countries, the principle is similar to the method described for maize inbred lines in France [
38]. The approach makes use of both the GD threshold and GAIA distance, following the UPOV model [
19], and was shown to effectively reduce the size of field trials. In the further course of implementing DurdusTools, changes in the timeline of the EOs could be considered, which would allow for genotyping before the first year of field trials. By this, GD calculation results would be available when planning the first-year field trials, thereby further increasing the benefits of integrating molecular data into DUS testing.
4.5. GD Calculation Based on Genotyping with a Commercial SNP Microarray
A plethora of molecular marker technologies serving broad applications has been developed [
41], among which SNP markers have gained increasing importance due to their versatile applicability [
42,
43,
44]. They allow us to detect single-base differences, and play a crucial role in genetic profiling, the study of genetic variation, and the identification of closely related genotypes [
45]. The use of SNP microarrays with their high marker density ensures fast and objective genotyping results. In contrast to approaches that start with defining suitable markers, high-quality markers are already defined and assessed thoroughly.
A high resolution, standardization, and reproducibility are among the advantages when using high-throughput microarrays, which may serve various purposes [
23,
31,
46,
47,
48,
49,
50]. SNP microarrays are in routine use in breeding programs, thus widely tested and continuously updated [
51,
52,
53,
54]. They allow for comprehensive genome coverage without gaps in the genetic map, which is essential for GD calculation. In DurdusTools, the calculation of the modified Roger’s distance (MRD) was chosen for GD calculation. The MRD is used for DUS testing in maize [
36] and has properties that are suitable for the purpose [
31]. The normally distributed results of the GD in the durum wheat collection testify to the high quality of the calculation. The pairwise deletion method was employed, in which missing values on the SNPs during the pairwise comparison of the genotypes are not used for the GD calculation. In contrast to imputation, the pairwise deletion method avoids bias, even if this may lead to a reduction in the number of SNPs. A high-quality SNP selection with minimal missing values ensures a robust and harmonized GD calculation. With 95% of the SNP markers having less than 2% missing values, this high quality is met in DurdusTools. On average, 98% of the SNP markers were considered for determining the GD. A critical issue is to ensure consistent molecular data across multiple years and when using different SNP marker microarray technologies. Including replicates is imperative for quality control and enhanced data reliability [
55], and database curation requires specific attention to allow for the efficient use of the database over multiple years.
4.6. Benefits and Limitations of Using a Commercial SNP Microarray in DUS Testing
Although microarrays usually include a higher number of SNP markers than the number typically required for variety identification purposes [
56,
57,
58,
59], commercially available microarrays are a cost-efficient way of obtaining molecular data. In the context of DUS testing, they are an easily accessible and clearly defined alternative to other approaches. Commissioning a service provider for the genotyping process ensures that the platform remains state-of-the-art. In addition, no laboratory equipment nor molecular expert knowledge is needed for genotyping at the EOs. Resource- and cost-efficiency are important prerequisites for successfully integrating molecular data into DUS testing. Using a commercial SNP microarray is a way to overcome such limitations. Another clear benefit of this harmonized approach is the transferability of GDs among EOs without issues of inter-laboratory variation.
However, using microarray-derived molecular data for the routine integration of molecular data into DUS testing requires some considerations that go beyond the usual application of microarrays. For DurdusTools, 3928 SNPs were selected for the GD calculation, applying state-of-the art selection criteria and a customized cluster file. The selection was based on a significant number of genotypes, including virtually all varieties of common knowledge. The standard quality criteria for SNP selection included a low percentage of missing data, and a high minor allele frequency (marker informativity), discriminatory power, and consistency. During the development of DurdusTools, the selection was regularly adjusted to ensure high quality and stability. Consistency is strictly controlled by control samples and replicates.
One limitation of using commercial chips is that they may evolve, and the new versions can present modified assortments of SNP markers. This situation had to be handled twice during the development of the tool. To ensure the homogeneity of the information contained in the database, only SNPs that are likely to be retained in future microarray versions should be selected. In addition, technical controls were introduced that allow us to check for data consistency.
4.7. Data Protection and Confidentiality
In terms of confidentiality and ownership, breeders may raise concerns about sharing genotypic information. The use of full molecular data for variety registration is rejected by many breeders, while the use of genetic dissimilarity is considered acceptable [
60]. Accordingly, in DurdusTools, the raw genotypic data are carefully secured and protected, as described in detail in the Materials and Methods section. Notably, only the results of the GD calculations are shared between the EOs and used as a supporting element in the selection of varieties to be grown in side-by-side comparisons. Consequently, the exact genetic position of the SNP markers is not needed when using DurdusTools but could be made available upon agreement with the service provider should the need arise. The utilization of genotypic data for DUS purposes follows the CPVO policy [
61] and is made fully transparent to the breeders by an information letter. Candidate varieties that are not eventually registered at the end of their technical examination are not considered as varieties of common knowledge. Thus, these varieties are excluded from the database that serves as the basis for GD calculations.
4.8. Applying DurdusTools in DUS Testing
User-friendliness was an important principle when developing DurdusTools. DUS experts, as the users of DurdusTools, were involved in all stages to ensure a good user experience. The tool was tested in several rounds during its development, and continuously improved based on user feedback. The DUS experts report that access to DurdusTools is very easy as it is an online tool with registration functions and that the tool has a very pleasant user interface. The upload and download of data such as variety list management and GDs follow the users’ needs with Excel files and filter options. The smooth management of the application is supported by warnings and clearly defined procedures adapted to the users’ needs. The workflow and jointly developed procedures ensure that potential issues can be resolved in a defined and harmonized way.
DurdusTools was developed on a crop that was selected as a good model to test this new approach. The durum wheat reference collection is of a manageable size. Some EOs do not have access to laboratory facilities or molecular expert knowledge and can, therefore, benefit greatly from the DurdusTools type of support. The GD is a valuable metric for the selection of genotypes for side-by-side comparisons. However, according to the relevant UPOV guidelines, distinctness is not to be established solely based on molecular data. The successful integration of GD results in this process strongly depends on the quality criteria applied in the selection of the SNP set to which particular attention was paid. Applied to the genetics present in the reference collections, the developed approach did not lead to a very significant reduction in side-by-side comparisons. However, it was considered as very valuable by all entrusted EOs for their selection of comparators, increasing the reliability of their choices and strengthening their understanding of the genetic structures of their collections. Notably, the tool provides information on candidate varieties that are tested in the EO network already in the first year of DUS testing. The experts mentioned that the DurdusTools approach increased the knowledge exchange and communication between the entrusted EOs.


 ,
, 
