Article

Analysis of Nutritional Traits: Natural Variation within 90 Diverse Faba Bean (Vicia faba) Genotypes and Daily Value Contribution

by
Gokhan Hacisalihoglu
Biological Sciences Department, Florida A&M University, Tallahassee, FL 32307, USA
Crops 2024, 4(3), 440-446; https://doi.org/10.3390/crops4030031
Submission received: 8 July 2024 / Revised: 14 August 2024 / Accepted: 2 September 2024 / Published: 11 September 2024

Abstract

:
Identifying food plant germplasm with superior seed nutritional values is important in helping alleviate nutrient mineral deficiencies. Faba bean (Vicia faba), a highly nutritious, protein-rich legume, is an important crop plant grown in the U.S. and globally. Therefore, the goals of this study were to quantify the levels of K, P, Ca, Mg, S, Zn, Fe, Cu, B, and Mn in the seeds of 90 faba bean genotypes. Additionally, we evaluated percent daily values (%DV) based on U.S. Food and Drug Administration (FDA) recommendations. Macro- and micronutrient concentrations varied among faba bean genotypes. Seed Zn was positively correlated with seed P and Cu contents. Moreover, the Mn level was greater in faba beans with the highest concentrations of P, S, and Ca. The results of the present study demonstrate that there is significant variation in seed mineral nutrients among faba beans. We identified a set of faba beans with superior nutrient composition that could be potentially useful in genetic improvement studies and in addressing global future food security challenges. These findings will help global food security by achieving the United Nations Sustainable Development Goal Two, which is to achieve food security, improve nutrition, and promote sustainable agriculture.

1. Introduction

Faba bean (Vicia faba) is a cold-hardy legume crop cultivated globally as a source of human food and livestock feed [1]. Faba bean seeds are known for having the highest protein content among legumes (over 35%), complex carbohydrates, fiber, high essential mineral nutrients (K, Ca, Mg, Zn), amino acids (Leucine, Lysine, Arginine), and vitamins [1]. Of the 5.4 MT of faba bean global production, China is the largest producer (1.6 MT, 37% of world production), followed by Ethiopia (0.9 MT, 21% of world production), Australia (0.3 MT, 8% of world production), and France (0.2 MT, 6% of world production) [2].
Ionomics examines the variety and concentration of essential minerals and trace element composition in seeds using techniques such as inductively coupled plasma mass spectrometry (ICP-MS). Previous studies reported ionomic variation for flax seeds [3], Arabidopsis seeds [4], pea seeds [5], soybean seeds [6,7], rice [8], and peanuts [9].
Few studies have been conducted on the nutritional significance of faba bean seeds. For example, Nadeem (2021) surveyed 108 Turkish faba bean cultivars and showed significant variance for Fe, Zn, and Cu [10]. Khazaei et al. (2020) screened 25 faba bean genotypes grown in Canada and reported high nutrient (Ca, Mg, Mn) and low tannin genotypes [11]. Further research is needed to explore the nutritional quality, utilization, and improvement of food and feed applications of faba beans.
Currently, there are no studies linking the mineral content of seeds with percent daily value recommendations in faba bean. Therefore, the specific aims of this study were to:
(i)
determine the variability of nutrient trait concentrations among 90 faba bean genotypes;
(ii)
analyze elemental concentrations and recommended daily values for the mineral nutrients; and
(iii)
identify nutrient-dense superior faba bean genotypes for genetic improvement studies and global food challenges.

2. Materials and Methods

2.1. Faba Bean Material

A collection of ninety diverse faba bean genotypes was selected from the USDA National Germplasm Center (W6, Pullman, WA, USA) based on their phenotypic diversity and broad geographic sources. All genotypes used in this study were produced under field conditions at field sites with standard agronomical practices.
Accessions were grown at one of two field sites in Pullman, WA. The Central Ferry farm (Central Ferry, WA USA; 46°39′ N, 117°45′ W) has Chard silt loam soil, at an elevation of 198 m, and subsurface drip irrigation is used during the active growing season. The Whitlow farm (Pullman, WA, USA; 46°44′ N, 117°7′ W) has heavy soils including Palouse and Palouse–Thatuna silt loam, at an elevation of 790 m, and the fields are dryland managed. The weather was very similar to the 30-year average during the main growing season at both locations.
Three randomly chosen seeds per genotype (for a total of 270 faba bean seeds) were analyzed in the current study (Figure 1, Table S1).

2.2. Elemental Analysis of Mineral Nutrients

Seed elemental concentrations of macro- and micronutrients were quantified by Waters Agricultural Labs Inc. (Camilla, GA, USA) using an inductively coupled plasma spectrometer (Thermo ICP-OES) with a 40 s per sample run time. Briefly, dry seeds were ground in a Wiley mill, and a 0.5 g dry sample for each replication was placed in a 50 mL digestion tube. Nitric acid/peroxide digestion at 95 °C for 90 min was used. Then, 5 mL nitric acid and 4 mL peroxide were added to each tube and incubated for 30 min. Then, the samples were diluted with distilled water and transferred to ICP tubes for elemental analysis in accordance with the manufacturer’s specifications. The ICP was calibrated using distilled water as a blank, along with pure element standards of known concentrations and two plant standards [3].

2.3. Estimation of Recommended Daily Values (%DV)

The nutritional value of faba beans was estimated using ½ cup (60 g) dry-weight serving portion. Based on a 2000-calorie adult diet, the United States Food and Drug Administration (FDA)-recommended daily value indices were as follows: Ca (1300 mg), Cu (0.9 mg), Fe (18 mg), Mg (420 mg), Mn (2.3 mg), P (1250 mg), K (4700 mg), and Zn (11 mg). The percent daily value was calculated using the following formula [3]:
% DV = (amount of nutrient mg/recommended DV mg) * 100
where mg = milligrams; DV = daily value.

2.4. Data Analysis

Statistical correlations between elements were performed using SigmaPlot (SPSS Inc., Chicago, IL USA), as described previously [3]. Descriptive statistics for faba bean genotypes and each mineral nutrient were determined using three biological replications. We visualized the data using multiple software, including SigmaPlot v.12 and Microsoft Excel 365 (Microsoft, Redmond, WA, USA).

3. Results

3.1. Phenotypic Variation of Seed Elements

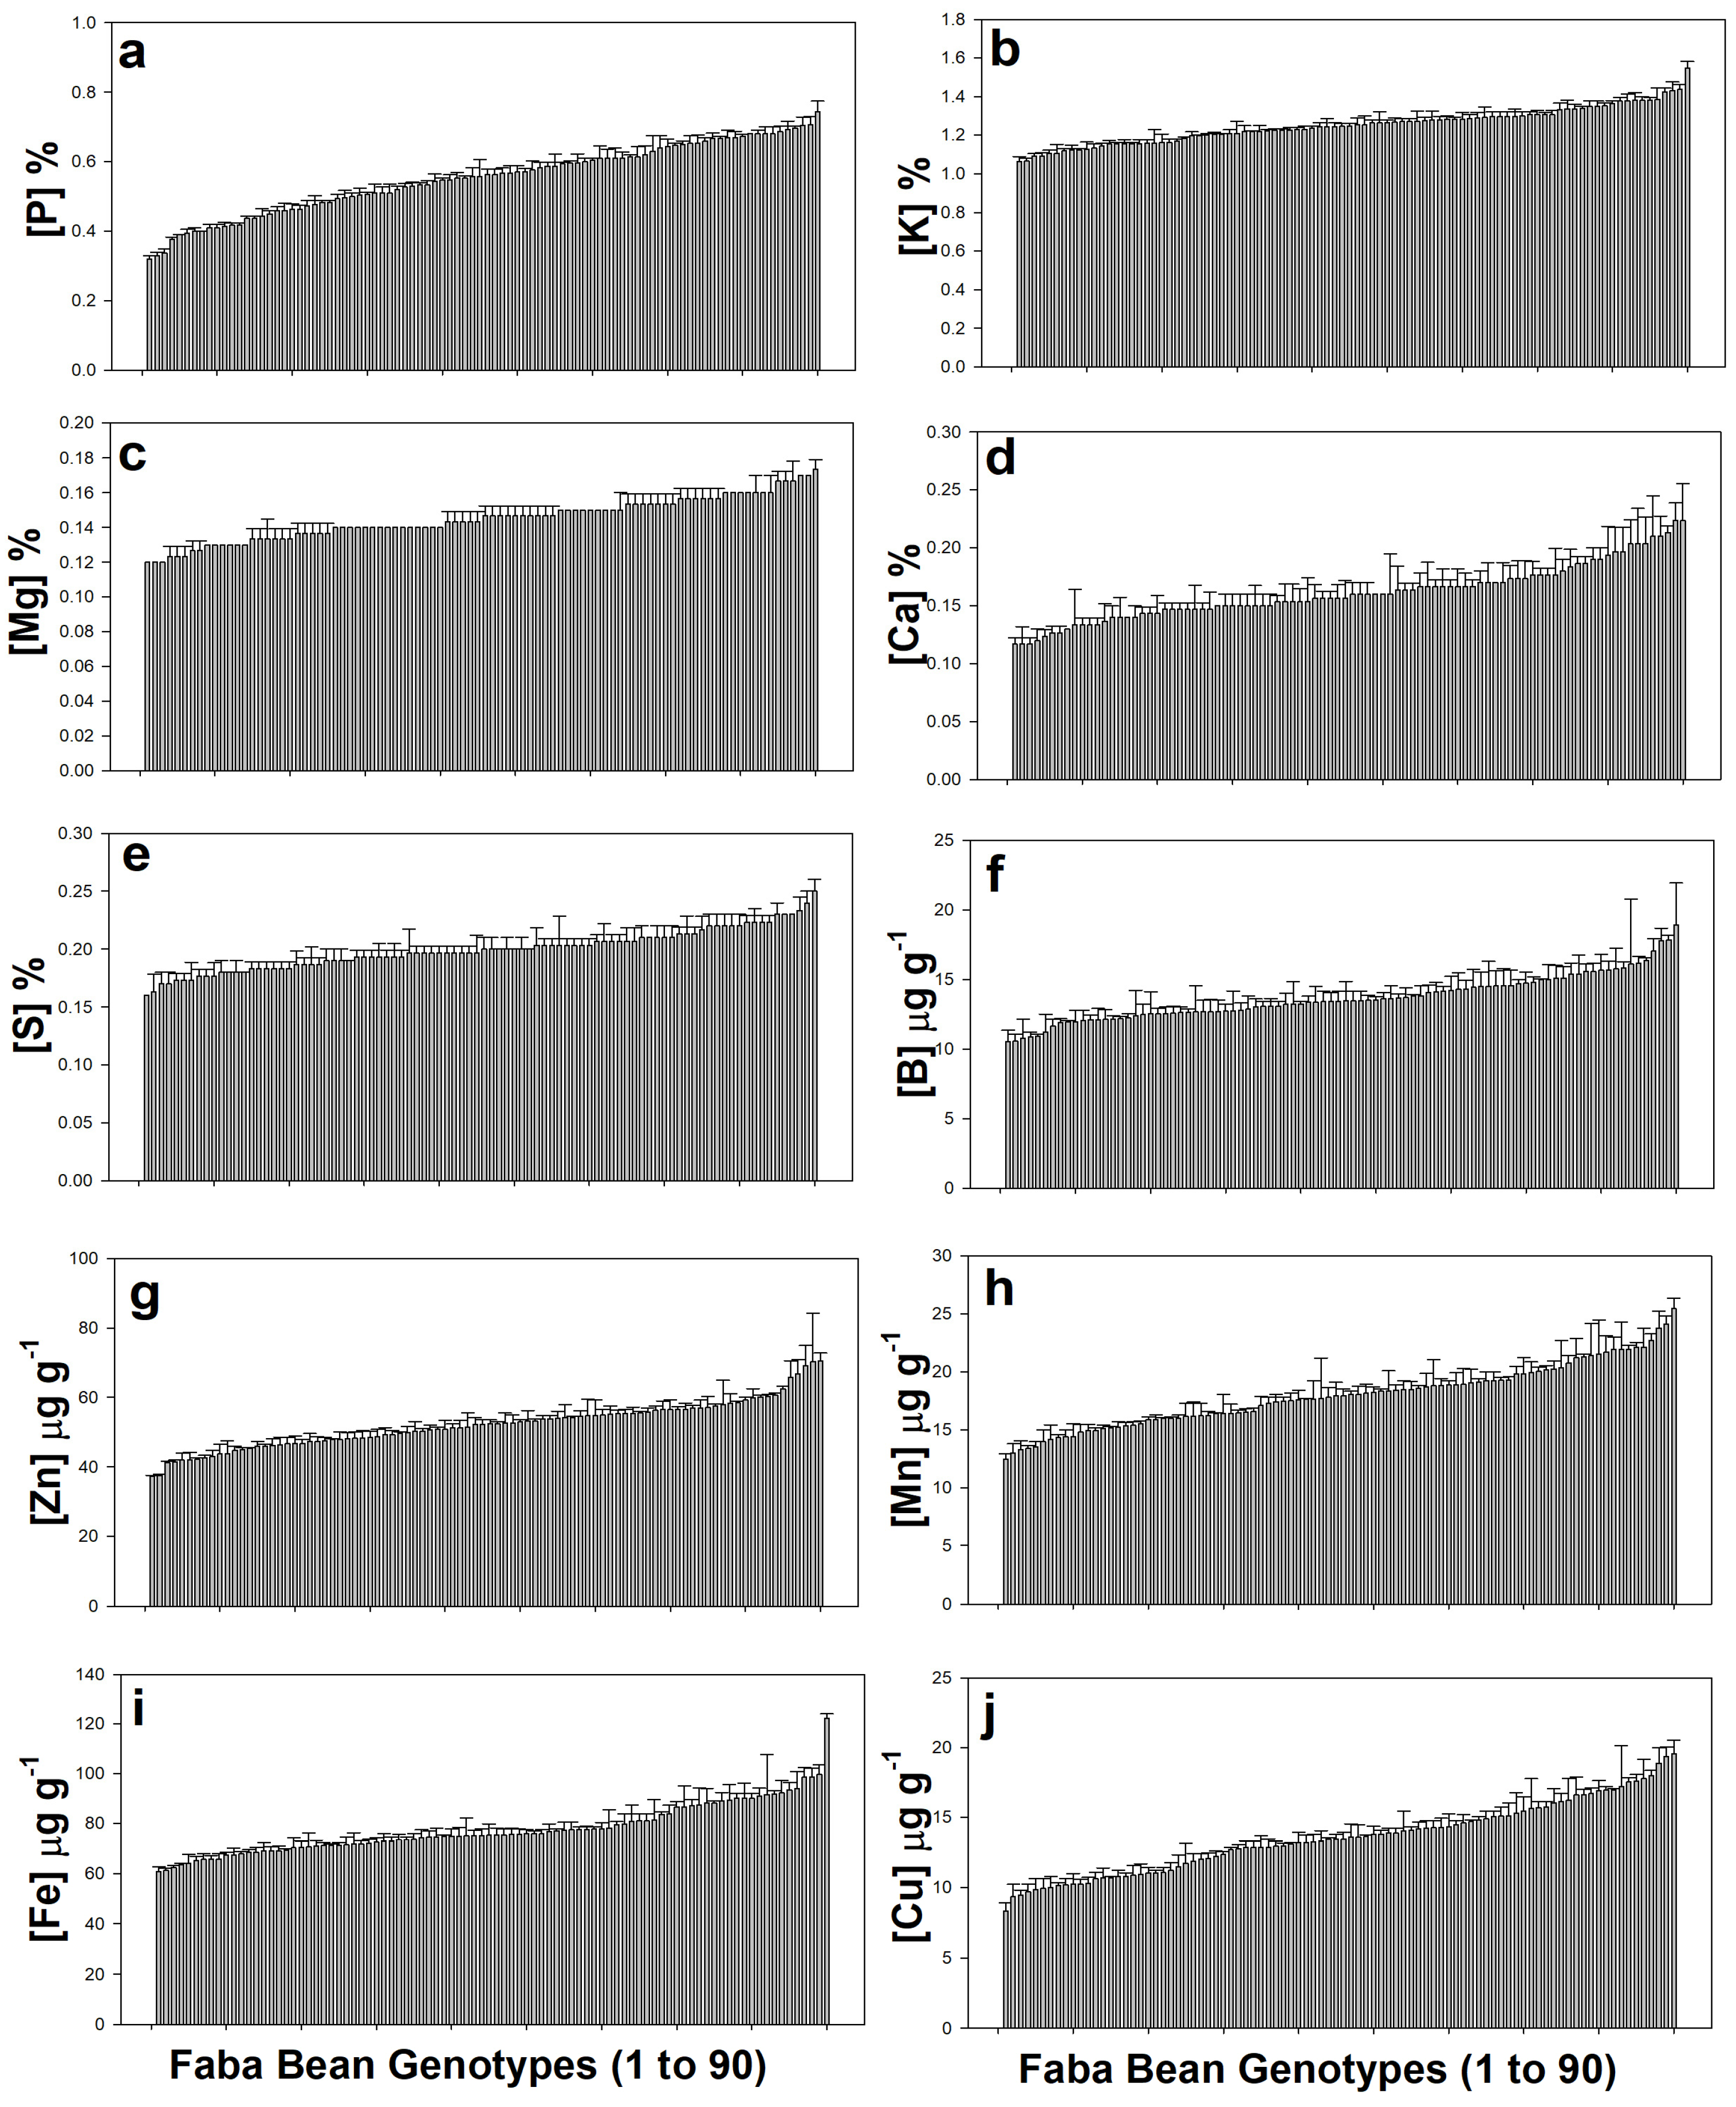
Data on means, variances, and ranges of seed elemental concentrations of faba bean genotypes are presented in Table 1. K was the most abundant element (1.25%), while Cu was the least abundant element (13.5 µg/g). Ca concentration showed variation with a 1.6-fold range (0.10–0.26%). Cu concentration showed variation with a 1.6-fold range (7.83–20.5 µg/g). P concentration showed variation with a 1.5-fold range (0.31–0.77%). Zn concentration showed variation with a 1.3-fold range (36.8–85.7 µg/g). Fe concentration showed variation with a 1.1-fold range (59.3–124 µg/g). B concentration showed variation with a 1.3-fold range (9.53–21.4 µg/g). Mn concentration showed variation with a 1.2-fold range (11.9–26.5 µg/g). K concentration showed variation with a 52% range (1.04–1.58%). Mg concentration showed variation with a 50% range (0.12–0.18%). S concentration showed variation with a 73% range (0.15–0.26%). Figure 2 shows the distribution of each element for faba bean genotypes.

3.2. Correlations among Mineral Nutrients

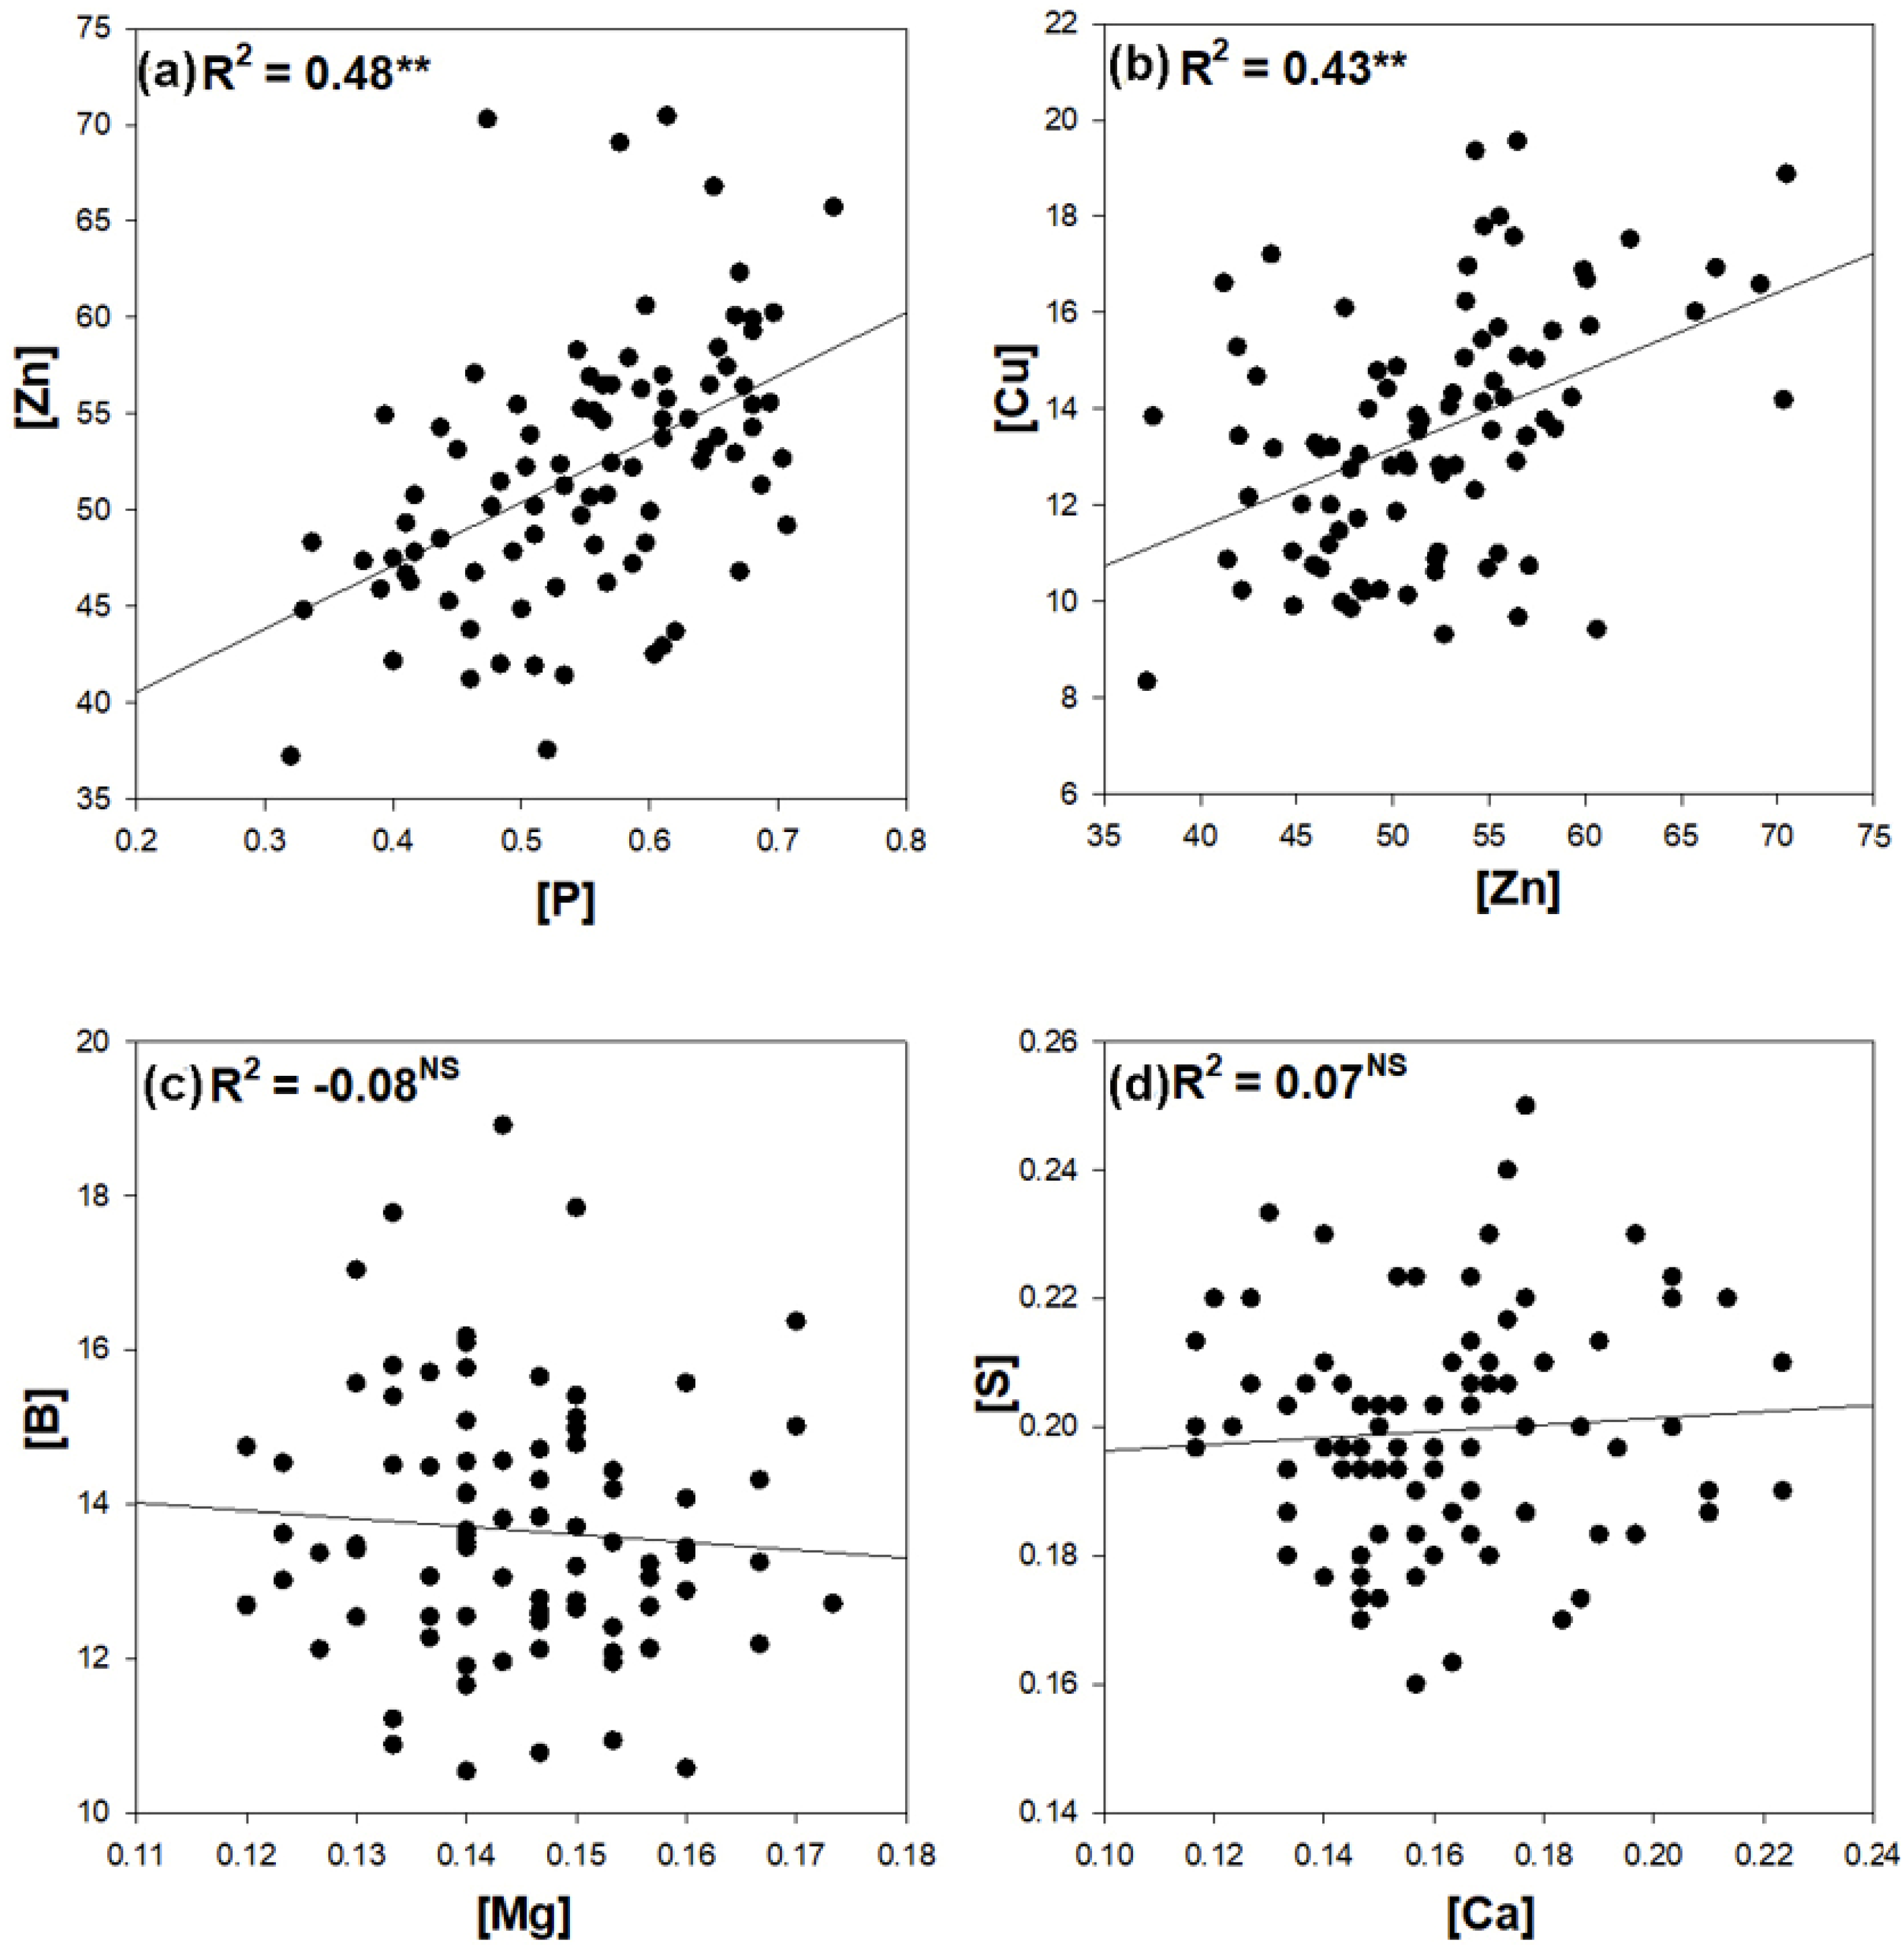
Correlation analysis was used to evaluate the relationships between different mineral nutrients in faba bean genotypes (Figure 3). Positive correlations were only detected between a small number of elements. Our data revealed that there was a strong positive correlation between P and Zn (R2 = 0.48, Figure 3a) and Cu and Zn (R2 = 0.43, Figure 3b). There was no significant correlation between other elements, including Mg, B, Ca, and S (Figure 3c,d).

3.3. Percent Daily Values of Faba Bean Nutrients

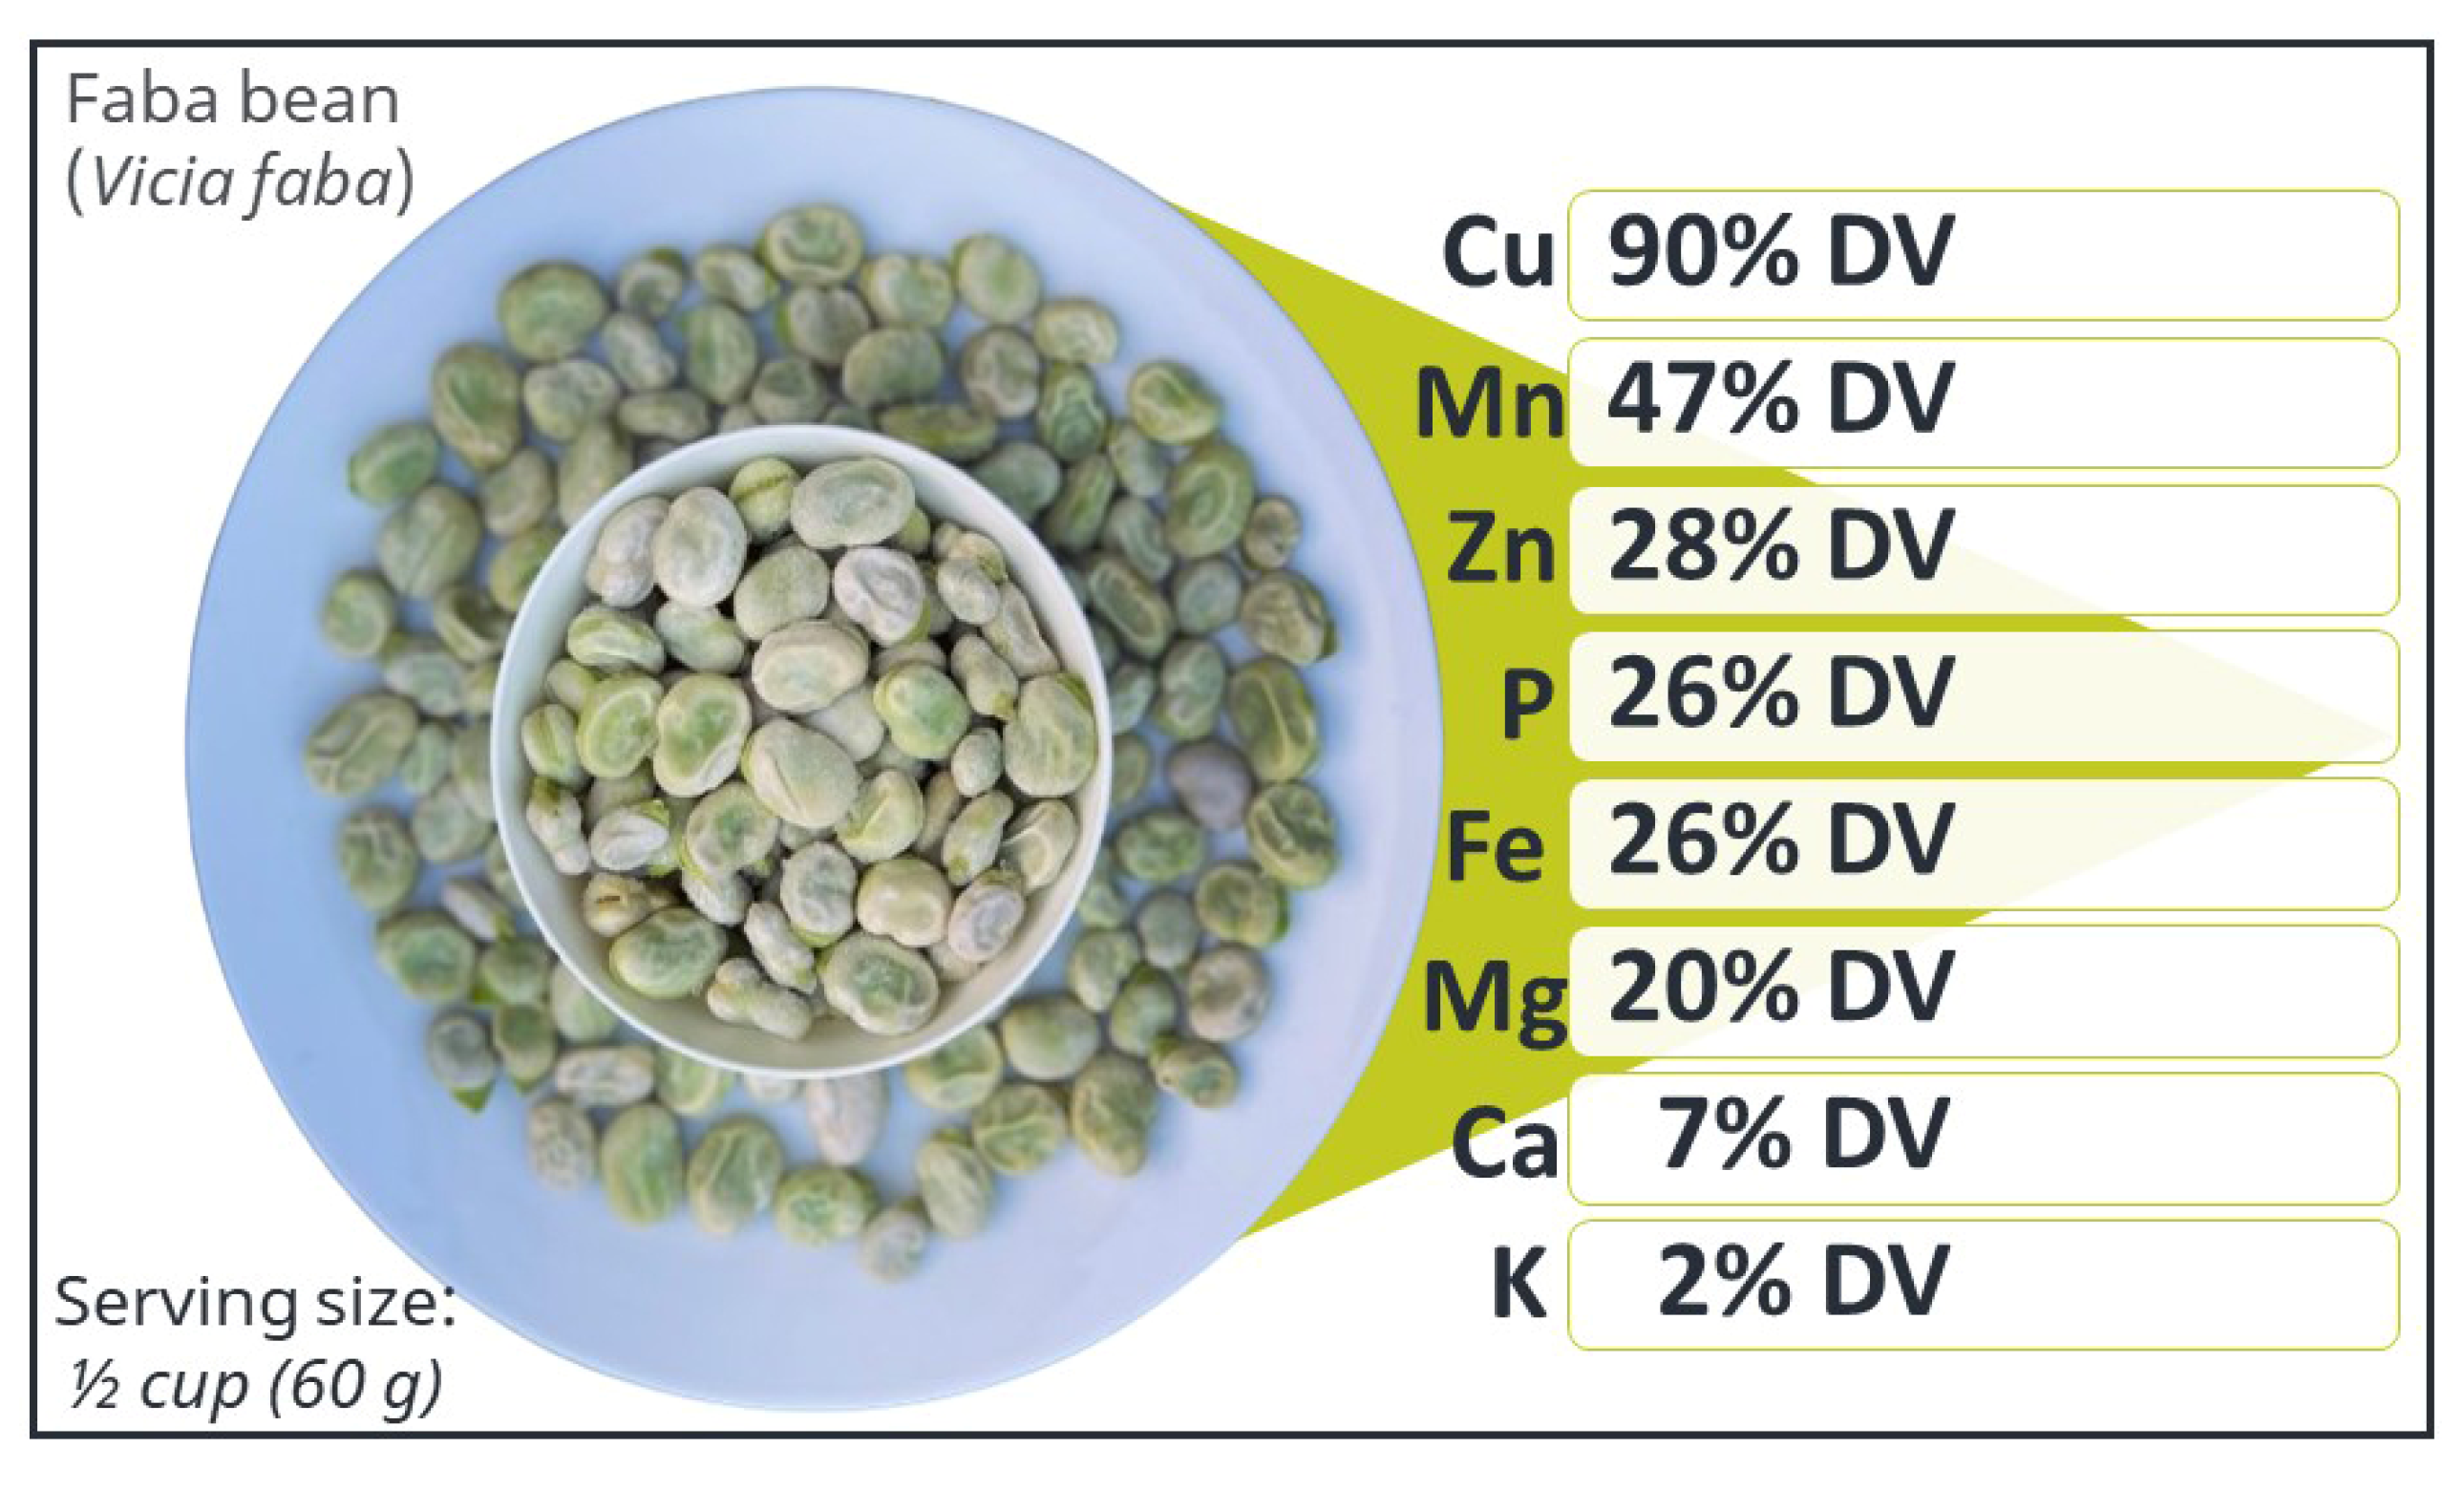
Figure 4 summarizes nutritional percent daily value (%DV) averages, which represent the amount of nutrients found in one serving size (1/2 cup, 60 g) of faba beans compared to what an adult person needs in one day [12]. The results showed that faba bean genotypes were excellent sources of Cu (90 %DV), Mn (47 %DV), Zn (29 %DV), P (26 %DV), Fe (26 %DV), and Mg (20 %DV). Moreover, faba beans were a good source of Ca (7 %DV) but low in K (2 %DV) (Figure 4).

3.4. Identification of Promising Top Nine Superior Faba Bean Genotypes

Based on overall ionomic results of 90 faba bean genotypes, nine genotypes showed elevated multielemental concentrations as follows: GL8, Brocal, Abawi, NEB341, Jahuas, 870523, 1964-10, IQ220004, and 64-77 (Table 2).

4. Discussion

Faba beans (Vicia faba), also known as broad or field beans, are among the relatively understudied legumes with high protein, mineral nutrients, amino acids, and vitamin content [1]. For example, faba beans contain over 30% protein, which makes them a good candidate for plant-based food sources. In terms of mineral nutrients, faba beans also contain various macro- and micronutrients essential to food and feed, as well as contributing to health benefits [1].
In the current study, we evaluated 90 diverse faba bean genotypes for their seed ionomes. Our results show natural variation, and the faba bean genotypes differed significantly in all macro- and micronutrients, with over 1.6-fold variation for Ca and over 100% variation for P, Zn, Fe, Cu, B, and Mn (Table 1). This substantial genetic variation was consistent with findings from Turkish faba bean germplasm [10], peas [5], soybean [7], and faba beans [10,12]. The current study comprehensively addresses multiple nutrients essential for plants, except nitrogen. However, faba beans are known for their high nitrogen content, and the seeds of faba beans typically contain up to 6% nitrogen, depending on growing conditions and soil fertility [10].
Understanding genotypical variation is critically important for developing biofortified crop varieties. In the present study, we specifically identified the top nine unique faba bean genotypes that had superior levels of seed ionomic composition (Table 2). The faba bean genotype GL8 ranked the highest for P and S, while genotype BROCAL ranked the highest for K, genotype NEB341 ranked the highest for Mg, and genotype 870523 ranked the highest for Zn (Table 2). As a result, these superb genotypes may be used for developing high mineral nutrient cultivars in faba bean breeding programs. Similarly, Khazaei et al. (2020) reported faba bean accessions with high macronutrient content such as Mg and Ca [11]. Furthermore, we observed a positive relationship between Zn and P as well as between Zn and Cu. This was consistent with the findings in sorghum germplasm [3].
The percentage daily value (%DV) is the concentration of each nutrient in a food utilized as part of a total daily diet [12]. We analyzed eight minerals according to FDA guidance for %DV. Our results show that daily consumption of a half cup (60 g) of faba beans could provide more than half of the %DV for Cu and a high %DV for Mn, Zn, P, Fe, Mg, and Ca (Figure 4). These findings further show the potential of faba beans as an important plant-based source and their contribution to the human diet.

5. Conclusions

This study shows for the first time not only the genotypical variation of faba beans but also their percentage daily value (%DV) contribution to the human diet. The results of the present study demonstrate that there is a significant variation in seed mineral nutrients among faba beans. Nine genotypes were identified as the potential genetic sources to develop faba bean cultivars for improved nutrients. Finally, these findings will help global food security by achieving the United Nations (UN) Sustainable Development Goal Two (SDG2; end hunger, achieve food security, improve nutrition, and promote sustainable agriculture) [13,14,15].

Supplementary Materials

The following supporting information can be downloaded at: https://www.mdpi.com/article/10.3390/crops4030031/s1; Table S1: Summary of 90 faba bean (Vicia faba) genotypes used in the present study with their origin and elemental mean concentrations (µg g−1).

Funding

This research received no external funding.

Data Availability Statement

The data supporting the findings of this study are available within the paper and in the Supplementary Materials online.

Acknowledgments

I thank the USDA National Plant Germplasm Center (Pullman, WA, USA) for providing the seeds. I would also like to express my gratitude to the FAMU College of Science & Technology and the Biology Department for their continuous support.

Conflicts of Interest

The author declares no conflicts of interest.

References

  1. Duc, G. Faba bean (Vicia faba L.). Field Crops Res. 1997, 53, 99–109. [Google Scholar] [CrossRef]
  2. FAOSTAT. FAO Statistical Databases; Food and Agriculture Organization of the United Nations: Rome, Italy, 2023; Available online: https://www.fao.org/faostat (accessed on 1 June 2024).
  3. Hacisalihoglu, G.; Armstrong, P. Flax and Sorghum: Multi-Element Contents and Nut Values within 210 Vars & Pot Selection for Future Climates to Sustain Food Security. Plants 2022, 11, 451. [Google Scholar] [CrossRef]
  4. Campos, A.C.A.; van Dijk, W.F.; Ramakrishna, P.; Giles, T.; Korte, P.; Douglas, A.; Smith, P.; Salt, D.E. 1,135 ionomes reveal the global pattern of leaf and seed mineral nutrient and trace element diversity in Arabidopsis thaliana. Plant J. 2021, 106, 536–554. [Google Scholar] [CrossRef] [PubMed]
  5. Hacisalihoglu, G.; Beisel, N.; Settles, A.M. Characterization of pea seed nutritional value within a diverse population of Pisum sativum. PLoS ONE 2021, 16, e0259565. [Google Scholar] [CrossRef] [PubMed]
  6. Ziegler, G.; Terauchi, A.; Becker, A.; Armstrong, P.; Hudson, K.; Baxter, I. Ionomic screening of field-grown soybean identifies mutants with altered seed elemental composition. Plant Gen. 2013, 6, 1–9. [Google Scholar] [CrossRef]
  7. Hacisalihoglu, G.; Settles, A.M. Quantification of Seed Ionome Variation in 90 Diverse Soybean (Glycine max) Lines. J. Plant Nutr. 2017, 40, 2808–2817. [Google Scholar] [CrossRef]
  8. Pinson, S.R.M.; Tarpley, L.; Yan, W.; Yeater, K.; Lahner, B.; Yakubova, E.; Xin-Yuan, H.; Zhang, M.; Guerinot, M.L.; Salt, D.E. Worldwide genetic diversity for mineral element concentrations in rice grain. Crop Sci. 2015, 55, 294–311. [Google Scholar] [CrossRef]
  9. Wang, M.L.; Grusak, M.A.; Chen, C.Y.; Tonnis, B.; Barkley, N.A.; Evans, E. Seed protein percentage and mineral concentration variability and their correlation with other seed quality traits in the U.S. peanut mini-core collection. Peanut Sci. 2016, 43, 119–125. [Google Scholar] [CrossRef]
  10. Nadeem, M.A. Exploring the phenotypic diversity for seed mineral contents in Turkish faba bean germplasm. Int. J. Agric. Wild. Sci. 2021, 7, 540–550. [Google Scholar]
  11. Khazaei, H.; Vandenberg, A. Seed mineral composition and protein content of faba beans (Vicia faba) with contrasting tannin contents. Agronomy 2020, 10, 511. [Google Scholar] [CrossRef]
  12. FDA. U.S. Food and Drug Administration: Nutrient content claims for “good source”, “high”, “more”, and “high potency”. Code of Federal Regulations. 2014, Subpart D, Title 21, 101.54. Available online: https://www.ecfr.gov/ (accessed on 1 May 2024).
  13. Labba, I.C.M.; Frokiaer, H.; Sandberg, A.S. Nutritional and antinutritional composition of fava bean (Vicia faba L., var. minor) cultivars. Food Res. Int. 2021, 140, 110038. [Google Scholar] [CrossRef] [PubMed]
  14. Hacisalihoglu, G.; Kantanka, S.; Miller, N.; Gustin, J.L.; Settles, A.M. Modulation of early maize seedling performance via priming under sub-optimal temperatures. PLoS ONE 2018, 13, e0206861. [Google Scholar] [CrossRef] [PubMed]
  15. Food and Agriculture Organization of the United Nations. Sustainable Development Goals. 2015. Available online: www.fao.org/sustainable-development-goals/ (accessed on 5 July 2024).
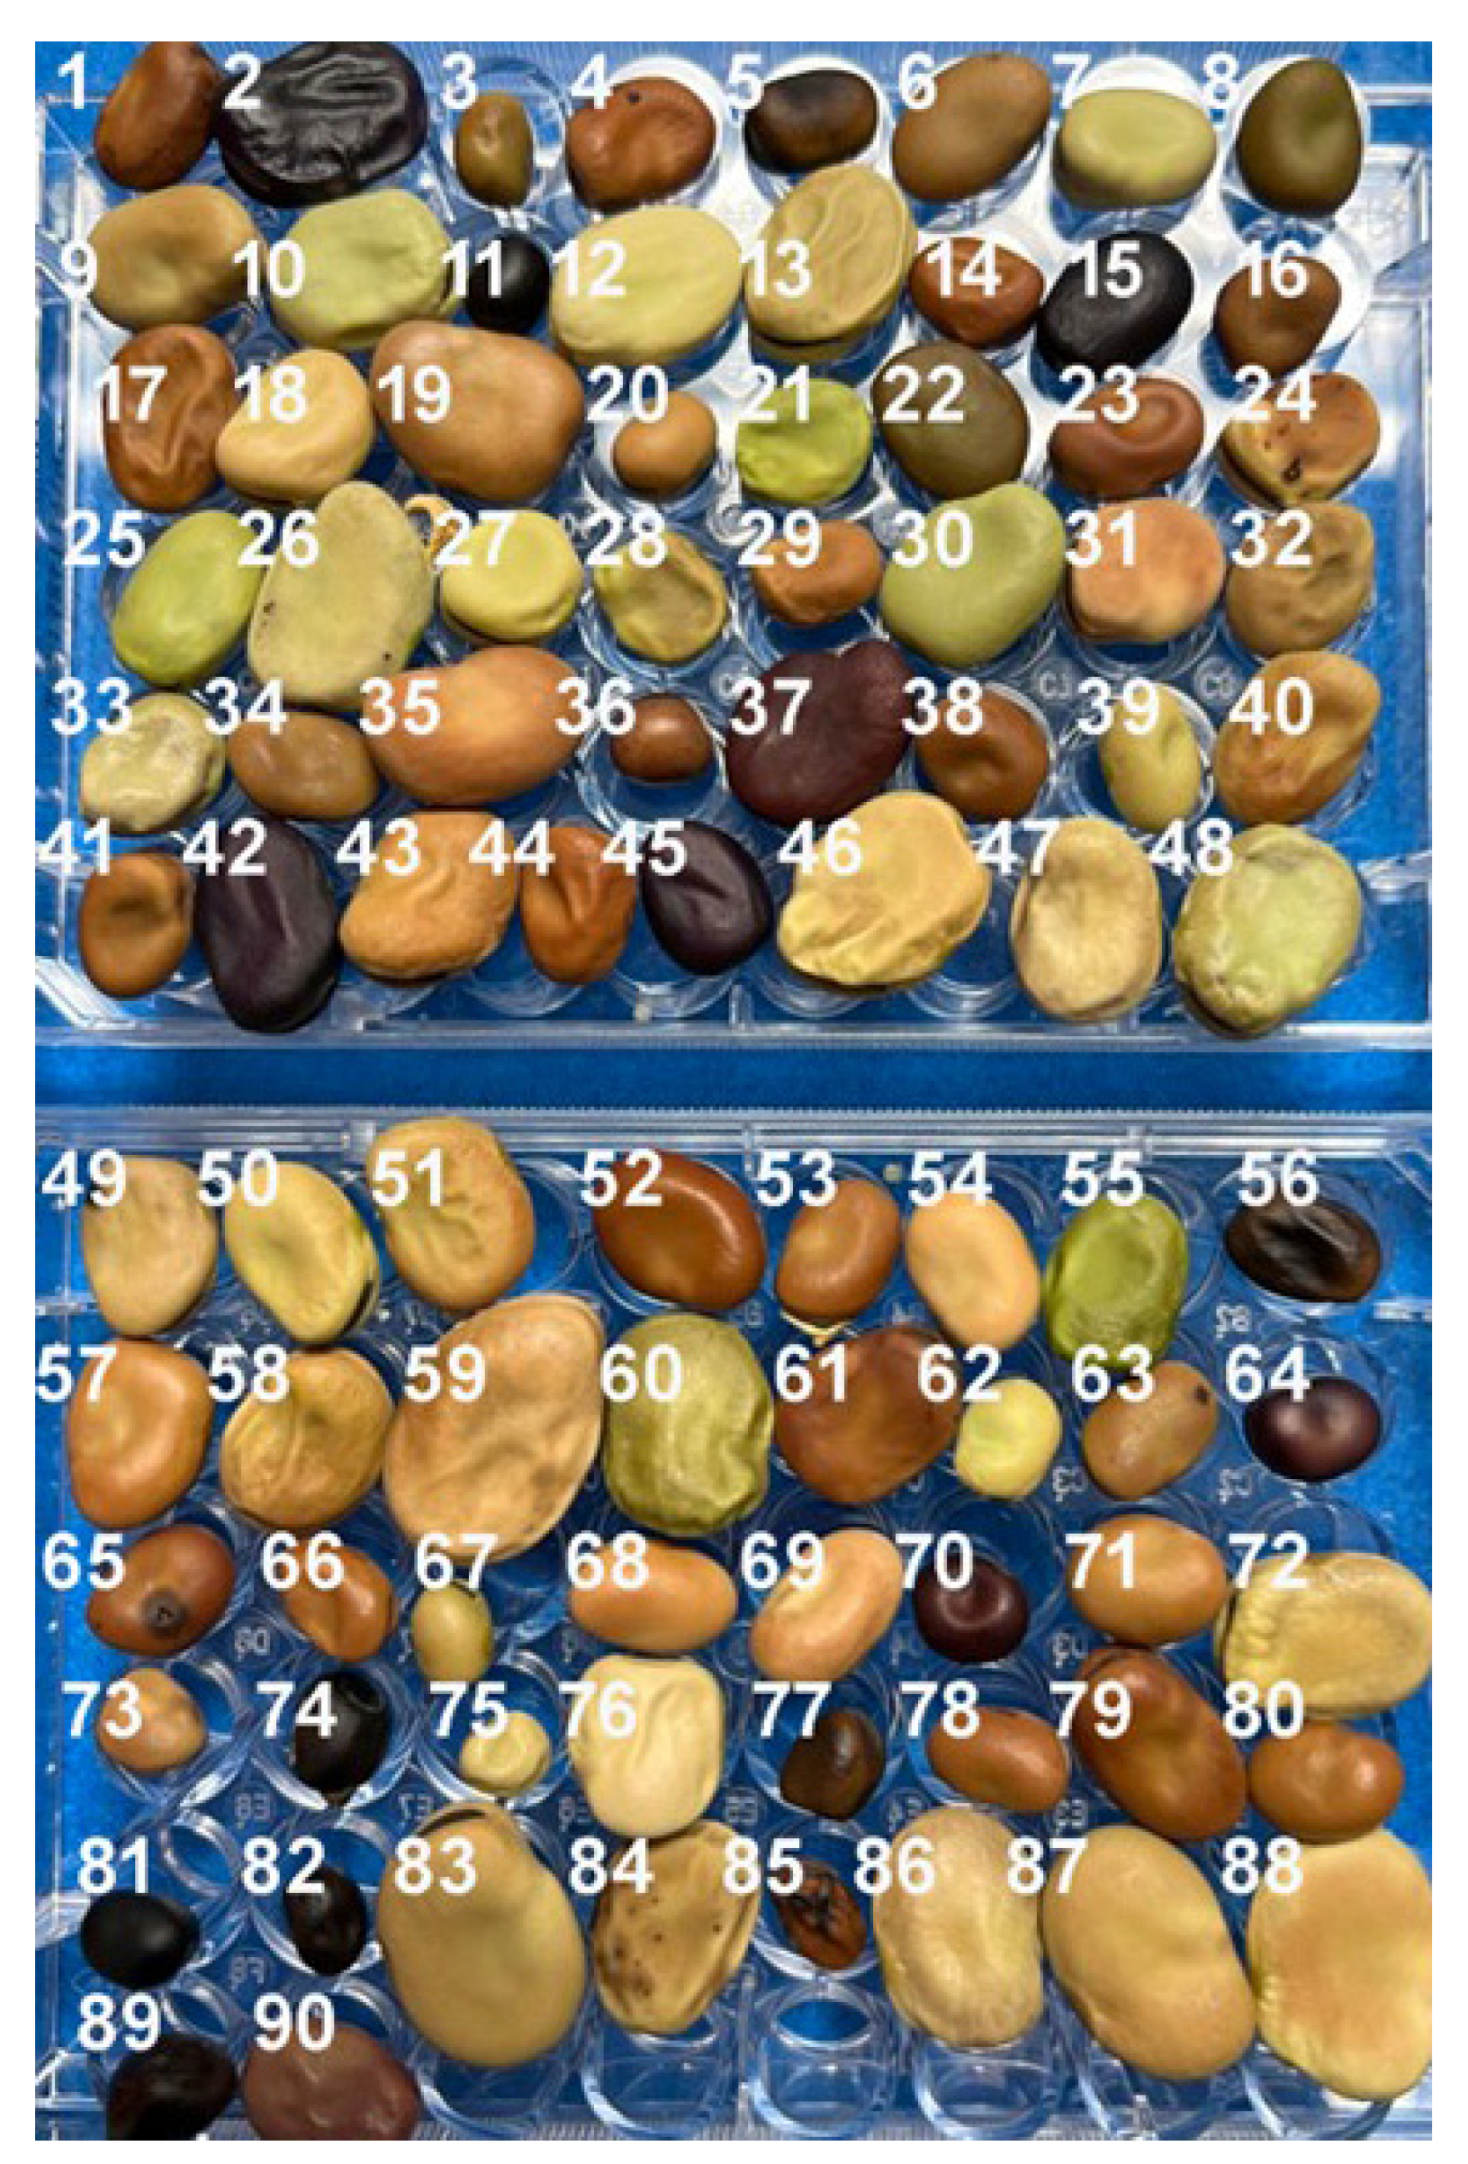
Figure 1. Seeds of 90 diverse faba bean (Vicia faba) genotypes used in the present study. For more details, please see Table S1.
Crops 04 00031 g001
Figure 2. Average concentrations of 90 faba bean (Vicia faba) genotypes (n = 3) for (a) P, (b) K, (c) Mg, (d) Ca, (e) S, (f) B, (g) Zn, (h) Mn, (i) Fe, and (j) Cu. Vertical bars represent standard errors (SD).
Crops 04 00031 g002
Figure 3. Correlations between seed nutrient concentrations of 90 faba bean (Vicia faba) genotypes. (a) P and Zn, (b) Zn and Cu, (c) Mg and B, and (d) Ca and S. The value of R2 indicates the coefficient of determination. **, significant at p < 0.01; NS, not significant.
Crops 04 00031 g003
Figure 4. Daily value (%DV) provided by a ½ cup (60 g) serving size of faba bean (Vicia faba). The values are based on a 2000-calorie human diet.
Crops 04 00031 g004
Table 1. Descriptive statistics for seed ionome concentrations of 90 diverse faba bean genotypes. Avg., average; SD, standard deviation.
KPCaMgSZnFeCuBMn
%%%%%µg/gµg/gµg/gµg/gµg/g
Avg.1.250.550.160.140.2052.0677.5613.5113.6617.92
SD0.090.100.030.010.027.0910.662.611.832.83
Min1.040.310.100.120.1536.8259.297.839.5311.93
Max1.580.770.260.180.2685.73124.1020.5021.4026.45
Each value is the mean of three replicates.
Table 2. A set of top nine superior genotypes of faba bean with high seed mineral concentrations.
GenotypePerformanceOrigin
GL8Highest: P; SHigh: MnChina
BrocalHighest: KHigh: P; MgSpain
AbawiHighest: K Peru
NEB341Highest: MgHigh: P; Ca; BKenya
JahuasHighest: CaHigh: MnPeru
870523Highest: Zn Spain
1964-10Highest: Mn Ir.
IQ220004Highest: FeHigh: K; CuIraq
64-77Highest: CuHigh: MgUSA
Disclaimer/Publisher’s Note: The statements, opinions and data contained in all publications are solely those of the individual author(s) and contributor(s) and not of MDPI and/or the editor(s). MDPI and/or the editor(s) disclaim responsibility for any injury to people or property resulting from any ideas, methods, instructions or products referred to in the content.