Article

Climate Change and Its Positive and Negative Impacts on Irrigated Corn Yields in a Region of Colorado (USA)

by
Jorge A. Delgado
1,*,
Robert E. D’Adamo
1,
Alexis H. Villacis
2,
Ardell D. Halvorson
1,†,
Catherine E. Stewart
1,
Jeffrey Alwang
3,
Stephen J. Del Grosso
1,
Daniel K. Manter
1 and
Bradley A. Floyd
1
1
USDA-ARS Soil Management and Sugar Beet Research Unit, Fort Collins, CO 80526, USA
2
Department of Agricultural, Environmental, and Development Economics, The Ohio State University, Columbus, OH 43210, USA
3
Department of Agricultural and Applied Economics, Virginia Polytechnic and State University, Blacksburg, VA 24061, USA
*
Author to whom correspondence should be addressed.
Retired.
Crops 2024, 4(3), 366-378; https://doi.org/10.3390/crops4030026
Submission received: 8 June 2024 / Revised: 26 July 2024 / Accepted: 5 August 2024 / Published: 9 August 2024

Abstract

:
The future of humanity depends on successfully adapting key cropping systems for food security, such as corn (Zea mays L.), to global climatic changes, including changing air temperatures. We monitored the effects of climate change on harvested yields using long-term research plots that were established in 2001 near Fort Collins, Colorado, and long-term average yields in the region (county). We found that the average temperature for the growing period of the irrigated corn (May to September) has increased at a rate of 0.023 °C yr−1, going from 16.5 °C in 1900 to 19.2 °C in 2019 (p < 0.001), but precipitation did not change (p = 0.897). Average minimum (p < 0.001) temperatures were positive predictors of yields. This response to temperature depended on N fertilizer rates, with the greatest response at intermediate fertilizer rates. Maximum (p < 0.05) temperatures and growing degree days (GDD; p < 0.01) were also positive predictors of yields. We propose that the yield increases with higher temperatures observed here are likely only applicable to irrigated corn and that irrigation is a good climate change mitigation and adaptation practice. However, since pan evaporation significantly increased from 1949 to 2019 (p < 0.001), the region’s dryland corn yields are expected to decrease in the future from heat and water stress associated with increasing temperatures and no increases in precipitation. This study shows that increases in GDD and the minimum temperatures that are contributing to a changing climate in the area are important parameters that are contributing to higher yields in irrigated systems in this region.

1. Introduction

Adapting cropping systems to mitigate the adverse impacts of a changing climate will be critical in this effort, and irrigation and water management will be part of adaptation efforts [1]. At present, most agricultural research involves short-term field research, and long-term research plots are needed to monitor effects over longer time periods. Despite evidence that long-term studies are needed to discern agronomic impacts of some management practices [2,3], few research sites have plots dedicated to studying the long-term effects. To help address this gap, in 2015, the USDA Agricultural Research Service (ARS) started a new research program called the Long-Term Agricultural Research (LTAR) network at eighteen ARS sites. Up to now, most long-term assessments of corn yield vulnerability to climate change rely on model simulations that project a significant decrease in yields over time. Some have predicted that an increase in temperature will affect the physiological responses of the corn crop and these responses will reduce yields [4]. The range for corn during vegetative growth is from near 8° to 34° C [5,6]. Warmer temperatures during the tasseling and silking stages could shorten their duration, and impact pollination and kernel set, so yield-decreasing effects might emerge with temperatures above 30° C [5,7,8,9]. Other assessments predict that in locations where precipitation will decrease, there will be reductions in corn yields [10]. However, simulations of irrigated production suggest that irrigation may be an effective way to mitigate undesirable impacts of a changing climate on corn yields [10].
Climate change during the last 55 years has significantly affected planting zone boundaries in the North China Plain, shifting the planting area northwards and increasing the area planted [11]. Corn yields in the North China Plain have increased from about 2 t ha−1 to close to 6 t ha−1, a rate of increase of 0.85 t ha−1 decade−1 from 1970 to 2015 [11]. However, simulations of corn yields in the area suggest that climate change has reduced corn yields over the last 60 years due to heat stress and slightly reduced precipitation, and that the growing degree days (GDD) [12] have increased at a rate of 4.4 GDD [13]. Similarly, in the western U.S., temperatures increased significantly from 1950 to 2000 [14]. A modeling assessment of the effects of temperature on corn yields using annual corn yield data from 1950 to 2005 showed that warmer temperatures will significantly reduce corn yields by the end of the 21st century, with reductions ranging from 44 to 75% depending on the scenario [15]. However, this analysis did not consider the positive effects of carbon dioxide (CO2), or the role of irrigation in the yield responses [15]. Another study using annual corn yield data from 1980 to 2010 found a positive correlation between temperatures and yields in irrigated areas of Nebraska and smaller regions of Kansas, with non-irrigated areas being negatively impacted [10]. In cooler areas such as North Dakota, higher temperatures increased yields in irrigated and non-irrigated areas [10]. Higher temperatures in the Midwest that were accompanied with increased precipitation that reduced water stress also saw higher yields [10]. The authors concluded that their analysis of hot days may not continue to apply in the future and may negatively impact irrigated areas of Colorado, Kansas, Nebraska, Wyoming, and North Dakota if these increases above the range of corn acclimation conditions start negatively impacting corn yields.
Analysis of USDA historical county data for corn yields from the 1970 to 2015 period found that higher temperatures, heat waves, and killing degree days are also negatively impacting corn yields, with three in every five counties having significant correlation [16]. The study found that corn in Missouri, southern Illinois, and Indiana is highly sensitive to heat extremes while in Minnesota and South Dakota it was not substantially impacted by extreme temperatures, heat waves, and killing degree days [16]. In simulations of climate change-induced temperature increases in Canada, higher temperatures contributed to 11.7% and 9.3% higher corn yields for conventional tillage (CT) and no tillage (NT) systems, respectively, under the Representative Concentration Pathway (RCP) 4.5 scenario (a climate change scenario under which radiative forcing is stabilized at 4.5 Watts per meter squared in the year 2100), and to 17.1% and 13.9% higher corn yields for CT and NT systems, respectively, under the RCP 8.5 scenario (highest emissions, baseline [no policy] scenario of the Shared Socioeconomic Pathways [SSP]) [17]. Lower soil temperatures in no-till systems with more crop residue to shade the soil surface could reduce yields in Canada [18]).
Research data from the unique long-term plots established in the Sanborn field in Columbia, Missouri, were combined with weather data collected at a weather station 16 km from the site and used to study the effects of climate change on corn yield from 1895 to 1998 [19]. The study found that the occurrence of weather and climate variation was higher in more recent decades and correlated with the higher variability observed in yields from 1945 to 1998. The increased variability in yields was explained by variability in weather [19]. Our objective was to use the long-term Halvorson research plots (2007 to 2018) and weather data collected at the site, as well as county data on long-term mean harvested yields (1963 to 2019) and long-term weather (1900 to 2019) to assess the effects of climate change on corn productivity. The present work is unique in that, to our knowledge, it is the only long-term (2007–2018) irrigated corn productivity study using long-term data (11 years of data) to assess the effects of nitrogen fertilizer (0, 67; 134; 202; and 246 kg N ha−1), water inputs, and climate change (e.g., GDD) on yields in order to test the hypothesis that climate change is occurring and can impact corn yield (note: the Sanborn field plots were not irrigated, nor did they have a series of plots for N fertilizer rates) by using a multiple regression technique and then comparing the assessment results from long-term plot research with assessments of long-term county corn yield data (1963 to 2019) and long-term (1900 to 2019) weather data from a nearby weather station.

2. Materials and Methods

2.1. Site Information

The Halvorson long-term research plots were established at Colorado State University’s Agricultural Research, Development and Education Center (ARDEC) near Fort Collins, Colorado (40°39′6″ N, 104°59′57″ W, 1535 m above sea level) on a Fort Collins clay loam soil (fine-loamy, mixed, mesic Aridic Haplustalfs) with a 1 to 2% slope. The area was cultivated with corn for seven years prior to the start of the no-till study in 2000. The no-till area has been monitored continually since then. The area covered by the long-term studies was 162.5 m wide by 162.5 m long with different crop rotations. One of the rotations was a continuous no-till corn rotation that was 21.9 m wide by 162.5 m long, divided in a randomized block design with six nitrogen rates in each block that have been managed similarly. Since the no-till plots received lower nitrogen application rates from 2000 to 2006 and we found a significant response to nitrogen, we started our assessment of the effects of climate change on yields in 2007 using the plots that had been receiving 0, 67; 134; 202 and 246 kg N ha−1 since 2007. On average, the water input (sum of precipitation plus irrigation) in the initial period considered for this study was lower than the water input since 2012, and we considered total water input as well as nitrogen input to explain the yield responses.
Planting was performed around the end of April and the start of May. Germination and the vegetative (V) stages of growth started in May, with the first leaf (V1) to the fifth leaf (V5) occurring during this month. In June, the V stages of growth continued with the number of kernels being set during the V5 to V6 stages and rapid growth occurring for V7 to V8. During the month of July, the vegetative stage went from V8 to V(x) and transitioned at pollination to the reproductive (R) phases from VT (tasseling) to R1 (silking) and then to R2 (blister). Over the month of August, the reproductive phase went from R2 (blister) to R3 (milk) and on to R4 (dough). The R4, R5 (dent) and finally R6 (physiological maturity, black layer) stages occurred in September. The drydown process occurred in October. Although the weather and type of variety planted will affect these physiological processes, the above description illustrates when these processes occurred on average for all varieties. This is especially true for tasseling, which was recorded when it occurred, and it always occurred in July, and for R6, which always occurred during September.
Harvested yields were collected after the drydown process at the black layer by manually removing the ears from all plants in two adjacent rows, each 7.6 m long, for a total sample area of 11.6 m2 from each experimental unit. The manually harvested ears were air-dried and mechanically threshed; the grain was then subsampled and oven-dried. (All oven-dried samples were left in a 60 °C oven for at least 48 h.) The 2008 yields were not used due to a large hailstorm that heavily damaged the plots. Yields from eight plots damaged in 2009 by slugs (order Pulmonata), yields from two plots damaged by spider mites (family Tetranychidae) in 2011, and an additional six plots damaged in 2012 were not used. In 2018, one observation from the highest nitrogen rate had an issue related to handling at harvest, so the yield was dropped from the dataset.

2.2. Long-Term Research Plots and Weather Analysis

Weather data collected at the ARDEC research station were used to study the effects of climate change on yields from 2007 to 2018 (COlorado AGricultural Meteorological nETwork [CoAgMet] station #: FTC03). Most of the ARDEC weather data were recorded by the CoAgmet station # FTCO3 (located at ARDEC, Fort Collins, CO, USA). In the few instances where there were missing temperature or precipitation data, this was supplemented by the CoAgMET station FCL01, which is located on CSU’s main campus and is about 9 miles away from FTC03. Using the CSU data (CoAgmet station #FTCO3 and FCL01), we calculated the GDD and the SDD (stress degree days), which are the days above 30 °C.
A multiple regression model was used to analyze the relationship between yields and nitrogen rates, water input, and temperatures for the Halvorson research data (2007 to 2018) using the STATA Ordinary Least Squares model (OLS; see Table 1). We controlled for covariates to make the variable of interest—temperatures—unconfounded [20]. The multiple regression equation for Table 1 is as follows: Yield (kg ha−1)= a1* + a2*Total Applied N (kg ha−1) + a3* Total Water + dummy variable effects + a4* Sum of GDD (°C), where a1 is the constant, a2, a3 and a4 are the coefficients of total N, total water, and sum of GDD, respectively. The dummy variable effects are the coefficients for the varieties taking a value of 1 time the coefficient for the variety in the plot, and zero otherwise. We also conducted simple regression analysis for the weather and yield quantities, which were performed in R using lm() [21].

2.3. Long-Term County Yields and Weather Analysis

Weather data collected at the Colorado State University (CSU) weather station were used to study the effects of climate change from 1900 to 2019 (NOAA station ID #: GHCND:USC00053005). Although most of the years had no missing information, any year with more than 20 weather observations missing was not considered for the county yields and weather analysis (see Supplementary Data—Weather Data). For monthly analysis of the effects of changing weather on yields, if there was any missing information during the month, that month for that year was not considered for the analysis. The average corn growing season (May to September), GDD, and maximum and minimum temperatures were used as predictors in the regression analysis with the county’s average harvested corn yield from 1963 to 2019. All simple regression analyses of long-term county yields and weather were performed in R using lm() [0].

3. Results and Conclusions

3.1. Climate Change

3.1.1. County Yields and Weather Analysis

The climate during the growing season for corn has been changing significantly at the site. In Fort Collins, the mean daily average temperature for the growing period of the irrigated corn (May to September) has increased at a rate of 0.023 °C yr−1, going from 16.6 °C in 1900 to 19.3 °C in 2019, a net increase of 2.7 °C (Figure 1a) (p < 0.001; r2 = 0.53). The mean daily maximum temperature during the growing season of corn has been increasing at a rate of 0.019 °C yr−1, going from 24.8 °C in 1900 to 27.1 °C in 2019, a net increase of 2.3 °C (y = −10.7 + 0.0187x). The rate of increase in mean daily minimum temperature during this time has been faster at 0.027 °C yr−1, going from 8.4 °C in 1900 to 11.5 °C in 2019, a net increase of 3.2 °C (y = −42.5 + 0.027x).
Parallel increases in GDD have occurred from May to September at a rate of 2.2 °C yr−1, going from 1181 GDD (°C) in 1900 to 1437 GDD (°C) in 2019 (Figure 1b) (p < 0.001; r2 = 0.47), but precipitation did not increase (Figure 1c) (p = 0.897; r2 < 0.01). This rate of increase in GDD of 2.2 °C yr−1, which was collected at an elevation of 1523 m, is about half of the rate of increase of 4.4 °C yr−1 reported by Wang [13] for the North China Plain (where average elevation is under 50 m) from 1954 to 2015. These findings of climatic changes at the site are in agreement with reports of significant warming and higher GDD in other areas of Colorado [22] and higher temperatures in the western U.S. from 1950 to 2000 [14]. The average temperature in a calendar year at the site have been increasing at a rate of 0.024 °C yr−1, going from 7.7 °C in 1900 to 10.7 °C in 2019, or a net increase of 2.9 °C (y = −28.3 + 0.0243x; p < 0.001; r2 = 0.62), but the averages for precipitation did not increase (y = 209 + 0.0879x; p = 0.742; r2 < 0.01).
Using the long-term weather data from 1900 to 2019 collected at NOAA station ID #GHCND:USC00053005, we found that the increase in minimum temperatures from 1900 to 2019 during the September growing period was 3.3 °C, or 0.028 °C yr−1. The long-term and short-term weather datasets support the suggestion that the rate of change in temperatures has been accelerating since the 1900s and that the climate is getting warmer at a faster rate. For example, the rates of change in average temperature for September from 1900 to 2019, 1940 to 2019, 1980 to 2019 are 0.028 (p < 0.001), 0.039 (p < 0.001) and 0.051 °C yr−1 (p < 0.001), respectively.
Assessing the effects of these climatic changes is important because increases in average temperatures in the USA have been found to be correlated with a reduction in yields in some regions [16], except in areas where precipitation has sufficiently increased to compensate for higher rates of evapotranspiration, or in areas where irrigation has been able to meet the water demands, such as regions of Kansas and Nebraska [10]. Analyses of the effects of temperature on corn yields have been performed using long-term county data, but there has not been an assessment using long-term plots, except for a long-term analysis that was conducted in the Sanborn field in Columbia, Missouri, which found a correlation between weather and climate variability in more recent decades, with higher variability in yields [19]. No long-term plot data analysis has been conducted for irrigated studies in these large regions of the USA.
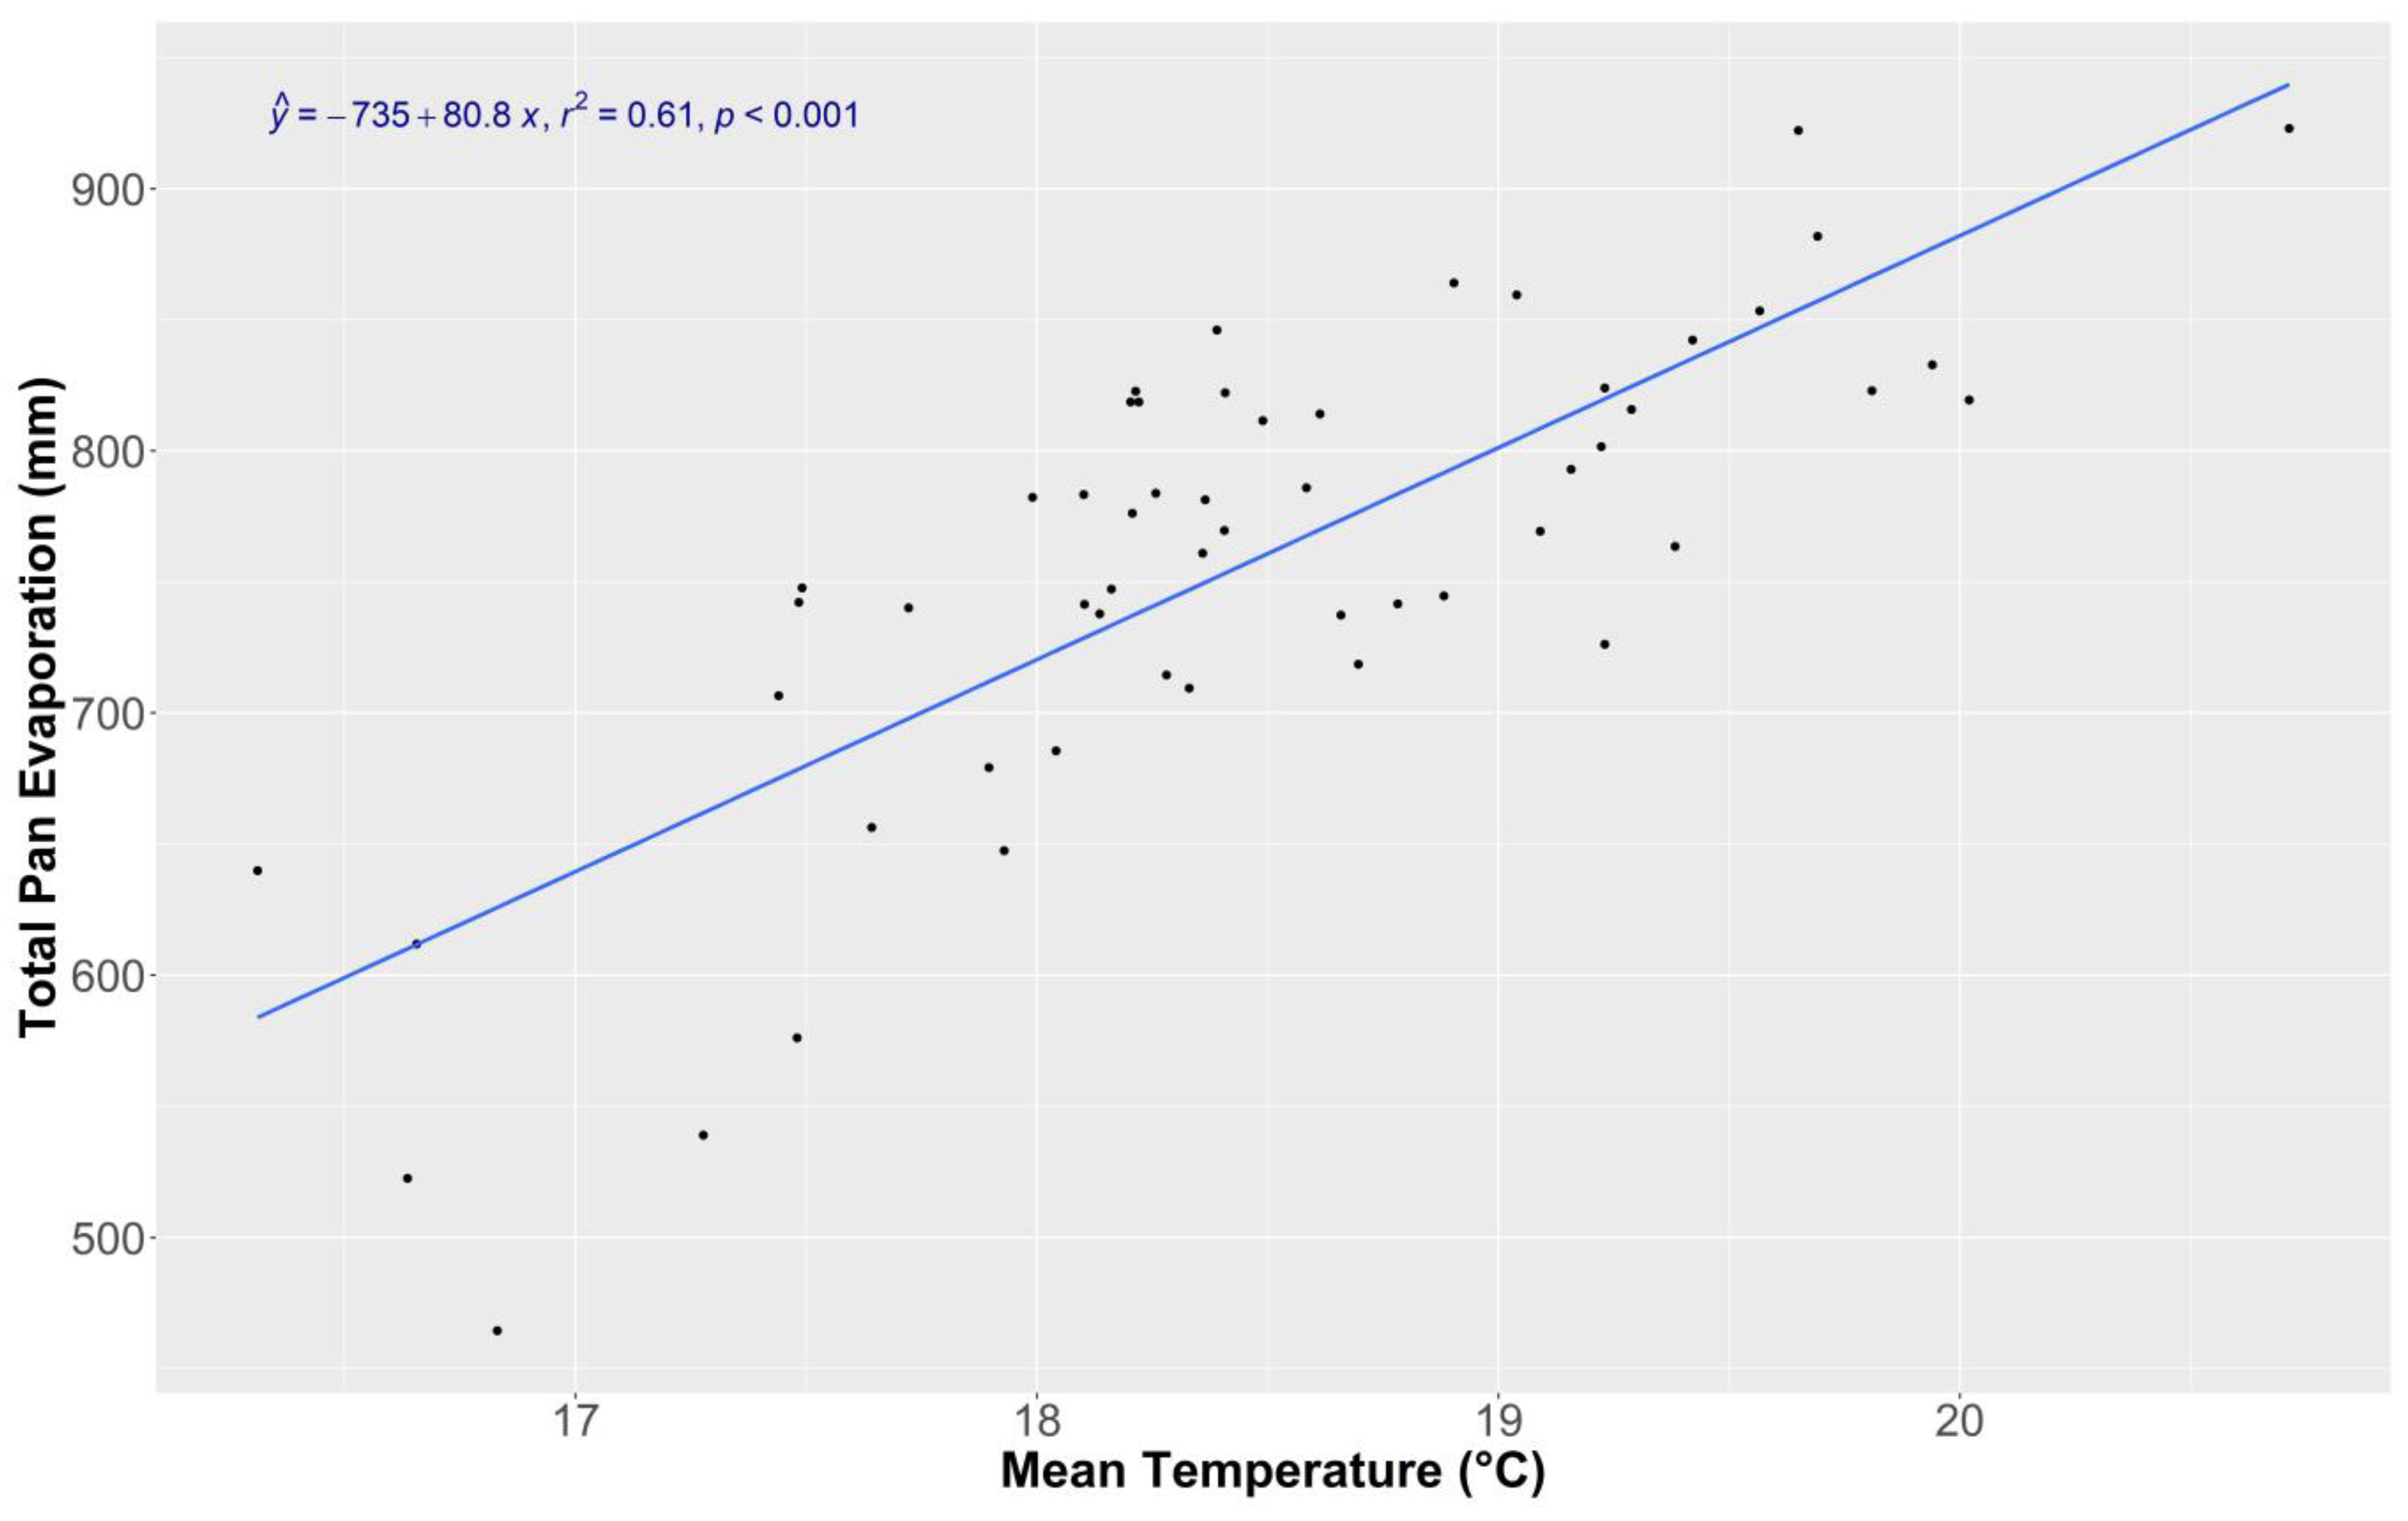
Increases in temperatures without increases in precipitation are important (Figure 1a,c) because higher temperatures will increase the evapotranspiration demand at the site and will contribute to lower yields due to higher water stress in non-irrigated systems, or even irrigated systems if the irrigation systems cannot fully meet water needs during the growing season (Figure 1a,c). We found that pan evaporation significantly increased during May to September from 1949 to 2019, going from 688 mm to 826 mm, a net increase of 138 mm with time (y = −3.21 × 10³ + 2x; p < 0.001; r2 = 0.22). During this period, we found that mean air temperature was a positive predictor of pan evaporation, and an increase from 16.3 to 20.7 °C would result in a net pan evaporation increase of 356 mm (p < 0.001; r2 = 0.61) (Figure 2). We suggest that these changes in pan evaporation due to temperature increases are an indicator that there will be negative impacts on dryland corn if the higher water needs cannot be met by precipitation alone.
When temperatures exceed 30 °C, they can potentially lead to corn stress [5,7,8,9], especially if they occur during tasseling and pollination. At our study site in Fort Collins, Colorado, tasseling and pollination occur during the month of July. We found that the number of SDD during the growing season increased from 26.5 days in 1900 to 49.5 in 2018 (y = −344 + 0.195x; p < 0.001; r2 = 0.25), from 5 days in June 1900 to 10.2 days in June 2018 (y = −79.2 + 0.0443x; p < 0.001; r2 = 0.12), and from 9.9 days in July 1900 to 18.5 days in July 2018 (y = −129 + 0.0731x; p < 0.001; r2 = 0.20).
The county’s harvested corn yield from 1963 to 2019 was positively predicted by GDD (y = −1.86 × 10³ + 7x; p < 0.01; r2 = 0.15). Increases in GDD during the growing season from May to September from 1160 GDD (°C) to 1580 GDD (°C) contributed to increasing harvested grain yields by 2940 kg ha−1 (oven-dried dry weight of 2484 kg ha−1). Additionally, average maximum temperatures for the growing season were predictors of county harvested corn yield for this period (y = −6.72 × 10³ + 547x; p < 0.01; r2 = 0.13). Increases in maximum temperatures from 23.7 °C to 29.4 °C contributed to increasing harvested grain yields by 3118 kg ha−1 (oven-dried dry weight of 2635 kg ha−1). Average minimum temperatures for this period also were predictors of yield (Figure 3; p < 0.001; r2 = 0.25). Increases in minimum temperatures from 9.4 °C to 12.1 °C contributed to an additional 3016 kg ha−1 (oven-dried dry weight of 2549 kg ha−1).
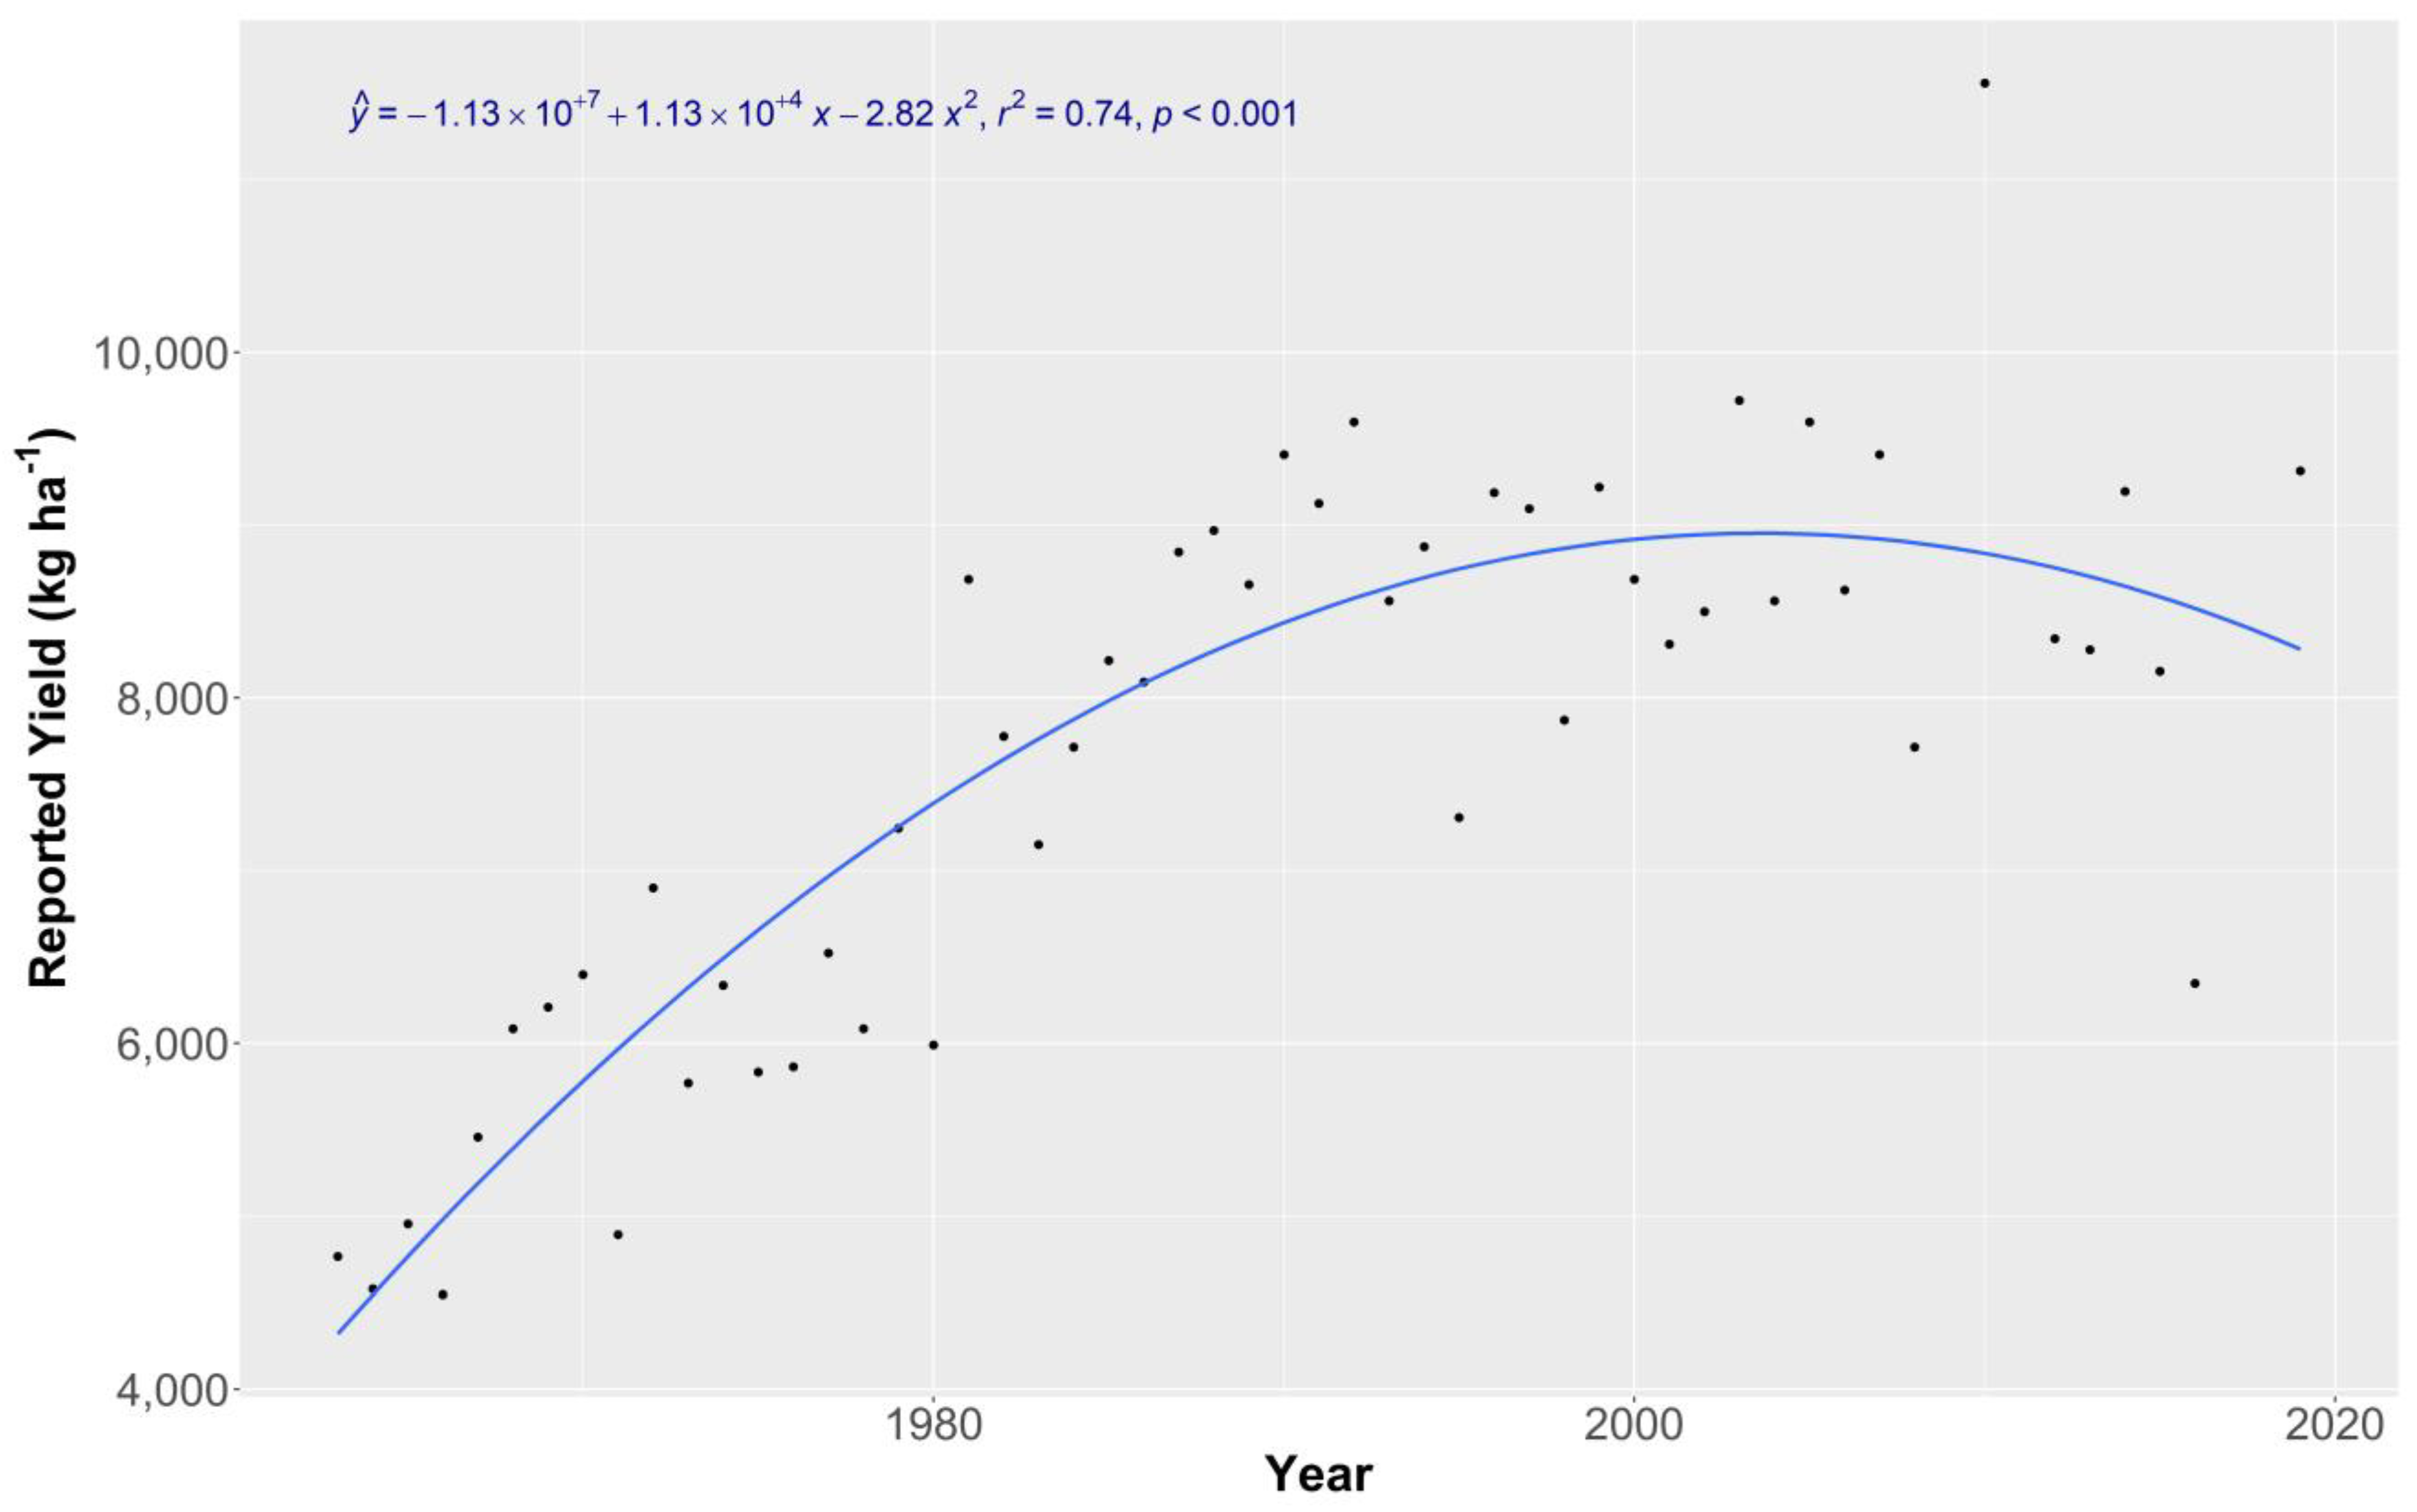
Average yields increased in the county from about 4000 kg ha−1 in 1963 to 9000 kg ha−1 in 2000 (Figure 4). Although improved varieties and management contributed to these increases in yields; higher GDD and higher maximum and minimum temperatures were also contributors, in agreement with findings from other researchers [10,17]. The quadratic relationship of productivity versus time in the last five plus decades shows that the yields started to plateau around the 1990s, have not increased since about 2000, and that there may be a slight trend downward since then (Figure 4; p < 0.001; r2 = 0.74).
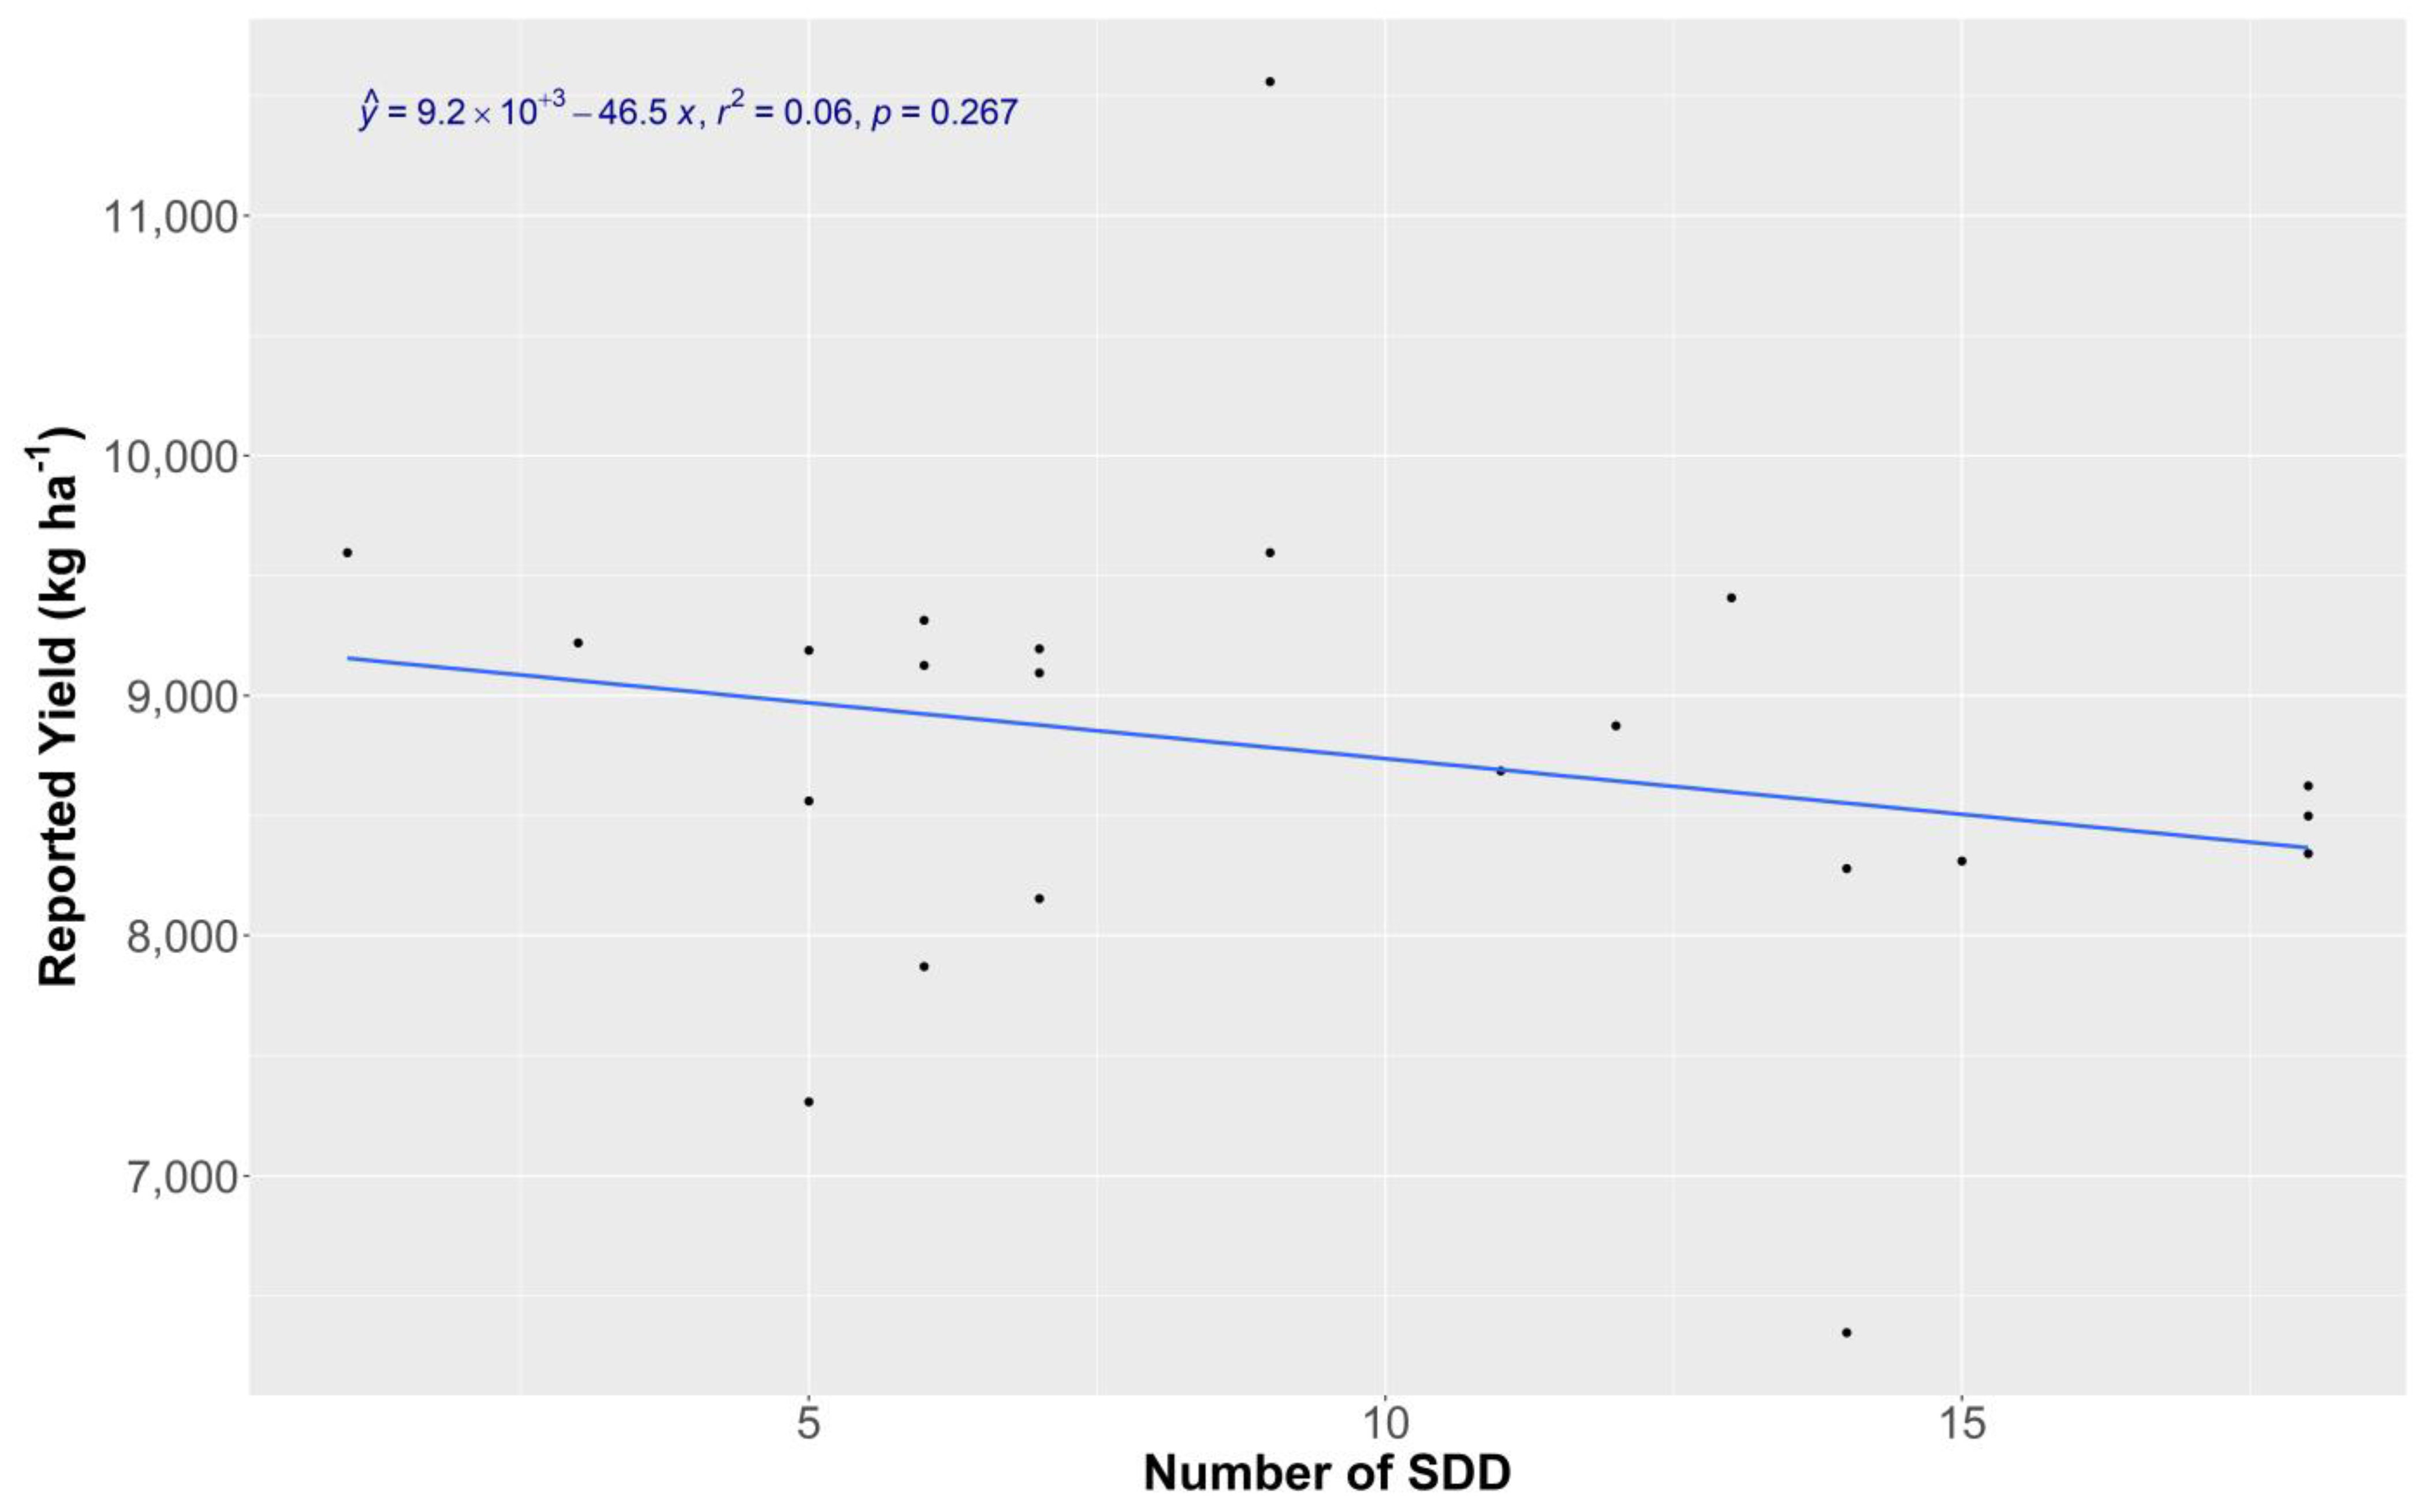
Although it was not significant at p < 0.10, we found a negative, downward trend between yields in the county in the last two decades and SDD in June (Figure 5; p = 0.267; r2 = 0.06). Since SDDs during the growing season and the month of June have been increasing since the 1900s (p < 0.001), and there is a negative trend between county yields since and SDD (Figure 5; p = 0.267) we suggest that higher SDD could potentially negatively impact corn yields at a regional level, despite the benefits of higher GDD and higher minimum temperatures in the irrigated systems.
These increases in SDD could negatively impact yields to such an extent in the future that they could erase the positive impacts of higher GDD in these irrigated systems, reducing corn yields. We propose that new hybrids resistant to higher SDDs could be an adaptation to these negative effects of a changing climate. The development of new varieties and agronomic practices will be essential to sustainably maintain and or increase yields to combat the food security threats posed by climate change. For example, the use of narrow rows for climate change adaptation in tillage systems at two sites near the long-term research plots was reported to increase harvested corn grain and corn silage production by 9.5 and 42.5%, respectively, when compared to the traditional planting distances used by the farmers in the region [22].

3.1.2. Long-Term Research Plots and Weather Analysis

Although average yields for all five of the different N rates have not changed since 2007, the GDD and nitrogen and water inputs helped explain the variation in yields from 2007 to 2018 at the site (Table 1). When the GDD and nitrogen and water inputs were considered in the multiple regression model analyses, the model explained a large portion of the irrigated corn yield variability from 2007 to 2018 at the site (Table 1) (r2 = 0.79). The multiple regression model found that GDD was a positive predictor of yields at p < 0.001 (Table 1). The multiple regression model found that total water input from precipitation and irrigation (p < 0.05) during the growing season, GDD (p < 0.001), and nitrogen fertilizer applications (p < 0.001) were positive predictors of yields (Table 1).
Climate change is already occurring (Figure 1), and changes in minimum temperatures during the last 12 years are an indicator of recent changes (Table 2). Although in the shorter time frame of 12 years (2007 to 2018) we could not detect significant increases in maximum or average temperatures during the growing period with the weather data collected at the site (CoAgMET station # FTC03), nor could we detect changes in maximum temperatures during the month of September, we were able to detect a significant increase in average minimum temperatures during September from 2007 to 2018 (p < 0.100; Table 2) when the R4, R5, and R6 stages for corn occurred. The total change in minimum temperatures for September from 2007 to 2018 was 1.5 °C, or 0.137 °C yr−1 (Table 2; CoAgMET station # FTC03).
Minimum temperatures were a positive predictor of yields with the long-term research plots (Table 2 and Table 3). Increases in minimum temperatures from planting to maturity (R6) from 2007 to 2018 contributed to increasing the average harvested grain yields of the fertilized treatments by an average of 1289 kg ha−1 (Table 3). The highest increase of 1998 kg ha−1 was for the middle rate of 134 kg N ha−1 (Table 3). We cannot explain why the increase in minimum temperatures explained a higher percentage of the variability for the intermediate nitrogen rates of 67; 134; and 202 kg N ha−1 higher r2) than for the zero N fertilizer or extremely high nitrogen fertilizer application of 246 kg N ha−1 (Table 3). Although we found that increases in minimum temperature were a positive predictor of corn yields, we do not know the specific physiological mechanism of the plant that triggers these higher yields. We propose that warmer minimum temperatures in this high-altitude (1523 m) irrigated corn system improve the crop’s physiological response, contributing to higher yields, provided that no water stress is induced by the higher temperatures.
We propose that higher temperatures could contribute to higher mineralization at the soil surface and higher crop residue decomposition that may contribute to cycling of nitrogen from organic matter to the corn, and that this may benefit the middle nitrogen rates, which align with recommended application rates for nitrogen fertilizer. We suggest that the higher N rates may apply more nitrogen than needed and the effects of higher temperatures and nitrogen cycling may not impact this response. The responses to N rates and higher air temperatures suggest an air–plant and soil interaction when there is no water deficit that contributes to higher corn yields.
The county increases of 2464 kg ha−1 (oven-dried dry weight) harvested corn due to the minimum temperatures from 1963 to 2019 are within the range predicted due to the minimum temperatures from 2007 to 2018 of 1902 to 2891 kg ha−1. Although we did not detect increases in minimum temperatures during the growing season from 2007 to 2018, we detected increases in minimum temperatures from 2007 to 2018 for the month of September (Table 2). This is an indicator that minimum temperatures are increasing, since we detected increases in minimum temperatures over longer time scales (from 1900 to 2019, and from 1963 to 2019). Additionally, the data suggest that the growing season (May to September) has been expanding, as indicated by the significant increase in GDD from 1900 to 2019 (Figure 1) of 245 GDD (°C). We propose that the long-term research plots’ yield responses to effects of temperatures could be applied to assess the responses to temperatures changes at a regional level.

3.2. Conclusions

Our long-term plot research shows that at the site climate change has been occurring during the last 120 years, and increases in minimum temperatures are an indicator of climatic changes during the last decade. These higher average minimum temperatures have contributed to higher yields of irrigated corn at the site. Although GDDs were a positive predictor of higher yields for these irrigated corn systems, the fact that we also found that changes in maximum and minimum temperatures at the county level, as well as changes in minimum temperatures with the long-term research plots at a shorter time scale, were positively impacting plant physiological responses (yields) suggests that with respect to assessing the effects of climate change, it is not only about the impacts during the entire growing season. It is also about the sum of specific changes at different stages of the growing season and how these changes end up affecting final yields.
The temperatures and the number of days with temperatures above 30 °C during July have been increasing during the last 100 years. Since corn tasseling and pollination occur in July at this site, important cropping systems such as corn could be severely impacted in the future. The record-breaking extreme heat that continues to bake the upper Midwest, southern plains, and Gulf Coast as of June 2022 [23] could also happen in the future in western central regions of the US (e.g., Colorado, Nebraska, Kansas). Understanding of these impacts on the different stages of corn vegetative and/or reproductive growth will be important for improvement in modeling assessments of the effects of future climate change scenarios on corn, the world’s #1 crop in tonnage production.
This study shows that increases in GDD and minimum temperatures, as found by using both the county-level data and the long-term research plot data, are important and contributed to higher yields of irrigated systems in this region. However, we also found that SDDs could potentially be a negative predictor of yields and increases in these extreme temperatures during the last 100 years could also be impacting irrigated corn yields. Based on this long-term field plot data, we also propose that the current effects of climatic change on non-irrigated dryland corn are already negatively impacting yields.
Practices such as shifting planting zones northwards or planting earlier or later in the season may be management options, but this will also depend on how widespread the climate change impacts are across the region. We suggest water management is a conservation practice that can help in efforts to adapt to a changing climate, but rising temperatures will increase demand for irrigation, consuming valuable water resources needed to sustain agriculture. Therefore, the development of new corn varieties that could have higher water use efficiencies as well as higher nitrogen use efficiencies and greater tolerance to higher temperatures (SDD) will be a more sustainable practice. Narrow row management in sprinkler-irrigated systems increased yields, and both nitrogen and water-use efficiencies [24]. This analysis suggests that, in the near future, we will have to start considering how to implement management practices to adapt to these imminent impacts of climate change on the physiological responses of key crops such as corn.

Supplementary Materials

Supporting information (databases and metadata) can be downloaded at: https://www.mdpi.com/article/10.3390/crops4030026/s1.

Author Contributions

Conceptualization: J.A.D., R.E.D. and A.H.V.; methodology: J.A.D., A.H.V. and R.E.D.; software, J.A.D., R.E.D. and A.H.V.; validation, J.A.D., R.E.D. and A.H.V.; formal analysis, J.A.D., R.E.D. and A.H.V.; investigation: J.A.D., R.E.D., A.H.V., A.D.H., C.E.S., J.A., S.J.D.G., D.K.M. and B.A.F.; data curation, J.A.D., R.E.D. and A.D.H.; writing—original draft: J.A.D.; writing—review and editing: J.A.D., R.E.D., A.H.V., A.D.H., C.E.S., J.A., S.J.D.G., D.K.M. and B.A.F.; visualization: J.A.D., A.H.V. and R.E.D.; supervision: J.A.D., A.D.H., C.E.S., S.J.D.G. and D.K.M.; project Administration: J.A.D., A.D.H., C.E.S., S.J.D.G., D.K.M., B.A.F. and R.E.D. All authors have read and agreed to the published version of the manuscript.

Funding

No external funding received for this study.

Data Availability Statement

The datasets associated with this paper will be made available in the AgData Commons repository at a later date (https://agdatacommons.nal.usda.gov/) and is also included as Supplementary Materials to this paper.

Conflicts of Interest

The authors declare no conflicts of interest.

References

  1. Delgado, J.A.; Groffman, P.M.; Nearing, M.A.; Goddard, T.; Reicosky, D.; Lal, R.; Kitchen, N.R.; Rice, C.W.; Towery, D.; Salon, P. Conservation practices to mitigate and adapt to climate change. J. Soil Water Conserv. 2011, 66, 118A–129A. [Google Scholar] [CrossRef]
  2. Cusser, S.; Bahlai, C.; Swinton, S.M.; Robertson, G.P.; Haddad, N.M. Long-term research avoids spurious and misleading trends in sustainability attributes of no-till. Glob. Chang. Biol. 2020, 26, 3715–3725. [Google Scholar] [CrossRef]
  3. Delgado, J.A.; Halvorson, A.D.; D’Adamo, R.; Stewart, C.E.; Floyd, B.; Del Grosso, S. Long-term nitrogen balance of an irrigated no-till soil-corn system. J. Nutr. Cycl. 2023, 126, 229–243. [Google Scholar] [CrossRef]
  4. Zhao, C.; Liu, B.; Piao, S.; Wang, X.; Lobell, D.B.; Huang, Y.; Huang, M.; Yao, Y.; Bassu, S.; Ciais, P.; et al. Temperature increase reduces global yields of major crops in four independent estimates. Proc. Natl. Acad. Sci. USA 2017, 114, 9326–9331. [Google Scholar] [CrossRef] [PubMed]
  5. Hatfield, J.L.; Boote, K.J.; Kimball, B.A.; Ziska, L.H.; Izaurralde, R.C.; Ort, D.; Thomson, A.M.; Wolfe, D. Climate impacts on agriculture: Implications for crop reduction. Agron. J. 2011, 103, 351–370. [Google Scholar] [CrossRef]
  6. Hatfield, J.L.; Dold, C. Climate change impacts on corn phenology and productivity. In Corn—Production and Human Health in a Changing Climate; Amanullah and Shah Fahad; IntechOpen: London, UK, 2018; pp. 95–114. [Google Scholar] [CrossRef]
  7. Olesen, J.E.; Bindi, M. Consequences of climate change for European agricultural productivity, land use and policy. Eur. J. Agron. 2002, 16, 239–262. [Google Scholar] [CrossRef]
  8. Thomson, A.M.; Brown, R.A.; Rosenberg, N.J.; Izaurralde, R.C.; Benson, V. Climate change impacts for the conterminous USA: An integrated assessment. Part. 3. Dryland production of grain and forage crops. Clim. Chang. 2005, 69, 43–65. [Google Scholar] [CrossRef]
  9. Ko, J.H.; Ahuja, L.R.; Saseendran, S.A.; Green, T.R.; Ma, L.; Nielsen, D.C.; Walthall, C.L. Climate change impacts on dryland cropping systems in the Central Great Plains, USA. Clim. Chang. 2012, 111, 445–472. [Google Scholar] [CrossRef]
  10. Leng, G. Evidence for a weakening strength of temperature-corn yield relation in the United States during 1980–2010. Sci. Total Environ. 2017, 605–606, 551–558. [Google Scholar] [CrossRef] [PubMed]
  11. Hu, Q.; Ma, X.; Pan, X.; Binxiang, H. Climate warming changed the planting boundaries of varieties of summer corn with different maturity levels in the North China Plain. J. Appl. Meteorol. Clim. 2019, 58, 2605–2615. [Google Scholar] [CrossRef]
  12. Brown, D.M. Heat Units for Corn in Southern Ontario; Food Factsheet Agdex 111.30: 4; Ontario Ministry of Agriculture: Guelph, ON, Canada, 1969.
  13. Wang, Y.; Zhang, L.; Zhou, N.; Xu, L.; Zhu, J.; Tao, H.; Huang, S.; Wang, P. Late harvest and foliar fungicide acted together to minimize climate change effects on summer maize yield in the North China Plain during 1954–2015. Agric. Ecosyst. Environ. 2018, 265, 535–543. [Google Scholar] [CrossRef]
  14. Feng, S.; Hu, Q. Changes in agro-meteorological indicators in the contiguous United States: 1951–2000. Theor. Appl. Climatol. 2004, 78, 247–264. [Google Scholar] [CrossRef]
  15. Schlenker, W.; Roberts, M.J. Nonlinear temperature effects indicate severe damages to U.S. crop yields under climate change. Proc. Natl. Acad. Sci. USA 2009, 106, 15594–15598. [Google Scholar] [CrossRef] [PubMed]
  16. Petersen, L.K. Impact of climate change on twenty-first century crop yields in the U.S. Climate 2019, 7, 40. [Google Scholar] [CrossRef]
  17. He, W.; Yang, J.Y.; Drury, C.F.; Smith, W.N.; Grant, B.B.; He, P.; Qian, B.; Zhou, W.; Hoogenboomd, G. Estimating the impacts of climate change on crop yields and N2O emissions for conventional and no-tillage in Southwestern Ontario, Canada. Agric. Syst. 2018, 159, 187–198. [Google Scholar] [CrossRef]
  18. Drury, C.F.; Tan, C.S.; Welacky, T.W.; Oloya, T.O.; Hamill, A.F.; Weaver, S.E. Red clover and tillage influence on soil temperature, water content, and corn emergence. Agron. J. 1999, 91, 101–108. [Google Scholar]
  19. Hu, Q.; Buyanovsky, G. Climate effects on corn yield in Missouri. J. Appl. Meteorol. 2003, 42, 1626–1635. [Google Scholar] [CrossRef]
  20. Pearl, J. Causality: Models, Reasoning and Inference, 2nd ed.; Cambridge University Press: Cambridge, UK, 2009. [Google Scholar]
  21. R Core Team. R: A Language and Environment for Statistical Computing; R Foundation for Statistical Computing: Vienna, Austria, 2021; Available online: https://www.R-project.org (accessed on 4 August 2024).
  22. Mix, K.; Lopez, V.L.; Rast, W. Annual and growing season temperature changes in the San Luis Valley, Colorado. Water Air Soil Pollut. 2011, 220, 189–203. [Google Scholar] [CrossRef]
  23. ABC News. Record-Breaking Temperatures across Country. 21 June 2022. ABC News YouTube Channel. 2022. Available online: https://www.youtube.com/watch?v=wvWN5-Sa1ds (accessed on 21 June 2022).
  24. Delgado, J.A.; Floyd, B.; Brandt, A.D.; D’Adamo, R. Use of narrow rows in sprinkler-irrigated corn systems to increase grain yields, aboveground biomass, and water and nitrogen use efficiencies. Agronomy 2022, 12, 82. [Google Scholar] [CrossRef]
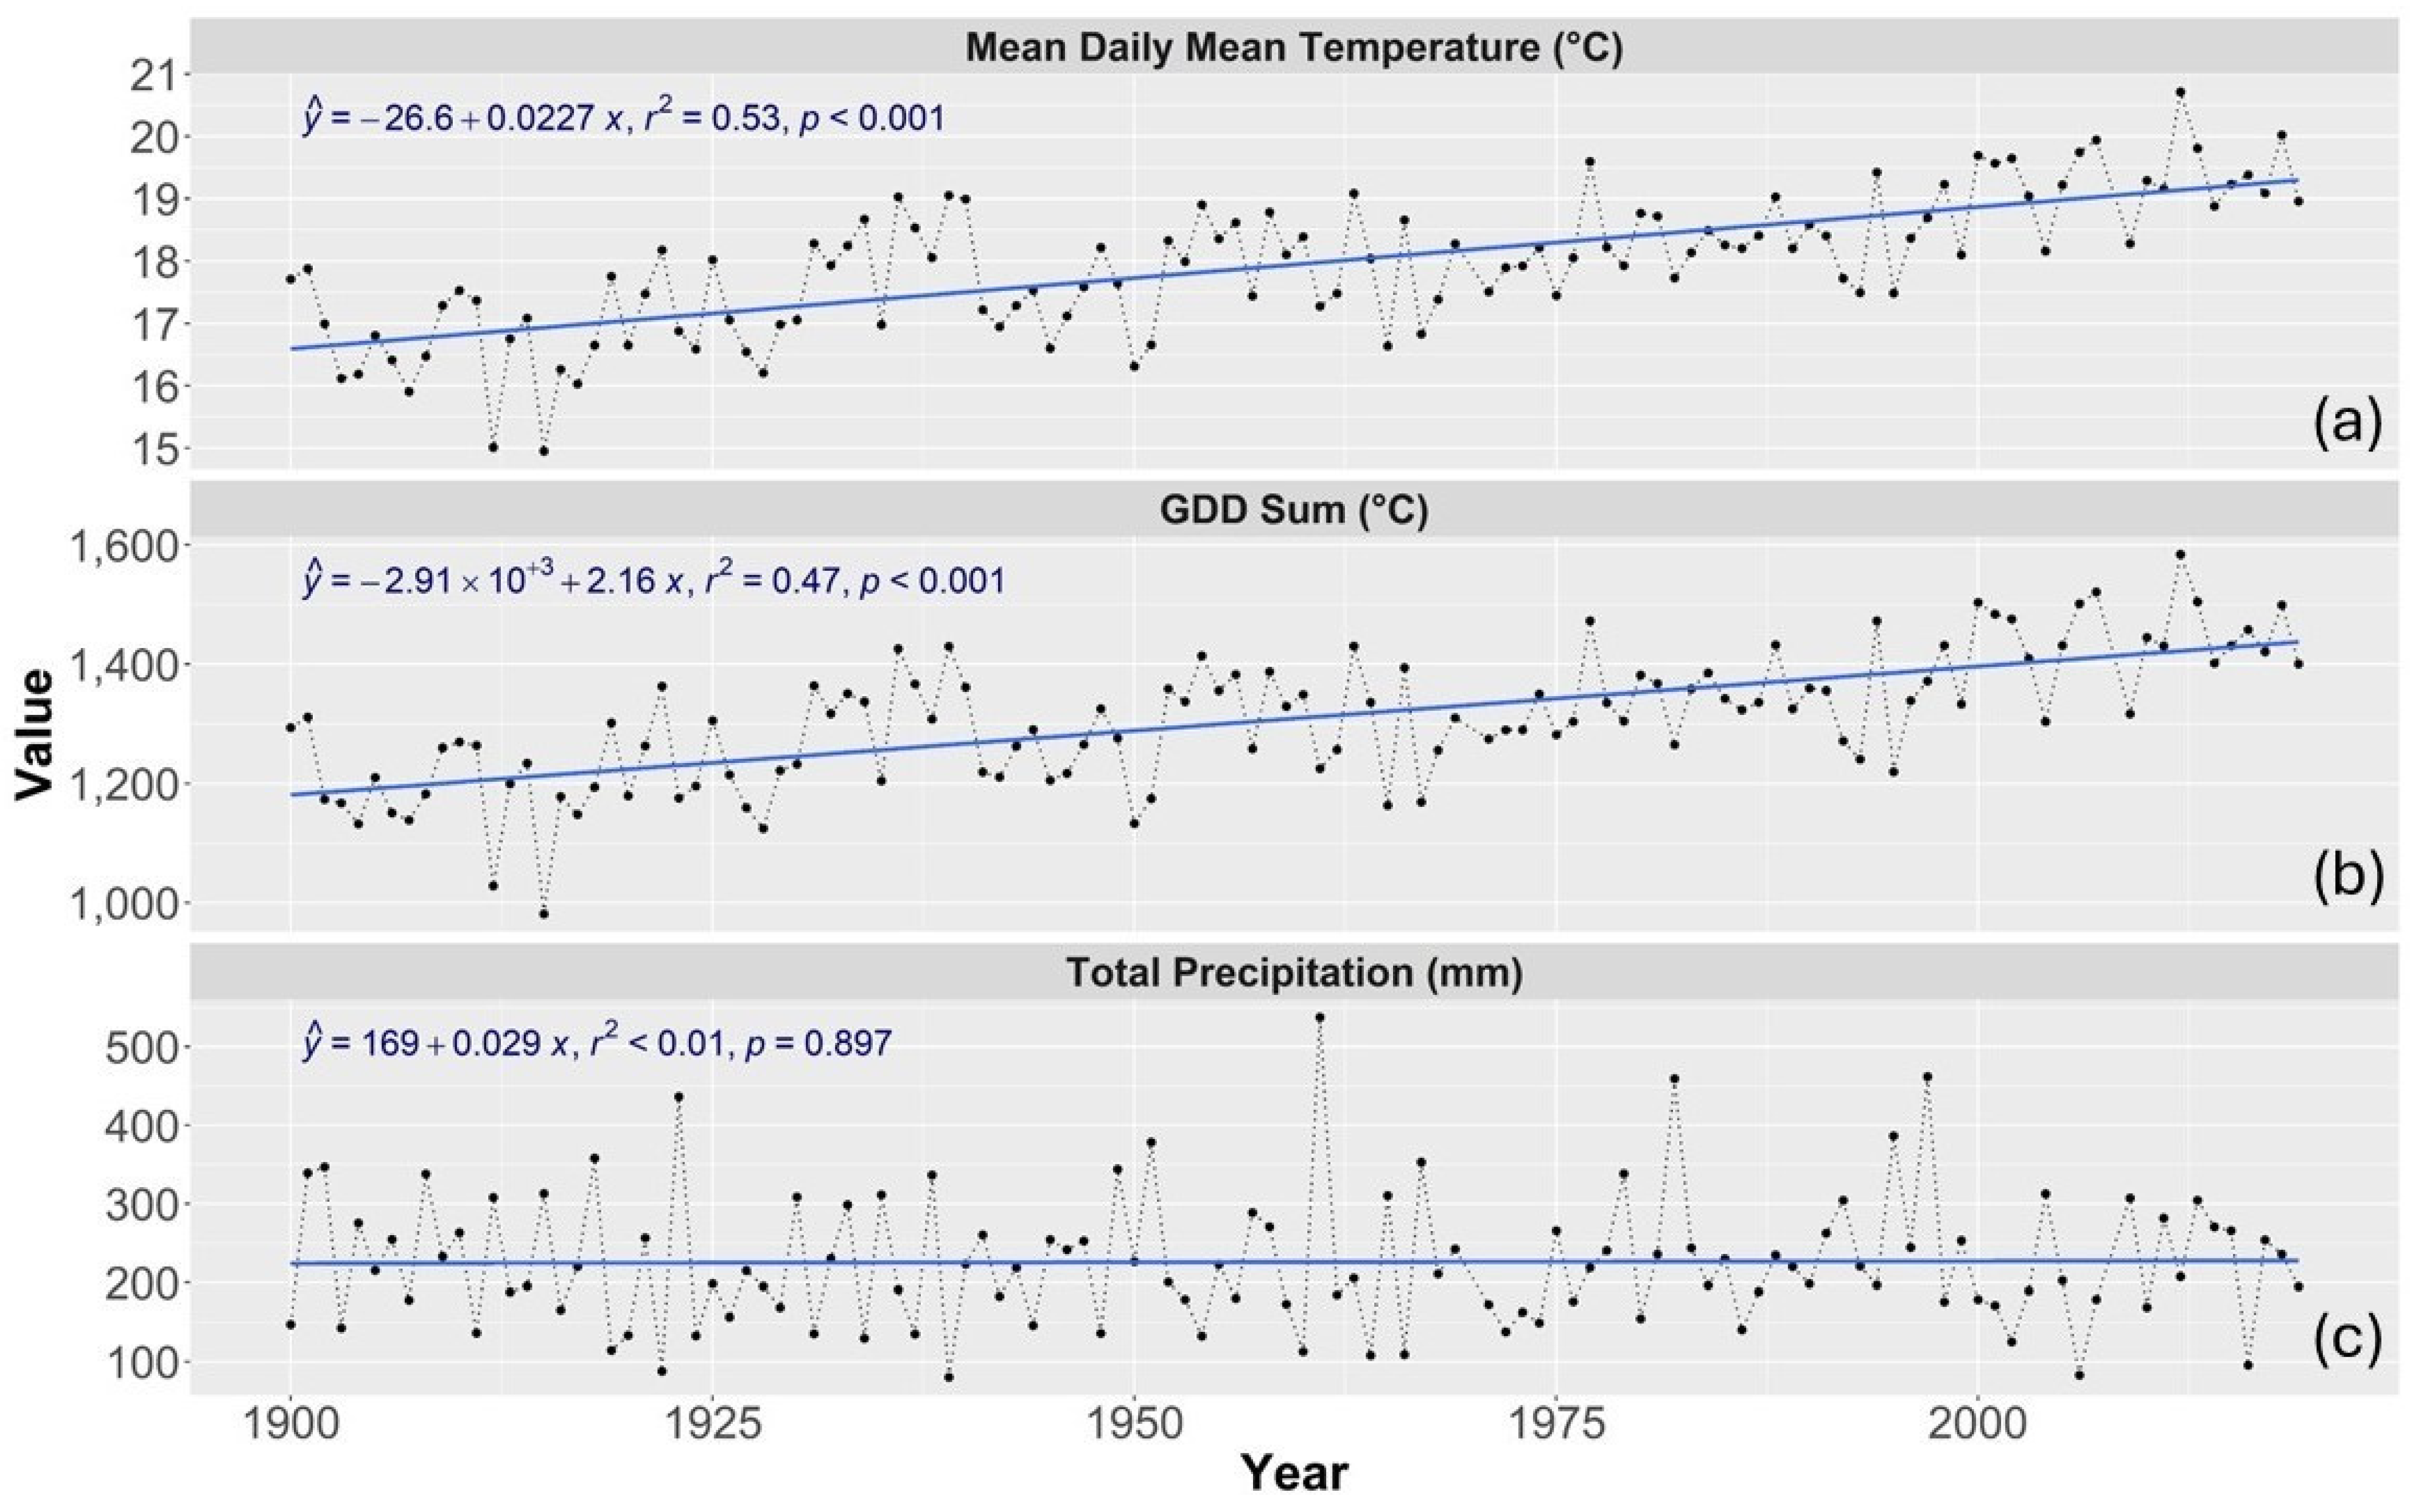
Figure 1. Changes in average temperature (a), growing degree days (GDD) (b), and total precipitation (c) during the corn growing season from 1900 to 2019 in Fort Collins, Colorado (Data from National Oceanic and Atmospheric Administration [NOAA] station ID #: GHCND:USC00053005). Note: Daily mean temperature (T_mean) was calculated from the daily maximum temperature (T_max) and daily minimum temperature (T_min) as follows: T_mean = (T_max + T_min)/2).
Crops 04 00026 g001
Figure 2. CSU pan evaporation vs. mean daily temperature, May-September, Selected Years, 1949–2019. Weather information collected at NOAA station ID #: GHCND:USC00053005. Note that daily mean temperature (T_mean) was calculated from the daily maximum temperature (T_max) and daily minimum temperature (T_min) as follows: T_mean = (T_max + T_min)/2).
Crops 04 00026 g002
Figure 3. Average harvested corn yields (15.5% water content) in Larimer County, Colorado versus average minimum temperatures during the corn growing season, May to September, from 1963 to 2019 (data from NOAA station ID # GHCND:USC00053005).
Crops 04 00026 g003
Figure 4. Average harvested corn yields (15.5% water content) in Larimer County, Colorado from 1963 to 2019.
Crops 04 00026 g004
Figure 5. Average harvested corn yields (15.5% water content) in Larimer County versus June Stress Degree Days (SDD), from 1991 to 2018 (data from National Oceanic and Atmospheric Administration [NOAA] station ID # GHCND:USC00053005).
Crops 04 00026 g005
Table 1. Results from the Ordinary Least Squares (OLS) multiple regression model used to analyze effects of weather and water and nitrogen inputs on irrigated corn yields.
VARIABLESRegression
Yield (kg ha−1)
Total Applied N (kg ha−1)20.4 ***
(0.9)
Total Water15.2 **
(6.0)
Dekalb DKC42-91 RR/YG a686.0
(574.7)
Dekalb DKC42-72 RR/YG a−1797.3
(1112.4)
Dekalb DKC42-72 RR/YGVT a−862.0 ***
(324.2)
Dekalb DKC42-72 RR/YGVT3 a−2492.4 ***
(846.6)
Dekalb DKC43-48 RIB GENVT3P a−1633.6 **
(745.6)
Channel 192-09VT3PRIB Blend w/A250 a−3759.2 **
(1494.7)
Channel 193-53 STXRIB−2879.7 **
(1166.4)
Sum of GDD (°C) b 17.6 ***
(6.4)
Constant−25,349.5 **
(11,379.6)
Observations148
R-squared0.79
Notes: Robust standard errors in parentheses. *** p < 0.01, ** p < 0.05. a Corn hybrid seed type. b GDD = growing degree days.
Table 2. Trend a in minimum air temperatures at the Halvorson long-term research plots established at Colorado State University’s Agricultural Research, Development and Education Center (ARDEC) near Fort Collins, Colorado, during the month of September b from 2007 to 2018. Weather information collected at CoAgMET stations # FTC03 and FCL01.
Corn Growing PeriodTemperatureIntercept (bo)
(°C)
Slope (b1)
(°C yr−1)
Coefficient of Determination (r2)p Value
September (CoAgMET)Maximum−2650.1440.130.256
Minimum−2670.1370.270.086
a bo, intercept (°C); b1, slope, (°C yr−1); r2, linear coefficient of determination; p, probability value; from increasing minimum temperature from 2007 to 2018. b These results are for the full month of September, and not just the portion of September ending at corn physiological maturity.
Table 3. Regression a results of long-term yields of sprinkler-irrigated continuous corn grown in a Fort Collins clay loam versus mean daily minimum air temperature during each growing season (x-axis) at the Halvorson long-term research plots established at Colorado State University’s Agricultural Research, Development and Education Center (ARDEC) near Fort Collins, Colorado, from 2007 to 2018 for different nitrogen (N) fertilizer rates. The growing periods that ended in September (R6), ended on the day in September when physiological maturity (R6) was reached. Harvested yields (y axis) expressed oven-dried dry-weight harvested grain in kg N ha−1. Weather information was collected at CoAgMET stations # FTC03 and FCL01.
Nitrogen TreatmentGrowing PeriodMinimum Temperature
kg N ha−1 Intercept (bo) (kg ha−1)Slope (b1)
(kg ha−1 °C−1)
Coefficient of Determination (r2)p ValueDelta Yield
(kg ha−1)
0Planting Through maturity (R6)34021750.050.222404
67Planting Through maturity (R6)30014770.210.0101100
134Planting Through maturity (R6)7998660.36<0.001 1998
202Planting Through maturity (R6)42315590.220.0111290
246Planting Through maturity (R6)69683320.130.060766
a bo, intercept (kg ha−1); b1, slope (kg ha−1 °C−1); r2, linear coefficient of determination; p, probability value; delta yield, increase in yield (kg ha−1) from increasing minimum temperature from 9.3 to 11.6 °C during the 2007 to 2018 time scale.
Disclaimer/Publisher’s Note: The statements, opinions and data contained in all publications are solely those of the individual author(s) and contributor(s) and not of MDPI and/or the editor(s). MDPI and/or the editor(s) disclaim responsibility for any injury to people or property resulting from any ideas, methods, instructions or products referred to in the content.