Article

Investigating Genetic Diversity and Population Structure in Rice Breeding from Association Mapping of 116 Accessions Using 64 Polymorphic SSR Markers

1
Department of Plant Molecular Biology and Genetic Engineering, Acharya Narendra Deva University of Agriculture & Technology, Ayodhya 224229, India
2
Department of Plant Biotechnology, College of Biotechnology, Uttar Pradesh Pandit Deen Dayal Upadhyaya Pashu Chikitsa Vigyan Vishwavidyalaya Evam Go-Anusandhan Sansthan (DUVASU), Mathura 281001, India
3
Department of Translational Medicine, University of Ferrara, 44121 Ferrara, Italy
4
Centre Haemostasis & Thrombosis, University of Ferrara, 44121 Ferrara, Italy
5
Division of Genetics, ICAR- Indian Agricultural Research Institute, New Delhi 110012, India
6
Department of Biotechnology & Crop Improvement, Rani Laxmi Bai Central Agricultural University, Jhansi 284003, India
7
Center for Advanced Materials (CAM), Department of Mechanical and Industrial Engineering, Qatar University, Doha P.O. Box 2713, Qatar
8
German Federal Institute for Risk Assesment (BfR), 10589 Berlin, Germany
*
Authors to whom correspondence should be addressed.
Crops 2024, 4(2), 180-194; https://doi.org/10.3390/crops4020014
Submission received: 14 March 2024 / Revised: 21 April 2024 / Accepted: 13 May 2024 / Published: 23 May 2024

Abstract

:
Genetic variability in rice breeding programs plays a very crucial role. It provides an outstanding pool of superior alleles governing better agronomic and quality characters through association mapping. For a greater understanding of population structure, the genetic relationship among different rice lines is indispensable prior to the setting of a correlation among dynamic alleles and traits. In the present investigation, the genetic diversity and population structure of 116 rice accessions were studied to understand genetic relatedness and diversity among them using 64 polymorphic SSR markers. A genotyping assessment based on SSR markers revealed a total of 225 alleles, with an average PIC value of 0.755. The germplasm lines were classified into three distinct subgroups through population structure analysis, utilizing both model- and distance-based approaches. AMOVA analysis showed that 11% of the total variation could be attributed to differences between groups, while the remaining 89% was likely due to differences within groups. This study suggested that population structure and genetic relatedness should be considered to establish marker–trait associations for association mapping when working with the core collection of germplasm lines.

1. Introduction

Rice (Oryza sativa L.) is an important staple crop grown in more than 100 countries, primarily farmed in Asian countries, and consumed by more than half of the global population to fulfil the calorific requirements [1,2]. The consumption of rice is expected to be approximately 800–900 million tons (mt) by 2025 compared with the current production of 516 mt on the basis of milled rice [3]. The higher production and productivity, attributed to the richness of genetic diversity in Indian germplasm, and its accessibility has reached saturation level and is stagnating. Now, we need to explore thoroughly the targeted traits based on genetic principles in order to manipulate them for improvement in yield traits, resistance to biotic and abiotic stresses, and quality parameters. Quantitative trait loci (QTL) mapping is a widely used approach for identifying the genetic basis of important agronomic traits in natural populations which involves either linkage mapping or LD mapping. In order to ensure global food security by developing improved rice cultivars with better tolerance against diseases and abiotic stresses like drought, flooding, salt, etc., specific traits need to be mapped and utilized in breeding programs [4].
The effects of climate change on the Earth’s surface and atmosphere include increased temperatures, uneven precipitation, floods, and submergence [5]. Several quantitative trait loci (QTLs) have been identified for submergence tolerance derived from different populations [6,7,8,9,10,11]. In order to boost rice yield with excellent quality, a careful process need to be followed, keeping in view the constantly growing population and changing climate spectrum with the abiotic factors like drought, salt, temperature, pollution, and other reducing factors for rice productivity. Breeders are interested in the genetic enhancement of rice productivity, and rice with desirable nutritional quality attributes and have been concerned about its high productivity [12]. The availability of genetic variability and the awareness of its importance play crucial roles in every genetic improvement program for ensuring responsible use as well as for selecting effective breeding tactics [13]. The impact of genetic variability and the heritability of the advantageous makeup determine the breeding program’s overall effectiveness. The diverse gene pool of rice accessions provides breeders with the chance to pick out desired features and combine them in novel ways.
There are numerous methods available to examine genetic diversity at both genotypic and phenotypic levels. One of the greatest ways to examine genotypic variety in rice is the use of molecular markers. These markers can identify significant changes among accessions at the DNA level, making them a more effective and well-thought-out tool for the characterization and genetic make-up of accessions. Among several techniques, SSR is one of the most popular, effective, and reasonably priced techniques for the genetic characterization of germplasm. These SSR markers are known for their co-dominant and specific nature, as well as their high level of allelic diversity, relative polymorphism abundance, and wide distribution across the genome. Consequently, SSR markers have proven to be effective in establishing genetic links [14,15]. Due to their multi-allelic and highly polymorphic nature, SSR markers can provide a better genetic diversity spectrum even when used in smaller numbers. In this way, SSR markers play a crucial role in identifying genetic polymorphisms and showcasing high allelic diversity. These markers are commonly used to investigate the nuances of genetic variation among closely related rice accessions [16].
To ensure accurate association mapping in a population, it is crucial to ascertain the population structure. This step reduces type I and II errors resulting from uneven allele frequency distribution between subgroups, which may lead to false associations between molecular markers and the trait of interest [17]. Recent efforts have been made to define the population structure in various crops, including rice, using diverse germplasm lines, including the development of core collections from national and international collections [18,19,20,21,22,23]. Previous studies utilized SSR markers alone [19,24,25,26,27] or in conjunction with SNP markers [28,29] for similar investigations. The present study aims to evaluate the genetic variation and to examine the population structure of 116 rice germplasm accessions, including local landraces, improved varieties, and exotic lines from diverse origins. This study will be helpful in obtaining insights into the relatedness of individuals based on this genetic information and aid in classifying genotypes based on similarity patterns in the panel of rice genotypes for marker trait associations, specifically for submergence tolerance and other agronomic traits.

2. Materials and Methods

2.1. Plant Material and DNA Extraction

In this study, a collection of 116 rice genotypes was utilized. The experimental work was conducted at the Crop Physiology Experimental Plot, while molecular analysis was performed at the PG Lab, Department of Plant Molecular Biology and Genetic Engineering, Acharya Narendra Dev University of Agriculture and Technology, Ayodhya, Uttar Pradesh, India. For the molecular studies, one-month-old plant leaves were collected, and complete genomic DNA was isolated using the CTAB method [30]. Briefly, the leaf samples were ground with liquid nitrogen and mixed with pre-heated 2% extraction buffer (20 mM EDTA, 1.5 M NaCl, 100 mM Tris HCL, 2% CTAB, and 1% β-Mercaptoethanol). The mixture underwent treatment with chloroform: isoamyl alcohol (25:1), 100 mg/mL RNase, and 70% ethanol. Subsequently, it was incubated in a water bath at 65 °C for 45 min with gentle shaking in between. The resulting pellet was dissolved in 1X TE buffer. The quality of the extracted genomic DNA was assessed using a 0.8% agarose gel and quantified using a spectrophotometer nanodrop (Thermo Scientific, Wilmington, DE, USA). The DNA was then diluted to 20 ng/μL in TE buffer for PCR amplification.

2.2. SSR Genotyping and Data Analysis

For investigating rice diversity, a set of 64 highly polymorphic SSR primers were selected from the website “https://archive.gramene.org/markers/microsat/50ssr.html (accessed on 8 July 2023)”. To assess the amplification and suitability of each primer for future genotyping of the remaining accessions, four genomic DNA samples were initially amplified using 30 SSR primers. PCR amplification was conducted in a 10 μL reaction volume, consisting of 20 ng DNA, 1X PCR master mix (GeNei Labs, Bengaluru, India), and 5 pmol each of the forward and reverse primers. The amplification process was carried out using a C1000 thermal cycler (Bio-Rad Laboratories Inc., Berkeley, CA, USA) with the following conditions: pre-denaturation at 95 °C for 5 min, followed by 39 cycles of denaturation at 95 °C for 30 s, annealing at 53–58 °C (specific to each primer) for 45 s, extension at 72 °C for 1 min, and a final extension at 72 °C for 10 min. Standard molecular weight size markers, such as the 100 bp DNA ladder (GeNei Labs, Bengaluru, India), were used to determine the size of the most intensely amplified bands around each microsatellite marker, based on the estimated product size listed on the GRAMENE website.
Based on the existence of a certain size allele in each of the germplasm samples, an allele score was assigned. An allele’s existence was indicated by 1 and its absence by 0, and it was manually checked again. Both allele size and a binary matrix were used to grade the SSR genotyping results (0–1). The allelic data were analyzed using Power Marker Software to calculate various genetic parameters, including the polymorphic information content (PIC) value, major allele frequency, number of alleles per locus, and gene heterozygosity [31]. Using DARwin Software (version 6.0.021), the binary data matrix was submitted to the calculation of the distance matrix based on the Jaccard similarity coefficient [32]. With 1000 bootstraps, the resulting distance matrix was utilized to build a neighbor-joining dendrogram. Genetic relatedness and diversity estimates were analyzed using average pairwise divergence (π) and segregating sites through the unweighted pair group method with arithmetic mean (UPGMA) in TASSEL 5.0 software.

2.3. Genetic Variability

Genetic variability was analyzed for agronomically important traits, namely, seedling vigor (SV), days of 50% flowering (DFF), plant height (PH), panicle length (PL), number of spikelets per panicles (SPP), biological yield per plant (BYP), and harvest index (HI%). The data collection process involved rigorous field observations throughout the growth cycle of rice plants and measurements were conducted in accordance with standard agronomic practices to ensure the reliability of the experiment. For instance, SV was assessed based on the overall health and robustness of the seedlings during the early stages of growth. DFF was recorded as the number of days from planting to when 50% of the plants began flowering. Similarly, PH, PL, SPP, BYP, and HI were all measured according to established protocols. These measurements were taken from multiple plants to ensure representative sampling and the accurate assessment of genetic variability.

2.4. Structure Analysis

The software STRUCTURE v 2.3.3 was employed to conduct Bayesian clustering and determine the number of subpopulations within the accessions, following the method by Pritchard et al. [17]. An admixture model with independent allele frequencies was utilized for the STRUCTURE analysis. The number of supposed populations (K) was varied from 2 to 10, and, for each K value, three independent runs were performed. Each run consisted of a 30,000 burn-in period and 100,000 iterations. The ideal value of K was determined using the Delta K statistic and L(K), as described by Evanno et al. [33], and analyzed using a structure harvester [34]. GenAlex 6.5 was utilized to compute various genetic parameters, including the number of observable alleles (Na), and molecular variance (AMOVA) [35,36,37].

3. Results

3.1. Allelic Diversity and SSR Marker Informativeness

A total of 116 rice germplasm lines were genotyped using 64 SSR (microsatellite) markers, resulting in the identification of 225 alleles (Table 1). Among these alleles, 5% were classified as rare, with an allele frequency of less than 5%. The number of alleles per locus ranged from two to eight, with an average of 3.57 alleles per locus. The markers RM154 and RM7200 loci had the highest number of detected alleles (8), while a group of markers, including RM422, RM1807, RM510, RM121, RM427, RM7, RM118, RM408, RM284, RM433, RGNMS3189, RM415, RM277, HVSSR12-43, and HVSSR12-44, exhibited the lowest number.
The average polymorphic information content (PIC) value, which represents the relative informativeness of each marker, was found to be 0.747 in this study. Landraces showed the highest genetic diversity with PIC values ranging from 0.495 for RM162 to 0.984 for RGNMS3228.
The expected heterozygosity or gene diversity (He), calculated according to reference [38], ranged from 0.017 (RM408) to 0.868 (RM7200), with an average value of 0.421 (Table 1). Figure 1 below presents statistical features, with allelic diversity for each marker ranging from two to eight. Markers with higher number of alleles indicate greater genetic variability within the rice accessions. Mean, minimum, and maximum values are calculated only for numeric features. Mode indicates the most common value for numeric or categorical features of the analyzed parameters. Dispersion indicates the coefficient of variation for numeric features and entropy for categorical features.

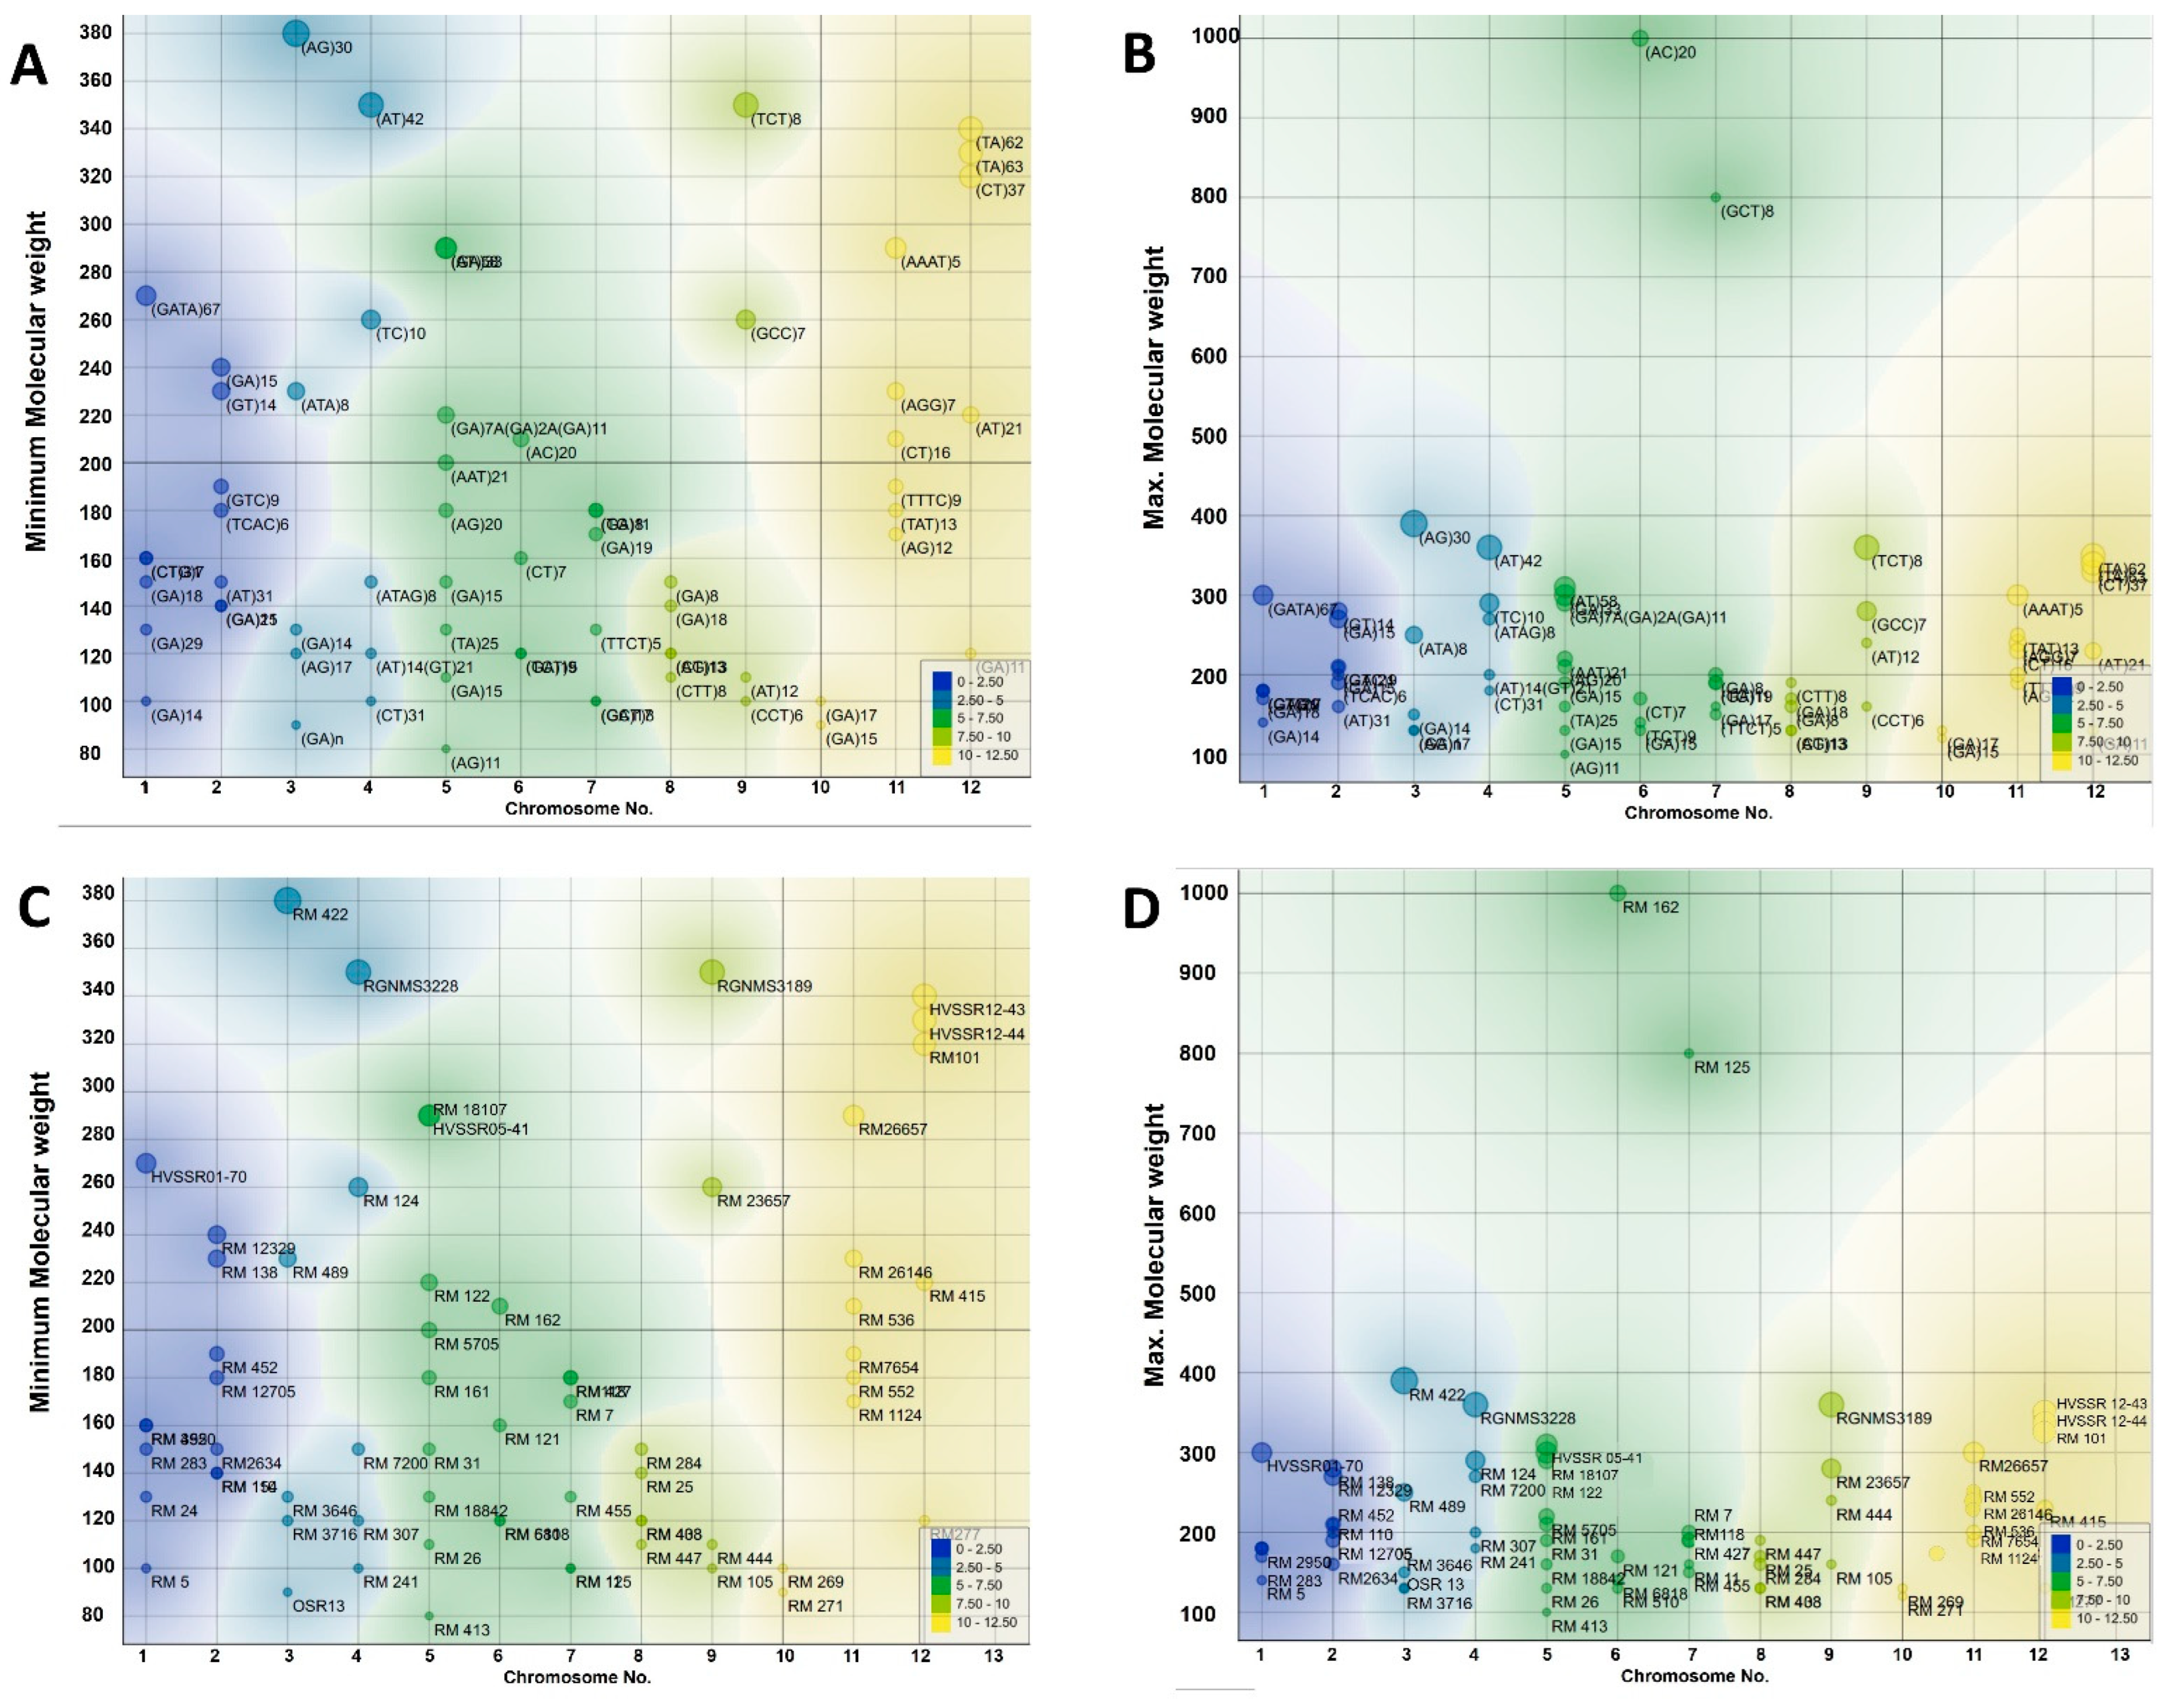
3.2. Chromosomal Distribution and Molecular Weight Analysis of SSR Markers

A scatter plot was made, showcasing the relationship between chromosome numbers and the maximum and minimum molecular weights (Figure 2). Color-coded regions on the plot align with chromosome projections, as well as markers (Figure 2A,B) and SSR motifs (Figure 2C,D) for each chromosome. An inset in the figure presents a legend depicting the molecular weight distribution with a color scale.
Each marker is associated with specific information, including its name, chromosome location, SSR motif, and the minimum and maximum molecular weights. These SSR motifs exhibit diversity and consist of various repeats, such as (GA), (CTG), (GATA), (TCAC), (AG), (AT), and others. The color-coded regions on each chromosome demonstrated the variations in length and composition of these motifs contributing to the observed genetic diversity.

3.3. Genetic Variability

The genetic variability result indicates that a wide range of variability was observed among all the traits studied. The magnitude of phenotypic coefficient of variation (PCV) was generally higher than genotypic coefficient of variation (GCV) for all the traits (Table 2). Seed vigor (26.98%) and panicle length (21.76) showed high magnitudes of PCV (>20%). Biological yield per plant (19.82%), plant height (12.70%), and harvest index (10.36%) showed moderate magnitudes of PCV. Additionally, these traits also had similar magnitudes of GCV. Days to 50% flowering and spikelet per panicle exhibited low magnitudes for both PCV and GCV (<10%).

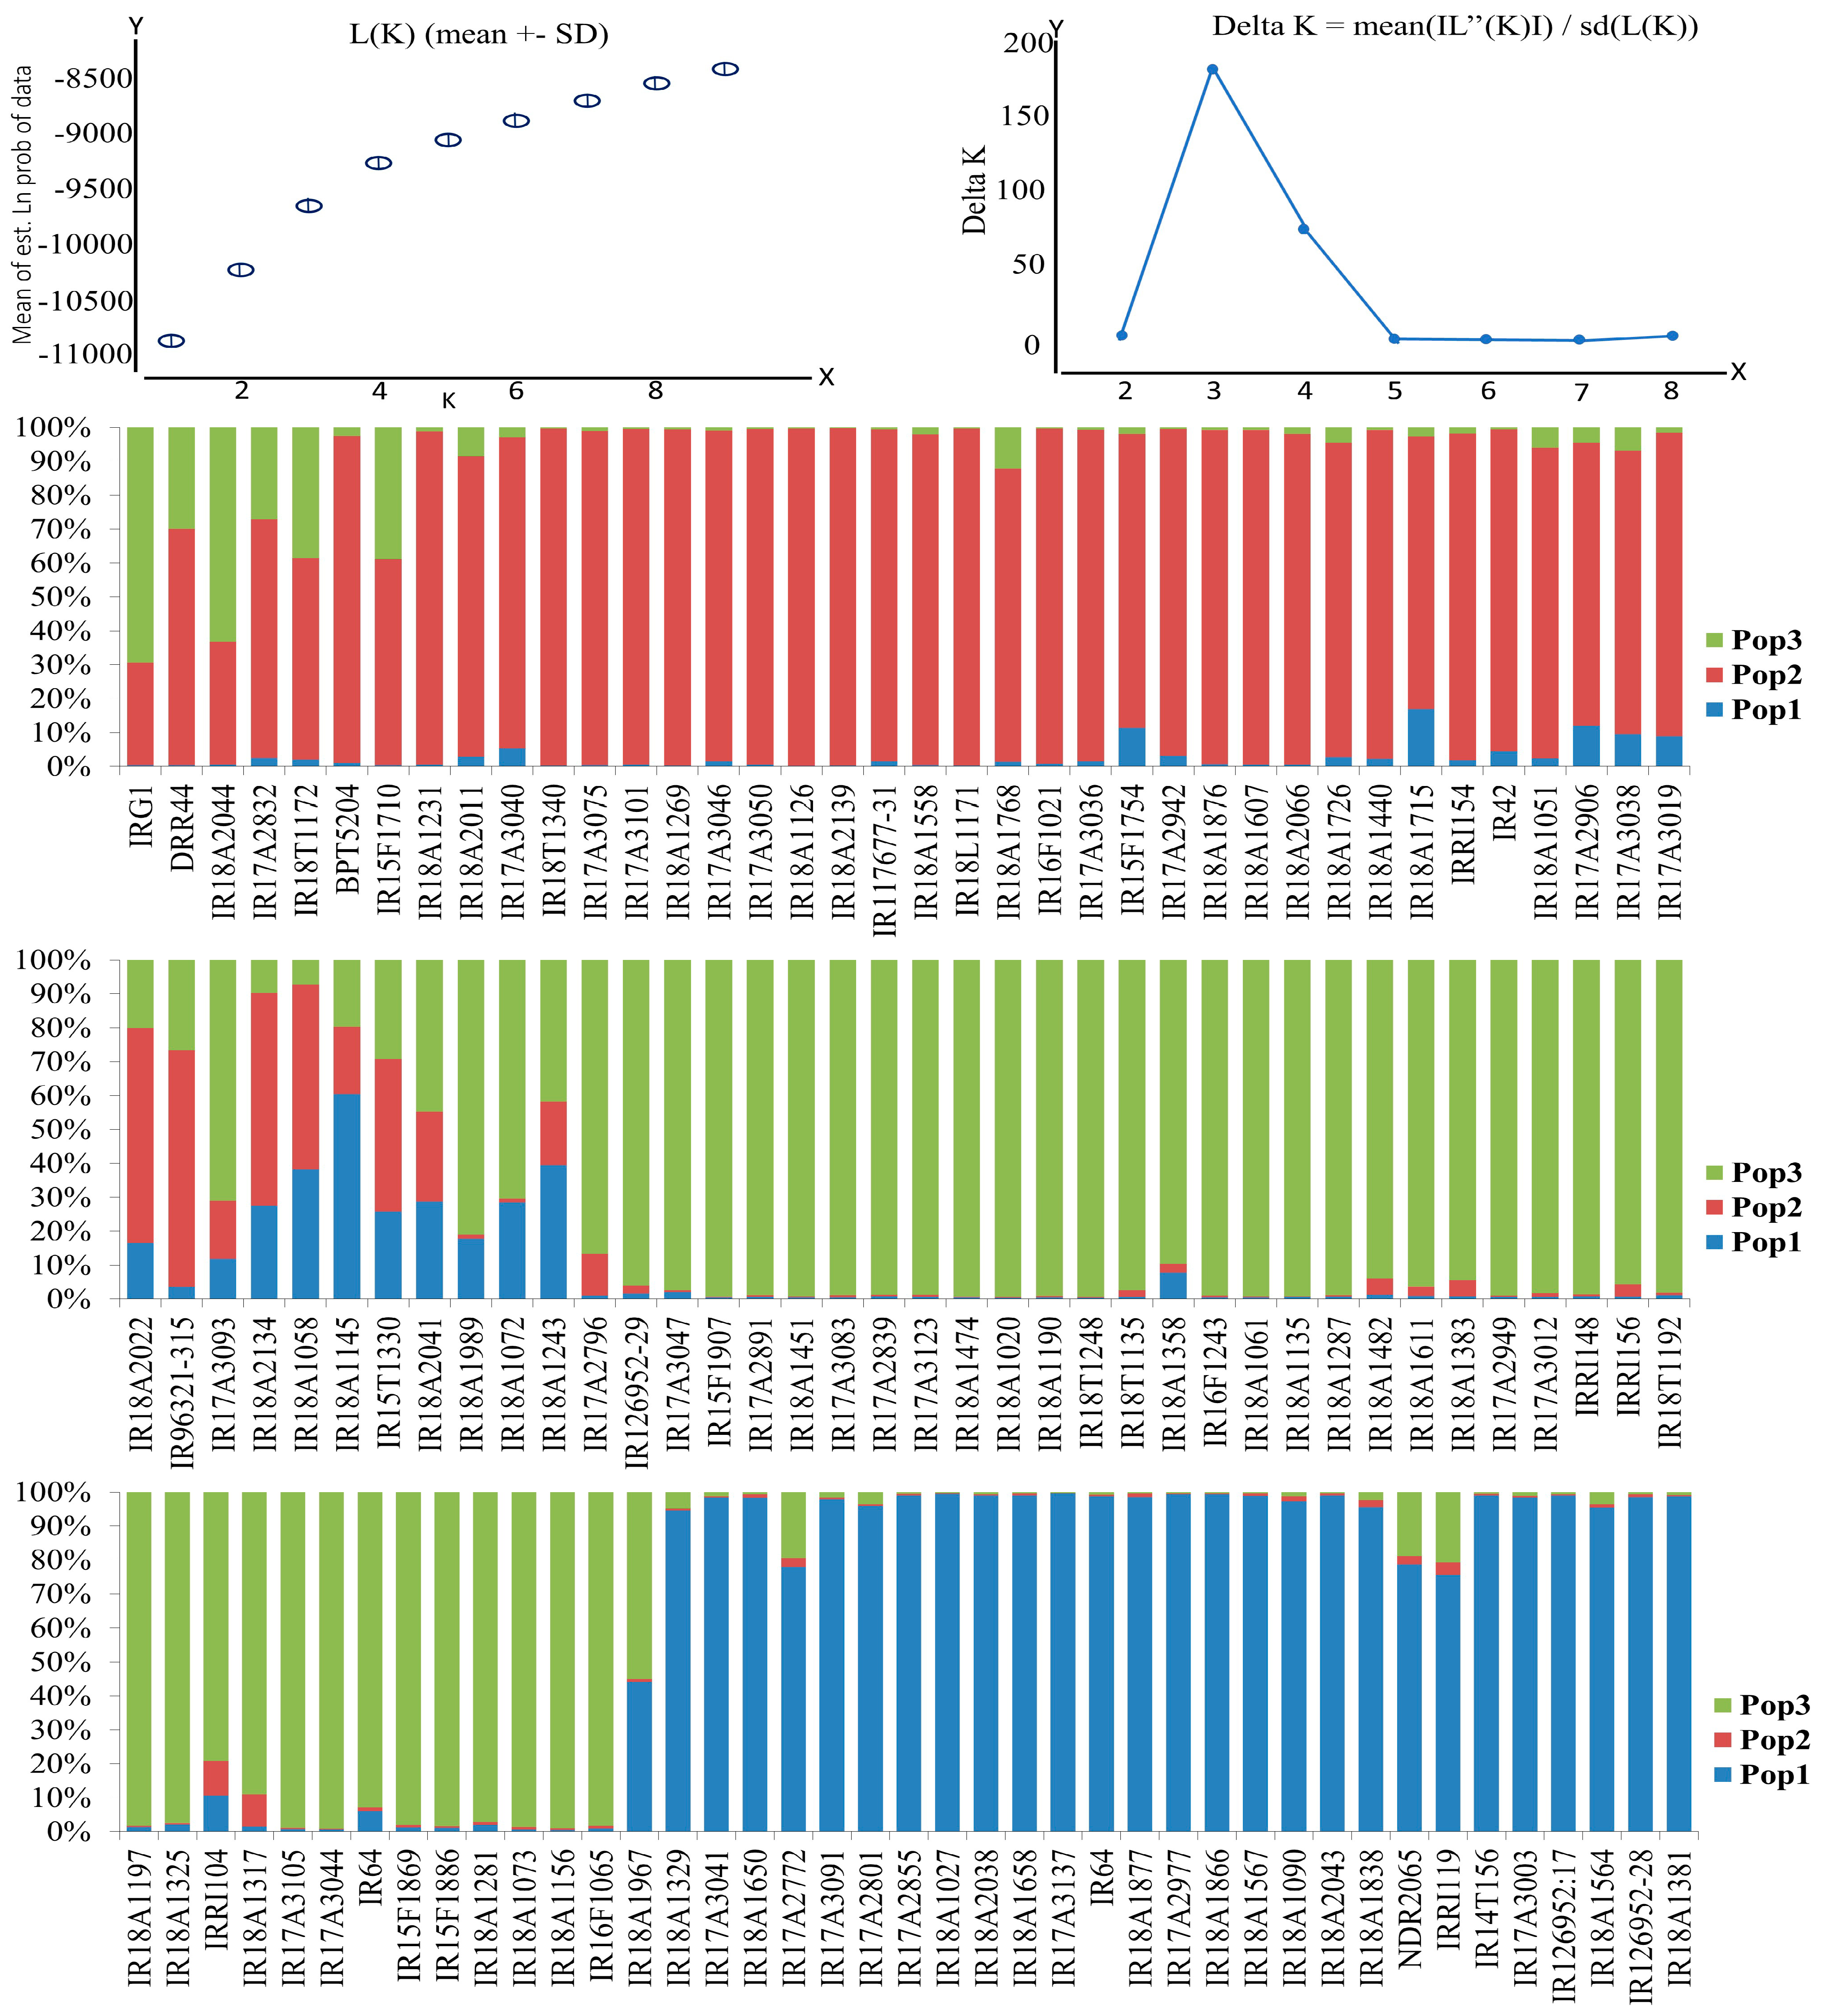
3.4. Distinct Subgroup Identification through Population Structure

The population structure of 116 germplasm lines was assessed through a Bayesian-based approach. This analysis involved estimating membership fractions for a range of values of “k”, spanning from 1 to 9 (Figure 1). The log likelihood obtained from the structure analysis pointed to the optimal value for “k” being three (k = 3). Similarly, an ad-hoc measure known as Δ k exhibited its peak at k = 3. This peak indicated the presence of three distinct subgroups within the population, designated as SG1, SG2, and SG3.
Subsequently, based on the membership fractions, accessions with a probability of 80% or higher were allocated to their respective subgroups, while those with lower probabilities were classified as admixtures (Figure 3; Supplementary Table S1). SG1 was composed of 23 accessions, primarily consisting of Indian landraces and varieties, while SG2 included 32 accessions of non-Indian origin. SG3 comprised of 40 accessions, and 21 accessions were classified as admixture. In SG1, the majority belonged to the Indica subtype, while SG2 was predominantly represented by the Japonica group. Upon increasing the number of subgroups from two to five, the accessions within both SG1 and SG2 were further subdivided into sub-subgroups (Supplementary Table S1). As SG1 mainly comprised of 23 accessions of Indian origin, an independent STRUCTURE analysis revealed that Δ k reached its peak at k = 3, indicating the presence of three sub-subgroups within SG1 (Figure 3). This clustering was attributed to the differentiation in the origin and seasonal patterns of rice varieties.

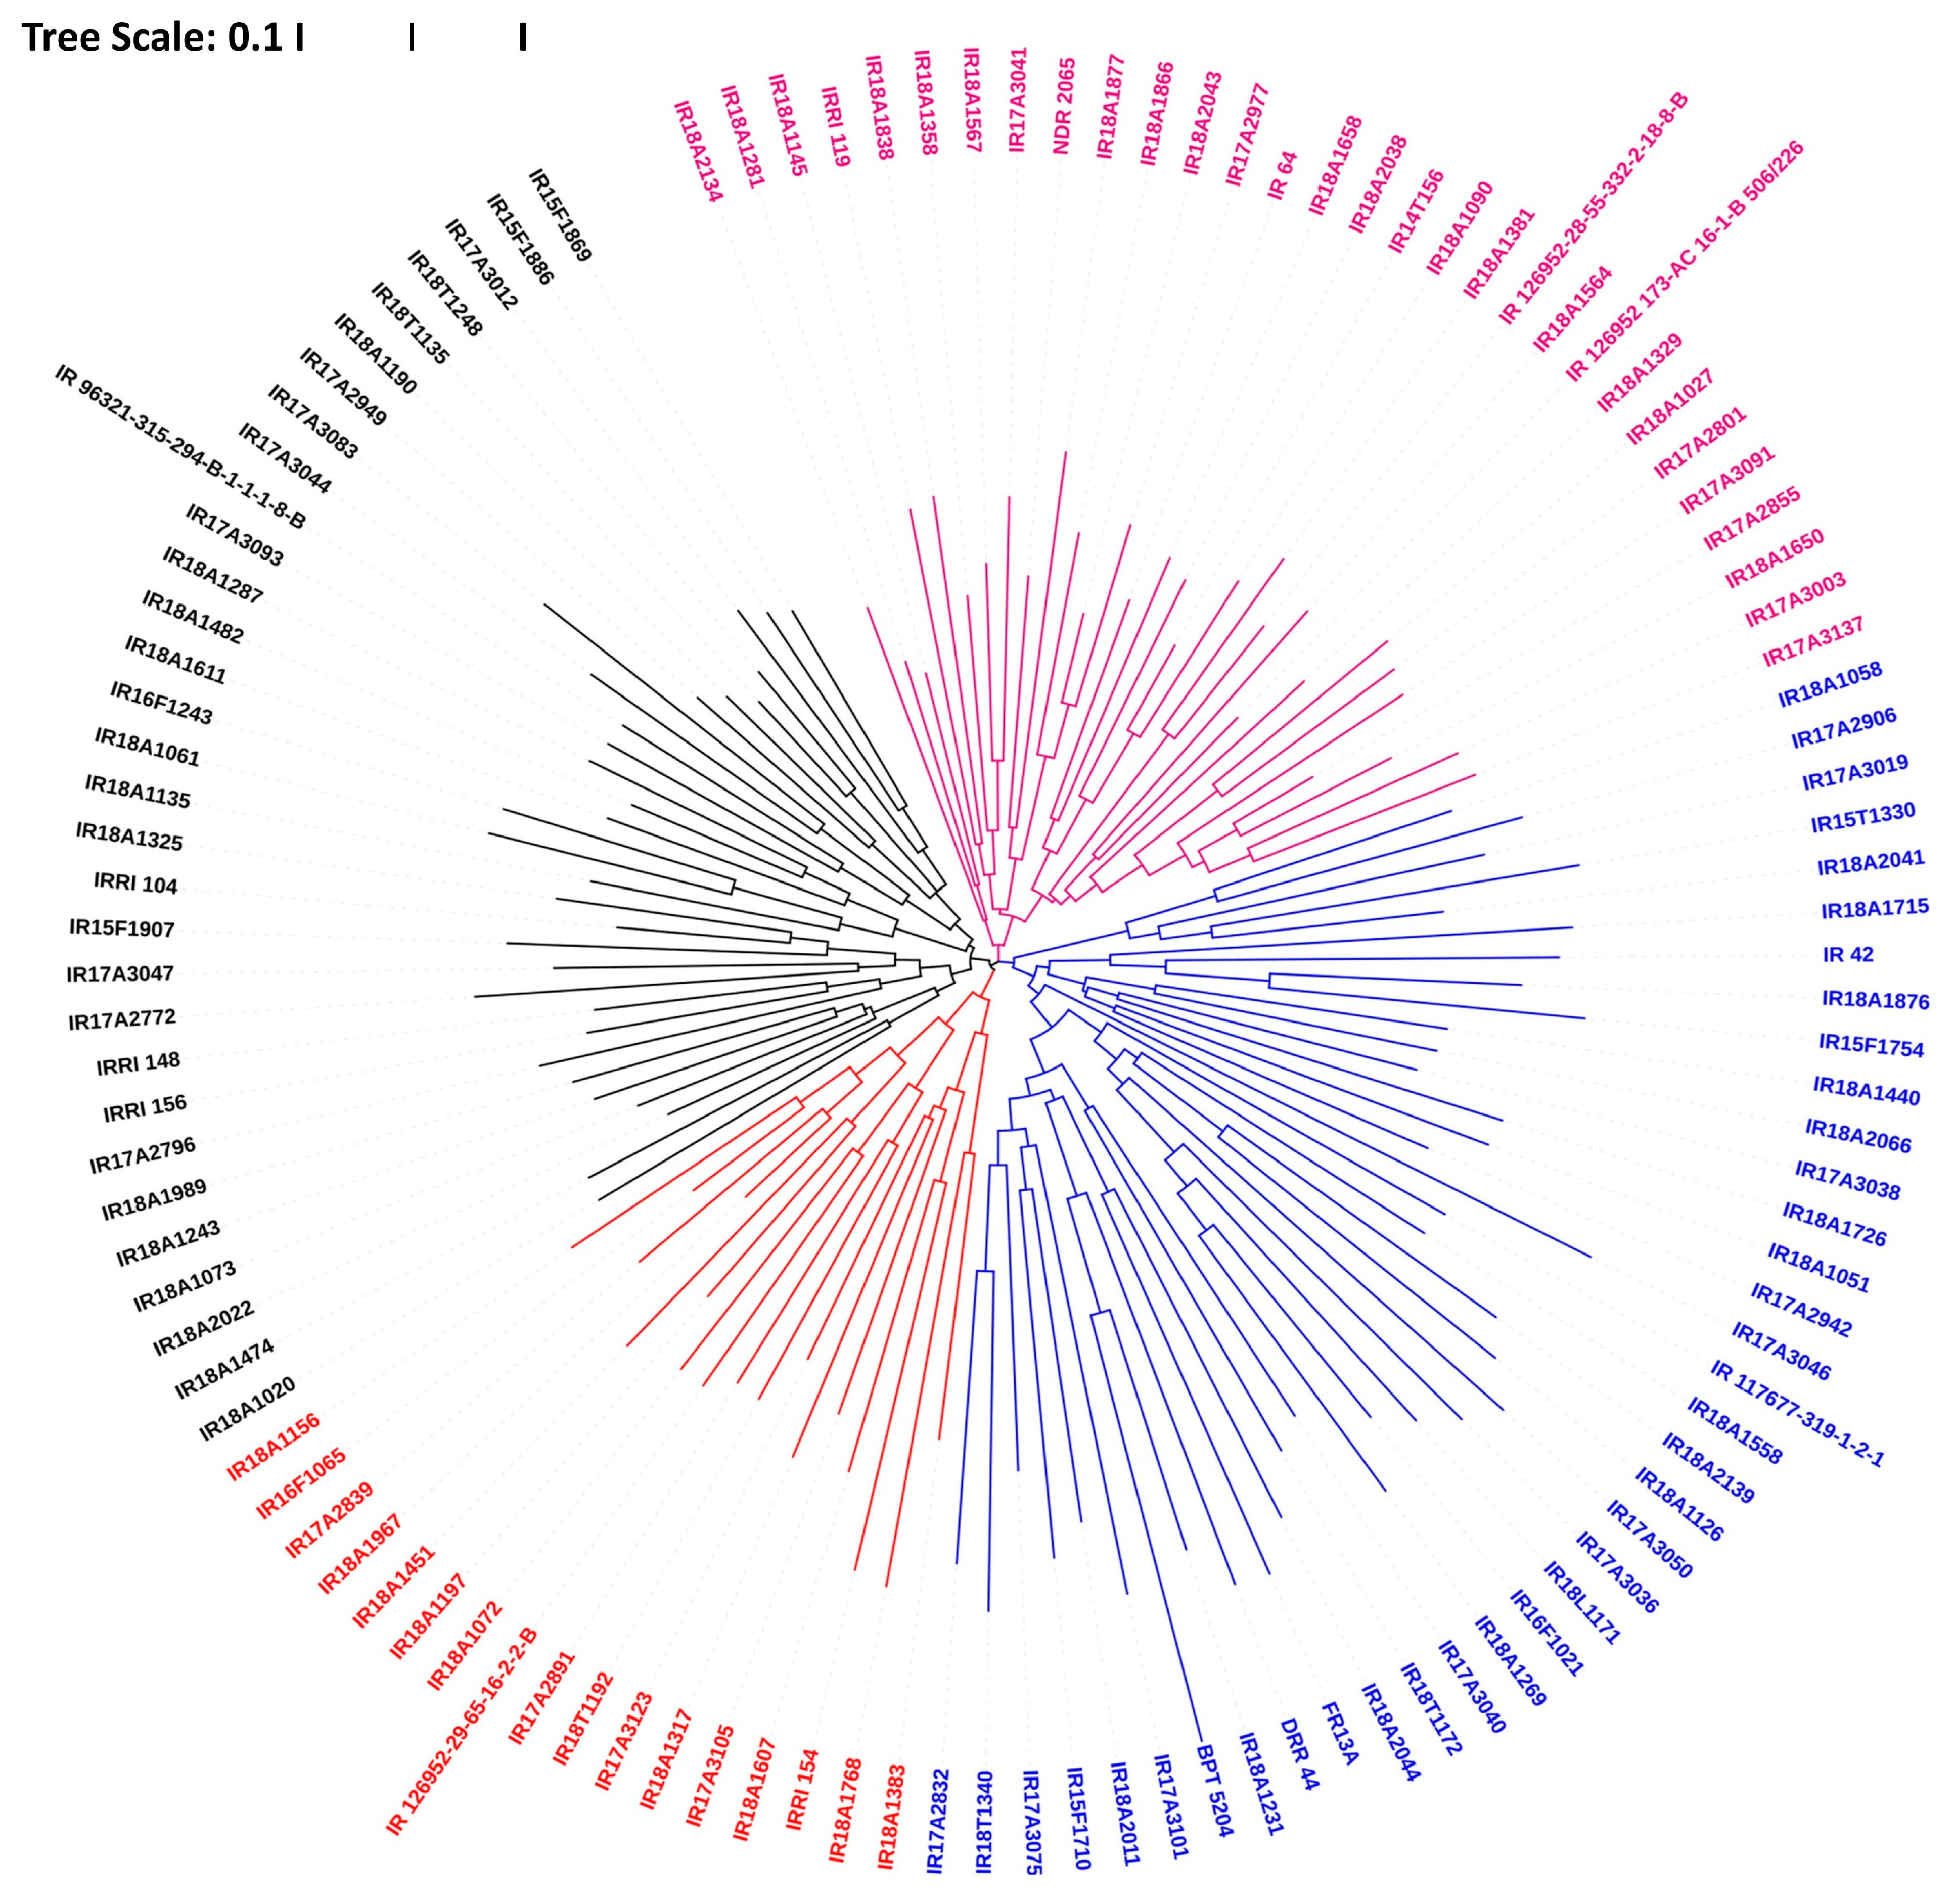
3.5. Genetic Relatedness and Diversity Assessment

Analysis categorized 116 rice accessions into three distinct groups, i.e., Group I, Group II, and Group III, accommodating 42, 36, and 38 genotypes, respectively. Group I in the UPGMA tree comprised of a mix of indigenous and agronomically improved varieties, while Groups II and III primarily consisted of exotic accessions. Subgrouping within the UPGMA tree revealed that accessions in each group formed further smaller subgroups based on their origin and types. Landraces and varieties were predominantly clustered in the upper branches of the tree, whereas exotic accessions clustered in the lower branches (Figure 4).

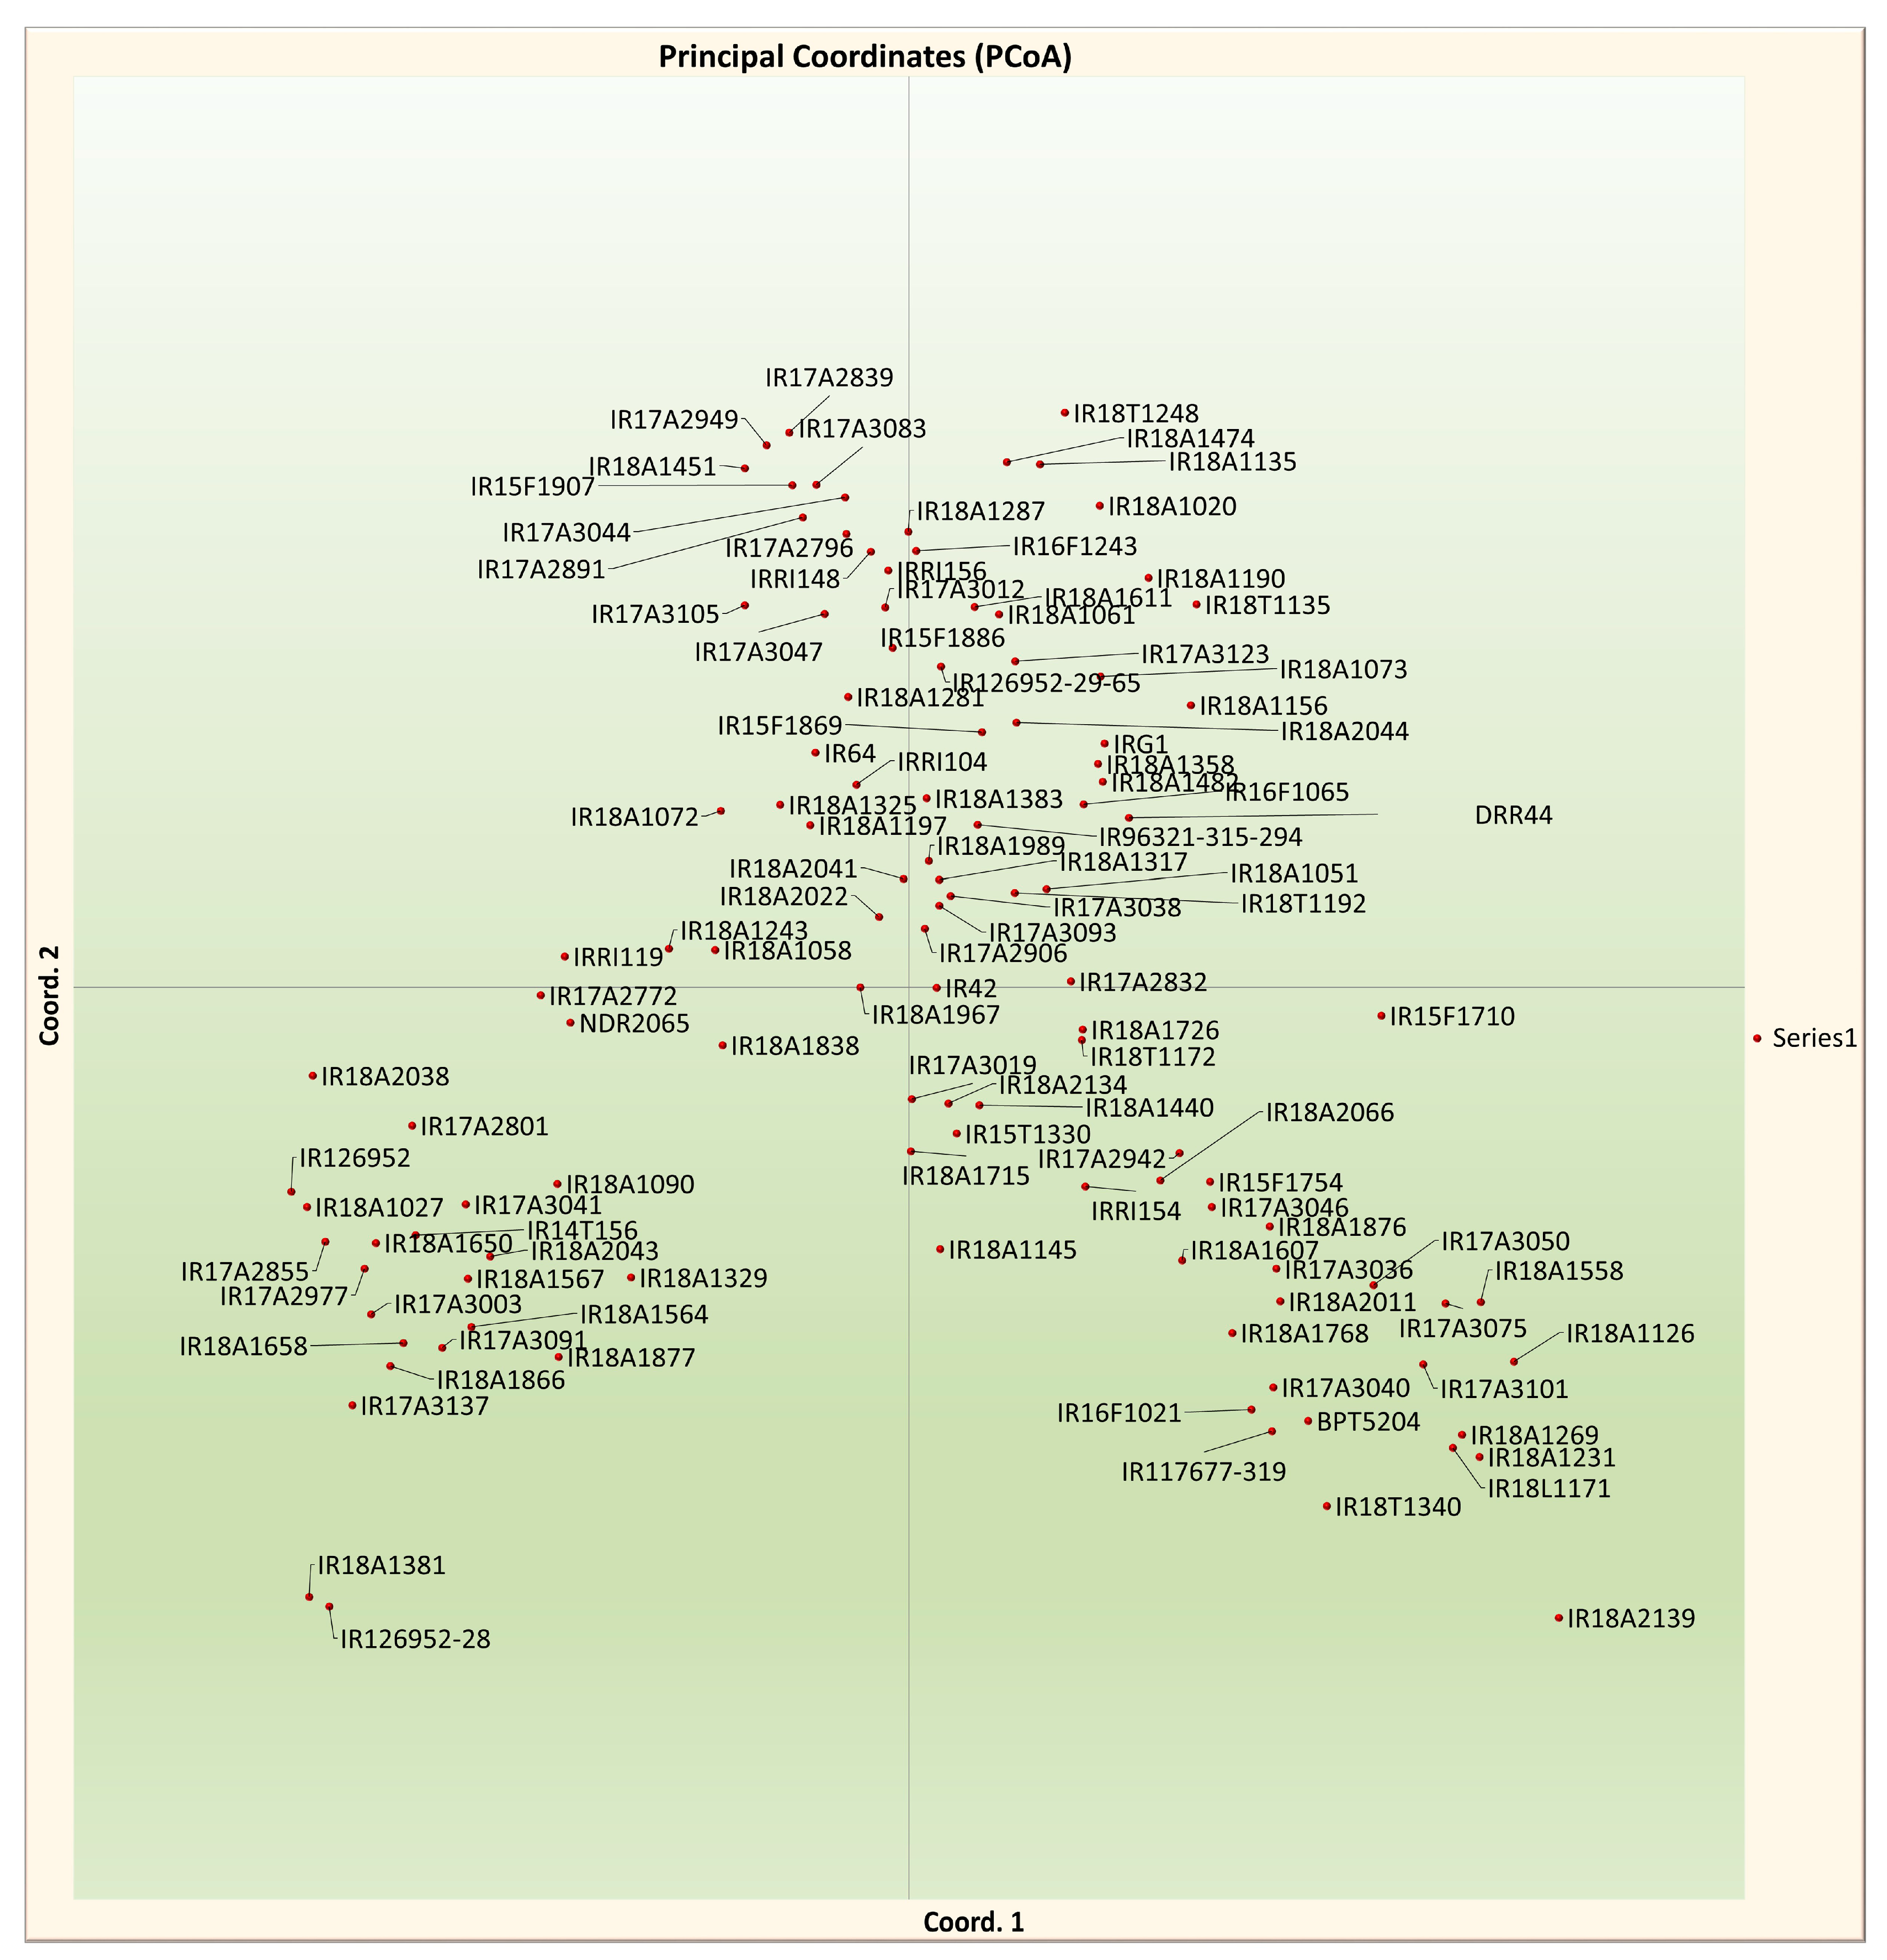
3.6. Principal Coordinate Analysis (PCoA)

Principal coordinate analysis (PCoA) was employed to characterize different germplasm subgroup sets. The two-dimensional and three-dimensional scatter plots for all the 116 accessions demonstrated that the first three PCA axes accounted for 5.81%, 5%, and 3.92% of the genetic variation among populations, respectively (Figure 5). Both classification methods also showed a high level of similarity in clustering the genotypes.

3.7. Genetic Differentiation Analysis

The analysis of molecular variance (AMOVA) and pair-wise comparisons of subgroups identified from population structure demonstrated significant genetic differentiation among the subgroups. The results revealed that 10% of the total variation was attributed to differences among populations whereas 79% was due to variation among individuals. The remaining 11% of the total variation was observed within individuals (Table 3). Wright’s F-statistics for all SSR loci indicated an FIS value of 0.879 and an FIT value of 0.890. Additionally, the determination of FST for the polymorphic loci across all accessions yielded an FST value of 0.096, suggesting a moderate level of genetic variation (Table 3).

4. Discussion

Genetic diversity plays a pivotal role and serves as a crucial resource in crop improvement and breeding programs. Populations with higher genetic variation are of immense importance for broadening the genetic base in breeding endeavors [39,40]. In this study, 116 rice accessions, encompassing landraces, released varieties, and advanced breeding lines developed for diverse agronomic traits, including some therapeutic attributes, were investigated. This population holds significance for its representation of traditional landraces cultivated in the largest state of Uttar Pradesh in India. Molecular markers, such as microsatellites or SNPs, are essential tools for descending the genetic diversity among different rice varieties, races, and exotic accessions, offering valuable insights for rice breeding programs [41].
Variability in traits is of great importance as it provides insight into the potential for selection and improvement. Under study, the magnitude of the phenotypic coefficient of variation (PCV) was generally higher than their respective genotypic coefficient of variation (GCV) for all the traits, indicating the influence of environmental factors. Among the traits, seed vigor and panicle length showed higher variation that may be exploited as a prominent selection parameter while making selections for further yield improvement. Other traits like biological yield per plant, plant height, and harvest index showing moderate PCV and GCV values indicated a combination of genetic and environmental influences. These findings under study are in conformity with earlier reports in the rice [42,43].
The genetic structure and diversity among germplasm lines were accurately assessed by employing the STRUCTURE analysis with molecular markers like microsatellite or SNP markers. This approach provides valuable insights into the genetic architecture of the population, shedding light on the relationships among various individuals or groups within the germplasm collection [14,44]. The genetic diversity of the studied accessions was evaluated from SSR genotypic data by using both model-based clustering and distance-based clustering approaches. Out of 64 polymorphic markers, a total of 225 alleles were identified across the 116 rice accessions. The number of alleles per locus ranged from two to eight, with an average of 3.57 alleles per locus. These findings are in accordance with previous reports on alleles per locus, polymorphic information content, and gene diversity in rice [28,45]. The average number of alleles observed in this study (3.57 alleles/locus) is aligned with other studies showing 3.88 alleles/locus, 3.9 alleles/locus [19], and 3.57 alleles per locus [28]. The mean polymorphic information content (PIC) obtained from screening with 19 InDel markers was found to be 0.440, similar to other reports ranging from 0.285 in a sample of 300 global rice collection [19,29,46,47] to 0.544 observed in a rice core collection comprising samples from various countries. At a global scale, the most diverse panels exhibit gene diversity values within the range of 0.5 to 0.7 [48]. The average PIC value was 0.747 with a wide range of individual markers, such as RM162 displaying a value of 0.495 to RGNMS3228 exhibiting a highest PIC value of 0.984, enabling the amplification of eight alleles. The detection of a noteworthy quantity of rare alleles underscores their significant impact on the overall genetic diversity within the population. These findings strongly suggested that the diversity panel composed of 116 germplasm lines in our study captures a significant portion of the genetic diversity found in major rice-growing regions across Asia. Furthermore, the identification of a substantial number of rare alleles in this investigation underscores their crucial role in bolstering the overall genetic diversity of the population.
The population was partitioned into two subgroups: SG1, predominantly composed of Indica accessions, and SG2, primarily consisting of Japonica accessions. Both subgroups made a substantial contribution to the overall population diversity. Although the population encompasses landraces, varieties, and breeding lines, the primary source of molecular diversity stems from the landraces. The model-based approach using STRUCTURE has been extensively applied by researchers to investigate population structure in rice [19,25,29,47,49,50]. The assignment of genotypes to different subgroups varies based on ancestry threshold values of 60–80% reported in similar studies [29,51] among research groups. In our study, adopting a stringent threshold of 80% ancestry value resulted in only 21 genotypes being classified as admixtures. Population structure analysis across diverse rice panels have revealed the presence of two to eight subpopulations in rice [25,50]. In the current rice diversity panel of 116 accessions, 23 were assigned to SG1 based on maximum membership probabilities. SG1 is predominantly composed of Indian origin landraces and varieties. On the other hand, SG2 and SG3 encompassed 32 and 40 accessions, respectively, primarily consisting of non-Indian exotic accessions. This population structure, featuring two subgroups, mirrors findings from prior research. [29,52] These results imply that the presence of three subgroups may be due to the different ecological environments. Indica and Japonica accessions seem to have undergone independent evolutionary trajectories. This study, enriched with a substantial number of traditional landraces from the Crop Research Centre, Masodha, ANDUA&T, Ayodhya, shed light on the relationship between Indian germplasm and exotic accessions. It underscores that germplasm lines exhibit variability based on their ecological niches, highlighting a heightened level of genetic diversity within this population.
The clustering analysis categorized the accessions into three groups, with 42 genotypes in group I, and 36 and 38 genotypes in groups II and III, respectively. Two classification methods used in the clustering analysis demonstrated a notable degree of similarity in grouping the genotypes. These findings corroborate earlier studies indicating that the Indica group possesses higher genetic diversity than Japonica accessions [53,54], consistent with the fact that this subgroup primarily comprises Indica accessions affirming that the Indica subpopulation encompasses the largest rice-growing region, characterized by diverse environments, ecological conditions, and soil types.
The outcome of the model-based analysis was in concordance with the clustering pattern observed in both the neighbor-joining tree and principal coordinate analysis. The first three principal coordinates accounted for 5.8%, 5%, and 3.92% of the molecular variance, mirroring a similar trend observed in two population subgroups. Calculating Wright’s F Statistic at all loci revealed a deviation from the Hardy–Weinberg equilibrium within the population, indicating notable molecular variation. The FST results indicated a higher degree of divergence between subgroups within the population. Moreover, a higher FIT, measured at the subgroup level across the entire population, suggested an absence of equilibrium among the groups, likely attributed to the inbreeding nature of rice. This study illuminates numerous underexplored landraces from Uttar Pradesh extensively cultivated by farmers across various regions of the largest state of India. The genetic diversity within this population is shaped by its ecological and evolutionary history, with varieties adapted to a wide array of ecosystems and diverse eco-geographical conditions. In establishing a core collection for association studies, a two-step approach was adopted [29,55] which involved determining the population structure followed by sampling based on the relatedness of the accessions. Accessions exhibiting high genetic relatedness were considered for elimination in order to curate a core collection with diverse representation. All 116 accessions can be effectively utilized for genome-wide or candidate gene-specific association mapping, facilitating the linkage between genotypic and phenotypic variation.

5. Conclusions

This study emphasizes the crucial role of genetic diversity in crop improvement, exemplified by a comprehensive analysis of 116 rice accessions. The SSR markers facilitated accurate assessment of genetic diversity, revealing 225 alleles across 64 polymorphic markers. The average number of alleles per locus (3.57) and gene diversity (0.421) suggested the presence of a broad genetic base in this collection. This diversity panel effectively captures a significant portion of genetic diversity in major rice growing regions across Asia. Stratification into Indica and Japonica subgroups, with landraces as primary contributors to diversity, underscores their significance. The findings from structure analysis were consistent with the results obtained from the clustering method using the neighbor-joining tree and principal coordinate analysis which distributed the population into three distinct subgroups. Clustering and genetic metrics further confirm the complexity of genetic dynamics in the population. As India is considered as one of the mega diversity centers for rice, this research offers valuable insights into the genetic diversity of the rice accessions included in this study. The establishment of a core collection for association studies provides a vital resource for future research in rice improvement. These findings can be used to guide various approaches, such as association analysis, the development of classical mapping populations, selection of parental lines in breeding programs, and hybrid development, to harness the natural genetic variation present within this population. In summary, this study significantly contributes to advancing rice breeding and genetic research towards the creation and utilization of newer genetic variability for further improvement in yield levels accompanied with climate resilience and better quality traits.

Supplementary Materials

The following supporting information can be downloaded at: https://www.mdpi.com/article/10.3390/crops4020014/s1, Table S1: Population structure group of accession based on Inferred ancestry values.

Author Contributions

Conceptualization, A.K.S. and D.K.D.; methodology; software, A.K.S.; validation, N.A.K. and S.K.S.; formal analysis, D.K.; investigation, A.K.S.; resources, A.V.S.; data curation, A.K.S.; writing—original draft preparation, A.K.S. and D.K.; writing—review and editing, D.G., V.T., K.K., D.K., S.K.S. and A.V.S.; visualization, A.V.S.; supervision, A.S.; project administration, R.K.E. All authors have read and agreed to the published version of the manuscript.

Funding

This research received no external funding.

Data Availability Statement

Suggested data available on request.

Conflicts of Interest

The authors declare no conflict of interest.

References

  1. Rasheed, A.; Fahad, S.; Hassan, M.; Tahir, M.; Aamer, M.; Wu, Z. A review on aluminum toxicity and quantitative trait loci mapping in rice (Oryza sativa L). Appl. Ecol. Environ. Res. 2020, 18, 3951–3964. [Google Scholar] [CrossRef]
  2. Rasheed, A.; Fahad, S.; Aamer, M.; Hassan, M.; Tahir, M.; Wu, Z. Role of genetic factors in regulating cadmium uptake, transport and accumulation mechanisms and quantitative trait loci mapping in rice. A review. Appl. Ecol. Environ. Res. 2020, 18, 4005–4023. [Google Scholar] [CrossRef]
  3. FAO. World Food and Agriculture – Statistical Yearbook 2022; FAO: Rome, Italy, 2022. [Google Scholar] [CrossRef]
  4. Collard, B.C.; Gregorio, G.B.; Thomson, M.J.; Islam, R.; Vergara, G.V.; Laborte, A.G.; Nissila, E.; Kretzschmar, T.; Cobb, J.N. Transforming rice breeding: Re-designing the irrigated breeding pipeline at the International Rice Research Institute (IRRI). Crop Breed. Genet. Genom. 2019, 1, e190008. [Google Scholar] [CrossRef]
  5. Lamaoui, M.; Jemo, M.; Datla, R.; Bekkaoui, F. Heat and drought stresses in crops and approaches for their mitigation. Front. Chem. 2018, 6, 26. [Google Scholar] [CrossRef]
  6. Xu, K.; Mackill, D.J. A major locus for submergence tolerance mapped on rice chromosome 9. Mol. Breed. 1996, 2, 219–224. [Google Scholar] [CrossRef]
  7. Nandi, S.; Subudhi, P.; Senadhira, D.; Manigbas, N.; Sen-Mandi, S.; Huang, N. Mapping QTLs for submergence tolerance in rice by AFLP analysis and selective genotyping. Mol. Gen. Genet. MGG 1997, 255, 1–8. [Google Scholar] [CrossRef] [PubMed]
  8. Siangliw, M.; Toojinda, T.; Tragoonrung, S.; Vanavichit, A. Thai jasmine rice carrying QTLch9 (Sub QTL) is submergence tolerant. Ann. Bot. 2003, 91, 255–261. [Google Scholar] [CrossRef] [PubMed]
  9. Toojinda, T.; Siangliw, M.; Tragoonrung, S.; Vanavichit, A. Molecular genetics of submergence tolerance in rice: QTL analysis of key traits. Ann. Bot. 2003, 91, 243–253. [Google Scholar] [CrossRef]
  10. Septiningsih, E.M.; Collard, B.C.; Heuer, S.; Bailey-Serres, J.; Ismail, A.M.; Mackill, D.J. Applying genomics tools for breeding submergence tolerance in rice. Transl. Genom. Crop Breed. Abiotic Stress Yield Qual. 2013, 2, 9–30. [Google Scholar]
  11. Gonzaga, Z.J.C.; Carandang, J.; Sanchez, D.L.; Mackill, D.J.; Septiningsih, E.M. Mapping additional QTLs from FR13A to increase submergence tolerance in rice beyond SUB1. Euphytica 2016, 209, 627–636. [Google Scholar] [CrossRef]
  12. Sun, S.; Wang, L.; Mao, H.; Shao, L.; Li, X.; Xiao, J.; Ouyang, Y.; Zhang, Q. A G-protein pathway determines grain size in rice. Nat. Commun. 2018, 9, 851. [Google Scholar] [CrossRef]
  13. Chakravarthi, B.K.; Naravaneni, R. SSR marker based DNA fingerprinting and diversity study in rice (Oryza sativa L). Afr. J. Biotechnol. 2006, 5, 684–688. [Google Scholar]
  14. Powell, W.; Morgante, M.; Andre, C.; Hanafey, M.; Vogel, J.; Tingey, S.; Rafalski, A. The comparison of RFLP, RAPD, AFLP and SSR (microsatellite) markers for germplasm analysis. Mol. Breed. 1996, 2, 225–238. [Google Scholar] [CrossRef]
  15. Mondini, L.; Noorani, A.; Pagnotta, M.A. Assessing plant genetic diversity by molecular tools. Diversity 2009, 1, 19–35. [Google Scholar] [CrossRef]
  16. McCouch, S.R.; Chen, X.; Panaud, O.; Temnykh, S.; Xu, Y.; Cho, Y.G.; Huang, N.; Ishii, T.; Blair, M. Microsatellite marker development, mapping and applications in rice genetics and breeding. Plant Mol. Biol. 1997, 35, 89–99. [Google Scholar] [CrossRef] [PubMed]
  17. Pritchard, J.K.; Stephens, M.; Donnelly, P. Inference of population structure using multilocus genotype data. Genetics 2000, 155, 945–959. [Google Scholar] [CrossRef] [PubMed]
  18. Bhardwaj, V.; Kumar, A.; Sharma, S.; Singh, B.; Poonam; Sood, S.; Dipta, B.; Singh, R.; Siddappa, S.; Thakur, A.K.; et al. Analysis of Genetic Diversity, Population Structure and Association Mapping for Late Blight Resistance in Potato (Solanum tuberosum L.) Accessions Using SSR Markers. Agronomy 2023, 13, 294. [Google Scholar] [CrossRef]
  19. Jin, L.; Lu, Y.; Xiao, P.; Sun, M.; Corke, H.; Bao, J. Genetic diversity and population structure of a diverse set of rice germplasm for association mapping. Theor. Appl. Genet. 2010, 121, 475–487. [Google Scholar] [CrossRef]
  20. Ilyas, M.Z.; Park, H.; Jang, S.J.; Cho, J.; Sa, K.J.; Lee, J.K. Association Mapping for Evaluation of Population Structure, Genetic Diversity, and Physiochemical Traits in Drought-Stressed Maize Germplasm Using SSR Markers. Plants 2023, 12, 4092. [Google Scholar] [CrossRef]
  21. Li, R.; Huang, Y.; Yang, X.; Su, M.; Xiong, H.; Dai, Y.; Wu, W.; Pei, X.; Yuan, Q. Genetic Diversity and Relationship of Shanlan Upland Rice Were Revealed Based on 214 Upland Rice SSR Markers. Plants 2023, 12, 2876. [Google Scholar] [CrossRef]
  22. Vats, G.; Das, D.; Gupta, R.; Singh, A.; Maurya, A.; Rajkumar, S.; Singh, A.K.; Bharadwaj, R.; Kumar, S.; Kaushik, S.K.; et al. Validation of Genome-Wide SSR Markers Developed for Genetic Diversity and Population Structure Study in Grain Amaranth (Amaranthus hypochondriacus). Agriculture 2023, 13, 431. [Google Scholar] [CrossRef]
  23. Ma, M.; Lei, E.; Wang, T.; Meng, H.; Zhang, W.; Lu, B. Genetic Diversity and Association Mapping of Grain-Size Traits in Rice Landraces from the Honghe Hani Rice Terraces System in Yunnan Province. Plants 2023, 12, 1678. [Google Scholar] [CrossRef] [PubMed]
  24. Agrama, H.; Yan, W.; Fjellstrom, R.; Jia, M.; McClung, A. Genetic Diversity and Relationships Assessed by SSRs in the USDA World-Wide Rice Germplasm Collection. In Proceedings of the 2008 Joint Annual Meeting, American Society of Agronomy Abstracts, Houston, TX, USA, 5–9 October 2008; Dale Bumpers National Rice Research Center: Stuttgart, Germany; pp. 552–555. [Google Scholar]
  25. Das, B.; Sengupta, S.; Parida, S.K.; Roy, B.; Ghosh, M.; Prasad, M.; Ghose, T.K. Genetic diversity and population structure of rice landraces from Eastern and North Eastern States of India. BMC Genet. 2013, 14, 71. [Google Scholar] [CrossRef]
  26. Choudhury, B.; Khan, M.L.; Dayanandan, S. Genetic structure and diversity of indigenous rice (Oryza sativa) varieties in the Eastern Himalayan region of Northeast India. SpringerPlus 2013, 2, 228. [Google Scholar] [CrossRef]
  27. Sow, M.; Ndjiondjop, M.-N.; Sido, A.; Mariac, C.; Laing, M.; Bezançon, G. Genetic diversity, population structure and differentiation of rice species from Niger and their potential for rice genetic resources conservation and enhancement. Genet. Resour. Crop Evol. 2014, 61, 199–213. [Google Scholar] [CrossRef]
  28. Zhao, C.; Zhao, L.; Zhao, Q.; Chen, T.; Yao, S.; Zhu, Z.; Zhou, L.; Nadaf, A.B.; Liang, W.; Lu, K. Genetic dissection of eating and cooking qualities in different subpopulations of cultivated rice (Oryza sativa L.) through association mapping. BMC Genet. 2020, 21, 119. [Google Scholar] [CrossRef] [PubMed]
  29. Courtois, B.; Frouin, J.; Greco, R.; Bruschi, G.; Droc, G.; Hamelin, C.; Ruiz, M.; Clément, G.; Evrard, J.C.; Van Coppenole, S. Genetic diversity and population structure in a European collection of rice. Crop Sci. 2012, 52, 1663–1675. [Google Scholar] [CrossRef]
  30. Murray, M.G.; Thompson, W.F. Rapid isolation of high molecular weight plant DNA. Nucleic Acids Res. 1980, 8, 4321–4325. [Google Scholar] [CrossRef] [PubMed]
  31. Liu, K.; Muse, S.V. PowerMarker: An integrated analysis environment for genetic marker analysis. Bioinformatics 2005, 21, 2128–2129. [Google Scholar] [CrossRef]
  32. Perrier, X.; Jacquemoud-Collet, J.P. DARwin Software, 2006. Available online: http://darwin.cirad.fr/darwin(accessed on 8 July 2023).
  33. Evanno, G.; Regnaut, S.; Goudet, J. Detecting the number of clusters of individuals using the software STRUCTURE: A simulation study. Mol. Ecol. 2005, 14, 2611–2620. [Google Scholar] [CrossRef]
  34. Earl, D.A.; Vonholdt, B. Structure Harvester: A website and program for visualizing STRUCTURE output and implementing the Evanno method. Conserv. Genet. Resour. 2012, 4, 359–361. [Google Scholar] [CrossRef]
  35. Excoffier, L.; Laval, G.; Schneider, S. Arlequin (version 3.0): An integrated software package for population genetics data analysis. Evol. Bioinform. Online 2007, 1, 47–50. [Google Scholar] [CrossRef]
  36. Singh, A.V.; Shelar, A.; Rai, M.; Laux, P.; Thakur, M.; Dosnkyi, I.; Santomauro, G.; Singh, A.K.; Luch, A.; Patil, R.; et al. Harmonization Risks and Rewards: Nano-QSAR for Agricultural Nanomaterials. J. Agric. Food Chem. 2024, 72, 2835–2852. [Google Scholar] [CrossRef] [PubMed]
  37. Singh, A.V.; Varma, M.; Rai, M.; Pratap Singh, S.; Bansod, G.; Laux, P.; Luch, A. Advancing Predictive Risk Assessment of Chemicals via Integrating Machine Learning, Computational Modeling, and Chemical/Nano-Quantitative Structure-Activity Relationship Approaches. Adv. Intell. Syst. 2024, 6, 2300366. [Google Scholar] [CrossRef]
  38. Nei, M. Analysis of gene diversity in subdivided populations. Proc. Natl. Acad. Sci. USA 1973, 70, 3321–3323. [Google Scholar] [CrossRef]
  39. Malik, N.; Kumar, D.; Babu, B.K. Analysis of genetic divergence and population structure through microsatellite markers in normal and quality protein maize genotypes from NW Himalayan region of India. Vegetos 2020, 33, 194–202. [Google Scholar] [CrossRef]
  40. Singh, A.K.; Dwivedi, D.K.; Kumar, D.; Singh, A.; Dixit, S.; Khan, N.A.; Kumar, A. Genetic variability, character association and path coefficient analysis in rice (Oryza sativa) genotypes of semi-arid region of India. Indian J. Agric. Sci. 2023, 93, 844–849. [Google Scholar] [CrossRef]
  41. Swarup, S.; Cargill, E.J.; Crosby, K.; Flagel, L.; Kniskern, J.; Glenn, K.C. Genetic diversity is indispensable for plant breeding to improve crops. Crop Sci. 2021, 61, 839–852. [Google Scholar] [CrossRef]
  42. Singh, S.K.; Singh, P.; Khaire, A.R.; Korada, M.; Singh, D.K.; Majhi, P.K.; Jayasudha, S. Genetic Variability, Character Association and Path Analysis for Yield and its Related Traits in Rice (Oryza sativa L.) Genotypes. Int. J. Plant Soil Sci. 2021, 33, 437–446. [Google Scholar] [CrossRef]
  43. Biswajit, P.; Sritama, K.; Anindya, S.; Moushree, S.; Sabyasachi, K. Breeding for submergence tolerance in rice (Oryza sativa L.) and its management for flash flood in rainfed low land area: A review. Agric. Rev. 2017, 38, 167–179. [Google Scholar] [CrossRef]
  44. Varshney, R.K.; Chabane, K.; Hendre, P.S.; Aggarwal, R.K.; Graner, A. Comparative assessment of EST-SSR, EST-SNP and AFLP markers for evaluation of genetic diversity and conservation of genetic resources using wild, cultivated and elite barleys. Plant Sci. 2007, 173, 638–649. [Google Scholar] [CrossRef]
  45. Ram, S.G.; Thiruvengadam, V.; Vinod, K.K. Genetic diversity among cultivars, landraces and wild relatives of rice as revealed by microsatellite markers. J. Appl. Genet. 2007, 48, 337–345. [Google Scholar] [CrossRef] [PubMed]
  46. Chen, H.; He, H.; Zou, Y.; Chen, W.; Yu, R.; Liu, X.; Yang, Y.; Gao, Y.-M.; Xu, J.-L.; Fan, L.-M.; et al. Development and application of a set of breeder-friendly SNP markers for genetic analyses and molecular breeding of rice (Oryza sativa L.). Theor. Appl. Genet. 2011, 123, 869–879. [Google Scholar] [CrossRef] [PubMed]
  47. Agrama, H.; Eizenga, G. Molecular diversity and genome-wide linkage disequilibrium patterns in a worldwide collection of Oryza sativa and its wild relatives. Euphytica 2008, 160, 339–355. [Google Scholar] [CrossRef]
  48. Ni, J.; Colowit, P.; Mackill, D. Evaluation of Genetic Diversity in Rice Subspecies Using Microsatellite Markers. Crop Sci. 2002, 42, 601–607. [Google Scholar] [CrossRef]
  49. Agrama, H.A.; Eizenga, G.C.; Yan, W. Association mapping of yield and its components in rice cultivars. Mol. Breed. 2007, 19, 341–356. [Google Scholar] [CrossRef]
  50. Zhang, D.; Zhang, H.; Wei, X.; Qi, Y.; Wang, M.; Sun, J.; Ding, L.; Tang, S.; Qiu, Z.E.; Cao, Y.; et al. Genetic structure and diversity of Oryza sativa L. in Guizhou, China. Chin. Sci. Bull. 2007, 52, 343–351. [Google Scholar] [CrossRef]
  51. Zhao, K.; Wright, M.; Kimball, J.; Eizenga, G.; McClung, A.; Kovach, M.; Tyagi, W.; Ali, M.L.; Tung, C.W.; Reynolds, A.; et al. Genomic diversity and introgression in O. sativa reveal the impact of domestication and breeding on the rice genome. PLoS ONE 2010, 5, e10780. [Google Scholar] [CrossRef] [PubMed]
  52. Zhang, D.; Zhang, H.; Wang, M.; Sun, J.; Qi, Y.; Wang, F.; Wei, X.; Han, L.; Wang, X.; Li, Z. Genetic structure and differentiation of Oryza sativa L. in China revealed by microsatellites. Theor. Appl. Genet. 2009, 119, 1105–1117. [Google Scholar] [CrossRef]
  53. Caicedo, A.L.; Williamson, S.H.; Hernandez, R.D.; Boyko, A.; Fledel-Alon, A.; York, T.L.; Polato, N.R.; Olsen, K.M.; Nielsen, R.; McCouch, S.R.; et al. Genome-wide patterns of nucleotide polymorphism in domesticated rice. PLoS Genet. 2007, 3, 1745–1756. [Google Scholar] [CrossRef]
  54. Qi, Y.; Zhang, H.; Zhang, D.; Wang, M.; Sun, J.; Ding, L.; Wang, F.; Li, Z. Assessing indica-japonica differentiation of improved rice varieties using microsatellite markers. J. Genet. Genom. 2009, 36, 305–312. [Google Scholar] [CrossRef] [PubMed]
  55. Breseghello, F.; Sorrells, M.E. Association mapping of kernel size and milling quality in wheat (Triticum aestivum L.) cultivars. Genetics 2006, 172, 1165–1177. [Google Scholar] [CrossRef] [PubMed]
Figure 1. The statistics of the selected features of different parameters to inspect and find interesting features in the gene diversity data set.
Crops 04 00014 g001
Figure 2. Scatter plot visualization of chromosome markers and SSR motifs with exploratory analysis and data visualization enhancements. Color-coded regions on the plot align with chromosome projections, as well as markers (A,B) and SSR motifs (C,D) for each chromosome. (AC) exhibit minimum molecular weight and(BD) exhibit maximum molecular weight.
Crops 04 00014 g002
Figure 3. Population structure of 116 accessions in subgroup 1 and membership probability of assigning genotypes of subgroup 1 (k = 3).
Crops 04 00014 g003
Figure 4. Genetic relatedness through Jaccard coefficient; neighbor-joining tree of 116 rice genotypes.
Crops 04 00014 g004
Figure 5. Principal coordinates of 116 accessions based on 64 SSR loci. Coord 1 and Coord 2 represent first and second coordinates, respectively.
Crops 04 00014 g005
Table 1. Details of SSR loci used for genotyping in the 116 rice accessions and their genetic diversity parameters.
MarkerChromosome No.SSR MotifMini. Mol. WeightMaxi. Mol WeightNumber of AllelesHeterozygosityGene
Diversity
PIC Value
RM 4951(CTG)716018030.4940.4970.722
RM 2831(GA)1815017030.1380.1390.566
RM 241(GA)2913018060.8110.8150.969
RM 5 1(GA)1410014050.6740.6770.870
HVSSR01-701(GATA)6727030030.5000.5020.803
RM 35201(CT)3116018050.5400.5430.763
RM 123292(GA)1524027040.6940.6980.908
RM 1542(GA)2114021080.8190.8230.925
RM 1102(GA)1514020070.7540.7580.924
RM 127052(TCAC)618019030.5830.5850.815
RM 4522(GTC)919021030.2530.2540.623
RM26342(AT)3115016030.5840.5860.830
RM 1382(GT)1423028060.5180.5200.836
RM 4893(ATA)823025030.0470.0480.860
RM 37163(AG)1712013030.4370.4390.983
OSR133(GA)n9013030.3380.3400.701
RM 36463(GA)1413015030.3830.3840.734
RM 4223(AG)3038039020.3930.3950.729
RM 3074(AT)14(GT)2112020030.3390.3410.740
RM 72004(ATAG)815027080.8680.8720.980
RGNMS32284(AT)4235036030.4050.4070.984
RM 2414(CT)3110018040.5820.5850.845
RM 1244(TC)1026029030.3230.3250.959
RM 1225(GA)7A(GA)2A(GA)1122029070.7580.7610.942
RM 4135(AG)118010030.5600.5630.925
RM 181075(GA)3329030020.4360.4380.755
RM 57055(AAT)2120022030.6240.6260.828
HVSSR05-415(AT)5829031030.4000.4020.799
RM 1615(AG)2018021030.0750.0760.507
RM 265(GA)15110130 0.6200.6230.694
RM 188425(TA)2513016030.4820.4850.776
RM 315(GA)1515019060.4820.4850.846
RM 5106(GA)1512013020.4540.4560.515
RM 1216(CT)716017020.2240.2250.640
RM 68186(TCT)912014030.4300.4320.718
RM 1626(AC)20210100050.1670.1680.495
RM 4277(TG)1118019020.3340.3360.701
RM 117(GA)1710016050.5690.5720.816
RM 77(GA)1917019020.2380.2390.684
RM 4557(TTCT)513015030.2770.2780.649
RM1187(GA)818020020.0350.0340.035
RM 1257(GCT)810080070.4130.4150.682
RM 4088(CT)1312013020.0170.0170.517
RM 258(GA)1814017040.4860.4880.719
RM 2848(GA)815016020.1760.1770.600
RM 4338(AG)1312013020.0310.0310.663
RM 4478(CTT)811019040.2780.2790.710
RM 236579(GCC)726028030.2160.2170.690
RGNMS31899(TCT)835036020.4230.4250.771
RM 4449(AT)1211024060.6910.6940.909
RM 1059(CCT)610016040.4060.4080.703
RM 27110(GA)159012030.1370.1370.564
RM 26910(GA)1710013040.6200.6230.834
RM 2614611(AGG)723024030.2510.2520.581
RM 112411(AG)1217019030.1300.1310.656
RM 55211(TAT)1318025060.2910.2920.692
RM 53611(CT)1621023030.4340.4360.709
RM2665711(AAAT)529030030.6030.6060.846
RM765411(TTTC)919020030.5500.5530.800
RM 41512(AT)2122023020.1750.1760.678
RM10112(CT)3732033030.5640.5670.817
RM27712(GA)1112013020.4800.4830.648
HVSSR12-4312(TA)6234035020.6550.6580.734
HVSSR12-4412(TA)6333034020.2270.2280.871
Table 2. Genetic variability among studied traits.
CharactersMeanRangeVar (g)Var (p)GCV (%)PCV (%)ECV (%)
DFF107.6586.60–125.2793.7295.038.999.061.32
SV32.3317.41–56.7570.3275.9725.9626.985.65
PH (cm)118.5171.80–171.80225.48226.4412.6712.700.97
PL113.9652.21–179.08554.43615.6620.6521.7661.23
SPP93.840.00–165.2154.3971.648.669.9317.25
BYP28.5014.61–48.5028.9131.9418.8619.823.03
HI22.3216.43–35.036.949.2911.8113.662.35
DFF: days to 50% flowering; SV: seedling vigor; PH: plant height; PL: panicle length; SPP: number of spikelets per panicle; BYP: biological yield per plant; HI: harvest index.
Table 3. Summary of AMOVA between groups and accessions and fixation indices using Fst values.
SourcedfSSMSEst. Var.Percent
Among the Population3351.793117.2641.57510%
Among Individuals1123137.00528.00913.09979%
Within Individuals116210.0001.8101.81011%
Total2313698.797 16.484100%
F-StatisticsValuep (r and >= data)
Fst0.0960.001
Fis0.8790.001
Fit0.8900.001
Disclaimer/Publisher’s Note: The statements, opinions and data contained in all publications are solely those of the individual author(s) and contributor(s) and not of MDPI and/or the editor(s). MDPI and/or the editor(s) disclaim responsibility for any injury to people or property resulting from any ideas, methods, instructions or products referred to in the content.

