Abstract
Reducing carbon dioxide emissions in freight transportation is considered a key objective in contemporary sustainable supply chain management. While several tools and standards have been developed to estimate transport-related emissions, most rely on static assumptions, generic emission factors and are limited to single-scenario evaluation. Therefore, their operational applicability remains restricted especially in dynamic and complex environments where fast responsiveness is essential. Moreover, these tools are often disconnected from real-world constraints and rarely incorporate expert’s input. To address this gap, this study introduces a hybrid decision-support CO2 assessment framework combining theoretical models with field-based inputs. The proposed approach combines structured interviews conducted with 300 supply chain consultants and is operationalized through a dynamic digital tool that enables users to simulate multiple scenarios simultaneously. The tool accounts for critical variables including transport mode, routing distance, vehicle configuration, and shipment characteristics, thereby enabling a contextualized and flexible analysis of carbon emissions. A validation case study was conducted to confirm the applicability of the tool to industrial settings. Computational results show significant variation in emissions across different routing strategies and modal configurations, highlighting the tool’s capacity to support environmentally informed decisions. This research offers both a replicable methodology and a practical contribution: a user-centered, multi-scenario tool that improves the accuracy, adaptability, and strategic value of CO2 emission calculations in freight transport planning.
1. Introduction
Sustainability refers to meeting the needs of the present without compromising the ability of future generations to meet their own needs [1]. It involves a holistic approach that integrates environmental health, economic viability, and social equity [2,3]. This definition, accepted by the majority, remains subject to interpretations, especially in industrial fields. In today’s world, industries are increasingly recognizing the importance of sustainability and are shifting towards practices that reduce environmental impact, enhance social responsibility, and ensure long-term economic growth [4,5]. This shift is driven by a combination of regulatory pressures, consumer demand, and the realization that sustainable practices can lead to cost savings and competitive advantages. Sustainable transport, as a crucial aspect of this movement, encompasses three critical dimensions: environmental, economic, and social [6]. It aims to balance these aspects to ensure long-term viability and minimal negative impact on the planet and society. Ensuring these three parameters simultaneously sounds idealistic because tensions arise, especially when cost targets do not align with environmental or social objectives. Roads, which serve as the primary routes for trucks carrying goods [6], are the leading cause of CO2 emissions, contributing approximately 72% of the transport sector’s greenhouse gas (GHG) emissions based on International Energy Agency (IEA) [7]. This highlights the urgent need for greener transportation solutions [8,9]. Efficient movement of goods within supply chains depends on effective management and careful planning of transportation freight. To achieve this, it is essential to choose the right mode of transport, consolidate goods, and access real-time data.
In addition to these, implementing strategies such as optimizing delivery routes, utilizing energy-efficient vehicles, incorporating intermodal transport, and adopting just-in-time (JIT) delivery systems can further enhance efficiency and sustainability [10]. Leveraging automation, predictive analytics, and Internet of Things (IoT) technologies can play significant roles in anticipating demand, monitoring vehicle conditions, and reducing empty runs, all of which contribute to lower emissions and fuel consumption [11,12,13]. These solutions require investment and skilled labor, which may not be accessible to a wide range of companies, particularly small and medium enterprises (SMEs). Employing driver training programs to encourage fuel-efficient driving, investing in advanced logistics software [14,15], and enhancing collaboration among supply chain partners are also critical strategies for sustainability [16]. Diversifying transportation modes ensures the movement of goods in a cost-effective manner while respecting environmental considerations [17,18,19].
CO2 emissions are typically categorized into three scopes as part of the GHG Protocol, which is the most widely used international accounting tool for understanding, quantifying, and managing GHG emissions. Despite its widespread adoption, it still faces some challenges of data collection. These scopes help organizations identify and manage the different types of emissions associated with their activities. Scope 1 identifies direct emissions from owned or controlled sources. This includes emissions from the combustion of fossil fuels in company-owned or controlled vehicles, machinery, or on-site facilities (e.g., boilers, furnaces). It also includes emissions from industrial processes and chemical reactions that are physically occurring within the company’s control [20,21]. While Scope 2 refers to emissions from energy, which covers indirect emissions from the generation of purchased electricity, steam, heating, and cooling consumed by the reporting company. Although the company does not directly produce these emissions, they occur because of the company’s energy use [20,21]. Lastly, Scope 3 includes all other indirect emissions that occur in a company’s value chain. These are emissions resulting from activities not owned or directly controlled by the company but that are related to its operations. Scope 3 emissions can be the largest portion of a company’s carbon footprint [20,21,22,23].
Managing and reducing emissions across all three scopes is crucial for organizations aiming to achieve sustainability goals and reduce their overall carbon footprint. Many firms focus on Scopes 1 and 2 due to data availability, meaning that Scope 3 is under-addressed despite its huge impact on emissions. Therefore, Scope 3 is often the most challenging to measure and manage due to its breadth and complexity [23,24,25]. However, in the context of transportation within the supply chain of the automotive industry, focusing on Scope 3 emissions can be more crucial than concentrating solely on Scope 1 and 2 emissions. This is due to the significant role that transportation plays in the supply chain and the fact that the emissions produced by this activity typically fall under Scope 3. Figure 1 highlights the importance of prioritizing Scope 3 emissions in transportation.
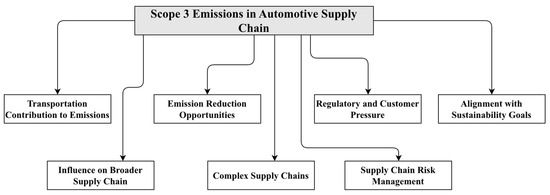
Figure 1.
Drivers of focusing on Scope 3 emission within automotive SC.
Transportation-related emissions represent the following:
- Significant Contribution to Overall Emissions: Transportation-related emissions, especially in global supply chains, can represent a large portion of an automotive company’s total carbon footprint. These emissions occur during the transportation of raw materials, components, and finished vehicles across various stages of the supply chain. Since these activities are often outsourced to third-party logistics providers, they fall under Scope 3.
- Complex and Extensive Supply Chains: Automotive supply chains are typically complex and extensive, involving multiple tiers of suppliers across different regions. Each stage of transportation—from raw material extraction to final product delivery—adds to the cumulative emissions.
- Regulatory and Customer Pressure: There is growing pressure from regulators and customers for greater transparency and reduction in emissions across the entire supply chain. Companies that fail to address Scope 3 emissions, including transportation, may face reputational risks, customer dissatisfaction, and even financial penalties.
- Potential for Emission Reductions: Focusing on Scope 3 emissions in transportation offers significant opportunities for reducing the overall carbon footprint of an automotive company. By optimizing logistics, choosing lower-emission transport modes, and collaborating with suppliers, companies can achieve substantial emission reductions.
- Supply Chain Risk Management: Managing Scope 3 emissions, including those from transportation, helps companies identify and mitigate risks in their supply chain. This includes reducing reliance on high-emission transport options, which may become costlier or more restricted due to future regulations or carbon pricing.
- Alignment with Sustainability Goals: Many automotive companies have set ambitious sustainability targets, such as achieving carbon neutrality by a specific date. Addressing Scope 3 emissions from transportation is essential to meet these goals, as these emissions can be a major part of the overall carbon footprint.
- Influence on the Broader Supply Chain: By focusing on Scope 3 emissions, automotive companies can drive broader change throughout their supply chain. Encouraging or requiring suppliers and logistics providers to adopt more sustainable practices can lead to industry-wide improvements in carbon emissions.
In the transportation segment of the automotive supply chain, Scope 3 emissions are often more significant than those from direct operations (Scope 1) or purchased energy (Scope 2). Prioritizing these emissions allows companies to manage a critical part of their carbon footprint, reduce regulatory and financial risks, achieve sustainability goals, and meet growing demands for transparency and environmental responsibility. Therefore, in the specific case of transportation within the supply chain, focusing on Scope 3 emissions is vital for comprehensive and effective emissions management in the automotive industry.
A crucial aspect of achieving sustainability in road freight transport is quantifying and measuring emissions. Accurate measurement allows for better tracking of progress towards emission reduction goals, helps identify the most significant sources of emissions, and enables the development of targeted strategies to mitigate these emissions [26]. Using tools such as carbon footprint calculators, telematics systems, and emission-reporting software can provide valuable data and insights that inform decision-making and policy formulation [27,28]. However, discrepancy in parameters and different emission factors of these tools are limiting comparability and may lead to different results, thus impacting decision-making. Cost and technical expertise may also be restricting their adoption, particularly among small and medium logistics providers. In response to these challenges, several standardized methods have been developed to calculate CO2 emissions in freight transport such as activity-based, energy-based, and savings-based methods [29,30,31].
Several tools are available for calculating CO2 emissions. Table 1 provides a summary of the most used tools, which vary in terms of the input data they require. Many of these focus on limited parameters such as travel distance and fuel consumption, while overlooking important factors like vehicle type, total freight weight, and energy efficiency. Furthermore, all the reviewed tools lack sufficient flexibility to simulate different transport scenarios, an essential capability for real-world logistics decision-making. In contrast, the proposed tool integrates a broader range of input parameters, including vehicle specifications, emission factors, shipment weight, and energy efficiency. As a result, beyond improving the accuracy of CO2 emission estimation, the tool also enables users to simulate and compare multiple transport scenarios, offering a practical and adaptable solution for strategic planning.

Table 1.
Comparison of existing CO2 emissions calculation tools based on input data requirements.
Based on the aforementioned discussion and the lack of standardized and unified decision-support tools for freight transport emissions, this work aims to address several key challenges in developing a reliable and practical tool. Specifically, it seeks to determine the most relevant data and readily available to achieve an accurate CO2 emission calculation. It also investigates the possibility of supporting freight transport decision-making while ensuring consistent and reliable emission estimation. An additional concern that could be addressed is whether using a unified calculation reference can help maintain consistency across users and use cases. Finally, though not exclusively, the study explores the potential to extend the tool to assess multi-modal transport strategies and evaluate whether such strategies can import a significant reduction in CO2 emissions. To address these questions and concerns, the proposed study aims to provide transport decision-makers with a practical, consistent, and data-driven tool for estimating CO2 emissions and evaluating alternative transport scenarios. The objective is not limited in improving the accuracy of emissions assessment, but also to support operational decisions through a flexible and user-friendly interface. Therefore, the primary contributions of this paper can be outlined as follows:
- Unlike most available tools, this tool allows the user to perform multiple calculations simultaneously. The user can then compare different scenarios, shipment options, and transport modes at the same time. This helps professionals to make more precise, fast, and informative decisions. Comparisons may lead to cost and resource optimization and create a competitive advantage.
- This hybrid framework combines theory and field insight as it incorporates experts input through a structured questionnaire involving 300 supply chain consultants, making the tool more connected to operational reality.
- The study considers contextual variables such as distance, weight, mode, and type of transport that are close to real conditions of the shipments, allowing for more cost-effective decisions.
- Using the same tool ensures alignment between professionals and gives management a clear idea on how they evaluate emissions based on the same calculation reference. It can be considered a transport decision support tool.
- The tool serves as data-driven decision support for policymakers.
The rest of this paper is organized as follows: Section 2 describes the methodology adopted in this paper. Section 3 gives clear details about data processing, including calculation basis, tool modeling, and its implementation. Section 4 presents and discusses the results based on a real-world case study from the automotive industry, highlighting the tool’s validation and its practical benefits. Finally, outcomes are summarized in the conclusion.
2. Methodology
In general, the calculation of CO2 emissions in freight transport can be classified into three commonly used approaches, depending on the type of input data: activity-based, energy-based, and saving-based methods [29,30,31]. The activity-based method estimates CO2 emissions based on operational parameters such as the distance traveled and the weight of goods transported. In contrast, the energy-based method derives emissions by directly measuring or estimating the energy consumption of the transport vehicle. The saving-based method, on the other hand, focuses on evaluating emission reductions achieved through efficiency improvements or alternative practices.
Among these, activity-based data are widely available across various sectors, making data collection easier and allowing for more flexible configuration of the tool developed in this work. Conversely, data required for energy-based and saving-based methods are often more difficult to obtain and less transferable across domains. Moreover, these approaches typically rely on estimations or assumptions regarding efficiency, which can compromise accuracy. For these reasons, the activity-based method presents a more practical and reliable approach, as it is grounded in numerous real-world measurements.
In light of these considerations, the adopted methodology in this research follows an activity-based approach. It was developed through a combination of a literature review and in-depth interviews with 300 supply chain consultants working on freight transport definition for a multinational automobile company. The primary mission of these consultants is to define transportation flow and mode between a supplier and their various customers. Based on the findings from this exploratory phase, a review of existing emission calculation tools was established. Subsequently, a dedicated CO2 emissions estimation tool was developed using the activity-based approach, enabling consultants to utilize available data and establish a consistent and unified estimation method. Finally, a case study was conducted using the tool, followed by a discussion of strategies to reduce GHG emissions based on the estimation results. Figure 2 illustrates the flowchart of the proposed approach.
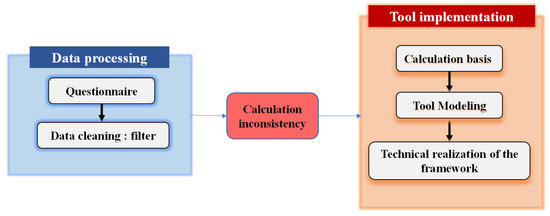
Figure 2.
Overall methodology.
The development process of the CO2 emissions calculation involves three successive phases, each building upon on the previous one to ensure a structural and reliable implementation.
The first phase focuses on outlining the calculation basis, which comprises a thorough understanding of the foundational logic and the mathematical formulas required for accurate CO2 estimation. This first step is crucial in identifying the foundational principles that could ensure consistency in the tool’s output and guide its operation. Following this, the modeling of the tool is addressed, which concentrates on designing both conceptual and operational models to represent how the tool would function in practice. This encompasses defining the data flow, user interactions, and output generation. These models are crucial for visualizing the overall architecture and logic of the tool before moving on to the implementation phase. The final phase involves the physical implementation of the tool using Visual Basic for Application (VBA). During this stage, the previously designed models were converted into functional software. Moreover, this phase includes coding, debugging, and testing to ensure that the tool satisfies the desired specifications and operates accurately and efficiently.
This structured approach ensured that the tool was developed methodically, with each phase building on the previous one to create a robust and reliable CO2 calculation tool.
3. Data Processing and Tool Implementation
The development of the CO2 emissions calculation tool requires a systematic approach that integrates both data processing and software implementation. This process is organized into four main stages: data collection, definition of the calculation basis, tool modeling, and physical implementation. Each of these steps is detailed in the subsections below.
3.1. Data Processing
Aiming to understand the actual practices regarding GHG emissions in freight transport planning, a questionnaire was prepared and distributed by email to a pool of 300 supply chain consultants. These consultants are actively involved in defining transport flows and selecting transport modes for automotive companies. The primary objective of the questionnaire was to assess whether environmental considerations, particularly CO2 emissions, were integrated into their project analysis, and if so, whether the method for emissions calculation was employed. For those not including such factors, the survey sought to identify the underlying reasons.
The respondents comprised a diverse group of professionals, with an age range between 28 and 57 years. The company’s supply network is active across Europe. Moreover, the firms they represented included small logistics providers and large international transport management consultancies. This variety enables the collection of a comprehensive overview of the sector’s current practices. The three most commonly used tools among the consultants who participated in the questionnaire survey were free online platforms, including EcoTransIT World [37], the Global Logistics Emissions Council (GLEC) framework, and the GHG Protocol (GHG Protocol).
As illustrated in Figure 3, the results revealed that 72% of the consultants ignore the incorporation of environmental factors into their decision-making process when determining the transportation flows or modes. Instead, the focus remained firmly on financial targets, with the absence of a practical and standardized emissions estimation tool identified as a key barrier. On the other hand, the remaining 28% reported using various online tools, where the inconsistency among these tools in terms of methodology and emission factors often led to unreliable or unmatched CO2 estimates.
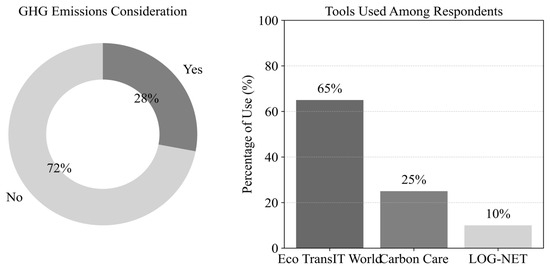
Figure 3.
Results of questionnaire.
In the process of designing the emissions estimation tool, the study focused specifically on Scope 3 emissions. These represent indirect emissions not produced by the company itself but by activities within its broader value chain, especially upstream logistics, which is the main area of responsibility for the surveyed consultants. Hence, this decision aligns with real-word scope of their work and ensures that the tool addresses emissions they can influence.
To guarantee data quality, preliminary filtering was applied to remove incomplete or incoherent responses. Furthermore, outlier values, such as unusually short or long distance, or unreasonably high emission factor inputs, were identified and verified against project documentation when available. Although the survey did not include sensitive data such as personal income or company revenue, strict anonymization procedures were taken for all responses. Additionally, the possibility of self-reporting bias and questions being interpreted inconsistently was acknowledged, and measures were put in place to mitigate this. The questionnaire was pre-tested with a smaller sample of consultants before full distribution.
3.2. Framework Development
3.2.1. Calculation Basis
There are multiple data sources that can be used to estimate fuel consumption and emissions for Scope 3, each offering varying levels of accuracy and applicability depending on the use case. Given that transportation activities in this study are outsourced, and that direct energy consumption data is generally unavailable, an activity-based approach was selected as the most practical and reliable method for calculating CO2 emissions.
The general formula used for CO2 emission estimation is based on ton-kilometers and includes energy and emission factors, as follows:
where represents the total ton-kilometers for shipment, is the energy efficiency factor (kg of fuel per ton-kilometer), and is the CO2 emission factor (kg CO2e per kg of fuel).
The ton-kilometer () value is calculated as follows:
where represents the total weight (in tonnes) and is the travel distance (in kilometers).
The energy efficiency factor () represents the amount of fuel consumed per ton-kilometer and varies depending on the transport mode (road, rail, maritime, air). The emission factor corresponds to the CO2 equivalent emitted per unit of fuel and varies by fuel type.
In this study, the values for both energy efficiency and emission factors are based on those recommended by the GLEC Framework. For each transportation mode, the framework provides a standardized fuel consumption per kilometer, average loading rates, and CO2 emission factors per unit of fuel.
Accordingly, the emission factor can also be expressed in terms of emissions per unit of distance, adjusted by the average load factor:
where represents the average loading rate. This method allows for consistent calculation of emissions per transported unit and ensures comparability across different transport scenarios.
Thereby, the developed tool incorporates these formulas and allows users to input or adjust key operational parameters, such as total freight weight, origin and destination (supplier and customer addresses), and vehicle loading rate. Additionally, transport distance is automatically calculated using a mapping application programming interface (API) based on the specified addresses. Less easily quantifiable factors, including weather conditions, traffic, and number of stops, are accounted for indirectly through the emission factors recommended in the GLEC framework.
Overall, this approach ensures a flexible and standardized calculation method, appropriate for consultants working with different freight transport scenarios while remaining within the context of activity-based emission accounting.
3.2.2. Tool Modeling
To elucidate the functionalities of the developed tool and the interaction between users and system component, a use case diagram (Figure 4) was created. This diagram outlines the various possible operations withing the system and specifies the interactions between the primary user (the supply chain consultant) and each functionality. Complementarily, a sequence diagram, depicted in Figure 5, illustrates the dynamic behavior of the system by showing how operations are executed in a step-by-step manner.
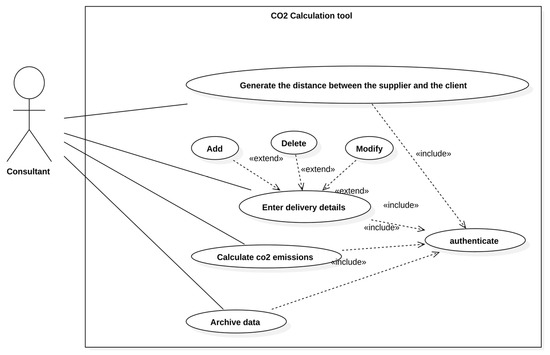
Figure 4.
Tool use case diagram.
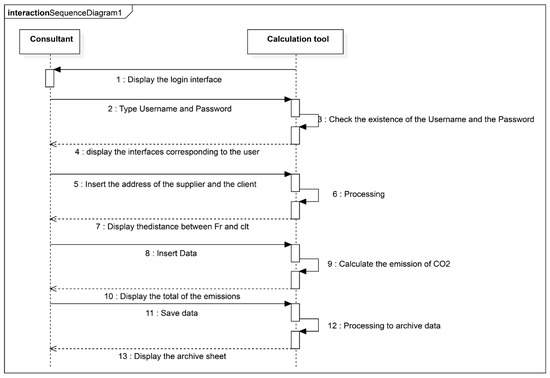
Figure 5.
Tool sequence diagram.
The tool has been designed to incorporate a user-friendly graphical interface. This ensures that all input parameters, whether entered manually or preconfigured, are visible and accessible to any authenticated user. It is imperative for the authentication process to be completed before any access to the system is granted. This procedure is systematically incorporated into all significant interactions, including the entry of delivery data, the calculation of CO2 emissions, and the retrieval of archived records.
The consultant, as the principal agent, is responsible for initiating all actions within the tool. The mentioned elements comprise the entry of shipment information, the initiation of distance calculations between supplier and customer locations, and the computation of CO2 emissions based on the selected transport mode and activity parameters. Upon completion of a calculation, the results can be modified or stored as required. Furthermore, the tool is also capable of supporting data management operations, such as the addition, updating, and deletion of delivery records. This provides users the flexibility to adapt to changing logistics scenarios.
From a functional perspective, the “Enter Delivery Details” use case serves as a foundational process that is extended by optional actions such as the addition, modification, or deletion of specific delivery entries. The system architecture enforces that the execution of these operations is contingent upon user intent and context. Furthermore, the authentication process is defined as a mandatory use case that is to be implemented prior to any other action, thereby ensuring secure access to the system.
Standardized modeling, in the form of Unified Modeling Language (UML), has been shown to aid in the structuring of tool development, thus contributing to its reproducibility and future scalability. The design models under consideration are intended to support the goal of making the tool intuitive and adaptable, especially for non-technical users such as supply chain consultants, while also maintaining the integrity of the emissions estimation process.
Aiming to support and structure the system modeling, a sequence diagram is constructed to illustrate the chronological flow of interactions between the tool and the consultants, as depicted in Figure 5. This diagram captures the key operational steps, starting from authentication and data processing to the archival and retrieval of emissions data.
In detail, the sequence begins with the login interface being presented to the consultant, who then enters their credentials. Once the login details are verified and authenticated, the consultant can input delivery-related information, including the addresses of the supplier and the client. Using an integrated mapping API, the tool automatically processes these addresses and returns the corresponding transport distance. Subsequently, the consultant provides the required shipment parameters, such as total freight weight, load factor, and transport mode. Based on this input, the system calculates the CO2 emissions by applying the formulas and emission factors described in the previous section. The results are immediately displayed to the user.
At this stage, the consultant may choose to store the data for record-keeping or future use. The system then processes the request by archiving the emissions data in an internal database and subsequently presents a summary sheet containing the archived information. Overall, the diagram clearly outlines the flow of information exchanged between the consultant and the tool and highlights the tool’s activation periods, where background processing tasks are executed. These visual representations collectively help in understanding the real-time operational behavior of the tool and validate its logical consistency with the intended functional design.
3.2.3. Tool Physical Implementation
The CO2 emissions calculation tool was developed using VBA, chosen for its seamless integration and accessibility for end users without programming expertise. The resulting interface is designed to be user-friendly and intuitive, allowing flexible navigation throughout the tool with minimal training. Users are provided with a range of features, including the ability to select predefined parameters, as well as insert, modify, and delete delivery data. Each action is supported by guided input fields to minimize the risk of errors and ensure consistency in data entry. Furthermore, all calculation results are archived automatically, enabling users to track historical data and evaluate the effectiveness of implemented transport strategies over time. To support comprehension and usability, Figure 6 presents a graphical flowchart illustrating the main steps involved in the CO2 emissions estimation process using the developed framework. The example depicted in the figure demonstrates the calculation flow for a road transport scenario from Montecchio to Vigo using a rigid truck.
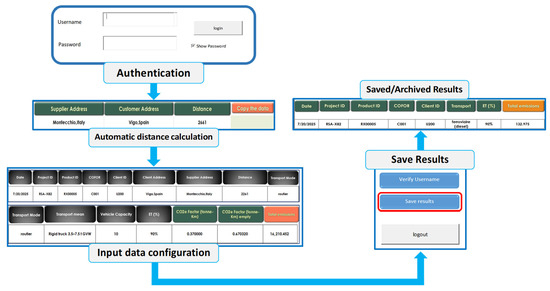
Figure 6.
Tool graphical interface.
4. Results and Discussion
4.1. Case Study
To validate the proposed calculator, a case study was conducted within a company that outsources the transportation part for its client. Due to confidentiality agreements, the names of the involved companies are not disclosed. The case study focuses on an automotive component shipped from a supplier based in Italy to multiple customer plants located across Europe. In the current configuration, transportation is handled via direct road delivery and the customer plants arranging pick-ups from the supplier’s manufacturing site. This operation is performed twice per week, resulting in significant CO2 emissions. Figure 7 illustrates the existing flow for an example delivery between Montecchio and Vigo. Additionally, Table 2 summarizes the CO2 emissions and logistical parameters associated with the current flow delivery (road-based transport) configuration for each customer destination. These values serve as the baseline for assessing the proposed multimodal optimization.
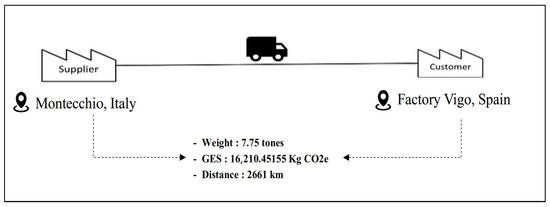
Figure 7.
Current flow delivery.

Table 2.
CO2 emissions per delivery.
To address this environmental impact, a modal shift strategy is proposed. This proposed alternative involves the replacement of direct road transport with a multimodal approach that combines road and rail. For each supplier–customer pair, the nearest available railway terminals were identified, as detailed in Table 3.

Table 3.
List of nearest terminals.
4.2. Results Discussion
Employing the developed calculation tool, CO2 emissions associated with the proposed multimodal transport strategy were estimated. The results, summarized in Table 4, indicate a significant environmental benefit, with a monthly reduction of 27,645 kg CO2e in the CO2 emissions. This represents a notable improvement compared to the current road-only configuration, previously totaling 41,340.92 kg CO2e mentioned in Table 2. Figure 8 illustrates the enhanced logistics flow for the Montecchio–Vigo route, serving as a representative example of the optimized configuration.

Table 4.
CO2 emissions for multi-modal transport.
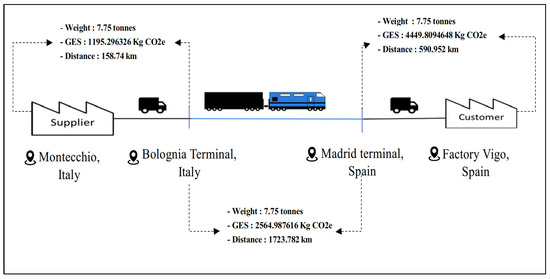
Figure 8.
New optimized flow proposal.
The shift from road transport to multimodal transport with greater use of rail mode has led to substantial improvements in CO2 reduction, with decreases reaching up to 80% in the lane connecting Madrid to Montecchio with 92% rail mode share, while Vigo and Trnava reached, respectively, 47% and 33% emission reductions. Even routes with lower rail integration, like Rennes and Sevelnord, still showed measurable improvements. Table 5 provides a summary of the gains before and after implementation of multimodal flow, while Figure 9 illustrates the extent of these improvements. Overall, the total monthly CO2 emissions decreased from 41,340.92 kg CO2e (road-only) to 27,645 kg CO2e (multimodal). This decrease corresponds to a reduction of 13,695.92 kg CO2e, or 33%. Therefore, the obtained results confirm the substantial environmental advantages of incorporating rail transport and demonstrate the tool’s capacity to guide strategic decision-making based on data-driven assessments. This allows us to analyze different scenarios at once and evaluate the operational feasibility of each lane. In addition, rapid simulation is something highly requested in an uncertain and time-sensitive field such as freight transportation. This helps managers to respond quickly to disruption risks as well based on data-driven insights.

Table 5.
Generated gains of switch from road to multi-modal transport.
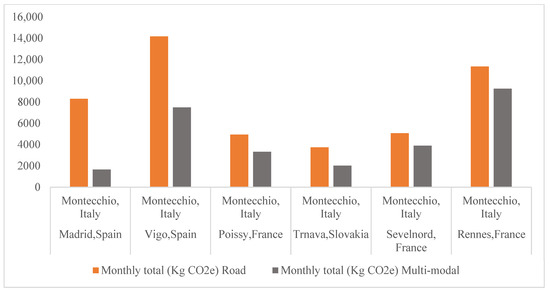
Figure 9.
Comparison of road flow and multimodal.
The emissions data summarized in Table 5 are further illustrated in Figure 9. The latter visually depicts the comparative monthly CO2 emissions across all customer lanes before and after implementing the multimodal transport strategy. The chart clearly highlights the considerable reductions achieved, especially on routes with a high share of rail usage such as Madrid and Vigo. Meanwhile, in routes with lower modal shift levels, noticeable improvements are evident, thus reinforcing the value of partial rail integration where full model replacement is not feasible. These results have been archived in a database as the tool allows this option for further insights.
To target a specific reduction rate, we have plotted a trend curve that correlates the rate of railway transportation with the CO2 reduction rate. This analytical representation enables the estimation of the maximum rail distance required to obtain a predefined reduction objective. Figure 10 illustrates the variation curve of this correlation.
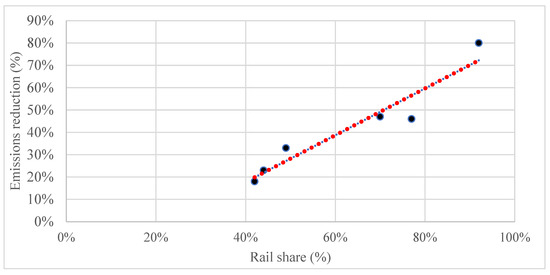
Figure 10.
Specific reduction rate trend curve.
The elongated and increasing shape of the scatterplot, represented by red dots, suggests a positive linear relationship between the CO2e emission reduction rate and the percentage of road traveled by train. Each black dot refers to the correlation between emission reduction rate and rail share for a specific customer city. Indeed, the observed linear correlation coefficient in the sample is given as follows:
This correlation coefficient indicates that the independence between the two parameters is quite strong. Therefore, based on a chosen reduction objective, we can determine the minimum acceptable percentage of road traveled by rail mode. For example, for a percentage of rail share equal to 50% (x = 50%), the emission reduction percentage of this combination is
This quantifiable relationship serves as a foundation for evidence-based strategies that can be set not only by professionals but policymakers as well.
The development and implementation of this tool have significantly enhanced consistency and accuracy in freight road transportation assessments. By eliminating discrepancies in calculations among consultants, stakeholders have made more informed and reliable decisions. The case study has demonstrated the tangible benefits of utilizing this tool to assess the environmental impact of road transport. Considering a switch to multi-modal transportation options, combining rail and road, has improved efficiency and has led to a substantial reduction in CO2 emissions. The integration of multimodal solutions is often restricted by a lack of reliable decision-support mechanisms that consider environmental and operational parameters simultaneously. The analysis informs about the specific percentage of rail share necessary to achieve a targeted reduction in emissions, highlighting the need for investment in infrastructure, such as rail terminals and intermodal hubs. Such findings provide a concrete basis for infrastructure planning and supply chain modeling. The tool can support policymakers to set realistic emissions targets and allocate the needed infrastructure to achieve them, thus aligning with international climate directives and raising accountability and stakeholders’ commitment to sustainable targets. This underscores its potential not only as a means of standardizing assessments but also as a catalyst for more sustainable transportation solutions. Consequently, the tool serves as a technical enabler and as a strategic instrument guiding long-term sustainability transitions in the freight sector.
5. Conclusions
As environmental concerns gain prominence, not every company prioritizes this issue as a primary focus. However, addressing sustainability in freight transportation is increasingly essential. This research has introduced an emissions calculation tool designed to improve calculation consistency and enable access to data-based strategies especially for SMEs that do not have enough resources to obtain expensive third parties services. Additionally, the tool focuses on Scope 3 emissions that arise directly from transportation emissions and considers customized parameters serving as a unified reference for users. Through the tool assessment conducted via a real-world case study, the utility of the tool was confirmed in enabling rapid and accurate estimations across multiple scenarios. It provides end-users with timely and well-informed inputs to support effective decision-making regarding flow optimization. For instance, shifting to a multimodal transportation strategy resulted in a substantial reduction in CO2 emissions—up to 80% on certain lanes, demonstrating the value of such a tool in complex, uncertain, and highly practical fields like supply chain management. Based on the obtained results, the case study highlighted the positive correlation between emission reduction and rail share. In addition, it has also highlighted the link between optimization objectives and modal configurations. Thus, it supports not only industrials actors but policymakers as well, by providing them with evidence justifying infrastructure development, enhancing sustainability awareness and commitment, and aligning international carbon neutrality targets.
While the tool offers many advantages, it is important to acknowledge certain limitations. Currently, it focuses only on Scope 3 emissions given that case study participants do not have direct access to parameters required in remaining scopes. Moreover, it is based on deterministic models, limiting its ability to consider stochastic real-world parameters like cost, delays, strikes, and infrastructure capabilities. To address these limitations, future work will focus on adapting the tool to cover all emission scopes, thereby enhancing its flexibility to handle a wider range of inputs and contexts. Additional future efforts will involve integrating neural network (NN) models to improve the predictive capabilities of the tool and achieve a more generalized model. For this purpose, the archive feature was added, as it will serve as a valuable database for developing NN models to forecast future emissions. Therefore, the trained model will help decision-makers to proactively define strategies and contingency plans ensuring long-term vision and generating competitive advantage. Overall, the proposed framework can be utilized as a powerful digital tool not only for emissions monitoring but also for strategic transformation toward low-carbon, resilient, and intelligent freight transportation systems.
Author Contributions
Conceptualization, S.L. and H.E.H.; methodology, S.L., H.E.H. and L.R.; software, S.L. and H.E.H.; validation, S.L. and H.E.H.; formal analysis, S.L., H.E.H. and L.R.; investigation, S.L. and H.E.H.; resources, S.L. and H.E.H.; data curation, S.L. and H.E.H.; writing—original draft preparation, S.L. and H.E.H.; writing—review and editing, S.L., H.E.H. and L.R.; visualization, S.L. and H.E.H.; supervision, H.E.H.; project administration, S.L. and H.E.H.; funding acquisition, S.L. and H.E.H. All authors have read and agreed to the published version of the manuscript.
Funding
This research received no external funding.
Data Availability Statement
The original contributions presented in this study are included in the article. Further inquiries can be directed to the corresponding author.
Conflicts of Interest
The authors declare no conflicts of interest.
Correction Statement
This article has been republished with a minor correction to the Data Availability Statement. This change does not affect the scientific content of the article.
References
- Planko, J.; Silvius, G. Sustainability in Business. In Sustainability in Project Management; Routledge: Abingdon, UK, 2012; ISBN 978-1-315-24194-4. [Google Scholar]
- Purvis, B.; Mao, Y.; Robinson, D. Three Pillars of Sustainability: In Search of Conceptual Origins. Sustain. Sci. 2019, 14, 681–695. [Google Scholar] [CrossRef]
- Rees, W. Ecological Footprint. In Companion to Environmental Studies; Routledge: Abingdon, UK, 2018; ISBN 978-1-315-64005-1. [Google Scholar]
- Adams, R.; Jeanrenaud, S.; Bessant, J.; Denyer, D.; Overy, P. Sustainability-Oriented Innovation: A Systematic Review. Int. J. Manag. Rev. 2016, 18, 180–205. [Google Scholar] [CrossRef]
- Chatti, W. Moving towards Environmental Sustainability: Information and Communication Technology (ICT), Freight Transport, and CO2 Emissions. Heliyon 2021, 7, e08190. [Google Scholar] [CrossRef]
- Chatti, W. Information and Communication Technologies, Road Freight Transport, and Environmental Sustainability. Environ. Econ. 2020, 11, 124–132. [Google Scholar] [CrossRef]
- Kazancoglu, Y.; Ozbiltekin-Pala, M.; Ozkan-Ozen, Y.D. Prediction and Evaluation of Greenhouse Gas Emissions for Sustainable Road Transport within Europe. Sustain. Cities Soc. 2021, 70, 102924. [Google Scholar] [CrossRef]
- Miklautsch, P.; Woschank, M. A Framework of Measures to Mitigate Greenhouse Gas Emissions in Freight Transport: Systematic Literature Review from a Manufacturer’s Perspective. J. Clean. Prod. 2022, 366, 132883. [Google Scholar] [CrossRef]
- Zhao, X.; Ke, Y.; Zuo, J.; Xiong, W.; Wu, P. Evaluation of Sustainable Transport Research in 2000–2019. J. Clean. Prod. 2020, 256, 120404. [Google Scholar] [CrossRef]
- The Geography of Transport Systems. Available online: https://www.routledge.com/The-Geography-of-Transport-Systems/Rodrigue/p/book/9781032380407 (accessed on 25 July 2025).
- Mangiaracina, R.; Perego, A.; Seghezzi, A.; Tumino, A. Innovative solutions to increase last-mile delivery efficiency in B2C e-commerce: A literature review. Int. J. Phys. Distrib. Logist. Manag. 2019, 49, 901–920. [Google Scholar] [CrossRef]
- Esmaeilian, B.; Sarkis, J.; Lewis, K.; Behdad, S. Blockchain for the Future of Sustainable Supply Chain Management in Industry 4.0. Resour. Conserv. Recycl. 2020, 163, 105064. [Google Scholar] [CrossRef]
- Bag, S.; Wood, L.C.; Xu, L.; Dhamija, P.; Kayikci, Y. Big Data Analytics as an Operational Excellence Approach to Enhance Sustainable Supply Chain Performance. Resour. Conserv. Recycl. 2020, 153, 104559. [Google Scholar] [CrossRef]
- Nadiia, R.; Artem, F.; Denys, G.; Oleksandr, K.; Nataliia, V.; Oksana, K.; Tetyana, D. Green Logistics as a Sustainable Development Concept of Logistics Systems in a Circular Economy. In Big Data in Finance: Transforming the Financial Landscape: Volume 1; Alareeni, B., Ed.; Springer Nature Switzerland: Cham, Switzerland, 2025; pp. 111–120. ISBN 978-3-031-75095-3. [Google Scholar]
- Coloma, J.F.; García, M.; Fernández, G.; Monzón, A. Environmental Effects of Eco-Driving on Courier Delivery. Sustainability 2021, 13, 1415. [Google Scholar] [CrossRef]
- Singh, H.; Kathuria, A. Analyzing Driver Behavior under Naturalistic Driving Conditions: A Review. Accid. Anal. Prev. 2021, 150, 105908. [Google Scholar] [CrossRef]
- Creazza, A.; Colicchia, C.; Evangelista, P. Leveraging Shippers-Logistics Providers Relationships for Better Sustainability in Logistics: The Perspective of SMEs. Int. J. Logist. Manag. 2023, 35, 1009–1039. [Google Scholar] [CrossRef]
- Chandrasiri, C.; Kiridena, S.; Dharmapriya, S.; Kulatunga, A.K. Adoption of Multi-Modal Transportation for Configuring Sustainable Agri-Food Supply Chains in Constrained Environments. Sustainability 2024, 16, 7601. [Google Scholar] [CrossRef]
- Yannis, G.; Kopsacheili, A.; Dragomanovits, A.; Petraki, V. State-of-the-Art Review on Multi-Criteria Decision-Making in the Transport Sector. J. Traffic Transp. Eng. Engl. Ed. 2020, 7, 413–431. [Google Scholar] [CrossRef]
- Beckx, C.; Panis, L.I.; Vankerkom, J.; Janssens, D.; Wets, G.; Arentze, T. An Integrated Activity-Based Modelling Framework to Assess Vehicle Emissions: Approach and Application. Environ. Plan. B Plan. Des. 2009, 36, 1086–1102. [Google Scholar] [CrossRef]
- Hervani, A.A.; Helms, M.M.; Sarkis, J. Performance Measurement for Green Supply Chain Management. Benchmarking Int. J. 2005, 12, 330–353. [Google Scholar] [CrossRef]
- Ellram, L.M.; Murfield, M.L.U. Environmental Sustainability in Freight Transportation: A Systematic Literature Review and Agenda for Future Research. Transp. J. 2017, 56, 263–298. [Google Scholar] [CrossRef]
- Hertwich, E.G.; Wood, R. The Growing Importance of Scope 3 Greenhouse Gas Emissions from Industry. Environ. Res. Lett. 2018, 13, 104013. [Google Scholar] [CrossRef]
- Li, M.; Wiedmann, T.; Hadjikakou, M. Enabling Full Supply Chain Corporate Responsibility: Scope 3 Emissions Targets for Ambitious Climate Change Mitigation. Environ. Sci. Technol. 2020, 54, 400–411. [Google Scholar] [CrossRef] [PubMed]
- Royo, B. Measuring and Allocating Scope 3 GHG Emissions. In Towards User-Centric Transport in Europe 2: Enablers of Inclusive, Seamless and Sustainable Mobility; Müller, B., Meyer, G., Eds.; Springer International Publishing: Cham, Switzerland, 2020; pp. 200–211. ISBN 978-3-030-38028-1. [Google Scholar]
- Daduna, J.R. Intermodal Competition in Freight Transport—Political Impacts and Technical Developments. In Computational Logistics, Proceedings of the 12th International Conference, ICCL 2021, Enschede, The Netherlands, 27–29 September 2021; Mes, M., Lalla-Ruiz, E., Voß, S., Eds.; Springer International Publishing: Cham, Switzerland, 2021; pp. 642–660. [Google Scholar]
- Agarwal, A.K.; Mustafi, N.N. Real-World Automotive Emissions: Monitoring Methodologies, and Control Measures. Renew. Sustain. Energy Rev. 2021, 137, 110624. [Google Scholar] [CrossRef]
- Azarkamand, S.; Ferré, G.; Darbra, R.M. Calculating the Carbon Footprint in Ports by Using a Standardized Tool. Sci. Total Environ. 2020, 734, 139407. [Google Scholar] [CrossRef]
- Singh, M.; Dubey, R.K. Deep Learning Model Based CO2 Emissions Prediction Using Vehicle Telematics Sensors Data. IEEE Trans. Intell. Veh. 2023, 8, 768–777. [Google Scholar] [CrossRef]
- Cichosz, M.; Nowicka, K.; Pluta-Zaremba, A. Toolbox Element: CO2 Calculator. 2018. Available online: https://programme2014-20.interreg-central.eu/Content.Node/ChemMultimodal/D.T1.2.9-CO2-Calculator.pdf (accessed on 12 December 2024).
- Cichosz, M.; Pluta-Zaremba, A. How to Improve Freight Transport Emissions’ Management? LogForum 2019, 15, 93–105. [Google Scholar] [CrossRef]
- Chang, C.-T.; Lin, T.-P. Estimation of Carbon Dioxide Emissions Generated by Building and Traffic in Taichung City. Sustainability 2018, 10, 112. [Google Scholar] [CrossRef]
- Goodchild, A.; Wygonik, E.; Mayes, N. An Analytical Model for Vehicle Miles Traveled and Carbon Emissions for Goods Delivery Scenarios. Eur. Transp. Res. Rev. 2018, 10, 8. [Google Scholar] [CrossRef]
- Sukor, N.S.A.; Basri, N.K.; Hassan, S.A. Carbon Footprint Reduction in Transportation Activity by Emphasizing the Usage of Public Bus Services among Adolescents. In IOP Conference Series: Materials Science and Engineering; IOP Publishing: Bristol, UK, 2017; Volume 226, p. 012054. [Google Scholar]
- Saighani, A.; Sommer, C. Potentials for Reducing Carbon Dioxide Emissions and Conversion of Renewable Energy for the Regional Transport Market-a Case Study. Transp. Res. Procedia 2017, 25, 3479–3494. [Google Scholar] [CrossRef]
- Wei, P.; Pan, H. Research on Individual Carbon Dioxide Emissions of Commuting in Peri-Urban Area of Metropolitan Cities—An Empirical Study in Shanghai. Transp. Res. Procedia 2017, 25, 3459–3478. [Google Scholar] [CrossRef]
- Chocholac, J.; Hyrslova, J.; Kucera, T.; Machalik, S.; Hruska, R. Freight Transport Emissions Calculators as a Tool of Sustainable Logistic Planning. Commun.-Sci. Lett. Univ. Zilina 2019, 21, 43–50. [Google Scholar] [CrossRef]
Disclaimer/Publisher’s Note: The statements, opinions and data contained in all publications are solely those of the individual author(s) and contributor(s) and not of MDPI and/or the editor(s). MDPI and/or the editor(s) disclaim responsibility for any injury to people or property resulting from any ideas, methods, instructions or products referred to in the content. |
© 2025 by the authors. Licensee MDPI, Basel, Switzerland. This article is an open access article distributed under the terms and conditions of the Creative Commons Attribution (CC BY) license (https://creativecommons.org/licenses/by/4.0/).