Article

Shifting Landscapes, Escalating Risks: How Land Use Conversion Shapes Long-Term Road Crash Outcomes in Melbourne

by
Ali Soltani
1,2,3,*,
Mohsen RoohaniQadikolaei
4 and
Amir Sobhani
5
1
College of Science and Engineering, Flinders University, Bedfork Park, SA 5042, Australia
2
LE STUDIUM Loire Valley Institute for Advanced Studies, 45000 Orĺeans, France
3
CEDETE Research Center, University of Orĺeans, 45065 Orĺeans, France
4
Department of Urban Planning, University of Guilan, Rasht 41996-13776, Iran
5
School of Engineering, Deakin University, Melbourne, VIC 3220, Australia
*
Author to whom correspondence should be addressed.
Future Transp. 2025, 5(2), 75; https://doi.org/10.3390/futuretransp5020075
Submission received: 18 April 2025 / Revised: 19 May 2025 / Accepted: 9 June 2025 / Published: 17 June 2025

Abstract

:
Road crashes impose significant societal costs, and while links between static land use and safety are established, the long-term impacts of dynamic land use conversions remain under-explored. This study addresses this gap by investigating and quantifying how specific land use transitions over a decade influence subsequent road crash frequency in Metropolitan Melbourne. Our objective was to understand which conversion pathways pose the greatest risks or offer safety benefits, informing urban planning and policy. Utilizing extensive observational data covering numerous land use conversions, we employed Negative Binomial models (selected as the best fit over Poisson and quasi-Poisson alternatives) to analyze the association between various transition types and crash occurrences in surrounding areas. The analysis revealed distinct and statistically significant safety outcomes. Major findings indicate that transitions introducing intensified activity and vulnerable road users, such as converting agricultural land or parks to educational facilities (e.g., Agri → Edu, coefficient ≈ +0.10; Park → Edu, ≈+0.12), or intensifying land use in previously less active zones (e.g., Park → Com, ≈+0.07; Trans → Park, ≈+0.10), significantly elevate long-term crash risk, particularly when infrastructure is inadequate. Conversely, conversions creating low-traffic, nature-focused environments (e.g., Water → Park, ≈–0.16) or channeling activity onto well-suited infrastructure (e.g., Trans → Com, ≈–0.12) demonstrated substantial reductions in crash frequency. The critical role of context-specific infrastructure adaptation, highlighted by increased risks in some park conversions (e.g., Com → Park, ≈+0.06), emerged as a key mediator of safety outcomes. These findings underscore the necessity of integrating dynamic, long-term road safety considerations into land use planning, mandating appropriate infrastructure redesign during conversions, and prioritizing interventions for identified high-risk transition scenarios to foster safer and more sustainable urban development.

1. Background

Road crashes pose a significant global public health and economic burden [1,2,3], with recent plateaus in safety improvements and increasing risks for vulnerable road users (VRUs) like pedestrians and cyclists [4]. In Australia, particularly Metropolitan Melbourne, challenges persist, including high intersection collision rates, evolving drug impairment trends, and significant VRU risks [5,6,7,8,9].
While driver behavior is a factor, crash patterns in Melbourne are strongly influenced by the built environment, including land use configurations, network design, and proximity to features like transport hubs and activity centers [10,11,12,13,14,15]. Melbourne’s ongoing development involves significant land use conversion, a process that fundamentally alters local traffic generation, travel patterns, and conflict points over time. However, much existing research examines static associations between land use and crashes, often neglecting the dynamic process of conversion itself. Consequently, the cumulative, long-term impacts (e.g., over a decade) of these transformations on crash frequency are frequently overlooked, as many studies rely on “snapshots” that fail to capture how risks evolve as converted areas mature.
This study addresses that gap by explicitly modeling specific land use transitions over a 10-year period in Metropolitan Melbourne to quantify their distinct long-term influences on road crash frequency, moving beyond static analysis to assess the safety consequences of urban transformation itself. Therefore, the primary objective of this study is to investigate and quantify the long-term impact of specific land use-type conversions on road crash frequency within Metropolitan Melbourne. Specifically, this research seeks to address the following questions:
  • How do different types of land use conversions (e.g., Agricultural → Residential, Residential → Park, Commercial → Residential) over a 10-year period differentially influence the frequency of road crashes in surrounding areas within Metropolitan Melbourne?
  • To what extent do land use conversions representing significant shifts in activity levels and traffic generation correlate with predictable increases or decreases in long-term road crash frequency?
  • Which specific land use transition pathways exhibit the most substantial associations with road crash frequency fluctuations in Melbourne, and what are the key implications for prioritizing safety interventions and guiding future land use policies?
By analyzing the long-term safety records associated with specific land use transitions, this study aims to provide critical evidence to inform targeted road safety strategies, infrastructure planning, and future land use zoning policies in Melbourne’s evolving urban landscape, ultimately contributing to data-driven decision-making for reducing road trauma.

1.1. Literature Review

The relationship between land use patterns and road safety outcomes is well established in transportation research. However, the dynamic process of land use conversion or transformation introduces specific complexities that significantly influence road crash frequency and risk. Understanding these impacts is crucial for effective urban and transportation planning aimed at enhancing safety.

1.2. Traffic Impact Assessments

Traffic impact assessments (TIAs) evaluate how land developments affect transport networks, identifying traffic changes and mitigation needs. However, traditional TIAs often suffer from unclear legal frameworks for developer contributions, poor inter-agency cooperation, inconsistent standards, and a detrimental over-reliance on car-centric models that exclude walking, cycling, and transit impacts [16]. This limited scope fails to address sustainable urban development goals and can lead to negative outcomes like congestion and deteriorating conditions, as seen in poorly planned urban transitions [17,18].
In response, contemporary TIA practices are evolving towards more holistic, multimodal frameworks aligned with sustainability initiatives (Vision Zero, Complete Streets) [16]. Advancements include integrating visual analytics for better flow predictions [19], using predictive safety models [20], applying quantitative criteria for impact areas, incorporating environmental mitigation like pollution reduction via intersection redesign [21], and embedding risk assessments [22]. Integrated land use–transport modeling and a shift towards empirical, data-driven approaches [23] further enhance accuracy. Despite persistent challenges regarding standards and cooperation, the trend, reflected in international guideline reforms, is towards comprehensive, land use-sensitive TIAs that better support sustainable urban growth.

1.3. Impact of Development-Oriented Conversions

A consistent finding across studies is that land use conversions oriented towards increased human activity, particularly residential, commercial, or mixed-use developments, tend to significantly increase crash frequency. This is primarily attributed to resultant increases in traffic volumes and the introduction of more complex mixed traffic flows [24]. For instance, conversions to residential and commercial uses in urban China were found to elevate severe crash risk, driven by heightened traffic and population density [25]. Similarly, studies using macro-level collision prediction models consistently identify population density and employment density (proxies for residential and commercial/industrial land uses) as positively correlated with higher crash frequencies at the zonal level [26].
Mixed-use developments, while often promoted for urban vitality, introduce particular safety challenges. The coexistence of various activities generates complex interactions between different road users (e.g., vehicles, pedestrians, cyclists), especially where pedestrian activity is high, thereby increasing the likelihood of crashes [27,28,29,30].
Research indicates that intersections near commercial land uses experience higher crash rates due to elevated traffic volumes and diverse traffic patterns [31]. Furthermore, specific crash types, such as rear-end and angle collisions, have been shown to increase following conversions to commercial or mixed-use purposes due to increased traffic density and conflict points [32]. Areas with high densities of retail land use are particularly associated with higher pedestrian injury collision rates [33]. Even conversions involving educational land uses can increase pedestrian crash frequency due to concentrated pedestrian activity, including vulnerable populations [34].

1.4. Mitigation Through Design and Planning

Urban development or associated infrastructure redesigns that intentionally reduce vehicular flow or prioritize non-motorized users can lead to improved safety outcomes. A prime example is the implementation of “road diets,” such as converting four-lane roads to three lanes, which demonstrated significant reductions in total crash rates in Minnesota by up to 54.3% [35].
Similarly, operational changes like converting two-way frontage roads to one-way operation have been found to reduce crash occurrences even amidst increased traffic volumes, highlighting that thoughtful infrastructure modifications accompanying land use changes can enhance safety [36,37]. Traffic-calming measures, often integrated into residential areas or near parks, such as narrower lanes or speed humps, can also effectively reduce crash likelihood and severity. The design of adjacent landscapes, such as those found in parks or green spaces, can also play a nuanced role, potentially improving safety with forgiving designs or worsening it through visual obstructions [34,38].

1.5. The Role of Urban Form and Transition Planning

The broader context of urban form significantly mediates the safety impacts of land use transformation. Sprawling suburban growth patterns, often resulting from the conversion of agricultural or open land, tend to foster car dependency and longer travel distances, thereby increasing overall crash exposure, particularly where integrated transport options are lacking [39,40]. In contrast, compact, mixed-use developments, when well planned with integrated transportation systems and a focus on walkability and public transit, can contribute to reduced traffic injuries by encouraging shorter trips and mode shifts away from private vehicles [41,42].
However, the transition process itself is critical. Poorly planned land use conversions that occur without corresponding upgrades to surrounding transportation infrastructure frequently lead to negative safety outcomes. Such transitions often create new conflict points, increase congestion, and fail to accommodate altered traffic patterns or vulnerable road user needs, ultimately worsening safety conditions [43]. Transitions involving high-speed corridors or specific conversions like agricultural-to-industrial use can be particularly hazardous, associated with more severe crashes due to factors like increased speed differentials and inadequate pedestrian infrastructure [44,45].
While frequency is a primary concern, the surrounding land use also influences crash severity. Commercial zones are often linked not only to higher frequency but also to higher pedestrian crash severity, potentially due to higher speeds and heavier vehicle traffic [32,46,47]. Industrial areas may also present unique severity risks [48,49]. Crash severity patterns also differ between urban cores (often more frequent, lower-speed crashes) and suburban or transitional areas (potentially less frequent but higher-speed, more severe crashes) [32,49].

1.6. Theoretical Framework

This study posits that land use transformation significantly impacts road safety by altering traffic exposure and conflict opportunities. Conversions to higher-intensity uses (commercial, residential) modify travel demand, increasing traffic volumes and interactions between diverse road users (vehicles, pedestrians, cyclists), thus elevating conflict potential and crash risk [9,24,26,27,28]. Conversely, transitions favoring non-motorized modes or reduced vehicle dependency (e.g., parks, road diets) are expected to decrease exposure and conflicts, enhancing safety [35]. Therefore, the type and intensity of land use conversion are theorized to directly influence crash frequency via these mediating factors.
Furthermore, the theoretical framework acknowledges that the impact of land use conversion on road crash frequency is not spatially uniform but is contingent upon the geographic context and the adequacy of accompanying infrastructure planning [39,43]. Factors such as the existing urban form (compact vs. sprawl), road network characteristics, and the integration of safety considerations during the transition process mediate the relationship [40]. Recognizing these spatial dependencies, alongside the inherent characteristics of crash data (e.g., overdispersion, zero-inflation), necessitates analytical approaches beyond traditional global regression models. This framework thus supports the selection of advanced spatial statistical or machine learning methods capable of capturing these complex, spatially varying relationships, as highlighted by the limitations of conventional models identified in the literature [50,51].
Most prior studies on the relationship between land use and road safety adopt a static perspective, analyzing crash data in relation to existing land use configurations at a single point in time [24,26]. While these studies provide valuable insights, they often overlook the temporal dynamics of land use conversion—such as the emergence of new traffic patterns, infrastructure lag, or delayed safety consequences. This research advances the field by adopting a longitudinal approach, systematically examining specific land use transitions over a decade and their associated crash frequencies. Unlike static models, this framework captures the evolving nature of urban form and offers a more nuanced understanding of how certain conversions impact long-term safety. By directly linking transitions to spatial–temporal crash outcomes, our study bridges a key gap in the literature and highlights the importance of proactive planning during periods of urban transformation.

2. Materials and Methods

2.1. Method

2.1.1. DEM for Distribution of Crash Frequency

Digital Elevation Models (DEMs) are crucial for analyzing how topography influences road crash frequency. DEM-derived features like elevation and slope affect roadway geometry, visibility, and drainage, impacting crash risk [52]. Using ESRI ArcGIS Pro 3.4.2, we extracted 1 m contour lines from DEMs and overlaid geocoded crash data to identify concentrations relative to elevation changes. Crash frequency was aggregated within contours via spatial joins, and Kernel Density Estimation (KDE) helped visualize hotspots, particularly revealing higher occurrences in areas with lower elevations and steep slopes [52] (Figure 1).
DEM accuracy is critical, as errors can bias terrain attributes (slope, curvature) and risk assessments [53]; high-resolution data like LiDAR improves precision [54,55]. Ultimately, DEM-based spatial analysis using GIS interpolation techniques provides essential insights for identifying high-risk zones and informing targeted road safety interventions [56].
There is no single explicit formula, but it is generally computed as:
Z = Z 1 + Z 2 Z 1 · ( C X 1 ) X 2 X 1
where:
  • Z 1 : interpolated elevation at point C ;
  • Z 1 , Z 2 : elevation values at surrounding grid points;
  • X 1 , X 2 : spatial coordinates;
  • C : location of contour value.
Crash frequency aggregation by contour zone is as follows:
C r a s h F r e q u e n c y i = j A i C j

2.1.2. Near for Calculating Proximity of Urban Development Point (Land Use Change)

Proximity analysis using the ArcGIS Near tool, based on Euclidean distance, quantifies spatial relationships by calculating the shortest distance between features like crash locations (aggregated by DEM contour) and polygons representing specific land use changes derived from temporal datasets. This method assesses how land use modifications influence roadway safety [57], which is crucial, as land use characteristics significantly affect crash frequencies, with local models often proving more explanatory [22,57].
It helps identify risks associated with transitions like urbanization or commercial intensification [58] within the complex, cyclical relationship, where land use and transport infrastructure mutually influence each other, though neighboring land uses often dominate [59,60,61]. Findings can be refined using spatial regression (e.g., GWR) to address spatial autocorrelation [24], ultimately supporting targeted mitigation strategies and integrating broader environmental considerations [62].
D = x 2 x 1 2 + y 2 y 1 2
where:
  • D is the distance between two points.
  • ( x 1 , y 1 ) is the coordinate of the crash point (input feature).
  • ( x 2 , y 2 ) is the coordinate of the nearest edge or centroid of the urban development (land use change) polygon (near feature).
This approach provided a quantitative measure of each crash location’s proximity to specific land use transitions, supporting the hypothesis that certain land development patterns may increase or decrease crash frequency based on spatial closeness (Figure 2A).
The shortest distance from a point to a line segment is the perpendicular to the line segment. If a perpendicular cannot be drawn within the end vertices of the line segment, then the distance to the closest end vertex is the shortest distance (Figure 2B).

2.1.3. Poisson Model

The Poisson regression model assumes that the response variable Y i , representing the count of events for observation i , follows a Poisson distribution with mean μ i , such that:
Y i ~ P o i s s o n μ i , μ i > 0
To link the mean μ i to a set of predictor variables X i , the model uses a logarithmic link function:
log ( μ i ) = β 0 + β 1 X i 1 + β 2 X i 2 + + β k X i k
This transformation ensures that the predicted event rate μ i remains strictly positive and interpretable in terms of multiplicative effects. Each coefficient β j represents the expected change in the log count of events associated with a one-unit change in the predictor X i , holding other variables constant.
Poisson regression, a Generalized Linear Model (GLM) using a log link function, models non-negative integer count data assuming equidispersion (mean = variance) [63]. Parameters are estimated via Maximum Likelihood Estimation (MLE). Model adequacy is checked using deviance and Pearson residuals, with crucial diagnostics for overdispersion; if detected, Negative Binomial regression offers an alternative.

2.1.4. Negative Binomial Model

The Negative Binomial (NB) model is a widely used alternative to the Poisson model when count data exhibit overdispersion. It can be conceptualized as a Poisson–gamma mixture model, where each observation’s Poisson mean μ i is itself a random variable following a Gamma distribution. This mixture introduces an additional parameter, often denoted as α (alpha) or θ (theta), which accounts for the unobserved heterogeneity leading to overdispersion.
The probability mass function for a count Y i following an NB distribution can be parameterized in several ways. A common parameterization specifies the mean E( Y i ) = μ i and the variance V a r ( Y i ) = μ i + α μ i ² (or sometimes μ i + μ i 2/θ, where θ = 1/α).
Y i ~ N B ( μ i α )
Here, α is the dispersion parameter.
  • If α = 0, the variance reduces to μ i , and the NB model simplifies to the Poisson model.
  • If α > 0, Var ( Y i )) > E ( Y i )), indicating overdispersion. The larger the value of α, the greater the degree of overdispersion.
Similar to Poisson regression, the NB model typically employs a log link function to connect the mean μ_i to a linear combination of predictor variables:
l o g ( μ i ) = β 0 + β 1 X i 1 + β 2 X i 2 + + β k X i k
Parameters (β coefficients and α) are typically estimated using Maximum Likelihood Estimation (MLE). The inclusion of the dispersion parameter α allows the NB model to provide more appropriate standard errors for the regression coefficients and more reliable statistical inference in the presence of overdispersion compared to the standard Poisson model [64,65].

2.1.5. Quasi-Poisson

Quasi-likelihood models offer a more flexible approach, which is particularly useful when the exact underlying distribution of the count data is unknown or complex but a relationship between the mean and variance can be specified. Introduced by Wedderburn [66], quasi-likelihood estimation does not require specifying the full probability distribution for the response variable. Instead, it only requires assumptions about the mean and variance structure:
  • The mean of the response Y i is related to the predictors through a link function: g ( E ( Y i ) ) = g ( μ i ) = X i β . For count data, this is typically the log link: l o g ( μ i ) = X i β
  • The variance of Y i is proportional to a function of the mean: Var( Y i ) = φV( μ i ), where V( μ i ) is the “variance function” and φ is the “dispersion parameter.”
For count data, a common specification for the variance function is V( μ i ) = μ i , leading to what is often called a “quasi-Poisson” model. In this case, Var( Y i ) = φ μ i .
  • If φ = 1, this corresponds to the equidispersion assumption of the Poisson model.
  • If φ > 1, it indicates overdispersion.
  • If φ < 1, it indicates underdispersion.
The regression coefficients β are estimated by solving “quasi-score” equations, which are analogous to the score equations in MLE but depend only on the mean and variance specifications. The dispersion parameter φ is typically estimated separately after fitting the model, often using the Pearson chi-squared statistic or the deviance divided by its degrees of freedom:
φ ^ = X 2 / ( n p )
where n is the number of observations and p is the number of estimated β parameters.
The key advantage of quasi-likelihood is its robustness: the estimates of β are generally consistent and asymptotically normal even if the assumed variance function V( μ i ) is not perfectly correct, as long as the mean structure g( μ i ) = X i β is correctly specified [63]. Standard errors for β are adjusted by multiplying by the square root of φ ^ . However, since there is no fully specified likelihood, traditional likelihood-based inference tools like Likelihood Ratio Tests (LRTs) or information criteria (AIC, BIC) are not directly applicable, though quasi-versions (e.g., QAIC) can sometimes be used.

2.1.6. Random Forest Algorithm

In this study, we employed the Random Forest algorithm as a core predictive modeling technique due to its high accuracy, robustness, and versatility. Random Forest is an ensemble learning method that constructs multiple decision trees using random subsets of both data and features, and aggregates their outcomes to enhance predictive performance while mitigating overfitting [67,68,69]. Each tree in the ensemble is built using bootstrap aggregating (bagging), which reduces variance by training on different resampled datasets [67,68], and further diversity is introduced by considering random subsets of features at each split. For classification tasks, the final prediction is determined by majority voting, while regression tasks use the average of individual tree outputs [69]. Random Forest is particularly effective in dealing with complex datasets and has demonstrated superior performance compared to traditional methods such as logistic regression. It is applicable in a wide range of domains, including healthcare, finance, and bioinformatics, for tasks such as classification, regression, and even missing data imputation [70,71,72]. Moreover, its ability to assess variable importance and detect interactions makes it a valuable tool for exploratory data analysis and feature selection [72].
The conceptual and procedural framework illustrated in Figure 3 uses a systematic approach to investigate the relationship between urban development (land use change) and traffic crash occurrences over time. The framework begins with input data comprising land use changes and the count of crashes from 2011 to 2021, where a Near analysis is used to calculate the distance from the newest development points to each crash location. These distances, along with the spatially interpolated crash data (via IDW), are used as independent and dependent variables, respectively. The procedural framework then applies a Generalized Linear Model (GLM) using three types of statistical models—Poisson, Negative Binomial, and quasi-likelihood—to examine these relationships. The output of this framework reveals the crash risk pattern based on the urban development (land use change), identifies a critical distance zone for land use change, and highlights high-risk land use change areas, thereby offering valuable insights for planners and policymakers aiming to mitigate traffic-related risks in evolving urban environments.

2.1.7. AI Tools

During the manuscript preparation process, the authors used AI-based language tools—including GPT-3.5 (OpenAI), Quillbot, and Google Gemini—to assist with language refinement, paraphrasing, and improving overall readability. These tools were used to support clarity in expression and did not contribute to the generation of original research content or data analysis. All AI-assisted content was critically reviewed and edited by the authors to ensure accuracy and appropriateness.

2.2. Material

2.2.1. Land Use Change Categories of GMA

In Greater Melbourne, land use categorized by ABS Mesh Blocks—the smallest spatial units—significantly influences road crash frequency. Research confirms strong links between specific land use types (residential, commercial, parkland) and crash patterns, with factors like transport accessibility and mixed land use increasing susceptibility. Advanced spatial modeling and national regression models utilize Mesh Block data to assess crash risks associated with traffic and environmental factors. Though designed to reflect a single dominant land use where feasible, Mesh Blocks provide a crucial granular framework for connecting land use dynamics to crash outcomes and informing transportation safety planning in Melbourne. The main categories used are (Figure 4):
  • Residential: Primarily dwellings/housing;
  • Commercial: Businesses, retail, and offices;
  • Industrial: Manufacturing, storage, and industrial businesses;
  • Parkland: Parks, reserves, public/private open spaces (including sporting facilities);
  • Education: Schools, universities, and educational institutions;
  • Hospital/Medical: Hospitals, medical facilities, and aged care;
  • Transport: Major road and rail infrastructure;
  • Primary Production: Land primarily used for agriculture/farming.
Figure 4 illustrates the land use transformation within the Greater Metropolitan Area (GMA) between 2011 and 2021. It presents a visual comparison of spatial land use distributions across two time points, accompanied by a matrix showing percentage transitions between land use categories. Notably, a substantial proportion of agricultural land (7.78%) has been converted to residential use, indicating a significant urban expansion trend. Additionally, agricultural areas were also transformed into parkland (4.39%) and education zones (0.64%). These changes reflect broader socio-economic pressures and urban development priorities shaping GMA’s evolving landscape.

2.2.2. Crash Frequency of GMA

These data have been consolidated from Victoria police reports and hospital injury information, then validated and enriched to provide a comprehensive and detailed view of road crashes and injuries across Victoria. The data provides users with information about fatal and road crashes and injuries in Victoria based on time, location, conditions, crash type, road user type, and other relevant attributes.
Figure 5 presents a spatial analysis of crash frequency across the Greater Melbourne Area (GMA), utilizing contour mapping and Inverse Distance Weighting (IDW) interpolation to highlight areas of concern. The IDW map visually communicates the distribution and intensity of crash occurrences, with warmer colors (reds and oranges) representing higher frequencies predominantly concentrated in central urban zones, while cooler shades (greens and blues) signify lower crash frequencies toward peripheral regions. The contour map further refines this spatial understanding by illustrating the gradients of crash density, enabling a clearer visualization of hotspots and transitional zones. Together, these visual tools offer an insightful geographic representation of traffic safety patterns and support evidence-based urban planning and traffic management strategies.

2.2.3. Descriptive Variables

The descriptive statistics based on Table 1 reveal key characteristics of crash frequency in relation to various land use transitions in the study area.

3. Results

3.1. Negative Binomial Results

A Negative Binomial model (N = 10,947) assessed the impact of 21 land use transitions on crash frequency, with coefficients estimated using Stata/MP v17.0. Significance levels varied across pathways (Table 2). The model exhibited reasonable fit despite some overdispersion (deviance/df = 0.39) and established a baseline expectation of approximately 8.0 crashes (exp(2.08) ≈ 8.00) without transitions (intercept = 2.08, p < 0.001).
Transitions from agricultural land showed varied impacts. Conversions to residential (Agri → Res: +0.02, p = 0.19) and commercial uses (Agri → Com: +0.02, p = 0.35) did not yield statistically significant changes in crash frequency. However, the shift to educational uses (Agri → Edu) significantly increased crash risk (+0.10, p < 0.001), likely reflecting unprepared infrastructure for school traffic. Conversely, conversion to parkland (Agri → Park) was associated with a significant reduction in crash frequency (−0.04, p = 0.05), likely due to lower traffic demand.
Similarly, converting residential land increased crash frequency substantially when transitioning to commercial (Res → Com: +0.05, p < 0.001) and educational uses (Res → Edu: +0.09, p < 0.001), the latter often due to increased traffic complexity and vulnerable road users. The transition from residential to parkland (Res → Park: +0.00, p = 0.97) showed no statistically significant change in crash frequency.
Transitioning land into residential use generally increased crash risk: Park → Res (+0.04, p < 0.001), Edu → Res (+0.06, p < 0.001), Indus → Res (+0.03, p < 0.05), and Hosp → Res (+0.07, p < 0.001) all reflect intensified traffic and potential infrastructure mismatches. Converting transport corridors to housing (Trans → Res: +0.03, p = 0.09) also showed a marginally significant increase in risk.
Educational land use changes showed mixed effects. Converting schools to commercial use (Edu → Com: +0.05, p < 0.01) increased crashes, possibly due to repurposed infrastructure. However, Edu → Park showed a marginally significant reduction in crashes (−0.03, p = 0.10). Strikingly, converting parks to educational use (Park → Edu) yielded one of the highest crash increases (+0.12, p < 0.001), likely due to inadequate infrastructure for school traffic in former recreational spaces.
Commercial transitions also presented varied effects. The transition from commercial to educational use (Com → Edu: +0.02, p = 0.25) did not show a significant impact on crash frequency. Park → Com (+0.07, p < 0.001) significantly increased crashes, reflecting high-intensity activity replacing low-traffic zones. Interestingly, Com → Park (+0.06, p < 0.01) also increased crashes. This could be due to centrally located parks attracting crowds while potentially retaining elements of commercial-optimized infrastructure not fully suited for park use, or increased pedestrian–vehicle interactions in areas that become focal points.
Transitions involving transport land were varied. Converting to parkland (Trans → Park: +0.10, p < 0.001) significantly increased crash risk, perhaps due to legacy infrastructure hazards or challenging accessibility for new uses (as previously noted, Trans → Res showed a marginal increase: +0.03, p = 0.09). Conversely, Trans → Com substantially reduced crashes (−0.12, p < 0.001), likely benefiting from existing high-capacity, controlled infrastructure suitable for commercial traffic.
Finally, converting water bodies to parkland (Water → Park) showed the largest crash reduction (−0.16, p < 0.001), consistent with creating low-traffic, nature-focused environments with limited vehicle access.
The comparative analysis of the Poisson, Negative Binomial, and Quasi-Poisson models reveals important insights into the robustness and consistency of land use transition effects on crash frequency. Overall, the Negative Binomial model outperforms the others, demonstrating the best fit with the lowest AIC (5.44), the lowest deviance per degree of freedom (0.39), and a superior log likelihood. This indicates that it effectively accounts for overdispersion, which is a common issue in count data such as crash frequency. The Poisson model, by contrast, assumes equal mean and variance and displays signs of overdispersion (deviance per df = 2.8), making its estimates less reliable. The quasi model also shows poor fit with an extremely high deviance (24.03), suggesting it may be mis-specified for this context (Table 3).
Results from the best model (Negative Binomial) show that many land use transitions toward more intensive human activity—such as residential, commercial, or institutional (particularly educational) uses—are associated with increased crash frequency. This correlation underscores a fundamental principle of urban development: increased accessibility, mobility, and density often come at the cost of safety unless mitigated through proactive planning. Conversely, transitions toward certain less intensive uses, notably parkland from agricultural or water body origins, or from educational to parkland (marginally significant), often reduce crash frequency, although the conversion from residential to parkland did not show a significant change in this model.
These findings should encourage urban planners, transport engineers, and policymakers to evaluate not just the economic or zoning implications of land use changes but also their traffic safety outcomes. In high-risk transitions such as Park → Education (+0.12), Trans → Park (+0.10), and Agri → Education (+0.10), thorough safety impact assessments and infrastructure improvements should precede any zoning approval. Conversions that are associated with significant safety benefits—like Water → Park (−0.16) and Trans → Com (−0.12)—could be strategically promoted to enhance public safety. Thus, the evidence from this model highlights practically actionable patterns, supporting the integration of land use planning with traffic safety management. The transitions with the highest positive influence on crash frequency (such as Park → Education, Trans → Park, and Agri → Education) generally involve shifts to uses attracting more or different types of traffic, while those substantially reducing crash frequency (like Water → Park and Trans → Commercial) often represent shifts to lower-intensity use or better-matched infrastructure.
The polar plots illustrate the spatial relationship between crash frequency and proximity to various land use transitions. In each subplot, the angle (θ) represents the normalized distance to a specific land use change type, while the radius (r) and color scale reflect the frequency of crashes, with warmer colors indicating higher frequencies. Notably, certain transitions such as Agri_Res, ResPark, and ParkRes show higher crash intensities at particular distances, suggesting a possible risk concentration near these change zones. Similarly, transitions like ResCom, AgriPark, and IndusRes exhibit visible clusters of crashes, possibly due to traffic flow shifts or infrastructure mismatch. Educational and medical land use changes—ResEdu, EduRes, HospRes, and ComEdu—also present patterns where crash frequencies escalate within specific spatial buffers, potentially pointing to student or pedestrian density. Transitions involving parks (ParkCom, ParkEdu, EduPark) reveal moderate to high frequencies that may align with recreational activity or pedestrian interactions. Commercial and transport-related transitions like ComPark, AgriComm, EduCom, TransRes, TransPark, and TransCom consistently show dense crash concentrations at varying angles, highlighting the complex interplay between land use dynamics and traffic safety. These visualizations underscore how land development patterns can impact transportation risks and provide spatial insights for urban planners aiming to mitigate crash occurrences around critical transition zones (Figure 6).

3.2. The Results of Random Forest Algorithm

We specifically utilized the Random Forest algorithm to calculate and rank the feature importance of different land use conversion types, aiming to quantify their relative influence on the frequency of crashes.
Figure 7 illustrates the influence of various land use transitions on crash frequency based on a Random Forest model, with blue bars indicating a positive association and red bars indicating a negative association with crash frequency.
Transitions such as TransPark, ParkEdu, AgriEdu, ResEdu, EduRes, and ComPark show strong positive coefficients (blue), suggesting that these developments are associated with higher crash frequencies. Particularly, AgriRes and ParkCom exhibit notably large positive impacts, indicating that converting agricultural land to residential and parkland to commercial use may significantly increase traffic incidents—likely due to increased traffic volume, infrastructure mismatch, or pedestrian exposure.
Conversely, several transitions have negative coefficients (red), indicating a decrease in crash frequency. The most prominent among these are WaterPark, TransCom, and ParkCom, implying that converting water areas or transportation zones into parks or commercial land may reduce crash occurrences—possibly due to traffic calming, less congestion, or improved land use planning. Notably, AgriPark and EduCom also show a reduction in crashes, which might reflect less motorized activity or better spatial separation between vehicle routes and vulnerable road users in these transitions.
Therefore, the Random Forest model highlights that residential and educational expansions tend to raise crash risks, while certain recreational or low-traffic transitions may reduce them, offering valuable insights for urban planners to prioritize safety-sensitive land use strategies.

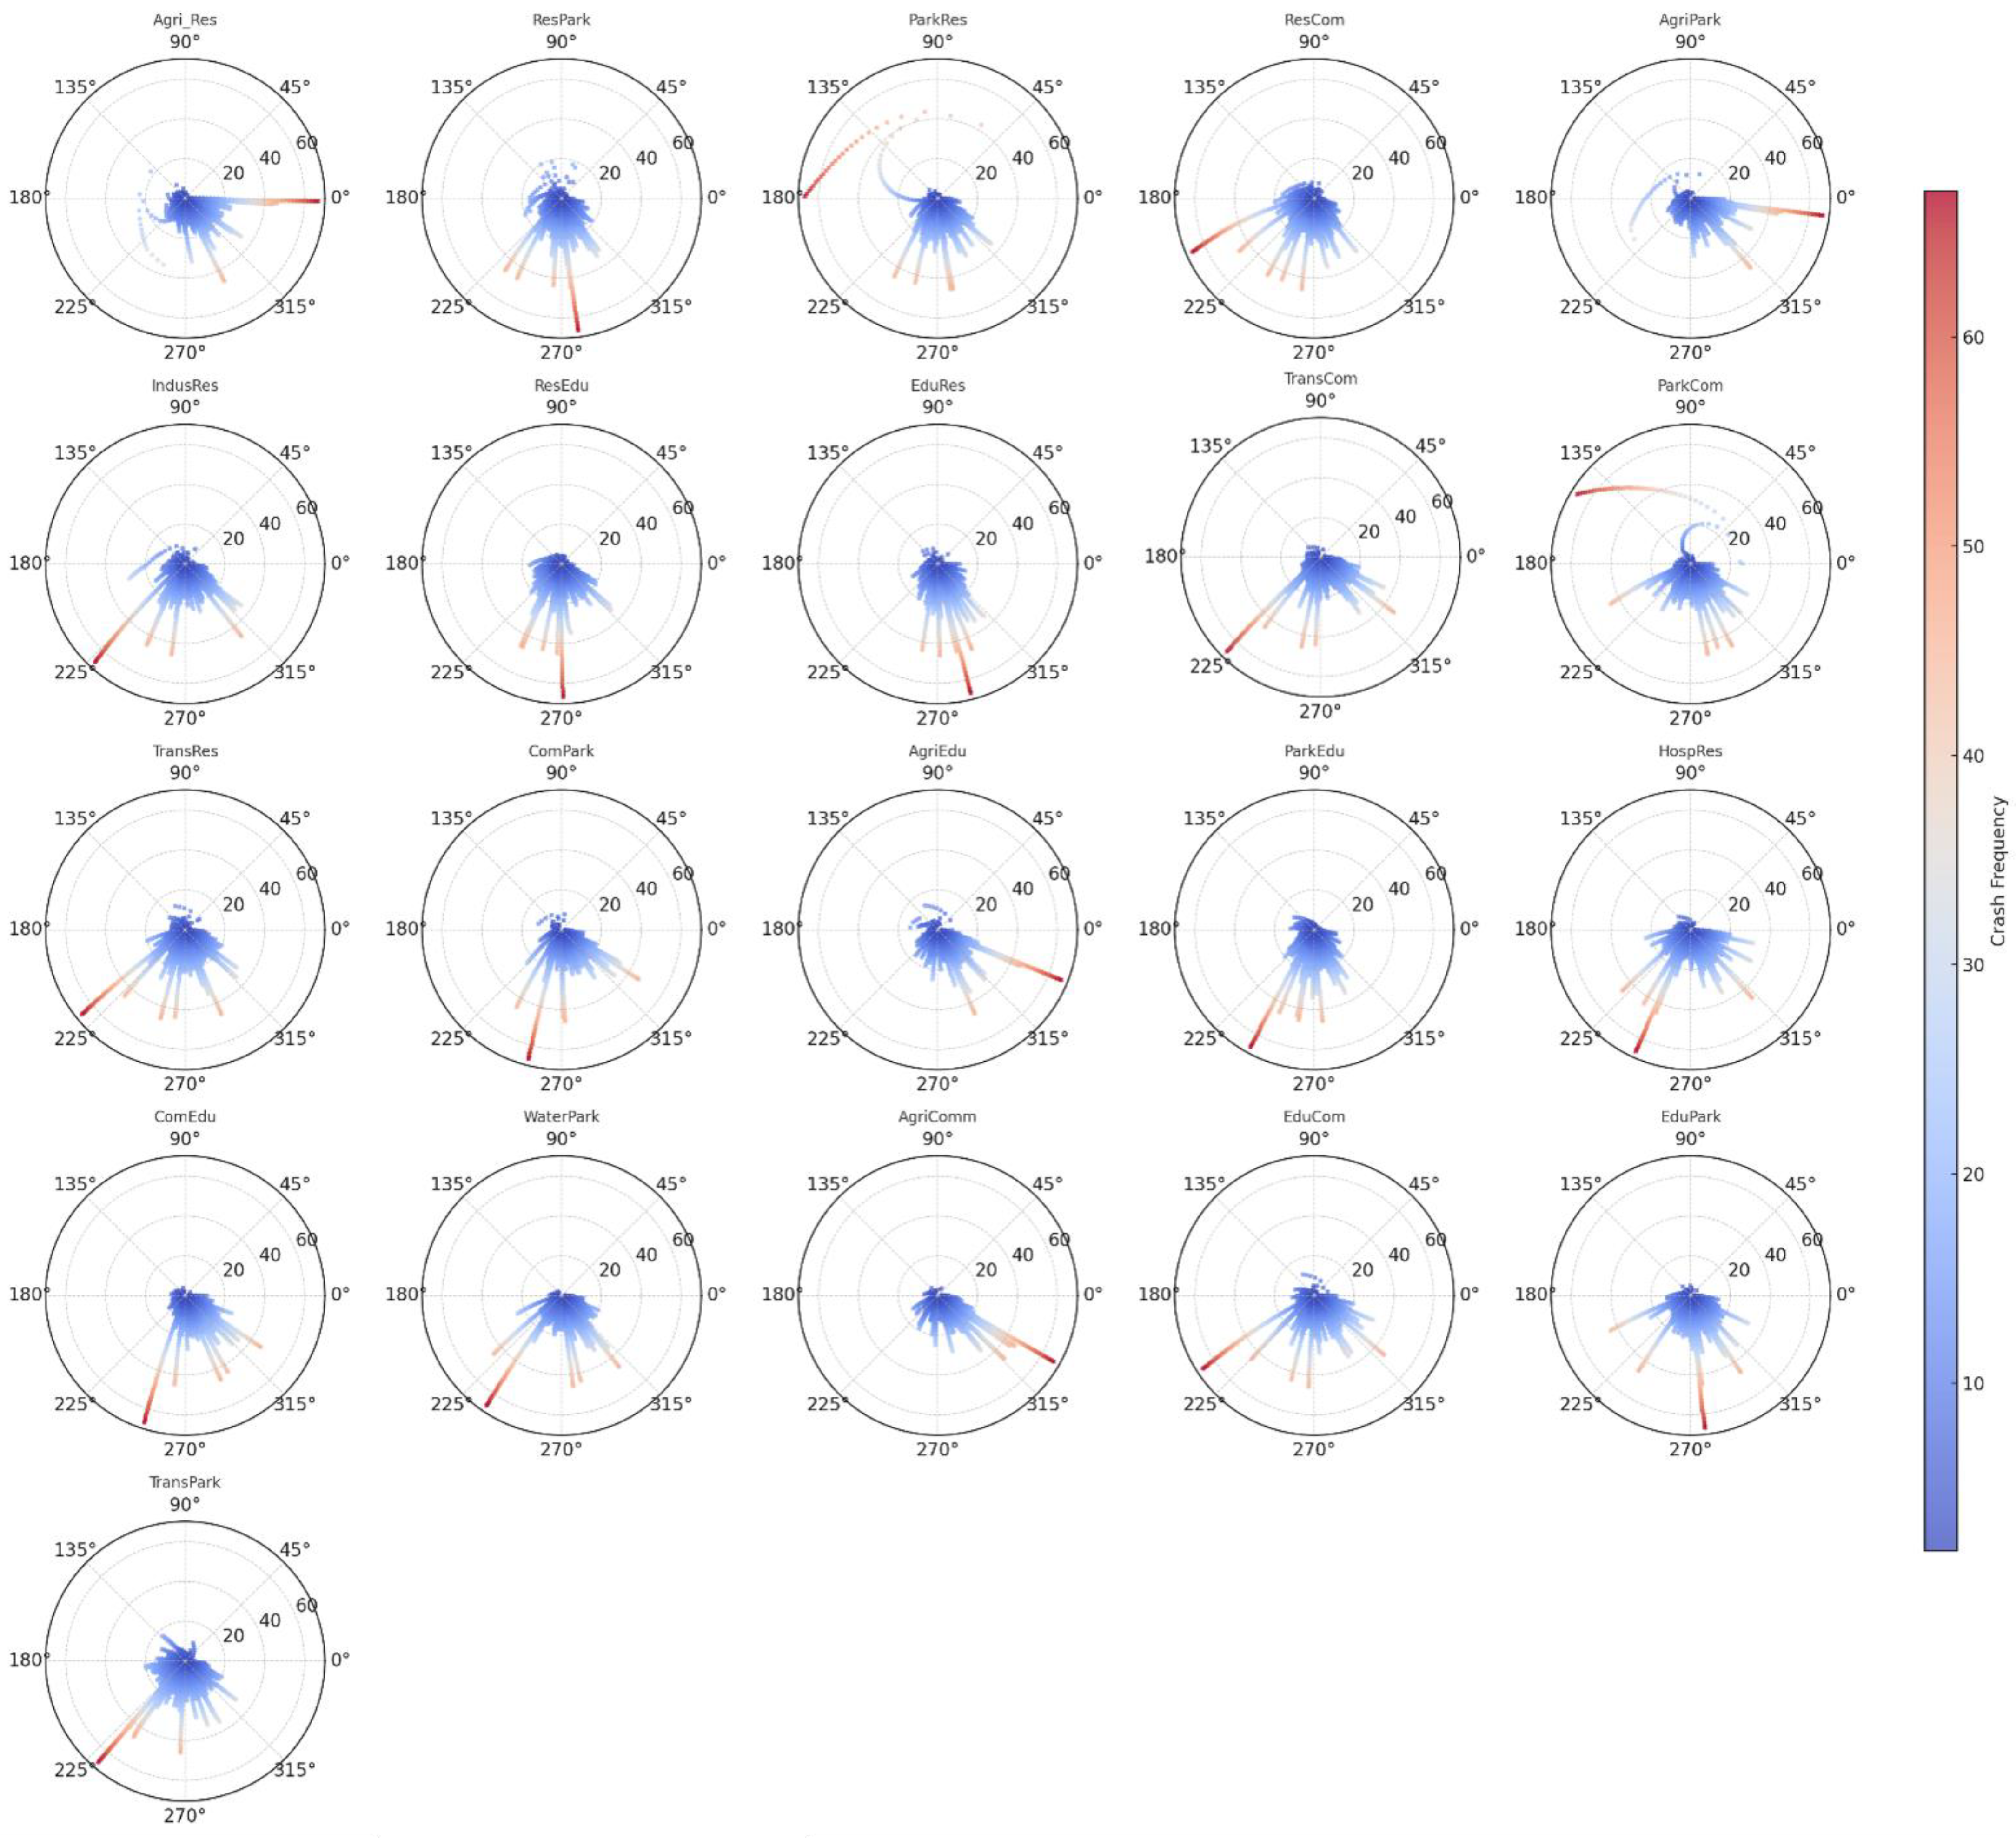
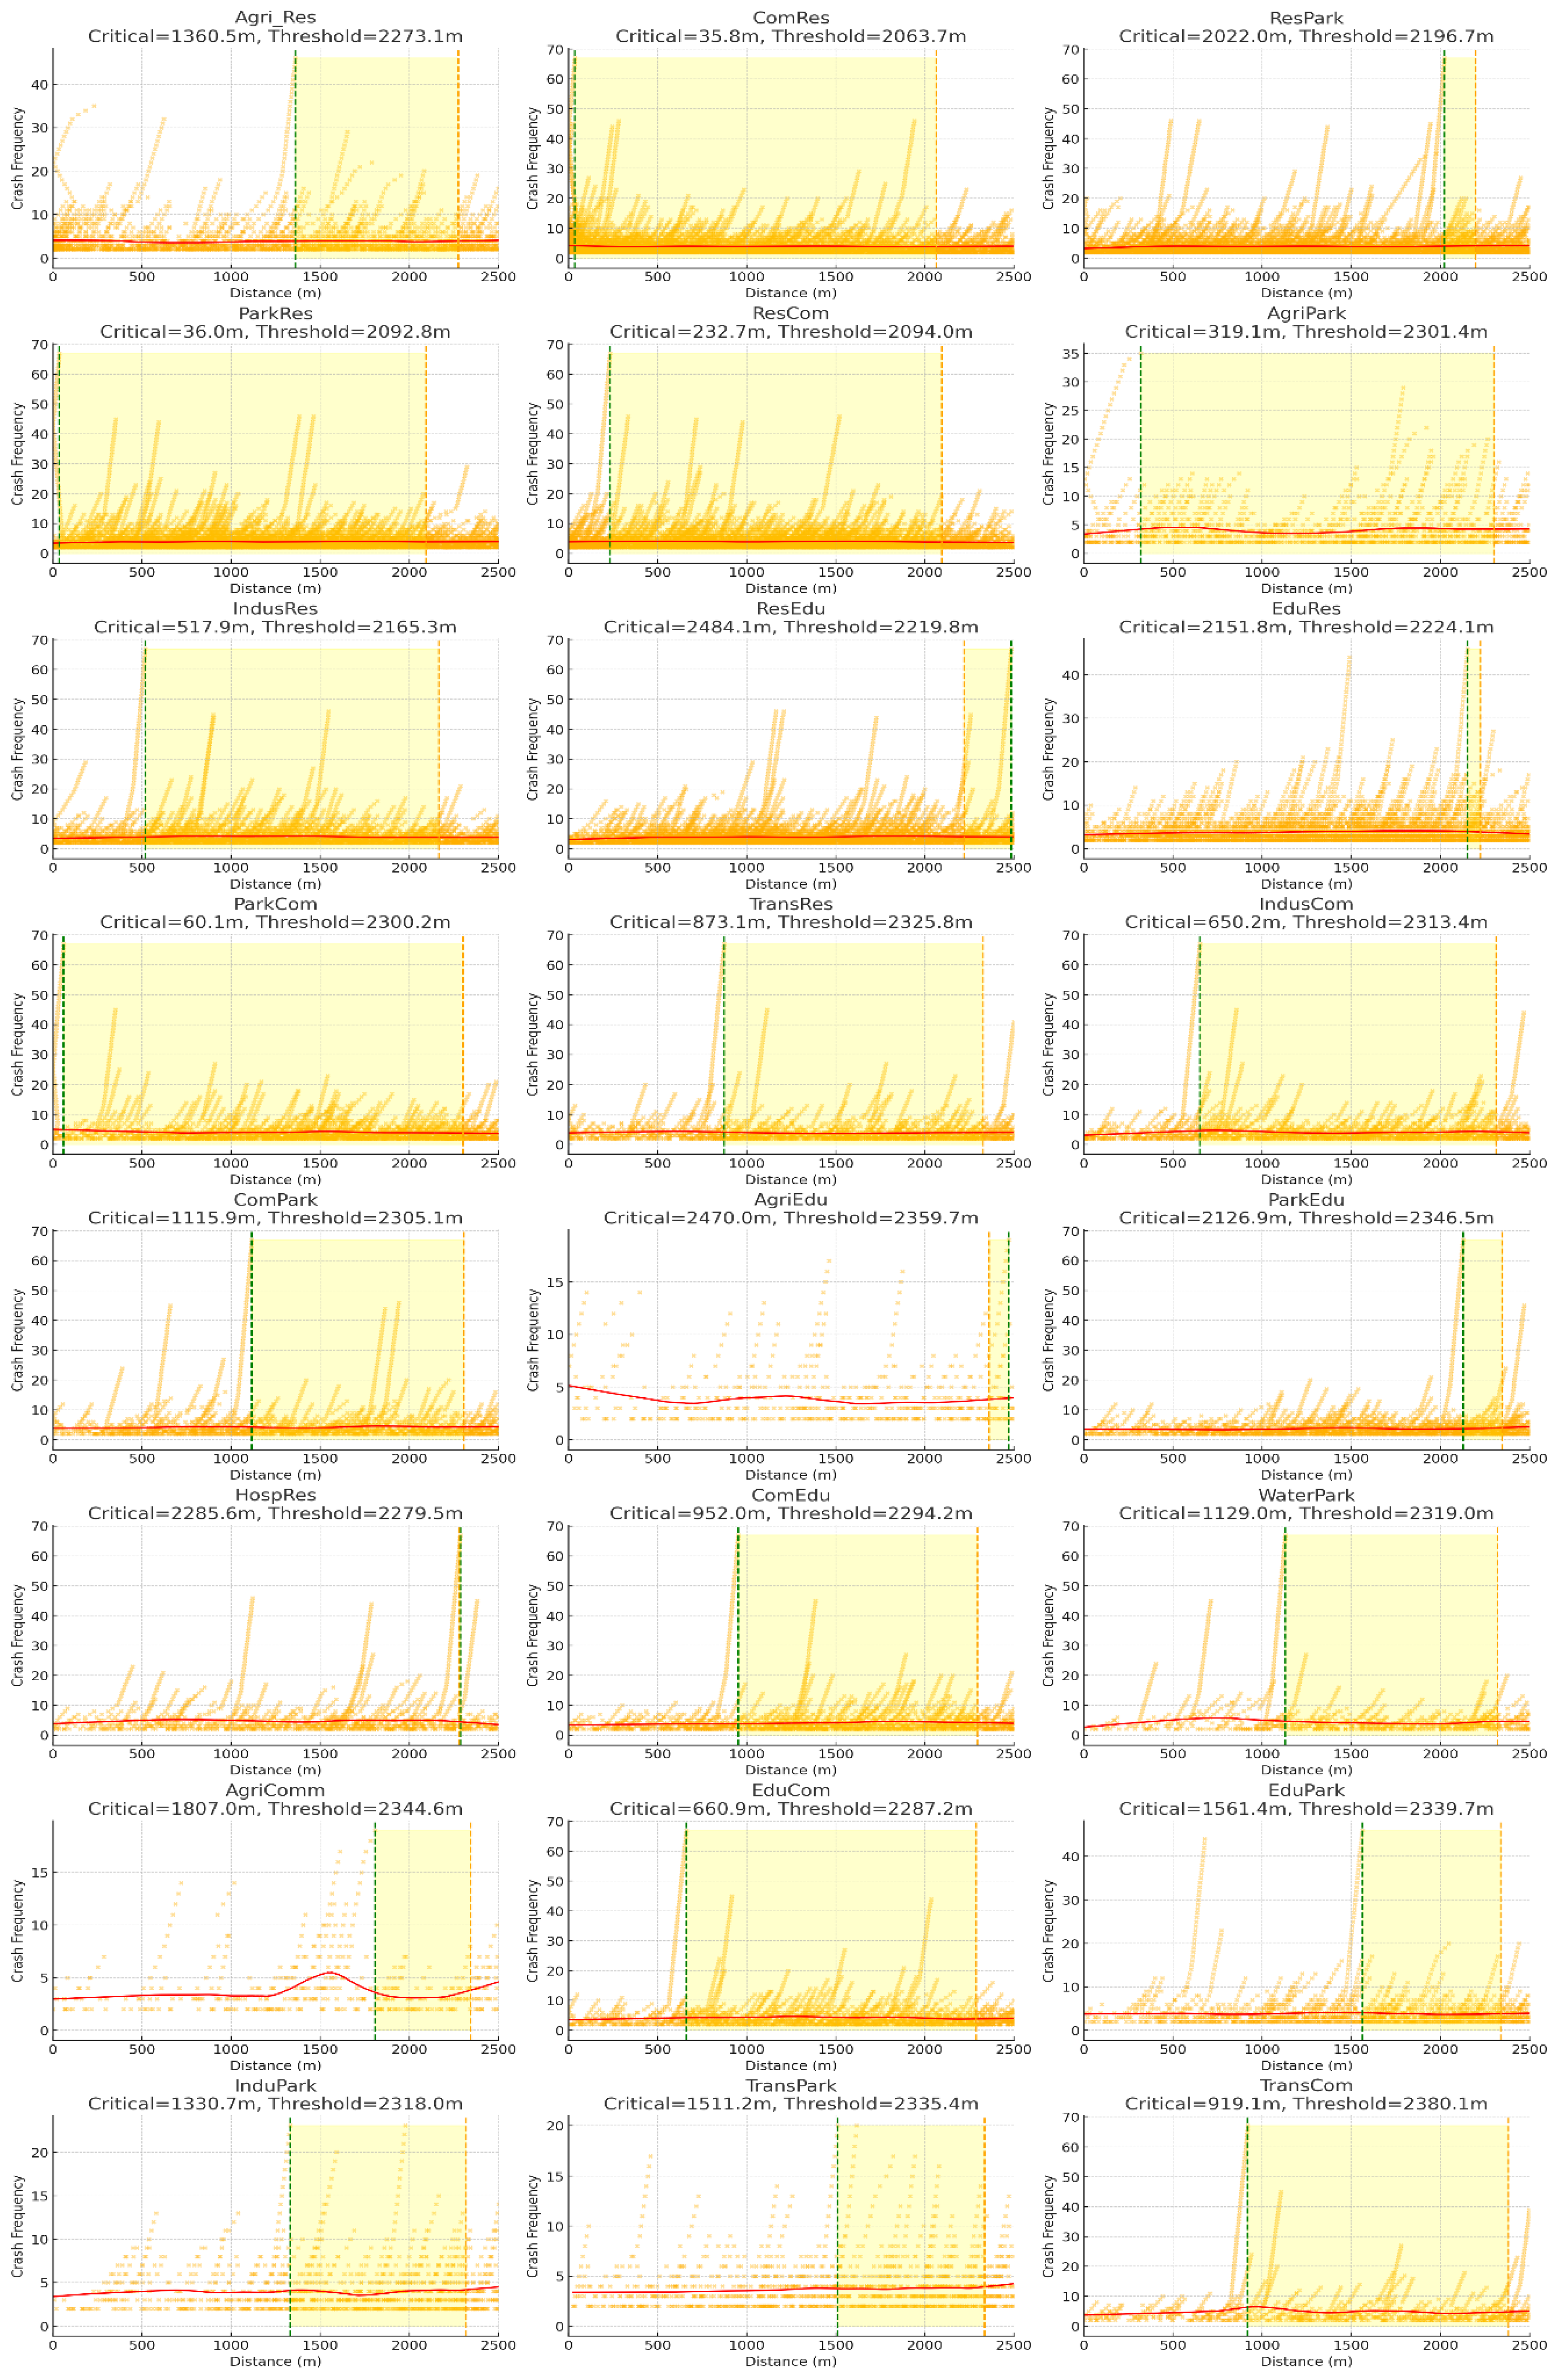
3.3. Crash Critical, Threshold, and High-Risk Development Distance to Land Use Change

To better illustrate the distance-based crash risk measures introduced in this study, we provide Figure 8, a conceptual diagram demonstrating how Critical Distance, Threshold Distance, and High-Risk Development Distance (HRDD) are derived. In this framework, the Critical Distance marks the point from the land use transition zone where crash frequency begins to rise above baseline levels, indicating the onset of elevated risk. The Threshold Distance denotes the point at which crash frequency either stabilizes or starts to decline, suggesting the spatial extent of intensified crash risk. The HRDD zone, shaded between these two distances, represents the buffer area with the highest likelihood of crash occurrence due to the influence of the urban development (land use change). This schematic complements the empirical distance–crash curves by providing a generalized conceptual reference for interpreting the spatial risk zones observed across different land use transitions.
Figure 9 presents crash frequency patterns in relation to distance from 25 distinct land use transitions, each analyzed within a 0–2500 m buffer. Three critical metrics are illustrated in each subplot: the Critical Distance (green dashed line), marking the point where crash frequency starts to rise sharply; the Threshold Distance (orange dashed line), indicating the upper limit of increased crash risk; and the High-Risk Development Distance (HRDD) zone (yellow shaded area), which lies between these two thresholds and represents the area most vulnerable to crashes. In the Agri_Res transition (Critical: 1360.5 m, Threshold: 2273.1 m), crash frequency rises steadily, indicating a wide HRDD. In ComRes (35.8 m, 2063.7 m), crashes begin almost immediately, suggesting high risk even at close range. The ResPark transition (2022.0 m, 2196.7 m) shows risks concentrated toward the far edge, while ParkRes (36.0 m, 2092.8 m) reveals immediate crash exposure. ResCom (232.7 m, 2094.0 m) and AgriPark (319.1 m, 2301.4 m) indicate early and persistent risk bands. The IndusRes transition (517.9 m, 2165.3 m) highlights significant risk starting around 500 m, and ResEdu (2484.1 m, 2219.8 m) and EduRes (2151.8 m, 2224.1 m) both reveal risk far from the source, likely due to peripheral school locations. ParkCom (60.1 m, 2300.2 m) and TransRes (873.1 m, 2325.8 m) exhibit steady rise zones from early to mid-distances, while IndusCom (650.2 m, 2313.4 m) suggests logistical and vehicle interaction risks. In ComPark (1115.9 m, 2305.1 m), crash frequency peaks beyond 1 km, likely from pedestrian flows. The AgriEdu (2470.0 m, 2359.7 m) and ParkEdu (2126.9 m, 2346.5 m) transitions show late but intense risk spikes, while HospRes (2285.6 m, 2279.5 m) shows an abrupt surge in crashes, possibly linked to hospital access zones. ComEdu (952.0 m, 2294.2 m) and WaterPark (1129.0 m, 2319.0 m) demonstrate mid-range risk peaks, while AgriComm (1807.0 m, 2344.6 m) reflects remote but severe risk patterns. EduCom (660.9 m, 2287.2 m) and EduPark (1561.4 m, 2339.7 m) show elevated risks from 600 to 1500 m, aligned with travel behaviors near schools. InduPark (1330.0 m, 2318.0 m) and TransPark (1511.2 m, 2335.4 m) indicate recreational conversions with rising mid-range crash profiles. Lastly, TransCom (919.1 m, 2380.1 m) shows consistent risk from around 900 m onward, reflecting the hazard of traffic influx into commercial corridors. Collectively, most transitions exhibit critical distances between 500 and 1500 m, and threshold distances around 2200–2400 m, marking wide and often overlooked risk zones for transportation planning. This analysis emphasizes the importance of integrating spatial crash indicators into land use policy, with a focus on early mitigation within HRDD zones.

3.4. Clustering of Land Use Transitions Based on Crash Risk Distance

Clustering land use transitions based on crash risk distances (Critical, Threshold, HRDD) using PCA (Figure 10) reveals three distinct spatial risk profiles.
Cluster 0 (Purple—Low-Risk/Neutral Zone): Includes Agri_Res, TransCom, TransPark, IndusPark, ParkCom, AgriPark, WaterPark, and EduCom. These fall near the PCA origin, generally having low Critical Distances and lacking clear HRDDs, suggesting spatially dispersed or traffic-neutral impacts without dramatically altering surrounding crash likelihood.
Cluster 1 (Teal—Medium Risk with Thresholds): Comprises ResPark, ResEdu, EduRes, HospRes, AgriEdu, ParkEdu, and AgriComm. These often show moderate Critical/Threshold Distances, indicating crash clustering at specific proximities. Linked to institutional, residential, and park-related uses, they induce moderate localized traffic/pedestrian interaction, requiring focused design mitigation, especially in pedestrian zones.
Cluster 2 (Yellow—High-Risk Development Zones): Contains ComRes, ResCom, ParkRes, and IndusRes. Distinctly separated in PCA space, these intense transformations exhibit longer HRDDs and higher crash concentrations (e.g., Res → Com, Park → Res). Their impact extends beyond adjacency, reflecting broader spillovers needing strategic interventions like zoning, speed management, and early TIAs.

4. Discussion

This study aimed to investigate and quantify the long-term impact of specific land use-type conversions over a 10-year period on road crash frequency within Metropolitan Melbourne. The findings reveal that land use transitions are not neutral in their effect on road safety; rather, they differentially influence crash occurrences depending on the nature of the origin and destination land uses, the associated changes in activity levels and traffic patterns, and the adequacy of the existing or adapted infrastructure.

4.1. Differential Influence of Land Use Conversions on Crash Frequency

The analysis clearly demonstrates that different pathways of land use conversion yield distinct outcomes for road crash frequency. Conversions generally associated with intensification of activity or introduction of vulnerable users into less controlled environments tended to increase crash risk, although the statistical significance varied. For instance, converting agricultural land to residential (Agri → Res, Coeff: +0.02, p = 0.19) did not show a statistically significant change in crash frequency, though the coefficient was slightly positive, suggesting that any impact from new road users interacting with infrastructure not originally designed for such volumes may be minimal or offset by other factors in this specific transition. More substantial and statistically significant increases were observed when introducing educational uses into areas potentially lacking sufficient infrastructure, such as converting agricultural land (Agri → Edu, Coeff: +0.10, p < 0.001) or parks (Park → Edu, Coeff: +0.12, p < 0.001) to educational facilities. These transitions introduce high concentrations of vulnerable pedestrians (students) and specific peak traffic patterns (drop-offs, school buses) into environments potentially ill-equipped to handle them safely [72]. Similarly, converting parks to residential (Park → Res, Coeff: +0.04, p < 0.001) or commercial (Park → Com, Coeff: +0.07, p < 0.001) uses significantly increased crashes, likely due to introducing higher mobility demands and traffic intensity into previously low-traffic, green spaces [73,74]. Replacing hospitals with residential areas (Hosp → Res, Coeff: +0.07, p < 0.001) also significantly increased crashes, potentially due to the loss of structured hospital traffic management and the introduction of less predictable residential traffic patterns [25,75].
Conversely, transitions that involved converting land to park/recreational uses from potentially higher-intensity or higher-speed environments often resulted in crash reductions. The most significant reduction was observed when converting water bodies to parks (Water → Park, Coeff: –0.16, p < 0.001), likely reflecting the creation of intentionally low-traffic, pedestrian-prioritized zones often designed with safety and leisure in mind [76]. Converting agricultural land to parks (Agri → Park, Coeff: –0.04, p = 0.05) also significantly reduced crashes at the 0.05 level, replacing potentially higher-speed rural roads with human-centered landscapes that discourage through-traffic [77]. Interestingly, converting transportation land to commercial use (Trans → Com, Coeff: –0.12, p < 0.001) also showed a substantial crash reduction. This suggests that leveraging existing infrastructure designed for high traffic volumes and controlled flows (e.g., arterial roads, signalized intersections) for commercial purposes is safer than introducing commercial activity into less prepared environments [78,79].
Some findings highlight the importance of infrastructure context. The transition from residential to park (Res → Park, Coeff: +0.00, p = 0.97) showed no statistically significant change in crash frequency. However, a significant increase was observed for commercial to park (Com → Park, Coeff: +0.06, p < 0.01). This latter finding suggests that simply designating an area as a park does not guarantee safety if the surrounding or retained infrastructure (e.g., wide roads, high-capacity intersections from former commercial use) creates a mismatch with the expected slower, pedestrian-focused park environment [80,81]. Similarly, converting transportation land to parks (Trans → Park, Coeff: +0.10, p < 0.001) resulted in a significant crash increase, underscoring the persistent dangers of legacy infrastructure (fast roads, freight paths) if not comprehensively redesigned for safe park access [77].
While park and recreational zones are typically associated with improved safety, several transitions in our analysis, notably Trans → Park (Coeff: +0.10, p < 0.001) and Com → Park (Coeff: +0.06, p < 0.01), were significantly linked to increased crash frequency. This counterintuitive outcome may stem from residual infrastructure characteristics inherited from previous land uses—such as wide roadways, high traffic volumes, or lack of pedestrian prioritization—that are not adequately redesigned during the land use change. For example, the conversion of the former Fitzroy Goods Yard in Melbourne into a recreational precinct led to increased pedestrian presence without corresponding modifications to adjacent roadways, resulting in a documented rise in pedestrian-related incidents during peak hours. Some findings, such as the increase in crashes near park transitions, may appear unintuitive at first glance, yet they are consistently supported by empirical research. Areas surrounding parks often experience elevated pedestrian and bicyclist crash rates due to increased foot and bike traffic, particularly involving children and families, combined with complex traffic environments and inadequate safety infrastructure [77]. These risks are exacerbated in socioeconomically disadvantaged neighborhoods, where active travel is more common and infrastructure may be substandard. Additionally, visual complexity—such as signage, landscaping, and parked cars—can overload drivers, reducing reaction time and heightening crash risk even when speeds are lower. Case studies from Los Angeles, Florida theme parks, and Acadia National Park further illustrate how factors like driver confusion, peak visitor hours, and routing changes contribute to crash increases [11], reinforcing the need to address these transitions with targeted safety interventions supported by existing literature.

4.2. Correlation Between Activity Shifts and Crash Frequency

The findings largely support the hypothesis that land use conversions representing significant shifts in activity levels and traffic generation correlate predictably with changes in long-term crash frequency. Transitions introducing substantially higher levels of human activity, vehicular traffic, or interactions between different road user types generally corresponded with increased crash frequency. The large and statistically significant increases associated with establishing educational facilities (Res → Edu, Coeff: +0.09, p < 0.001; Agri → Edu, Coeff: +0.10, p < 0.001; Park → Edu, Coeff: +0.12, p < 0.001) directly reflect the dramatic shift in traffic patterns, concentration of vulnerable users, and infrastructure strain associated with schools. Likewise, increasing residential density by converting parks (Park → Res, Coeff: +0.04, p < 0.001) or former hospitals (Hosp → Res, Coeff: +0.07, p < 0.001) led to predictable and significant increases in crashes due to heightened mobility demands and potentially less structured traffic flow compared to the previous use [73]. Introducing commercial activity into parks (Park → Com, Coeff: +0.07, p < 0.001) or former school sites (Edu → Com, Coeff: +0.05, p < 0.01) also significantly increased crashes, consistent with higher traffic volumes and increased mixed-traffic complexity [74,76].
Conversely, transitions leading to calmer or more controlled environments generally correlated with decreased crash frequency. The strong and significant reductions seen in Water → Park (Coeff: –0.16, p < 0.001) and Agri → Park (Coeff: –0.04, p = 0.05) align with the expectation that creating low-traffic, nature-focused environments enhances safety [77]. The significant reduction observed for Trans → Com (Coeff: –0.12, p < 0.001) indicates that directing intense commercial activity onto infrastructure already built to handle significant volume is safer than alternatives.
However, the correlation is not absolute and is significantly mediated by the quality and suitability of the infrastructure. As noted previously, conversions to parks from commercial (Com → Park, Coeff: +0.06, p < 0.01) or transportation (Trans → Park, Coeff: +0.10, p < 0.001) land uses showed significant crash increases. The transition from residential to parkland (Res → Park, Coeff: +0.00, p = 0.97) did not show a statistically significant change in crash frequency. These latter findings deviate from the simple expectation that parks are inherently safer. This underscores that the legacy of the previous land use’s infrastructure and the degree to which it is adapted for the new use are critical determinants of the final safety outcome [77,81]. Therefore, while shifts in activity levels provide a strong indicator, the predictability of crash frequency change is highly dependent on proactive and appropriate infrastructure planning and redesign during the conversion process.

4.3. Substantial Associations and Implications for Policy and Intervention

Several land use transition pathways exhibited particularly substantial associations with changes in road crash frequency, highlighting priorities for safety interventions and future land use policy in Melbourne.
The transitions associated with the most significant increases in crash frequency were predominantly those involving the establishment of educational or park/recreational uses in areas potentially unprepared for them, or the conversion of parks to intensive uses: Park → Edu (Coeff: +0.12, p < 0.001), Agri → Edu (Coeff: +0.10, p < 0.001), and Trans → Park (Coeff: +0.10, p < 0.001). Other notable significant increases included Res → Edu (Coeff: +0.09, p < 0.001), Park → Com (Coeff: +0.07, p < 0.001), Hosp → Res (Coeff: +0.07, p < 0.001), Edu → Res (Coeff: +0.06, p < 0.001), Com → Park (Coeff: +0.06, p < 0.01), and Park → Res (Coeff: +0.04, p < 0.001). The common thread among many high-risk transitions appears to be the introduction of concentrated activity or vulnerable road users (students, pedestrians, families in parks) into environments with potentially inadequate or mismatched infrastructure (rural roads lacking sidewalks, former transport corridors with high speeds, commercial areas not designed for pedestrian leisure).
The transitions showing the most substantial and statistically significant decreases in crash frequency were Water → Park (Coeff: –0.16, p < 0.001) and Trans → Com (Coeff: –0.12, p < 0.001), followed by Agri → Park (Coeff: –0.04, p = 0.05). The transition Edu → Park (Coeff: –0.03, p = 0.10) showed a marginally significant decrease. These represent scenarios where low-traffic, pedestrian-oriented environments are created, or where high-intensity commercial uses are channeled onto infrastructure already optimized for significant traffic volumes.
Table 4 indicates the summary of the findings and a comparison with the literature.

4.4. Policy Implications

Prioritize Interventions for High-Risk Land Use Transitions: Land use planning processes should prioritize scrutiny for conversions identified as significantly increasing crash risk, such as the transition of agricultural or parkland to educational facilities (Agri → Edu, Coeff: +0.10, p < 0.001; Park → Edu, Coeff: +0.12, p < 0.001), transport land to parks (Trans → Park, Coeff: +0.10, p < 0.001), and parkland to commercial use (Park → Com, Coeff: +0.07, p < 0.001). For these specific transitions, mandatory and comprehensive traffic impact assessments, explicitly addressing pedestrian and cyclist safety, are strongly recommended. Furthermore, the implementation of required infrastructure upgrades—including elements like safe drop-off zones, continuous sidewalks, dedicated crossings, traffic calming measures, and potentially intersection redesign—should be considered prerequisites for development approval.
Require Concurrent Infrastructure Adaptation: A fundamental policy takeaway is the necessity of linking land use change approvals directly to requirements for adapting the surrounding transport infrastructure. The assumption that existing road networks can adequately accommodate fundamentally different traffic generators and user groups (e.g., increased pedestrian/cyclist activity) without safety compromises is challenged by findings like the statistically significant increased risks associated with Park → Com (Coeff: +0.07, p < 0.001), Com → Park (Coeff: +0.06, p < 0.01), and Trans → Park (Coeff: +0.10, p < 0.001) conversions. Therefore, applying established frameworks like “Safe System” and “Complete Streets” should inform the process of infrastructure review and mandatory upgrades triggered by land use transformation.

5. Conclusions

This study demonstrates that land use conversions over a decade in Metropolitan Melbourne have significant and varied impacts on long-term road crash frequency. The transformation of landscapes is intrinsically linked to road safety outcomes, with transitions involving increased activity intensity, the introduction of vulnerable road users, or infrastructure mismatches generally correlating with higher crash rates. Notably, conversions leading to educational uses (e.g., Agri → Edu, Coeff: +0.10, p < 0.001; Park → Edu, Coeff: +0.12, p < 0.001; Res → Edu, Coeff: +0.09, p < 0.001) or intensifying activity in formerly passive zones (e.g., Park → Com, Coeff: +0.07, p < 0.001; Park → Res, Coeff: +0.04, p < 0.001) exhibited substantial and statistically significant increases in crash risk, often reflecting inadequate infrastructure adaptation to new traffic demands and user types [73,74,94]. Conversely, pathways establishing low-traffic, pedestrian-oriented environments (e.g., Water → Park, Coeff: –0.16, p < 0.001; Agri → Park, Coeff: –0.04, p = 0.05) or strategically locating high-intensity uses onto optimized infrastructure (Trans → Com, Coeff: –0.12, p < 0.001) were associated with significant crash reductions [76,77,78].
The findings underscore that while shifts in activity levels are a key driver, the safety implications of land use change are critically mediated by the context and adequacy of the transport infrastructure. Simply changing a land use designation without corresponding infrastructure redesign can lead to counter-intuitive increases in risk, as seen when parks are developed on former transport or commercial land without mitigating legacy hazards [77,81]. Therefore, proactive and context-sensitive planning is paramount. Prioritizing interventions for identified high-risk transitions, promoting inherently safer conversion pathways, and embedding the mandatory adaptation of infrastructure within land use policy are crucial steps towards mitigating road trauma and fostering safer, more sustainable urban development in Melbourne. Integrating road safety as a fundamental component of long-term land use strategy is essential for protecting communities as the metropolitan landscape continues to evolve.
While the results of both Poisson regression and Random Forest models reveal strong statistical associations between specific land use transitions and changes in road crash frequency, we caution against interpreting these findings as evidence of causality. Given the observational nature of the data, the absence of randomization, and the possibility of omitted confounders (e.g., changes in enforcement, socio-economic shifts, or concurrent infrastructure investments), the relationships identified should be considered associative. For example, the observed increase in crash frequency following conversions such as Agricultural → Education may be partially driven by unmeasured factors like school catchment design or traffic management policies. Future research using more granular, time-series data or natural experiments (e.g., policy-induced land use changes) could help untangle these effects and more rigorously evaluate causal mechanisms [115,116].
This study’s limitations include its reliance on aggregated land use and crash data over a 10-year period, potentially masking finer temporal dynamics and intra-category variations [117,118]. Concurrent changes in infrastructure quality, traffic volumes, or management strategies were not explicitly modeled, representing potential confounders. Furthermore, the analysis did not deeply probe localized socio-economic or micro-level built environment influences on crash risk within transition zones. The findings are context-bound to Metropolitan Melbourne and may not be directly generalizable.
Several limitations should be acknowledged regarding the adopted methodological approaches. First, the use of Poisson regression assumes equidispersion and may not adequately handle overdispersed or highly discrete count data, as observed in our dataset. Although alternative models (negative binomial and quasi-Poisson) were tested to address this, the Poisson framework may still underrepresent the true variance in crash frequencies, especially in areas with zero-inflated or sparse distributions. Second, the Random Forest algorithm, while powerful for capturing nonlinear patterns and variable interactions, lacks the inferential transparency of regression models. The importance rankings generated by Random Forest may not align with coefficient-based interpretations from the Negative Binomial model due to differences in model structure, sensitivity to variable collinearity, and the handling of spatial dependencies. As such, divergences between models—for example, in how transitions like Com → Park or Hosp → Res are prioritized—should be interpreted as complementary perspectives rather than contradictions. Future research could benefit from integrating ensemble model interpretation techniques (e.g., SHAP values) to bridge the interpretability gap between geostatistical and machine learning outputs.
Another limitation of this study is the lack of further subdivision within the same type of land use category. Due to the nature of the publicly available datasets—such as ABS Mesh Blocks and standard land use classifications from Land Use Victoria—we were constrained to using aggregated land use types (e.g., “residential,” “parkland,” “commercial”) without further granularity. This approach, while consistent with prior land cover and crash analysis studies, may mask heterogeneity within each class. For instance, different types of parks (urban plaza vs. natural reserve) or residential areas (single-family homes vs. high-density apartments) could exhibit varying impacts on crash frequency. Future research should aim to incorporate fine-grained land use zoning or cadastral data, where available, to enhance the interpretive depth of such analyses and allow more precise recommendations for spatial planning and risk mitigation. Moreover, the data used in this research were derived from police-reported crash records, which are known to underreport minor incidents involving some road users such as pedestrians and cyclists [119,120].
Future research should incorporate more granular, longitudinal data, including traffic volumes, detailed infrastructure audits (especially pedestrian/cyclist facilities), and finer-scale socio-demographics to enhance causal understanding. Employing quasi-experimental designs could help isolate land use change effects from concurrent projects. Comparative studies across different cities are needed to assess generalizability. Additionally, qualitative research into the planning and implementation of land use conversions could reveal practical challenges and opportunities for better integrating safety into urban development.
Future research should explore the moderating effects of sociodemographic variables—such as income, age structure, and mobility access—on the relationship between land use transitions and crash frequency. These contextual factors may significantly shape how a given urban development (land use change) translates into safety outcomes. For instance, the conversion of agricultural land to residential use may lead to very different crash patterns in high-income, car-dependent suburbs of Melbourne compared to rapidly urbanizing areas in developing cities, where pedestrian infrastructure and enforcement mechanisms may be weaker. Incorporating such variables into future models could allow for more context-sensitive policy recommendations and help explain divergent safety outcomes across socioeconomically diverse areas. Where granular data are available, multi-level or interaction-based models are recommended to isolate these moderating effects.

Author Contributions

Conceptualization, A.S. (Ali Soltani), M.R. and A.S. (Amir Sobhani); methodology, M.R. and A.S. (Ali Soltani); software, M.R.; validation, A.S. (Ali Soltani) and A.S. (Amir Sobhani); formal analysis, A.S. (Ali Soltani); investigation, A.S. (Ali Soltani), M.R. and A.S. (Amir Sobhani); resources, A.S. (Ali Soltani) and M.R.; data curation, M.R.; writing—original draft preparation, M.R.; writing—review and editing, A.S. (Ali Soltani) and A.S. (Amir Sobhani); visualization, M.R.; supervision, A.S. (Ali Soltani); project administration, A.S. (Ali Soltani). All authors have read and agreed to the published version of the manuscript.

Funding

This research received no external funding.

Institutional Review Board Statement

Not applicable.

Informed Consent Statement

Not applicable.

Data Availability Statement

The data will be available upon request.

Acknowledgments

During the preparation of this work, the authors used GPT-3.5, Quillbot, and Google Gemini in order to improve the readability and language of the manuscript, and obtain assistance with paraphrasing as needed. After using these tools, the authors reviewed and edited the content and take full responsibility for the content of the published article.

Conflicts of Interest

The authors declare no conflicts of interest.

Abbreviations

The following abbreviations are used in this manuscript:
AbbreviationFull name
TIATraffic Impact Assessment
LULand Use
LUCLand Use Conversion
GMAGreater Metropolitan Area
VRUVulnerable Road User
GLMGeneralized Linear Model
KDEKernel Density Estimation
DEMsDigital Elevation Models
IDWInverse Distance Weighting
HRDDHigh-Risk Development Distance
PCAPrincipal Component Analysis
MLEMaximum Likelihood Estimation
VIFVariance Inflation Factor
NBNegative Binomial
RFRandom Forest
GWRGeographically Weighted Regression
TLAThree-Letter Acronym
LDLinear Dichroism
AICAkaike Information Criterion
BICBayesian Information Criterion
Agri_ResTransition from Agricultural to Residential
Agri_CommTransition from Agricultural to Commercial
Agri_EduTransition from Agricultural to Educational
Agri_ParkTransition from Agricultural to Park/Recreational
Res_ComTransition from Residential to Commercial
Res_ParkTransition from Residential to Park/Recreational
Res_EduTransition from Residential to Educational
Park_ResTransition from Park/Recreational to Residential
Park_ComTransition from Park/Recreational to Commercial
Park_EduTransition from Park/Recreational to Educational
Edu_ResTransition from Educational to Residential
Edu_ComTransition from Educational to Commercial
Edu_ParkTransition from Educational to Park/Recreational
Indus_ResTransition from Industrial to Residential
Indus_ComTransition from Industrial to Commercial
Indus_ParkTransition from Industrial to Park/Recreational
Hosp_ResTransition from Hospital/Healthcare to Residential
Trans_ResTransition from Transportation to Residential
Trans_ComTransition from Transportation to Commercial
Trans_ParkTransition from Transportation to Park/Recreational
Water_ParkTransition from Waterbody/Wetland to Park/Recreational
Com_ResTransition from Commercial to Residential
Com_EduTransition from Commercial to Educational
Com_ParkTransition from Commercial to Park/Recreational
MDPIMultidisciplinary Digital Publishing Institute
DOAJDirectory of Open Access Journals

References

  1. International Transport Forum. Road Safety Annual Report 2023; OECD Publishing: Paris, France, 2023; Available online: https://www.oecd.org/content/dam/oecd/en/publications/reports/2023/12/road-safety-annual-report-2023_f83ca809/8654c572-en.pdf (accessed on 18 December 2023). [CrossRef]
  2. World Health Organization. Global Status Report on Road Safety 2018. 2018. Available online: https://www.who.int/publications/i/item/9789241565684 (accessed on 17 June 2018).
  3. International Transport Forum. Road Safety Performance in the United Kingdom; OECD Publishing: Paris, France, 2023; Available online: https://www.itf-oecd.org/sites/default/files/united-kingdom-road-safety.pdf (accessed on 3 May 2025).
  4. Khalifa, R.; Traboulsi, H.; El Traboulsi, Y. Spatiotemporal investigation of intersection crashes in Victoria. In 2022 Advances in Science and Engineering Technology International Conferences (ASET); IEEE: Piscataway, NJ, USA, 2022; pp. 1–5. [Google Scholar]
  5. Schumann, J.L.; Perkins, M.D.; Wundersitz, L.N. The Prevalence of Alcohol and Other Drugs in Fatal Road Crashes in South Australia; Centre for Automotive Safety Research, The University of Adelaide: Adelaide, SA, Australia, 2021. [Google Scholar]
  6. Beck, B.; Stevenson, M.; Newstead, S.; Cameron, P.; Judson, R.; Edwards, E.R. Safer Cycling: An In-Depth Crash Study in Melbourne; Monash University Accident Research Centre: Melbourne, VIC, Australia, 2016. [Google Scholar]
  7. Boufous, S.; de Rome, L.; Senserrick, T.; Ivers, R. Single Versus Multivehicle Bicycle Road Crashes in Victoria. Inj. Prev. J. Int. Soc. Child Adolesc. Inj. Prev. 2013, 19, 358–362. [Google Scholar]
  8. Soltani, A.; Afshari, S.; Amiri, M.A. Projecting Road Traffic Fatalities in Australia: Insights for Targeted Safety Interventions. Injury 2025, 56, 112166. [Google Scholar]
  9. Duong, Q.; Gilbert, H.; Nguyen, H. A novel framework for crash frequency prediction: Geographic support vector regression based on agent-based activity models in Greater Melbourne. Accid. Anal. Prev. 2024, 207, 107747. [Google Scholar] [CrossRef] [PubMed]
  10. Xiao, D.; Ding, H.; Sze, N.N.; Zheng, N. Investigating built environment and traffic flow impact on crash frequency in urban road networks. Accid. Anal. Prev. 2024, 201, 107561. [Google Scholar] [CrossRef]
  11. Alavi, H.; Charlton, J.; Newstead, S. Factors Driving Intersection Pedestrian Crash Risk in Concentrated Urban Environments. In Proceedings of the 2013 Australasian Road Safety Research, Policing & Education Conference, Brisbane, QLD, Australia, 28–30 August 2013. [Google Scholar]
  12. Stephan, K.; Newstead, S. Characteristics of the road and surrounding environment in metropolitan shopping strips: Association with the frequency and severity of single-vehicle crashes. Traffic Inj. Prev. 2014, 15 (Suppl. S1), S74–S80. [Google Scholar] [CrossRef]
  13. Soltani, A.; Askari, S. Exploring spatial autocorrelation of traffic crashes based on severity. Injury 2017, 48, 637–647. [Google Scholar] [CrossRef]
  14. Soltani, A.; Qadikolaei, M.R. Space-time analysis of accident frequency and the role of built environment in mitigation. Transp. Policy 2024, 150, 189–205. [Google Scholar] [CrossRef]
  15. Combs, T.; McDonald, N. Driving change: Exploring the adoption of multimodal local traffic impact assessment practices. J. Transp. Land Use 2021, 14, 47–64. [Google Scholar] [CrossRef]
  16. Shubho, M.T.H.; Neema, M.N. Impact of land use change on prodigious traffic growth towards impeding livability of a city. Environ. Ecol. Manag. 2014, 2014, 1–15. [Google Scholar]
  17. Manullang, O.; Rakhmatulloh, A.; Sihaloho, D.; Samosir, N. Changes of landuse in the campus area and their implications toward traffic condition. IOP Conf. Ser. Earth Environ. Sci. 2019, 340, 012034. [Google Scholar] [CrossRef]
  18. Chan, J.; Fahad, N.; Goh, K.; Tee, C. Visual Analytic for Traffic Impact Assessment. Int. J. Inform. Vis. 2024, 8, 1176–1184. [Google Scholar] [CrossRef]
  19. Kaparias, I.; Liu, P.; Tsakarestos, A.; Eden, N.; Schmitz, P.; Hoadley, S.; Hauptmann, S. Predictive road safety impact assessment of traffic management policies and measures. Case Stud. Transp. Policy 2020, 8, 508–516. [Google Scholar] [CrossRef]
  20. Leong, L.; Shafie, S. Traffic emissions before and after development based on traffic impact assessment. IOP Conf. Ser. Earth Environ. Sci. 2024, 1368, 012012. [Google Scholar] [CrossRef]
  21. Wang, T.; Chen, B.; Chen, Y.; Deng, S.; Chen, J. Traffic Risk Assessment Based on Warning Data. J. Adv. Transp. 2022, 2022, 1–11. [Google Scholar] [CrossRef]
  22. Rezaei, M.; Soltani, A.; Kashkooli, H.N. Predicting active travel durations in Tehran: A multilayer perceptron approach. J. Urban Mobil. 2025, 7, 100126. [Google Scholar] [CrossRef]
  23. Abdel-Aty, M.; Siddiqui, C.; Huang, H.; Wang, X. Integrating trip and roadway characteristics to manage safety in traffic analysis zones. Accid. Anal. Prev. 2013, 50, 1128–1136. [Google Scholar] [CrossRef]
  24. Xie, B.; An, Z.; Zheng, Y.; Li, Z. Incorporating transportation safety into land use planning: Pre-assessment of land use conversion effects on severe crashes in urban China. Appl. Geogr. 2019, 102, 1–8. [Google Scholar] [CrossRef]
  25. Hadayeghi, A.; Shalaby, A.S.; Persaud, B.N. Development of planning level transportation safety models using macro-level collision prediction models. Transp. Res. Rec. J. Transp. Res. Board 2010, 2147, 98–107. [Google Scholar] [CrossRef]
  26. Saha, B.; Fatmi, M.R.; Rahman, M.M. Modeling injury severity of unconventional vehicle occupants: Hybrid of latent segments and random parameters logit models. Transp. Res. Rec. J. Transp. Res. Board 2022, 2676, 35–47. [Google Scholar] [CrossRef]
  27. Clifton, K.J.; Burnier, C.V.; Akar, G. Severity of injury resulting from pedestrian–vehicle crashes: What can be learned from examining built environment factors? J. Urban Health 2009, 86, 675–686. [Google Scholar] [CrossRef]
  28. Merlin, L.A.; Guerra, E.; Dumbaugh, E. Crash risk, crash exposure, and the built environment: A conceptual review. Transp. Res. Rec. J. Transp. Res. Board 2020, 2674, 197–208. [Google Scholar] [CrossRef] [PubMed]
  29. Soltani, A.; Azmoodeh, M.; Roohani Qadikolaei, M. Post-COVID-19 transformation in the frequency and location of traffic crashes involving older adults. Transp. Res. Rec. J. Transp. Res. Board 2024, 2678, 493–511. [Google Scholar] [CrossRef]
  30. Wei, F.; Lovegrove, G. An empirical tool to evaluate the safety of cyclists: Community-based, macro-level collision prediction models using negative binomial regression. J. Transp. Health 2013, 1, 260–268. [Google Scholar] [CrossRef] [PubMed]
  31. Kim, K.; Yamashita, E.; Li, L. Land use, traffic crashes, and urban form: Evidence from Honolulu. Transp. Res. Rec. J. Transp. Res. Board 2006, 1977, 148–155. [Google Scholar] [CrossRef]
  32. Wier, M.; Weintraub, J.; Humphreys, E.H.; Seto, E.; Bhatia, R. An area-level model of vehicle-pedestrian injury collisions with implications for land use and transportation planning. Accid. Anal. Prev. 2009, 41, 137–145. [Google Scholar] [CrossRef]
  33. Miranda-Moreno, L.F.; Morency, P.; El-Geneidy, A.M. The link between built environment, pedestrian activity and pedestrian-vehicle collision occurrence at signalized intersections. Accid. Anal. Prev. 2011, 43, 1624–1634. [Google Scholar] [CrossRef]
  34. Gates, T.J.; Noyce, D.A.; Talada, V.C.; Hill, L.K. The safety and operational effects of “road diet” conversions in Minnesota. In Proceedings of the Transportation Research Board 86th Annual Meeting, Washington, DC, USA, 12–25 January 2007. [Google Scholar]
  35. Gattis, J.L.; Hanning, C.E.; Duncan, L. Changes associated with converting frontage roads from two-way to one-way operation. In Proceedings of the Transportation Research Board 90th Annual Meeting, Washington, DC, USA, 23–27 January 2011. [Google Scholar]
  36. Eisele, W.L.; Frawley, W.E.; Park, E.S.; Robertson, J.E. Safety and economic impacts of converting two-way frontage roads to one-way operation. Transp. Res. Rec. J. Transp. Res. Board 2012, 2301, 66–75. [Google Scholar] [CrossRef]
  37. Naderi, J.R. Landscape design in the clear zone: Effect of landscape variables on pedestrian health and driver safety. Transp. Res. Rec. J. Transp. Res. Board 2003, 1851, 119–130. [Google Scholar] [CrossRef]
  38. McAndrews, C. Road safety in the context of urban development in Sweden and California. Ph.D. Dissertation, KTH Royal Institute of Technology, Stockholm, Sweden, 2010. [Google Scholar]
  39. Allan, A.; Soltani, A.; Abdi, M.H.; Zarei, M. Driving forces behind land use and land cover change: A systematic and bibliometric review. Land, 2022; 11, 1222. [Google Scholar] [CrossRef]
  40. Javadpoor, M.; Soltani, A.; Fatehnia, L.; Soltani, N. How the built environment moderates gender gap in active commuting to schools. Int. J. Environ. Res. Public Health 2023, 20, 1131. [Google Scholar] [CrossRef]
  41. Berkovitz, A. The marriage of safety and land-use planning: A fresh look at local roadways. Public Roads 2001, 65, 7–19. [Google Scholar]
  42. Iamtrakul, P.; Chayphong, S.; Mateo-Babiano, I. The transition of land use and road safety studies: A systematic literature review (2000–2021). Sustainability 2023, 15, 8894. [Google Scholar] [CrossRef]
  43. Abdel-Aty, M.; Pande, A.; Lee, C.; Das, A.; Nevárez, A.; Darwiche, A.; Devarasetty, P.C. Reducing fatalities and severe injuries on Florida’s high-speed multi-lane arterial corridors. In Part I: Preliminary Severity Analysis of Driver Crash Involvements; University of Central Florida: Orlando, FL, USA, 2009. Available online: https://rosap.ntl.bts.gov/view/dot/17061 (accessed on 12 May 2025).
  44. Rahman, M.T.; Jamal, A.; Al-Ahmadi, H.M. Examining hotspots of traffic collisions and their spatial relationships with land use: A GIS-based geographically weighted regression approach for Dammam, Saudi Arabia. ISPRS Int. J. Geo-Inf. 2020, 9, 540. [Google Scholar] [CrossRef]
  45. Koloushani, M.; Karaer, A.; Ozguven, E.E.; Sando, T.; Dulebenets, M.A.; Moses, R. Investigating spatial correlations between land use and pedestrian injury severity in crashes occurring away from intersections in Northwest Florida. Transp. Res. Rec. J. Transp. Res. Board 2022, 2676, 599–614. [Google Scholar] [CrossRef]
  46. Yang, T.; Fan, W.D.; Song, L. Modeling pedestrian injury severity in pedestrian-vehicle crashes considering different land use patterns: Mixed logit approach. Traffic Inj. Prev. 2023, 24, 114–120. [Google Scholar] [CrossRef]
  47. Chiou, Y.C.; Fu, C. Modeling crash frequency and severity using multinomial-generalized Poisson model with error components. Accid. Anal. Prev. 2013, 50, 593–603. [Google Scholar] [CrossRef]
  48. Li, L.; Zhu, L.; Sui, D.Z. Spatiotemporal analysis of crash severity by land use types. J. Saf. Res. 2007, 38, 657–666. [Google Scholar] [CrossRef]
  49. Khedher, M.B.B.; Yun, D. An interpretable machine learning-based hurdle model for zero-inflated road crash frequency data analysis: Real-world assessment and validation. Appl. Sci. 2024, 14, 1007. [Google Scholar] [CrossRef]
  50. Tang, J.; Gao, F.; Liu, F.; Han, C.; Lee, J. Spatial heterogeneity analysis of macro-level crashes using geographically weighted Poisson quantile regression. Accid. Anal. Prev. 2020, 148, 105833. [Google Scholar] [CrossRef]
  51. Jima, D.; Sipos, T. Interactive effects of elevation difference, slope variation, and terrain formation on road traffic crashes occurrences using triangular irregular network. Eng. Rep. 2024, 6, e12971. [Google Scholar] [CrossRef]
  52. Chen, Z.; Li, K.; Du, J.; Chen, Y.; Liu, R.; Wang, Y. Three-dimensional simulation of regional urban waterlogging based on high-precision DEM model. Nat. Hazards 2021, 108, 2653–2677. [Google Scholar] [CrossRef]
  53. Bielski, C.; López-Vázquez, C.; Grohmann, C.; Guth, P.; Hawker, L.; Gesch, D.; Trevisani, S.; Herrera-Cruz, V.; Riazanoff, S.; Corseaux, A.; et al. Novel Approach for Ranking DEMs: Copernicus DEM Improves One Arc Second Open Global Topography. IEEE Trans. Geosci. Remote Sens. 2023, 62, 1–22. [Google Scholar] [CrossRef]
  54. Riazanoff, S.; Corseaux, A.; Albinet, C.; Strobl, P.; López-Vázquez, C.; Guth, P.; Tadono, T. Best BiCubic Method to Compute the Planimetric Misregistration between Images with Sub-Pixel Accuracy: Application to Digital Elevation Models. ISPRS Int. J. Geo-Information 2024, 13, 96. [Google Scholar] [CrossRef]
  55. Tian, W.; Zhao, Z.; Hu, C.; Wang, J.; Zeng, T. GB-InSAR-Based DEM Generation Method and Precision Analysis. Remote. Sens. 2019, 11, 997. [Google Scholar] [CrossRef]
  56. Chung, H.; Duan, Q.; Chen, Z.; Yang, Y. Investigating the effects of POI-based Land Use on Traffic Accidents in Suzhou Industrial Park, China. Case Stud. Transp. Policy 2022, 12, 100933. [Google Scholar] [CrossRef]
  57. Li, Y.; Wang, Y.; Lai, Y.; Shuai, J.; Zhang, L. Monte Carlo-based quantitative risk assessment of parking areas for vehicles carrying hazardous chemicals. Reliab. Eng. Syst. Saf. 2023, 231, 109010. [Google Scholar] [CrossRef]
  58. Xia, X.; Li, T.; He, X. Analysis of the Interaction between Urban Transportation and Land Use Based on Multi-Perspectives Method. In Proceedings of the 2023 Smart City Challenges & Outcomes for Urban Transformation (SCOUT), Singapore, 29–30 July 2023; pp. 129–134. [Google Scholar] [CrossRef]
  59. Iacono, M.; Levinson, D. Predicting Land Use Change. Transp. Res. Rec. 2009, 2119, 130–136. [Google Scholar] [CrossRef]
  60. Zhang, R.; Pu, L.; Zhu, M. Impacts of transportation arteries on land use patterns in urban-rural fringe: A comparative gradient analysis of Qixia District, Nanjing City, China. Chin. Geogr. Sci. 2013, 23, 378–388. [Google Scholar] [CrossRef]
  61. Demirel, H.; Sertel, E.; Kaya, S.; Seker, D. Exploring impacts of road transportation on environment: A spatial approach. Desalination 2008, 226, 279–288. [Google Scholar] [CrossRef]
  62. McCullagh, P.; Nelder, J.A. Generalized Linear Models, 2nd ed.; Chapman & Hall/CRC: Boca Raton, FL, USA, 1989. [Google Scholar]
  63. Hilbe, J.M. Negative Binomial Regression, 2nd ed.; Cambridge University Press: Cambridge, UK, 2011. [Google Scholar]
  64. Cameron, A.C.; Trivedi, P.K. Regression Analysis of Count Data, 2nd ed.; Cambridge University Press: Cambridge, UK, 2013. [Google Scholar]
  65. Wedderburn, R.W.M. Quasi-Likelihood Functions, Generalized Linear Models, and the Gauss—Newton Method. Biometrika 1974, 61, 439–447. [Google Scholar]
  66. Liu, Y.; Wang, Y.; Zhang, J. New Machine Learning Algorithm: Random Forest; Springer: Berlin/Heidelberg, Germany, 2012; pp. 246–252. [Google Scholar] [CrossRef]
  67. Karabadji, N.; Korba, A.; Assi, A.; Seridi-Bouchelaghem, H.; Aridhi, S.; Dhifli, W. Accuracy and diversity-aware multi-objective approach for random forest construction. Expert Syst. Appl. 2023, 225, 120138. [Google Scholar] [CrossRef]
  68. Salman, H.; Kalakech, A.; Steiti, A. Random Forest Algorithm Overview. Babylon. J. Mach. Learn. 2024, 2024, 69–79. [Google Scholar] [CrossRef] [PubMed]
  69. Tang, F.; Ishwaran, H. Random forest missing data algorithms. Stat. Anal. Data Min. ASA Data Sci. J. 2017, 10, 363–377. [Google Scholar] [CrossRef] [PubMed]
  70. Schonlau, M.; Zou, R. The random forest algorithm for statistical learning. Stata J. 2020, 20, 3–29. [Google Scholar] [CrossRef]
  71. Chen, D.; Zhong, L. Educational use in global national parks: Review and implications. Biodivers. Sci. 2020, 28, 1266–1275. [Google Scholar] [CrossRef]
  72. Najaf, P.; Thill, J.; Zhang, W.; Fields, M. City-level urban form and traffic safety: A structural equation modeling analysis of direct and indirect effects. J. Transp. Geogr. 2018, 69, 257–270. [Google Scholar] [CrossRef]
  73. Yu, C.; Woo, A. How to design built environments around parks that ensure pedestrian safety. J. Transp. Health 2022, 27, 101464. [Google Scholar] [CrossRef]
  74. Jia, R.; Khadka, A.; Kim, I. Traffic crash analysis with point-of-interest spatial clustering. Accid. Anal. Prev. 2018, 121, 223–230. [Google Scholar] [CrossRef]
  75. Zhang, K.; Tamakloe, R.; Cao, M.; Kim, I. Exploring fatal/severe pedestrian injury crash frequency at school zone crash hotspots: Using interpretable machine learning to assess the micro-level street environment. J. Transp. Geogr. 2024, 116, 104034. [Google Scholar] [CrossRef]
  76. Jerrett, M.; Su, J.; MacLeod, K.; Hanning, C.; Houston, D.; Wolch, J. Safe Routes to Play? Pedestrian and Bicyclist Crashes Near Parks in Los Angeles. Environ. Res. 2016, 151, 742–755. [Google Scholar] [CrossRef]
  77. McLeod, S.; Curtis, C. Contested urban streets: Place, traffic and governance conflicts of potential activity corridors. Cities 2019, 88, 184–193. [Google Scholar] [CrossRef]
  78. Curtis, C.; Tiwari, R. Transitioning urban arterial roads to activity corridors. Urban Des. Int. 2008, 13, 105–120. [Google Scholar] [CrossRef]
  79. Ekmekci, M.; Dadashzadeh, N.; Woods, L. Assessing the Impact of Low-Speed Limit Zones’ Policy Implications on Cyclist Safety: Evidence from the UK. Transp. Policy 2024, 152, 103614. [Google Scholar] [CrossRef]
  80. Said, M.; Geha, G.; Abou-Zeid, M. Natural Experiment to Assess the Impacts of Street-Level Urban Design Interventions on Walkability and Business Activity. Transp. Res. Rec. 2020, 2674, 258–271. [Google Scholar] [CrossRef]
  81. Ewing, R.; Hamidi, S. Urban sprawl leads to more fatal crashes, while denser areas experience higher rates of accidents which cause injuries. J. Am. Plan. Assoc. 2015, 81. Available online: http://eprints.lse.ac.uk/id/eprint/61199 (accessed on 12 May 2025).
  82. Qiao, S.; Yeh, G.; Zhang, M.; Yan, X. Effects of state-led suburbanization on traffic crash density in China: Evidence from the Chengdu City Proper. Accid. Anal. Prev. 2020, 148, 105775. [Google Scholar] [CrossRef] [PubMed]
  83. Majer, S.; Sołowczuk, A. Effectiveness of a Series of Road Humps on Home Zone Streets: A Case Study. Sustainability 2025, 17, 644. [Google Scholar] [CrossRef]
  84. Biddulph, M. Street Design and Street Use: Comparing Traffic Calmed and Home Zone Streets. J. Urban Des. 2012, 17, 213–232. [Google Scholar] [CrossRef]
  85. Iiritano, G.; Petrungaro, G.; Trecozzi, M. Limited Traffic Zone for walk safety around the schools. Transp. Res. Procedia 2022, 60, 316–323. [Google Scholar] [CrossRef]
  86. Zhou, L.; Xiao, W.; Wang, C.; Wang, H. Exploring spatial association between residential and commercial urban spaces: A machine learning approach using taxi trajectory data. J. Transp. Land Use 2024, 17, 735–756. [Google Scholar] [CrossRef]
  87. Rouky, N.; Bousouf, A.; Benmoussa, O.; Fri, M. A spatiotemporal analysis of traffic congestion patterns using clustering algorithms: A case study of Casablanca. Decis. Anal. J. 2024, 11, 100404. [Google Scholar] [CrossRef]
  88. Qin, J.; Lin, Y.; Wu, T.; Lin, X.; Li, X. A Spatio-Temporal Perspective on Commercial Vehicle Travel Patterns in Urban Environments. IEEE Access 2024, 12, 91447–91461. [Google Scholar] [CrossRef]
  89. Luo, Y.; Liu, Y.; Xing, L.; Wang, N.; Rao, L. Road Safety Evaluation Framework for Accessing Park Green Space Using Active Travel. Front. Environ. Sci. 2022, 10. [Google Scholar] [CrossRef]
  90. Dumbaugh, E.; Li, W.; Joh, K. The built environment and the incidence of pedestrian and cyclist crashes. Urban Des. Int. 2013, 18, 217–228. [Google Scholar] [CrossRef]
  91. Ferreira, M.; Costa, P.; Abrantes, D.; Hora, J.; Felicio, S.; Coimbra, M.; Dias, T. Identifying the determinants and understanding their effect on the perception of safety, security, and comfort by pedestrians and cyclists: A systematic review. Transp. Res. Part F Traffic Psychol. Behav. 2022, 91, 384–404. [Google Scholar] [CrossRef]
  92. An, F.; Liu, J.; Lu, W.; Jareemit, D. A review of the effect of traffic-related air pollution around schools on student health and its mitigation. J. Transp. Health 2021, 22, 101249. [Google Scholar] [CrossRef]
  93. Sun, W.; Guo, D.; Li, Q.; Fang, H. School runs and urban traffic congestion: Evidence from China. Reg. Sci. Urban Econ. 2021, 86, 103606. [Google Scholar] [CrossRef]
  94. Badyda, A.; Rogulski, M. Closing Access Streets to Schools for Vehicular Traffic—Does It Affect the Air Quality? Sustainability 2024, 16, 3380. [Google Scholar] [CrossRef]
  95. Clifton, K.; Kreamer-Fults, K. An examination of the environmental attributes associated with pedestrian-vehicular crashes near public schools. Accid. Anal. Prev. 2007, 39, 708–715. [Google Scholar] [CrossRef]
  96. Smith, M.; Hawley, G.; Mackay, L.; Hosking, J.; Mackie, H.; Ikeda, E.; Egli, V.; Ellaway, A.; Witten, K. Impact of changing road infrastructure on children’s active travel: A multi-methods study from Auckland, New Zealand. J. Transp. Health 2020, 18, 100868. [Google Scholar] [CrossRef]
  97. Brazil, N. Effects of Public School Closures on Crime: The Case of the 2013 Chicago Mass School Closure. Sociol. Sci. 2020, 7, 128–151. [Google Scholar] [CrossRef]
  98. Hwang, J. The reinforcement of pedestrian safety in the central business district: A spatial analysis of Austin, Texas. J. Urban Aff. 2022, 45, 1899–1915. [Google Scholar] [CrossRef]
  99. Stoker, P.; Garfinkel-Castro, A.; Khayesi, M.; Odero, W.; Mwangi, M.; Peden, M.; Ewing, R. Pedestrian Safety and the Built Environment. J. Plan. Lit. 2015, 30, 377–392. [Google Scholar] [CrossRef]
  100. Yin, M.; He, B. Performance-based urban ventilation corridor for actual achievement of environmental benefits. Build. Environ. 2025, 273, 112536. [Google Scholar] [CrossRef]
  101. Liu, Q.; Liu, Z.; Cui, B.; Zhu, C. Driving Safety and Comfort Enhancement in Urban Underground Interchanges via Driving Simulation and Machine Learning. Sustainability 2024, 16, 9601. [Google Scholar] [CrossRef]
  102. Rotem-Mindali, O.; Katzir, N.; Perez, O. Identifying Regulatory Barriers in the Management of Ecological Corridors in an Increasingly Congested Space. Land 2024, 13, 1552. [Google Scholar] [CrossRef]
  103. Aceves-González, C.; Ekambaram, K.; Rey-Galindo, J.; Rizo-Corona, L. The role of perceived pedestrian safety on designing safer built environments. Traffic Inj. Prev. 2020, 21 (Suppl. S1), S84–S89. [Google Scholar] [CrossRef]
  104. Castillo, C.; Barranco, R.; Curtale, R.; Kompil, M.; Jacobs-Crisioni, C.; Rodriguez, S.; Aurambout, J.; Silva, F.; Sulis, P.; Auteri, D. Are remote rural areas in Europe remarkable? Challenges and opportunities. J. Rural. Stud. 2024, 109, 103180. [Google Scholar] [CrossRef]
  105. Mangione, G.; Cannella, G. Small School, Smart Schools: Distance Education in Remoteness Conditions. Technol. Knowl. Learn. 2020, 26, 845–865. [Google Scholar] [CrossRef]
  106. Da Silva, A.; Carvalho, P.; Ribeiro, V.; Corrêa, N. Urban Parks in Permanent Preservation Areas as a Tool for Conservation and Environmental Education: A Bibliometric Study. Rev. De Gestão Soc. E Ambiental 2025, 19, e04001. [Google Scholar] [CrossRef]
  107. Adanu, E.; Smith, R.; Powell, L.; Jones, S. Multilevel analysis of the role of human factors in regional disparities in crash outcomes. Accid. Anal. Prev. 2017, 109, 10–17. [Google Scholar] [CrossRef]
  108. Isler, C.; Huang, Y.; De Melo, L. Developing accident frequency prediction models for urban roads: A case study in São Paulo, Brazil. IATSS Res. 2024, 48, 378–392. [Google Scholar] [CrossRef]
  109. Oluyomi, A.; Lee, C.; Nehme, E.; Dowdy, D.; Ory, M.; Hoelscher, D. Parental safety concerns and active school commute: Correlates across multiple domains in the home-to-school journey. Int. J. Behav. Nutr. Phys. Act. 2014, 11, 32. [Google Scholar] [CrossRef] [PubMed]
  110. Bina, M.; Confalonieri, F.; Abati, D.; Villa, D.; Biassoni, F. Analysis of traffic upon school departure: Environment, behaviour, well-being and risk factors for road crashes. J. Transp. Health 2021, 22, 101119. [Google Scholar] [CrossRef]
  111. Von Stülpnagel, R.; Riach, N.; Hologa, R.; Kees, J.; Gössling, S. School route safety perceptions of primary school children and their parents: Effects of transportation mode and infrastructure. Int. J. Sustain. Transp. 2024, 18, 465–477. [Google Scholar] [CrossRef]
  112. Lv, Z.; Yang, A.; Wang, Y. Characteristics, Drivers, and Development Modes of Rural Space Commercialization under Different Altitude Gradients: The Case of the Mountain City of Chongqing. Land 2023, 12, 1028. [Google Scholar] [CrossRef]
  113. Casado-Mansilla, D.; García-Zubía, J.; Cuadros, J.; Serrano, V.; Fadda, D.; Canivell, Y. Remote experiments for STEM education and engagement in rural schools: The case of project R3. Technol. Soc. 2023, 75, 102404. [Google Scholar] [CrossRef]
  114. Dias, A.; Gaya, A.; Brand, C.; Pizarro, A.; Fochesatto, C.; Mendes, T.; Móta, J.; Santos, M.; Gaya, A. Distance from home to the nearest park and the use of the parks for physical activity: The mediator role of road safety perception in adolescents. Public Health 2019, 168, 9–16. [Google Scholar] [CrossRef]
  115. Soltani, A.; Afshari, S.; Amiri, M.A. Human cost, machine insight: A data-driven analysis of Australian road crashes. Case Stud. Transp. Policy 2025, 20, 101440. [Google Scholar] [CrossRef]
  116. Soltani, A.; Azmoodeh, M.; Qadikolaei, M.R. Road crashes in Adelaide metropolitan region, the consequences of COVID-19. J. Transp. Health 2023, 30, 101581. [Google Scholar] [CrossRef]
  117. Soltani, A.; Mansourihanis, O.; RoohaniQadikolaei, M.; Zaroujtaghi, A. Two decades of geospatial evolution: Tracing the analytical journey towards data-driven road crash prevention. Appl. Spat. Anal. Policy 2024, 17, 1301–1334. [Google Scholar] [CrossRef]
  118. Soltani, A.; Askari, S. Analysis of intra-urban traffic accidents using spatiotemporal visualization techniques. Transp. Telecommun. 2014, 15, 227–232. [Google Scholar] [CrossRef]
  119. Soltani, A.; Harrison, J.E.; Ryder, C.; Flavel, J.; Watson, A. Police and hospital data linkage for traffic injury surveillance: A systematic review. Accid. Anal. Prev. 2024, 197, 107426. [Google Scholar] [CrossRef] [PubMed]
  120. Hosseinzadeh, A.; Karimpour, A.; Kluger, R.; Orthober, R. Data linkage for crash outcome assessment: Linking police-reported crashes, emergency response data, and trauma registry records. J. Saf. Res. 2022, 1, 21–35. [Google Scholar] [CrossRef] [PubMed]
Figure 1. Crash frequency aggregation by contour zone.
Futuretransp 05 00075 g001
Figure 2. Crash location’s proximity to specific land use transitions (A) and the shortest distance from a point to a line segment (B).
Futuretransp 05 00075 g002
Figure 3. Conceptual and procedural framework.
Futuretransp 05 00075 g003
Figure 4. Land use changes from 2011 to 2021 in GMA.
Futuretransp 05 00075 g004
Figure 5. Crash frequency of GMA based on the contour of IDW.
Futuretransp 05 00075 g005
Figure 6. Polar plots of crash frequency and distance to land use changes (this figure shows where crashes are most likely to occur in relation to the distance from specific land use changes. Each plot represents a type of land use conversion (e.g., residential to park), with warmer colors indicating more crashes. These visuals help identify “hotspots” near transitions, guiding planners to target safety improvements).
Futuretransp 05 00075 g006
Figure 7. Positive (blue) and negative (red) influence on crash frequency (this bar chart shows which land use transitions are linked to more crashes (blue bars) and which are linked to fewer (red bars). For example, converting parkland to education use tends to increase crashes, while converting water bodies to parks tends to reduce them. These insights highlight which changes may require extra safety planning).
Futuretransp 05 00075 g007
Figure 8. Conceptual diagram about Critical Distance, Threshold Distance, and the High-Risk Development Distance (HRDD).
Futuretransp 05 00075 g008
Figure 9. Crash Critical, Threshold, and High-Risk Development Distance to land use change (this figure shows how far from a land use change the crash risk remains high. The green dashed line marks where crash frequency starts increasing (Critical Distance), and the orange dashed line marks where it starts decreasing (Threshold Distance). The yellow shaded zone shows the area with the highest risk—this is where safety interventions should focus).
Futuretransp 05 00075 g009
Figure 10. Clusters of land use transitions based on crash risk distance (this figure groups land use transitions into three types based on how far crash risk extends from the change area. Transitions in the yellow group (e.g., converting parks or residential areas to commercial uses) are linked to wider zones of crash risk, meaning they require broader and earlier safety planning. The purple group has lower or more localized risk).
Futuretransp 05 00075 g010
Table 1. Descriptive statistics of the variables.
VariablesDescription RangeMeanStd. DeviationVariance
Frequency of CrashesCount of crashes based on the contour extracted from IDW65.005.245.4229.39
Agri_ResTransition from agricultural to residential14.718.341.311.71
AgriCommTransition from agricultural to commercial10.189.500.740.56
AgriEduTransition from agricultural to educational8.659.160.730.54
AgriParkTransition from agricultural to park/recreational10.768.931.011.02
ComEduTransition from commercial to educational12.088.580.920.85
ComParkTransition from commercial to park/recreational11.948.560.940.87
ComResTransition from commercial to residential 18.537.021.732.98
EduComTransition from educational to commercial 9.818.631.021.05
EduParkTransition from educational to park/recreational 9.498.600.860.74
EduResTransition from educational to residential 11.127.870.970.93
HospResTransition from hospital/healthcare to residential 10.619.231.131.28
InduParkTransition from industrial to park/recreational 8.938.770.760.57
IndusComTransition from industrial to commercial 10.878.541.091.18
IndusResTransition from industrial to residential 11.547.961.171.36
ParkComTransition from park/recreational to commercial 10.898.191.011.02
ParkEduTransition from park/recreational to educational 9.598.390.870.76
ParkResTransition from park/recreational to residential 13.297.291.101.20
ResComTransition from residential to commercial 11.587.261.171.37
ResEduTransition from residential to educational 10.087.631.021.03
ResParkTransition from residential to park/recreational 11.297.451.071.15
TransComTransition from transportation to commercial 11.109.160.990.98
TransParkTransition from transportation to park/recreational 7.758.940.980.97
TransResTransition from transportation to residential 10.848.631.121.27
WaterParkTransition from waterbody/wetland to park/recreational 11.158.980.830.70
Table 2. Results of Poisson, Negative Binomial, and quasi-Poisson models for analyzing crash frequency in relation to various land use transitions.
Frequency of CrashesPoissonNegative BinomialQuasi-Poisson
Coefficientzp > zCoefficientzp > zCoefficientzp > z
AgriRes0.023.140.000.021.320.190.010.030.98
AgriComm0.033.580.000.020.940.350.052.270.02
AgriEdu0.1313.100.000.104.260.000.208.250.00
AgriPark−0.06−7.440.00−0.04−1.940.05−0.10−5.120.00
ComEdu0.033.840.000.021.150.250.031.90.06
ComPark0.0811.80.000.063.180.000.107.510.00
EduCom0.0710.210.000.053.070.000.096.820.00
EduPark−0.03−4.590.00−0.03−1.660.10−0.04−2.600.01
EduRes0.0713.400.000.064.220.000.096.870.00
HospRes0.0814.600.000.074.290.000.19.520.00
IndusRes0.047.280.000.032.350.020.043.470.00
ParkCom0.1019.420.000.074.540.000.0913.20.00
ParkEdu0.1419.500.000.126.770.000.189.560.00
ParkRes0.0817.620.000.043.430.000.1421.010.00
ResCom0.048.520.000.054.110.000.022.360.02
ResEdu0.1017.40.000.096.150.000.139.500.00
ResPark0.012.480.010.000.040.970.043.660.00
TransCom−0.13−16.600.00−0.12−4.690.00−0.19−11.400.00
TransPark0.1213.930.000.104.520.000.136.910.00
TransRes0.056.510.000.031.690.090.125.970.00
WaterPark−0.16−23.110.00−0.16−7.460.00−0.18−14.50.00
_Cons1.9014.900.002.086.150.001.174.040.00
Frequency of crashesPoissonNegative BinomialQuasi-Poisson
Description of model index in generalized linear modelsNumber of obs = 10,947
Optimization: ML Residual df = 10,924
Scale parameter = 1
Deviance = 31,504.29 (1/df) Deviance = 2.8
Pearson = 44,451.75357 (1/df) Pearson = 4.069183
Variance function: V(u) = u [Poisson]
Link function: g(u) = ln(u) [Log]
AIC = 6.15
Log likelihood = −33,691.66
BIC = −70,097.87
Number of obs = 10,947
Optimization: ML
Residual df = 10,921
Scale parameter = 1
Deviance = 4286.70
(1/df) Deviance = 0.39
Pearson = 6877.80
(1/df) Pearson = 0.62
Variance function:V(u) = u + (1)u2 [Neg. Binomial]
Link function: g(u) = ln(u)
[Log]
AIC = 5.44
Log likelihood = −29,765.90
BIC = −97,287.56
Number of obs = 10,947
Optimization: ML
Residual df = 10,921
Scale parameter = 24.03
Deviance = 262,490.76
(1/df) Deviance = 24.03
Pearson = 262,490.76
(1/df) Pearson = 24.03541
Variance function: V(u) = 1
[Gaussian]
Link function: g(u) = ln(u)
[Log]
AIC = 6.01
Log likelihood = −32,923.25
BIC = 160,916.5
The comparative analysis of the Poisson, Negative Binomial, and quasi-Poisson models reveals important insights into the robustness and consistency of land use transition effects on crash frequency. Overall, the Negative Binomial model outperforms the others, demonstrating the best fit with the lowest AIC (5.44), lowest deviance per degree of freedom (0.39), and a superior log likelihood. This indicates that it effectively accounts for overdispersion, which is a common issue in count data such as crash frequency. The Poisson model, by contrast, assumes equal mean and variance and displays signs of overdispersion (deviance per df = 2.8), making its estimates less reliable. The quasi model also shows poor fit with an extremely high deviance (24.03), suggesting it may be mis-specified for this context.
Table 3. The comparative analysis of the Poisson, Negative Binomial, and quasi-Poisson.
ModelOverdispersion HandlingAICLog Likelihood(1/df) DevianceComments
PoissonNo6.15−33,691.662.8Assumes variance = mean, overdispersion likely
Negative BinomialYes5.44−29,765.900.39Best fit: lower AIC and deviance
Quasi-PoissonYes6.01−32,923.2524.03Poor fit: high deviance, likely mis-specified
Table 4. Summary of the findings and comparison with the literature.
Land Use ConversionCoefficientCrash Risk DescriptionSupporting StudiesCountryContradictory/Nuanced
Agri → Res0.02Sprawl without infrastructure raises crash risks[82]USA[83]: Suburban growth may reduce accidents (China)
Res → Park0.00Mixed-use without traffic calming leads to pedestrian conflict[84,85]UK[38]: Depends on park design (USA)
Park → Res0.04Increase in private cars overwhelms walkable design[73,86]Iran, Italy[86]: Zones help if planned early
Res → Com0.05Delivery vehicles and congestion increase risk[87,88]China, France[89]: Mixed use needs redesign
Agri → Park−0.04Fewer cars, walkable areas reduce crashes[90]China, Canada[77]: Risk may remain near parks in low-income areas
Indus → Res0.03Heavy-duty design unsuitable for homes[91]USA, UK[92]: Perception vs. actual risk (Portugal)
Res → Edu0.09School traffic creates morning/evening peaks[93,94,95]China[95]: Closing streets helps air, not always crashes (Poland)
Edu → Res0.06Structured traffic replaced by informal usage[96,97]USA[98]: Crime drops, crash unclear
Park → Com0.07Leisure zones turned into high-traffic areas[74,99]South Korea[100]: Still pedestrian activity → conflict (USA)
Trans → Res0.03Fast corridors turned housing cause mismatch[101,102]China[103]: Redesign helps (Israel)
Com → Park0.06Old road design remains, unsafe for leisure use[99]Spain, Republic of Korea[104]: Needs complete redesign (Mexico)
Agri → Edu0.10Rural schools lack transport infrastructure[105]EU[106]: Distance learning options (Italy)
Park → Edu0.12Students + vehicles = risk without redesign[72,107]China, BrazilWell-managed parks can be safe
Hosp → Res0.07Regulated flows lost, casual traffic increases[25,108]China, Ghana[109]: Perceived safety falls faster (Germany)
Com → Edu0.02Schoolchildren meet freight-oriented roads[110,111]USA, Italy[112]: Parents limit children’s travel (Germany)
Water → Park−0.16Remote, walkable, low traffic → safest[76]ChinaStill needs basic infrastructure in low-income areas (China)
Agri → Com0.02Rural roads strained by commercial traffic[89,113]ChinaUrbanization can help if managed well
Edu → Com0.05Shopping peaks, mismatched foot vs. vehicle flow[113,114]Spain, ChinaSome areas redesign well for shared use
Trans → Park0.10High-speed roads not redesigned, danger for walkers[77,115]Canada, BrazilRequires safety retrofitting
Trans → Com−0.12Best infrastructure fit: uses signalized arterials[47,79]Australia, ChinaStill needs pedestrian-friendly planning
Disclaimer/Publisher’s Note: The statements, opinions and data contained in all publications are solely those of the individual author(s) and contributor(s) and not of MDPI and/or the editor(s). MDPI and/or the editor(s) disclaim responsibility for any injury to people or property resulting from any ideas, methods, instructions or products referred to in the content.

