Article

Factors Associated with Travel Time Accuracy of Dynamic Message Signs for Route Choice

Civil Engineering Department, Alhussein Bin Talal University, Ma’an 71111, Jordan
*
Author to whom correspondence should be addressed.
Future Transp. 2025, 5(2), 53; https://doi.org/10.3390/futuretransp5020053
Submission received: 11 February 2025 / Revised: 25 March 2025 / Accepted: 28 March 2025 / Published: 1 May 2025

Abstract

Travel time is one of the most important pieces of information that the Dynamic Message Sign (DMS) provides to drivers. However, several variables, including traffic-related factors and DMS message characteristics, might impact the accuracy of the travel time when the DMS is used to display the travel time for alternate routes. Therefore, this study aims to look at the variables that affect the route choice’s displayed travel time accuracy as it relates to the individual driver. The accuracy of the travel time displayed on a DMS on I-75 in Saginaw, Michigan, was examined using logistic regression analysis. The results suggest that for effective traffic management for high traffic demand times (peak hour and day of the week), avoiding using travel time information displayed with other types of messages at the same time (phasing) and adapting a message update time between 2 to 3 min can improve the DMS travel time information accuracy. Practitioners and planners can use the findings to improve driver compliance with the DMS message that is being displayed.

1. Introduction

Previous studies have demonstrated the effectiveness of the Dynamic Message Sign (DMS) as a tool for managing traffic, enhancing safety, and increasing driver awareness [1,2,3,4,5]. The DMS is one of the Intelligent Transportation System (ITS) tools that provide the driver with real-time information. Typically, the DMS offers various types of information, including travel time, upcoming events, inclement weather, public announcements, and Amber alerts, in accordance with the Manual on Uniform Traffic Control Devices for Streets and Highways (MUTCD) [6].
Furthermore, the MUTCD specifies the guidelines, limitations, and prioritization for displaying messages on the DMS. One crucial piece of information that the DMS provides is the travel time for different routes, helping to alleviate congestion and reduce trip delays.
The effect of the DMS message on drivers’ compliance with alternative routes’ travel time message was the focus of several research studies. To explore how the DMS affects driver compliance and route choice diversion rates, researchers employed a combination of preference surveys, simulated settings, and field data [3,7,8,9]. Most previous research indicates that the DMS can significantly influence traffic diversion and increase driver compliance by up to 40%, depending on the message content. For instance, in Maryland, a study utilized a Bluetooth sensor to assess drivers’ compliance with the route option message displayed on DMSs [7]. The results revealed an increase in drivers’ compliance ranging from 5% to 40% when the travel time information was displayed on the DMS.
Additionally, recent research conducted in Saginaw, Michigan, found that displaying travel time information for alternative routes resulted in a 35% increase in the likelihood of diversion, depending on the difference in displayed travel times for alternative routes [10]. However, various factors related to DMS position and design, including the content, message design, color, position, and phasing, have been investigated and may influence driver compliance and preferences [1,11,12,13,14].
Simulation research was also conducted to assess the impact of DMS messages on driving behavior [14]. The results demonstrated a significant effect of incident information (such as lane closure) and delay information on the diversion rate. In addition, another study [13] examined how DMS characteristics affect driver behavior and recommended placing a DMS between 100 and 150 m away and using operational and graphic information instead of text messages. Previous research has consistently highlighted the importance of DMS confidence and reliability in increasing drivers’ compliance [14,15,16].
A study carried out in [14] aimed to assess drivers’ route-choice behavior based on DMS messages. The study involved the analysis of 497 stated preference survey responses using cumulative logistic regression. The findings revealed that the diversion rate increased as drivers’ trust in the information provided grew. Along with socioeconomic characteristics such as age, driving experience, and driving style, the level of confidence was found to be a key element that affects a driver’s compliance with a DMS message [16]. The study used both a stated preference survey and a simulated environment to assess how drivers responded and complied with the DMS messages. However, as a result, it is evident that the driver’s degree of trust and confidence plays a significant role in determining their compliance with presented DMS messages.
The accuracy of the travel time is one of the most important attributes of DMS traffic-relevant information for drivers. This importance is particularly pronounced in light of the presence of competitive alternative sources, including smartphones and in-car navigation systems. As a result, inaccurate DMS travel time information may encourage drivers to use these other sources of information that are associated with higher levels of distraction, raising the risk of being involved in crash [17,18]. However, even though most of the literature depicts the DMS as a practical tool that gives drivers travel time information [19,20], the effectiveness of the DMS in displaying accurate travel times can vary significantly depending on traffic conditions, including congestion and sensor allocation issues [19]. On the other hand, DMS-related factors can also have an impact on the displayed travel time accuracy, but such factors have not been explored previously. Therefore, the objective of this study is to investigate the factors that influence the DMS travel time accuracy for the route choices. Different traffic-related and DMS-related aspects were examined concerning DMS travel time accuracy by using both displayed DMS travel times and Bluetooth sensors’ travel times.

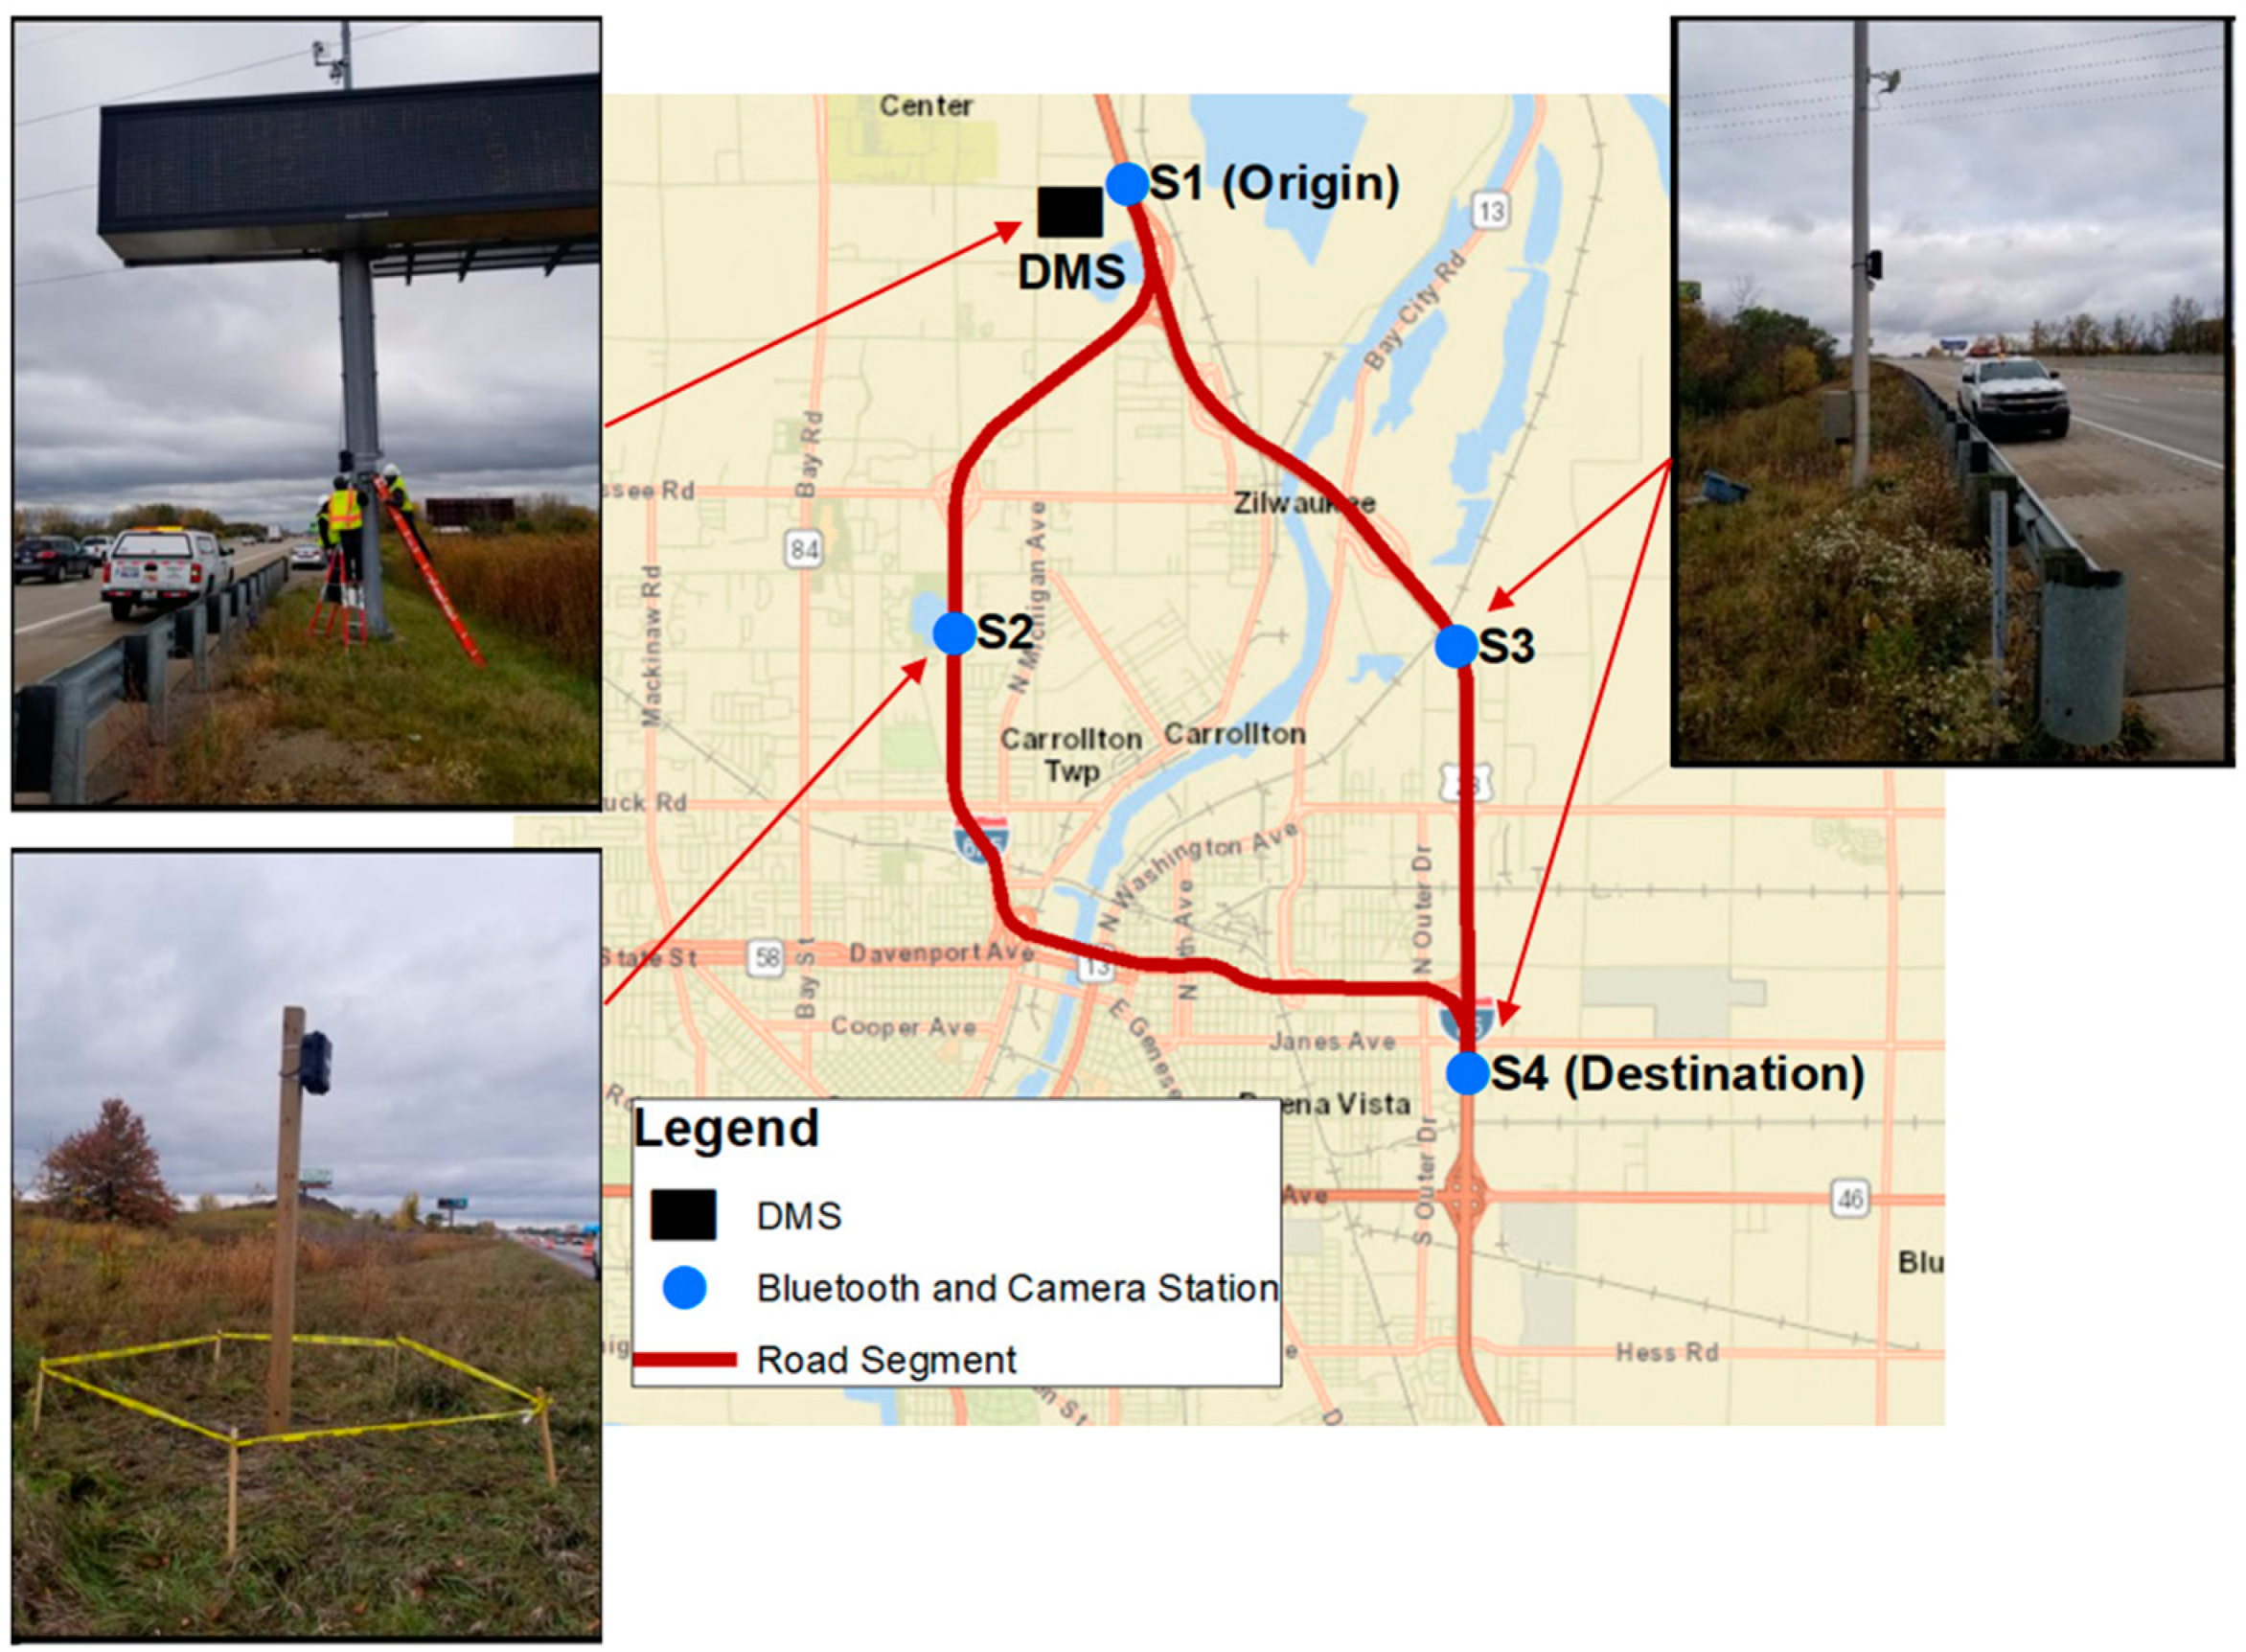
2. Experimental Setup
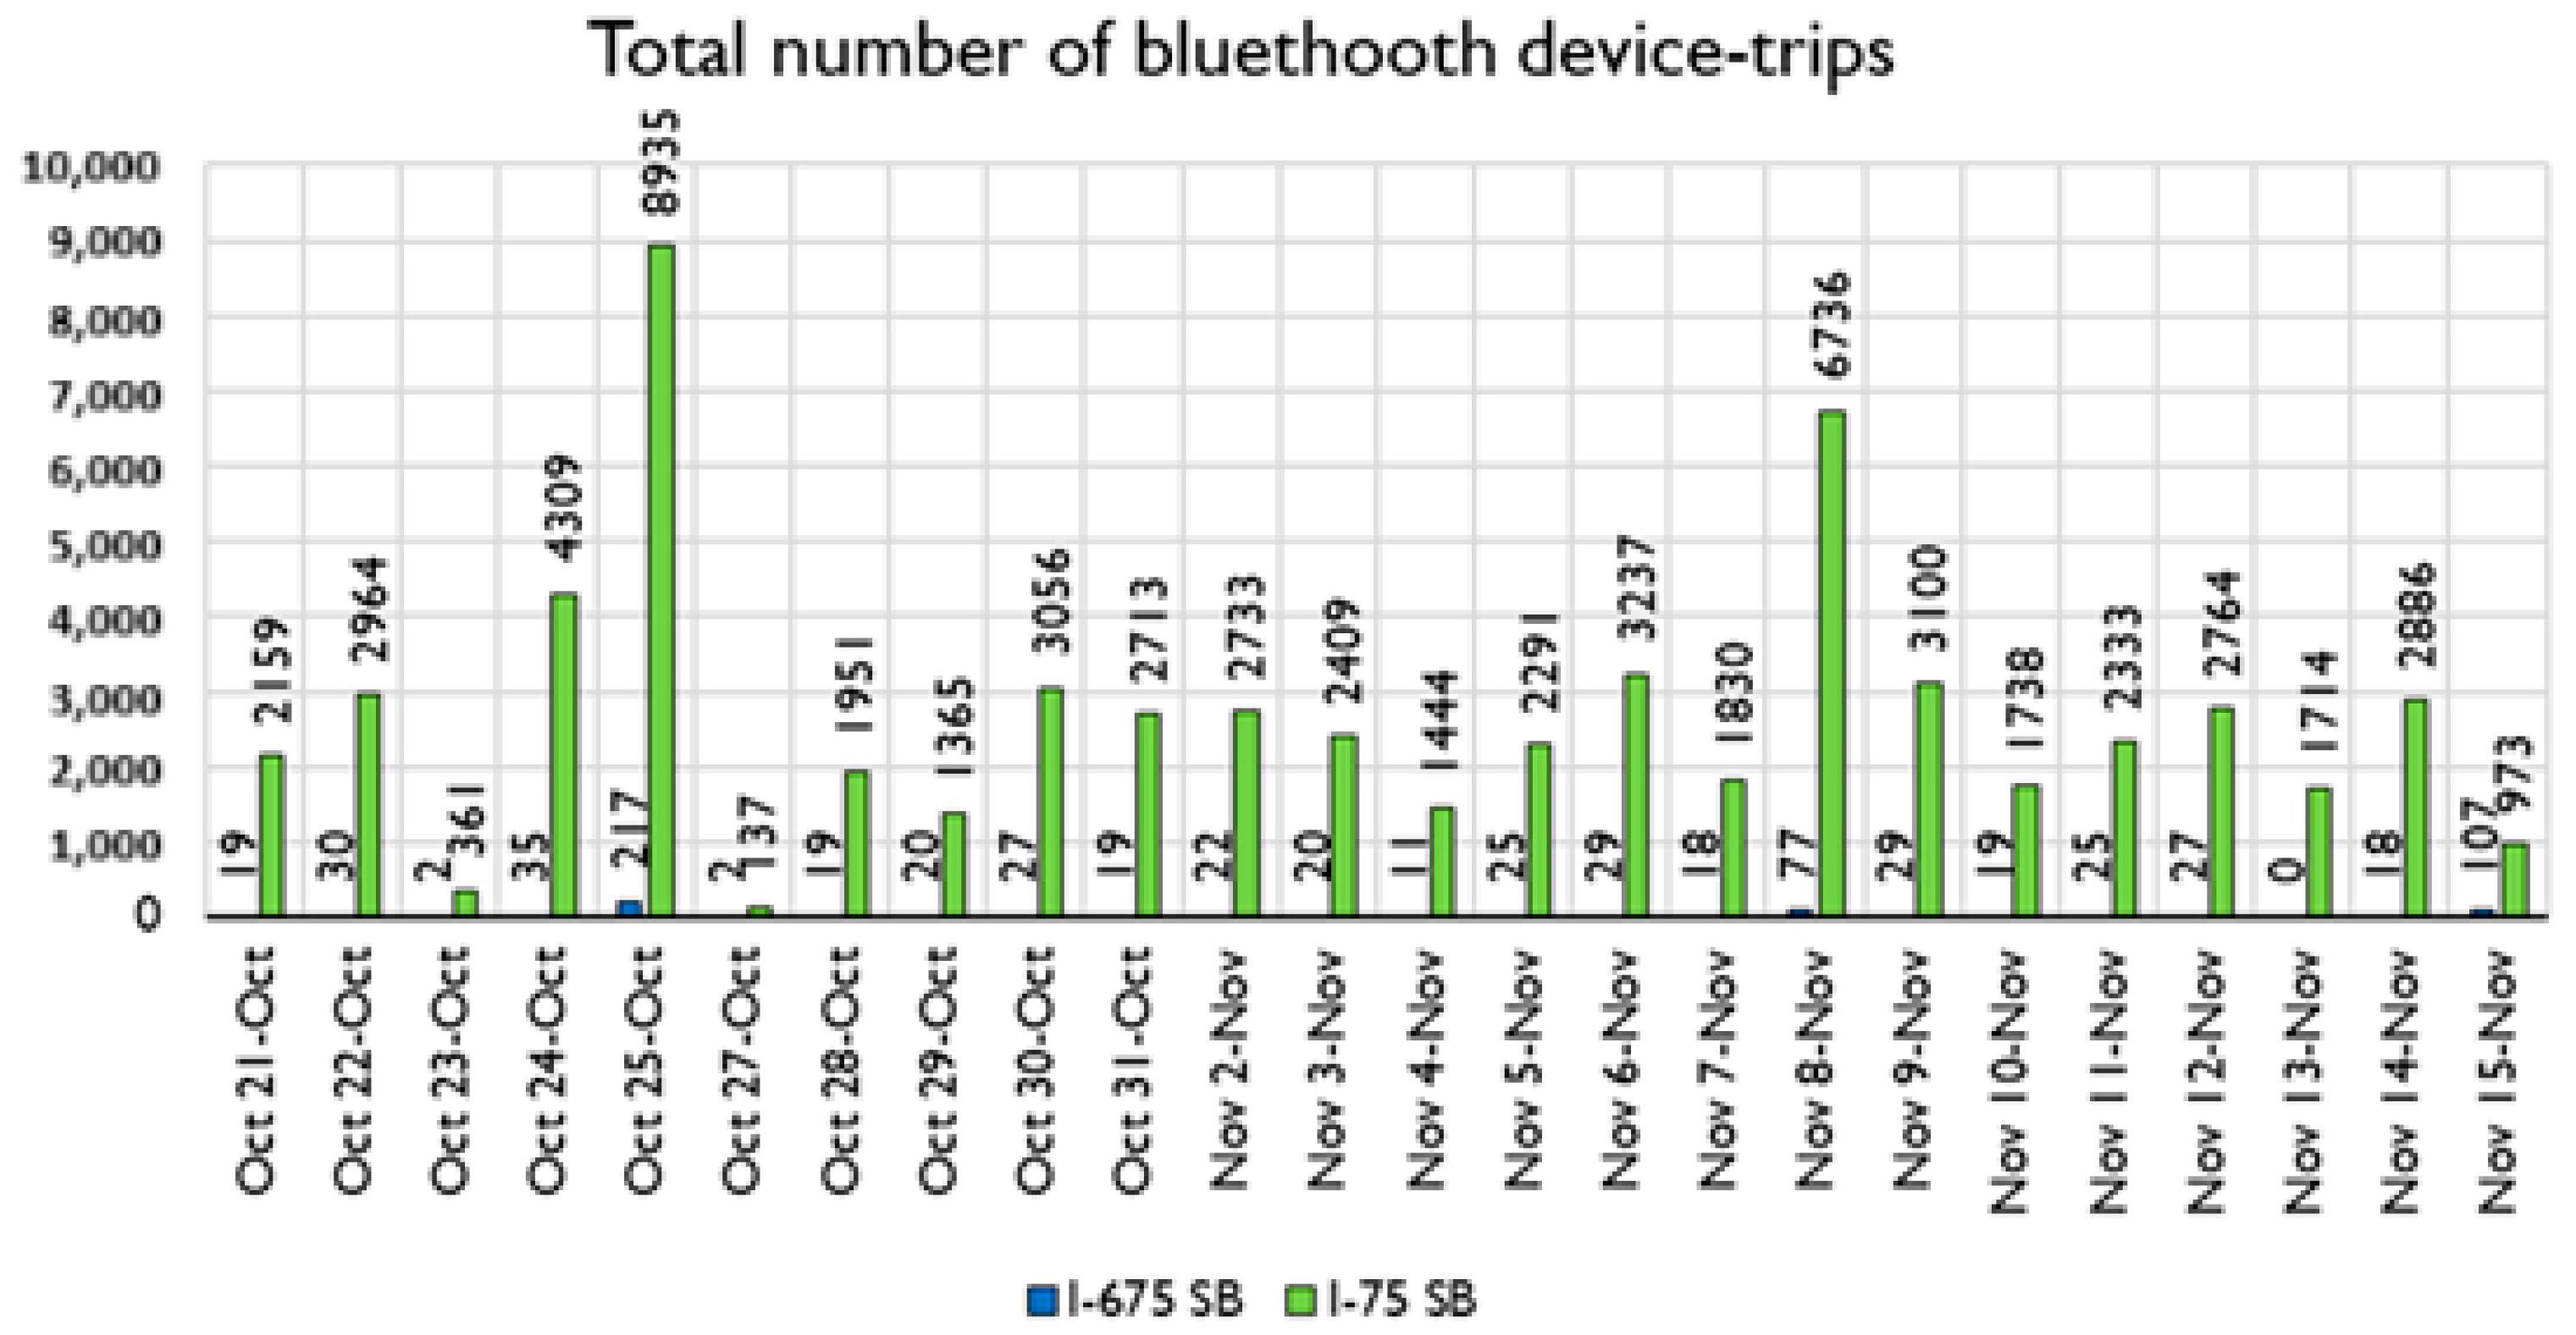
The Michigan Department of Transportation (MDOT) provided various Dynamic Message Sign (DMS) locations for analysis, and the team selected the one located on I-75 in Saginaw, Michigan. Since the purpose of this study was to investigate the factors affecting the accuracy of travel time, the selected location was the only valid location with a route choice option and limited access points along both routes. The selected DMS shows the M-46 destination travel time along the I-75 direct route, which includes a three-lane, seven-mile-long section, as well as the I-675 indirect route, which is 9.3 miles long with two lanes. A typical message on the DMS states “TIME TO M-46, VIA I-75: 6 MIN, VIA I-675: 8 MIN”. This clear communication provides real-time estimates for travel durations on both routes, assisting travelers in making informed decisions.
Figure 1 displays the chosen location with the selected DMS, the alternative routes, and the desired destination. Bluetooth sensors and cameras were used to track each vehicle individually to record each vehicle that completed the trip utilizing either the I-75 or I-675 route that correspond to DMS messages. Therefore, sensor No. 1 was installed on the DMS pole, which displays the travel time information for southbound. In order to allocate the DMS travel time to a vehicle depending on the route that was traveled, sensors No. 2 and No. 3 were employed on the direct route (I-75) and alternative route (I-675) accordingly. Finally, to ensure that the vehicle made it to the destination (M-46), sensor No. 4 was put there. The field data were collected for four weeks (Wednesday, 21 October 2020–Sunday, 15 November 2020) to assess the variables associated with the displayed DMS travel time information. All messages posted throughout the research period were recorded by MDOT. The timestamp for when a particular message was shown was recorded in the logs. For study purposes, travel time messages displayed on the DMS were collected as this study attempted to analyze the accuracy of travel time messages.

3. Data Description

Traffic volume data, Bluetooth sensor data, and DMS data were used to determine the accuracy of the travel time presented on the route-choice DMS. A Continuous Count Station (CCS) located at the DMS position was used to record the traffic moving toward the diversion point. This information is utilized to identify the degree of traffic congestion volume and peak periods. Figure 2 shows a sample of the amount of traffic during the research period. According to the figure, the morning peak was between 7:00 and 9:00 as can be seen in Figure 2, and the evening peak was between 2:00 and 4:00 in the afternoon.
For the travel time and route information, a Bluetooth sensor was used to determine each vehicle’s route using Bluetooth devices at each node captured by the sensors (1–4). Each Bluetooth sensor typically keeps track of the route of the Bluetooth devices by recording the time stamp and an identifier that is specific to that device. The vehicle path and travel duration were then calculated using the unique identifier by connecting the sensors on the routes. Figure 3 shows the daily distribution of detected devices for the southbound during the data collecting period. According to the graph, more devices were found during the weekend than during the weekday.
The displayed DMS messages during the experiment were provided when the field research was finished by MDOT, and each route’s displayed travel time information was extracted. Every message had a timestamp that indicated when it was first shown and when it was stopped. Typically, a new timestamp was created whenever a message was changed on the display; otherwise, the message would remain on the DMS continually until the next timestamp. The travel time, which was updated in real-time based on GPS-equipped vehicles, was the prime factor of the DMS message for this research that caused the difference. The DMS record shows almost no variation in the displayed travel times for the two routes since, most of the time, the direct route (I-75) was faster than the alternative route (I-675). The only time difference that was seen was on an hourly basis was when an event occurred on the straight route and increased travel time.
The factors that were examined to determine how using the DMS for route choice affects the accuracy of the displayed travel time information are summarized in Table 1. Several factors related to the traffic condition and DMS message characteristics were investigated. The difference between the displayed travel time and the travel time from Bluetooth sensors for each vehicle was computed and considered as a response variable in the model to show the accuracy of the DMS travel time. The statistics demonstrate that the DMS travel time was generally correct (more than 80 percent). In addition, factors that are related to the traffic conditions such as the volume, peak hours, travel speed, and the day of week for each vehicle (fingerprint) were determined. The data modeling considered the DMS characteristics, including the existence of phasing and the message update time, and the time difference between alternate routes. It should be noted that only the vehicles that finished the trip were considered when the data were prepared. Additionally, vehicles that left the routes and then rejoined were excluded. The travel time information from the sensor data enabled the identification of specific vehicles as outliers. These outliers were determined by excluding values that exceeded the upper quartile within the interquartile range.
Table 1 displays the variables included in the statistical model to assess the accuracy of travel time presented by Dynamic Message Signs (DMSs). The accuracy variable, signifying the concordance between DMS travel time and actual time (where the accuracy = 1, the time difference is 0), was utilized as the response variable indicating the accuracy of the DMS travel time. Variables related to traffic, such as whether the driver operates during peak hours and the traffic volume at Dynamic Message Signs (DMSs) heading towards the diversion point, were included to evaluate the impact of traffic volume on travel time accuracy. Additionally, the driver’s compliance with the speed limit, influencing the perception of displayed time accuracy, was taken into account by introducing a binary variable indicating whether the driver was exceeding the speed limit or not. On the other hand, attributes related to Dynamic Message Signs (DMSs), such as phasing, time elapsed since the last update, and the time difference for the displayed message, were incorporated. These attributes describe the specific conditions of the DMS during the driver’s interaction with it. The binary phasing variable signifies whether the displayed travel time information on the DMS was presented alongside an alternate message such as weather-related and Amber messages simultaneously, potentially influencing the drivers’ ability to read the DMS message. The update time, demonstrating the elapsed duration since the DMS travel time was altered, may affect the stability of traffic on alternative routes. Lastly, an investigation into the time difference in travel time for the displayed DMS message was conducted to assess whether alterations in this difference would impact the accuracy of DMS travel time from the driver’s standpoint.

4. Methodology

This study aims to look into the variables that affect DMS travel time accuracy at the route options location. To determine whether there is a significant difference between the displayed travel times for the routes on the DMS and the actual travel times determined by Bluetooth sensors, a non-parametric Wilcoxon signed-rank test was used. When the difference distribution is not normal, this test is typically employed to measure the difference between two paired groups [21]. The influence of several parameters on the DMS accuracy was then associated using logistic regression. The difference between the displayed travel time and the actual one served as the basis for the accuracy response variable. The response variable was coded as 1 if the DMS travel time matches the rounded travel time since the DMS displays integer values; otherwise, it was treated as 0. As a result, logistic regression is appropriate to establish a relationship between the predictors and the response variable because the response variable is binary. With its capacity to give odds or a likelihood ratio between an event occurring (1) or not (0), logistic regression was frequently employed in research related to traffic and safety. The following is how the logistic regression can be expressed:
log i t ( D M S   A c c u r a c y = 1 ) = log ( P 1 P ) = β 0 + β 1 X 1 + β 2 X 2 + + β n X n
where the P is the probability of DMS travel time being accurate, X is the independent variables vector, and β is the estimated coefficient associated with the independent variable. Commonly, the logistic model is interpreted by an odds ratio, which means that by increasing the independent variable by one unit while the other independent variable remains constant, the odds increase by e^β. Therefore, if the odds ratio is less than 1, the odds of the DMS being accurate decrease by increasing the independent variable by one unit and vice versa.
Furthermore, following the identification of the factors associated with DMS accuracy using logistic regression, a random forest algorithm for machine learning was computed to assess the relative importance of variables. Because of its capacity to accommodate feature interactions and non-linearity, random forest is regarded as one of the integration techniques that perform classification and regression tasks. To avoid model overfitting and increase its accuracy, random forest algorithms form numerous decision trees during the training phase and make model estimate predictions. Random forest has a lower risk of overfitting and outlier impact than a single decision tree because it employs an ensemble of multiple trees instead of just one. Moreover, the random forest algorithm can determine independent variables’ rank regarding their contribution to classification outcomes. The variables’ rank is estimated by quantifying the reduction in misclassification by each variable across training trees, which is commonly known as the Mean Decrease in Impurity (Gini Importance). The following mathematical equation expresses variables important in the random forest algorithm:
F ( X i ) = n N Δ E n
where N refers to each of a tree’s nodes in a random forest algorithm with X i   used to split the node, and Δ E n denotes the drop in the misclassification error at node n. Therefore, the importance of the variable is equivalent to the overall reduction in misclassification errors in all trees.

5. Results and Discussion

This study makes an effort to look at the accuracy of DMS travel times for route choice. The overall accuracy of the DMS for this case study was compared using the Wilcoxon test to see if there was a significant difference between displayed travel time and actual travel time. The Wilcoxon non-parametric test findings show a significant difference where the displayed travel time is less than the actual travel time with an error percentage of 5.25 percent, rejecting the null hypothesis of no significant difference (z = 46.2, p < 0.000). This outcome is consistent with the earlier study, which showed that it was within the acceptable FHWA limit (20%) [22]. The majority of the literature identifies sensor spacing and efficiency as the primary causes of this error [19,23].
The results of the logistic regression are shown in Table 2. The coefficient shows the likelihood that the DMS will be accurate when the rest of the factors are in control. For the traffic-related factors, even though the model shows no significant effect of traffic volume on the DMS accuracy, the model estimate indicates a positive association between the DMS accuracy and the traffic volume at the DMS. A majority of the previous research studies suggest that there is a considerable effect of traffic volume on DMS systems, notably under work zone conditions where there is a high prevalence of lane changing and merging [24]. Regarding the peak hour factor, DMS accuracy drops considerably throughout peak hours. This accords with the previous literature such as [19], which noted that peak hours were associated with DMS accuracy. The traffic volume corresponding with peak hours may be used to explain why the morning and evening peak hours are less likely to be associated with an accurate DMS travel time compared to off-peak hours. This could be associated with the fact that more people seem to want to avoid using the DMS during peak hours when the volume of traffic at the junction increases and it is hard for them to read the DMS messages due to congestion which leads to a fluctuating and unstable travel time due to a volume change which takes time to be displayed at the DMS. The weekend variable is associated with a 71.4 percent increase in the probability of the DMS being correct compared to the weekday. One potential explanation is that since this type of sign is usually used on the freeway, the traffic demand volume and congestion would be lower on the weekend compared to the weekday [25,26,27]. As a result, there is a high probability that travel time accuracy can be achieved on an individual level under prevailing traffic conditions. When a driver travels at a speed greater than 75 mph, the model findings reveal a decrease in the likelihood of DMS accuracy of approximately 46 percent. This anticipated outcome can be attributed to the inverse relationship between speed and time at a constant distance, in which a significant discrepancy from the displayed time is connected to an increase in speed of more than 75 mph. Although speed is determined to be a significant factor in the individual DMS travel time accuracy, it also affects the overall travel time accuracy since the presence of more people traveling at a high pace persuades other people to do the same. On the other hand, the model also demonstrates that DMS accuracy is significantly impacted by messages with an alternate display (phase) in terms of DMS message characteristics. The findings illustrate that if the displayed message is associated with phasing compared to the message without phasing, the displayed travel time is 86.5 percent less likely to be accurate. This outcome is consistent with the literature, suggesting that phasing has a detrimental effect on driver compliance and behavior [10,28,29]. The majority of responses to a recent stated preference questionnaire administered to quantify the effectiveness of the DMS on Michigan’s freeway [10] indicate the phasing as a vital factor in comprehending and understanding the presented DMS message. To link the DMS phasing time and the DMS message readability, the authors also ran a simulation lab experiment with 26 people. The findings show that driving experience on highways and speed substantially influence the legibility of DMS messages with various phasing lengths (2.5 s and 4 s). For this study, the presence of phasing on the DMS as the driver approaches the junction may cause difficulty in trying to read the DMS message in a short time, making them choose an undesirable path, which may exacerbate the traffic conditions on both alternate routes. Overall, the model indicates that the message update time has a considerable influence. The model shows the link between the time interval between the message update time and the time that the driver passes the DMS as an important factor. If the DMS travel time information has been updated for 1 to 2 min as compared to less than 1 min, the probability that it is correct rises by 2.76 times. With an increase in accuracy of 3.16 times over the base scenario (less than 1 min), the update interval of 2–3 min has the highest accuracy likelihood. Finally, the probability that the DMS will be correct increases when the update time for the displayed travel time information is greater than 3 min compared to the base scenario, while decreasing by 9% when it is compared to the 2 to 3 min scenario. This phenomenon may be explained by the fact that if the DMS travel time information is updated quickly, it will result in significant fluctuations on the alternate routes and will reduce the likelihood that individual drivers would obtain the expected travel time. However, because traffic conditions on other routes are dynamic, a longer update time can also reduce the possibility that the displayed travel time will be correct. This is because the longer update time will not be sensitive enough to the changing traffic conditions. As a result, an optimum update time is necessary to ensure the highest likelihood of the DMS travel time being accurate while not causing an increase in traffic fluctuations on the routes and also providing an accurate travel time in response to changing traffic conditions. This finding may serve to highlight the important role that the DMS’s sensitivity (message updating) to changes in travel time may play in improving the accuracy of travel time information. Similarly, research that used a fuzzy logic system on the DMS and classified message display times (Short, Medium, Long, and Very Long) in Kuala Lampur showed that the efficacy of the DMS might be improved [23].
The model shows that the displayed travel time difference between the alternate routes significantly affects the accuracy of the travel time information. The results show that when the difference between the displayed travel time and the DMS travel time increases, so does its accuracy. In the case of a high difference, the driver’s decision would be to take the route with a lower travel time [17]. This may improve the alternate routes’ stability, which in turn may stabilize the travel time that is displayed. However, it should be noted that the direct route was faster for most of the study period. Therefore, the driver will probably take the direct route, which maintains constant traffic and eliminates the effect of the diverted vehicle based on the difference in the displayed travel time.
Figure 4 shows the importance of the modeled factors that impact the time accuracy of the DMS. Traffic volume was observed as an important feature in predicting the time accuracy of the DMS followed by the update time and time difference between messages, which can be considered top contributing factors. This can be explained by the impact of these factors on the diversion rate for both routes and how they affect the travel time for each route. On the other hand, peak hour and phasing were the least effective and least important features in contributing to DMS travel time accuracy, which can be related to the rare occurrence of these variables in the dataset.

6. Conclusions

This study aims to look at the variables affecting the accuracy of the DMS travel time information for route choice. The overall results of the logistic regression analysis show that traffic-related factors such as peak hours, driver speed, and day of the week have a substantial impact. This study emphasizes that the accuracy of the DMS travel time would improve driver compliance with the DMS message for route choice. This may be accomplished by managing and paying closer attention to the periods of high traffic demand (peak hours and weekdays). Law enforcement within the DMS area can improve the DMS accuracy on an individual level by regulating traffic and enforcing speed limits. On the other hand, this study found a strong correlation between DMS message characteristics and the accuracy of the displayed travel time. In particular, this study demonstrates that reducing travel time information, in association with other information (phasing), and maintaining an update time for the DMS message can improve the accuracy of the DMS travel time for route choice. This study also suggests increasing the DMS travel time accuracy by employing more advanced technology to control the displayed travel time based on the conditions of the route.
Despite the effectiveness of the Bluetooth technique in analyzing the impact of the DMS’s travel time information, the technology has some limitations. For example, the Bluetooth sensor only captures a subset of drivers with Bluetooth-enabled devices inside the vehicles. Furthermore, if the vehicle carries more than one Bluetooth device, and a sensor recognizes it based on fingerprint, it will be recorded as multiple trips rather than one. On the other hand, based on the selected DMS, there was no variation in travel time between the alternative routes. Therefore, future studies can investigate DMS accuracy in route choice cases with considerable variation. As a result, the findings of this study can help the planners to optimize the DMS benefits and driver compliance toward the displayed DMS message.

Author Contributions

Conceptualization, M.A.; Formal analysis, M.A.; Software, M.A.; Validation, F.A.; Visualization, F.A.; Writing—original draft, M.A.; Writing—review and editing, F.A. All authors have read and agreed to the published version of the manuscript.

Funding

This research was funded by Michigan Department of Transportation grant number 2019-0313/Z1.

Institutional Review Board Statement

Not applicable.

Informed Consent Statement

Not applicable.

Data Availability Statement

Restrictions apply to the availability of these data. Data were obtained from MDOT and are available from the authors with the permission of MDOT.

Conflicts of Interest

The authors declare no conflicts of interest.

References

  1. Du, J.; Ren, G.; Cui, J.; Liu, W.; Ma, J.; Wu, C.; Cao, Q. Validity of Variable Message Sign Information: Is It Influenced by Drivers’ Short-Term Memory? Transp. Res. Rec. 2023, 2677, 107–123. [Google Scholar] [CrossRef]
  2. Mahmud, M.S.; Bamney, A.; Johari, M.U.M.; Jashami, H.; Gates, T.J.; Savolainen, P.T. Evaluating Driver Response to a Dynamic Speed Feedback Sign at Rural Highway Curves. Transp. Res. Rec. 2023, 2677, 1103–1114. [Google Scholar] [CrossRef]
  3. Shealy, T.; Kryschtal, P.; Assistant, G.R.; Franczek, K.; Katz, B.J. Driver Response to Dynamic Message Sign Safety Campaign Messages Vice President of Engineering toXcel, LLC Final Report VTRC 20-R16. Available online: https://vtrc.virginia.gov/media/vtrc/vtrc-pdf/vtrc-pdf/20-R16.pdf (accessed on 1 February 2025).
  4. Alhomaidat, F.; Hasan, R.A.; Hanandeh, S.; Alhajyaseen, W. Using a Driving Simulator to Study the Effect of Crash Fact Signs on Speeding Behavior along Freeways. Int. J. Inj. Control Saf. Promot. 2023, 30, 15–25. [Google Scholar] [CrossRef] [PubMed]
  5. Alhomaidat, F.A. Impacts of Freeway Speed Limit on Safety and Operation Speed of Adjacent Arterial Roads; Western Michigan University: Kalamazoo, MI, USA, 2019. [Google Scholar]
  6. U.S. Department of Transportation, Federal Highway Administration. Manual on Uniform Traffic Control Devices for Streets and Highways; U.S. Government Printing Office: Washington, DC, USA, 2012.
  7. Jeihani, M.; Ardeshiri, A. Exploring Travelers’ Behavior in Response to Dynamic Message Signs (DMS) Using a Driving Simulator; State Highway Administration, Office of Policy & Research: Baltimore, MD, USA, 2013; 47p. [Google Scholar]
  8. Xu, C.; Wu, Y.; Rong, J.; Peng, Z. A Driving Simulation Study to Investigate the Information Threshold of Graphical Variable Message Signs Based on Visual Perception Characteristics of Drivers. Transp. Res. Part F Traffic Psychol. Behav. 2020, 74, 198–211. [Google Scholar] [CrossRef]
  9. Zhao, W.; Quddus, M.; Huang, H.; Lee, J.; Ma, Z. Analyzing Drivers’ Preferences and Choices for the Content and Format of Variable Message Signs (VMS). Transp. Res. Part C Emerg. Technol. 2019, 100, 1–14. [Google Scholar] [CrossRef]
  10. Kwigizile, V.; Oh, J.; Van Houten, R.; Lee, K.; Kwayu, K.; Abushattal, M.; Mwende, S.; Lyimo, S. Quantifying Effectiveness and Impacts of Digital Message Signs on Traffic Flow; Michigan Department of Transportation (MDOT): Detroit, MI, USA, 2022.
  11. Guattari, C.; De Blasiis, M.R.; Calvi, A. The Effectiveness of Variable Message Signs Information: A Driving Simulation Study. Procedia Soc. Behav. Sci. 2012, 53, 692–702. [Google Scholar] [CrossRef]
  12. Ullman, B.R.; Ullman, G.L.; Dudek, C.L.; Williams, A.A. Driver Understanding of Messages Displayed on Sequential Signs; Texas Transportation Institute: Bryan, TX, USA, 2007. [Google Scholar]
  13. Yan, X.; Wu, J. Effectiveness of Variable Message Signs on Driving Behavior Based on a Driving Simulation Experiment. Discret. Dyn. Nat. Soc. 2014, 2014, 206805. [Google Scholar] [CrossRef]
  14. Yuanfeng, Z.; Jianping, W. The Research on Drivers’ Route Choice Behavior in the Presence of Dynamic Traffic Information. In Proceedings of the IEEE Conference on Intelligent Transportation Systems, ITSC Toronto, ON, Canada, 17–20 September 2006; pp. 1304–1309. [Google Scholar] [CrossRef]
  15. Bonsall, P.W.; Joint, M. Driver Compliance with Route Guidance Advice: The Evidence and Its Implications. In Proceedings of the Vehicle Navigation and Information Systems Conference, Troy, MI, USA, 20–23 October 1991; p. 912733. [Google Scholar] [CrossRef]
  16. Zhong, S.; Zhou, L.; Ma, S.; Jia, N. Effects of Different Factors on Drivers’ Guidance Compliance Behaviors under Road Condition Information Shown on VMS. Transp. Res. Part A Policy Pract. 2012, 46, 1490–1505. [Google Scholar] [CrossRef]
  17. Asbridge, M.; Brubacher, J.R.; Chan, H. Accidents and Violence: Cell Phone Use and Traffic Crash Risk: A Culpability Analysis. Int. J. Epidemiol. 2013, 42, 259–267. [Google Scholar] [CrossRef] [PubMed]
  18. Overton, T.L.; Rives, T.E.; Hecht, C.; Shafi, S.; Gandhi, R.R. Distracted Driving: Prevalence, Problems, and Prevention. Int. J. Inj. Control Saf. Promot. 2015, 22, 187–192. [Google Scholar] [CrossRef] [PubMed]
  19. Monsere, C.M.; Breakstone, A.; Bertini, R.L.; Deeter, D.; McGill, G. Freeway Travel Time Messages with Ground Truth Geospatial Data. J. Transp. Res. Board 2006, 1959, 19–27. [Google Scholar] [CrossRef]
  20. Haghani, A.; Hamedi, M.; Fish, R.L.; Norouzi, A. Evaluation of Dynamic Message Signs and Their Potential Impact on Traffic Flow; State Highway Administration, Office of Policy & Research: Baltimore, MD, USA, 2013. [Google Scholar]
  21. Bulletin, B. Individual Comparisons by Ranking Methods. Int. Biometr. Soc. 2012, 1, 80–83. Available online: http://www.jstor.org/stable/3001968 (accessed on 1 February 2025).
  22. Tufte, K.; Kothuri, S. Assessment and Refinement of Real-Time Travel Time Algorithms for Use in Practice; OTREC-RR-08-02; Transportation Research and Education Center (TREC), Portland State University: Portland, OR, USA, 2008. [Google Scholar]
  23. Bertini, R.L.; Lovell, D.J. Impacts of Sensor Spacing on Accurate Freeway Travel Time Estimation for Traveler Information. J. Intell. Transp. Syst. 2009, 13, 97–110. [Google Scholar] [CrossRef]
  24. Weaver, S.; Arnold, M.; Gonzalez, T.; Balk, S. The Dynamic Merge: Using Traffic Volume-Based Signing to Improve Workzone Throughput. In Driving Assessment Conference; University of Iowa: Iowa, IA, USA, 2019; Volume 10. [Google Scholar]
  25. Godoi, F.C.; Prakash, S.; Bhandari, B.R. Review of 3D Printing and Potential Red Meat Applications; Final Report; Meat and Livestock Australia Limited: North Sydney, NSW, Australia, 2021; pp. 1–61. [Google Scholar]
  26. Alhomaidat, F.; Kwigizile, V.; Oh, J.S.; Van Houten, R. How Does an Increased Freeway Speed Limit Influence the Frequency of Crashes on Adjacent Roads? Accid. Anal. Prev. 2020, 136, 105433. [Google Scholar] [CrossRef] [PubMed]
  27. Alhomaidat, F.; Abushattal, M.; Kwayu, K.M.; Kwigizile, V. Investigating the Interaction between Age and Liability for Crashes at Stop-Sign-Controlled Intersections. Transp. Res. Interdiscip. Perspect. 2022, 14, 100612. [Google Scholar] [CrossRef]
  28. Dudek, C.L.; Ullman, G.L. Flashing Messages, Flashing Lines, and Alternating One Line on Changeable Message Signs. Transp. Res. Rec. 2002, 1803, 94–101. [Google Scholar] [CrossRef]
  29. Guerrier, J.; Wachtel, J.A. A Simulator Study of Driver Response to Changeable Message Signs of Differing Message Length and Format. In Proceedings of the First International Driving Symposium on Human Factors in Driver Assessment, Training, and Vehicle Design, Aspen, CO, USA, 14–17 August 2001; pp. 164–171. [Google Scholar]
Figure 1. Sensor mounting locations (base map credit: Google.com).
Futuretransp 05 00053 g001
Figure 2. Hourly volume distribution at I-75 SB for October 2020.
Futuretransp 05 00053 g002
Figure 3. Number of daily device trips for the southbound traffic.
Futuretransp 05 00053 g003
Figure 4. Feature importance in Random Forest for predicting DMS accuracy.
Futuretransp 05 00053 g004
Table 1. Descriptive summary of the variables used in the model.
VariableDescriptionCategoryMeanStd. Dev.MinMax
AccuracyDisplayed travel time–measured travel time = 01 = Yes
0 = No
0.8270.37901
VolumeTraffic volume at DMS location (in 100 veh)Count24.32511.2311.0549.37
Peak HourDriving in traffic peak hour (hour 07:00–09:00 h/14:00–16:00 h)1 = Yes
0 = No
0.3700.48301
SpeedTravel speed more than 75 mph1 = Yes
0 = No
0.0890.28701
PhasingThe message has at least one phase1 = Yes
0 = No
0.0010.03301
WeekendDrive on a weekend day (Saturday and Sunday)1 = Yes
0 = No
0.6520.47601
Time Since UpdateTime since last message updateLess than 1 min0.4650.27800.9
1–2 min0.7630.28711.9
2–3 min1.2560.29922.9
>3 min9.8068.1363664.8
Time difference(I-675) travel time–(I-75) travel timeInteger1.2860.45403
Table 2. Model results from logistic regression.
VariableOdds RatioStd. Err.p > zConfidence Interval
Volume1.0030.0020.1820.9991.001
Peak Hour0.8770.0340.0010.8130.946
Speed0.5400.0310.0000.4820.605
Phasing0.1350.0680.0000.0500.364
Weekend1.7140.0840.0001.5571.887
Time since update
1–2 min2.7650.2030.0002.3943.193
2–3 min3.1660.2530.0002.7073.704
>3 min3.0760.1480.0002.7993.379
Time difference1.1200.0470.0071.0321.217
Disclaimer/Publisher’s Note: The statements, opinions and data contained in all publications are solely those of the individual author(s) and contributor(s) and not of MDPI and/or the editor(s). MDPI and/or the editor(s) disclaim responsibility for any injury to people or property resulting from any ideas, methods, instructions or products referred to in the content.

