1. Introduction
Traditional collective transport services have so far been unable to support a sustainability-focused transition, especially in areas without a heavy trip demand [
1]. Usually, public transportation, when available, often fails to meet the diverse needs of residents due to fixed routes and schedules. A flexible public transport framework is considered a game-changer in car-dependent peri-urban and rural areas. Flexible public transport aims to address this all-increasing demand for mobility by seeking to match the supply of available public transport routes to the fluctuating demand for transport [
2]. It is an environmentally friendly solution, operating only when needed, and as a mass transport solution, it is more economical than private transportation. A flexible bus is an accessible mode of transport that adapts to user needs, especially providing a mobility solution to persons with reduced mobility. In other words, flexibility can also mean adaptability, and this adaptability is particularly crucial in areas where public transport infrastructure is underdeveloped, as it provides a cost-effective and responsive alternative to car ownership. A recent report by Frost and Sullivan [
3] predicts flexible bus shuttles will account for 50% of the shared mobility market by 2030. They forecast market growth starting from USD 2.8 billion in 2017 to USD 551.61 billion in 2030 and an increase in fleet size from 24,100 units to 5.8 million by the end of 2030.
Demand Responsive Transport, or DRT, is a more specific term that is widely used. DRT “is a user-oriented form of passenger transport characterized by flexible routes and smaller vehicles operating in shared-ride mode between pick-up and drop-off locations, according to passenger needs” [
4]. DRT could also be defined as an intermediate form of transport, somewhere between bus and taxi, that covers a broad spectrum of transport services from less formal community transport to area-wide service networks [
5]. Furthermore, a DRT service is a public transportation service in which users have to book their trip in advance [
6]. Enoch et al. [
7] categorized DRT services into four categories: (a) interchange DRT, which provides feeder services to conventional public transport; (b) network DRT, which provides additional services or replaces uneconomic services; (c) destination-specific DRT, that serves particular destinations; and (d) substitute DRT, which replaces, completely or substantially, conventional bus services.
In recent years, various cities have experimented with flexible bus services. Helsinki’s ‘Kutsuplus’ pilot from 2012–2015 showcased an automated DRT system integrating taxis and ride-sharing with features like SMS hailing and virtual bus stops. Despite reaching 100,000 annual trips, it ended due to capacity and vehicle availability issues [
8]. Conversely, Kansas’s DRT shuttle bus pilot in the US anticipated 200 trips daily but achieved only 597 in six months, making each trip cost nearly USD 1000 [
9]. The FLEX system in Santa Clara Valley in 2016 underscored the significance of DRT algorithms. Although improvements were made, the service ceased after six months due to challenges like vehicle availability, geographic limits, and unionized staffing issues [
10]. The list of DRT service implementations is ever-growing, and experience from other projects directs the research focus of investigating the launch of a DRT service toward a thorough understanding of the characteristics of the environment, the users, and the DRT system itself before proceeding to design a service that will be successful.
Certain relevant studies encountered in the existing literature have demonstrated the following insights: Initially, Davison et al. [
11] determined that the most significant factors for employing an on-demand system are the availability of vehicles and the number of seats, namely functional characteristics. Koning and Grippenkoven [
12] revealed that the operational conditions and efficiency of the service constitute the most crucial factors for adopting such a service. Research conducted by Torrisi et al. [
13] elucidated that the significant determinants for selecting an on-demand service are affordable pricing, i.e., cost, high frequencies, and adequate information. On the same page, the work of Campisi et al. [
14] concluded that the most pivotal factors influencing the choice of such a service in terms of its operation are the accuracy of routes and the avoidance of overcrowding within the vehicle. Bronsvoort et al. [
15] demonstrated that cost, access/egress times, and in-vehicle times play a significant role in individuals’ preferences for choosing flexible transport services. Regarding other factors, parking difficulty and non-possession of private transport modes were proven critical too. The scoping literature review by Schasche et al. [
16] demonstrated that the primary usage determinants include waiting time and stop location, cost, and frequency of routes, while also underscoring adequate information, reservation systems, and issues related to comfortable access to vehicles of such a service.
What is more, age and gender are proven to be critical in choosing flexible transport services [
17]. According to Terry and Bachman [
18], women are more open to using flexible transport services, while the literature holds different perspectives on the matter of age. To be more precise, Anburuvel et al. [
17] argued that younger people are more likely to use flexible bus services, but Frei et al. [
19] and Knierim and Schluter [
20] demonstrated that the elderly (mainly in rural areas) are more willing to use relevant schemes. Considering the spatial dimension, the study of Ryley et al. [
21] demonstrated that trips to health facilities, shopping, and group leisure activities were found to have the highest potential to convert to DRT. Wang et al. [
22] used a multi-level area-based analysis of data in Greater Manchester, England. They revealed that the demand for DRT services is higher in areas with low car ownership, low population density, and high levels of social deprivation in terms of income, employment, education, housing and services, health and disability, and urban life quality.
Nonetheless, to effectively serve the users, it is essential to formulate readable and attractive routes as well as to deploy efficient passenger collection points that will facilitate public access to the on-demand service. A door-to-door service may minimize access times to and from passenger collection points, but it leads to greater in-vehicle travel times [
23,
24,
25]. Consequently, the bus makes several deviations to meet high demand needs. To this end, spatiotemporal variations in demand should be adequately forecasted before designing such a “realistic flexible” service [
26]. For the literature gap, existing research focuses on optimization techniques [
6,
27,
28], but a holistic planning approach incorporating demand modeling, conceptual planning, and spatial analysis tools is still missing in the scientific literature. New approaches should ensure a successful demand-responsive system considering all the previously mentioned factors and good/bad practices.
The objective of this study is to develop and apply an alternative methodology for strategic route planning of flexible bus services in rural or peri-urban areas. It focuses on local communities who are unfamiliar with on-demand transport, aiming to understand their attitudes and preferences and pre-estimate their intention to use this new service. Through a data-driven approach, it configures important service planning factors like stop spacing and line spacing. Last, this study aspires to integrate an evaluation framework to prioritize routes, providing valuable input to transport operators who may be unable to operate all routes due to budget or other constraints. The methodological framework was initially implemented in the regional city of Corinth, Greece, and its peri-urban area. Located 83 km from Athens, Corinth has a population of 56,432 residents, according to the latest census.
The remainder of the paper is structured as follows:
Section 2 presents the combinatorial method, especially focusing on the stated preference survey, spatial analysis, and multicriteria decision-making process. Next,
Section 3 provides the results, illustrating how this method is applied to the study area. Following,
Section 4 reflects the discussion on findings, limitations, contribution, and further research recommendations. Finally,
Section 5 draws solid conclusions.
2. Method
The methodological framework followed consists of three distinct stages that utilize novel or traditional tools and techniques. Initially, the first stage concentrates on social research, and particularly, it includes a stated preferences experiment (Survey). This technique aspires to identify the actual factors influencing the willingness to adopt flexible route services in an urban–rural context with high car dependency and poor public transport. Next, the second stage employs spatial analysis techniques to formulate flexible routes (Planning). Finally, the last stage involves multicriteria analysis (i.e., REGIME) to evaluate and rank the proposed routes in terms of implementation urgency (Assessment). All these three stages comprise the SPA framework, meaning Survey, Planning, and Assessment (see
Figure 1).
2.1. Stated Preference Experiment and Demand Modeling
The first step of the overall approach investigates the future demand for such a service by conducting a stated preferences experiment [
29]. The willingness to use a flexible bus service is described by a variable in binary format. Stated preference experiments contain hypothetical (or imaginary) scenarios related to this future service. The main steps for designing a stated preferences survey are (1) definition of the dependent and independent variables, (2) selection of the measurement unit and levels of independent variables, (3) mathematical specification of the utility function and unknown parameters, (4) design of scenarios using fractional factorial design or efficient design, (5) conversion of scenarios into questions and formulation of the questionnaire form, (6) selection of the calculation method and data organization method, (7) conducting a pilot study and developing a questionnaire distribution strategy, and (8) data analysis and computation of the statistical models [
30,
31].
The variables and their respective levels were defined based on a review of previous relevant studies, as they were mentioned in the Introduction. Of course, in this process, the hypotheses that the research team aimed to test were taken into consideration. First, the respondent will have to choose between 1 and 0. It is a binary and stochastic variable. The value of 1 is associated with the willingness of one individual to use the flexible bus service, while the 0 value refers to the chance of not changing his/her present travel behavior. This means the use of any other mode that is available today in the study area. The service costs are set based on the hypothesis that pricing for flexible mobility services should fall between the cost of a public transport ticket and the operational cost of a personal vehicle, ranging from 1.5 to 4.5 euros [
25,
26]. Travel time is categorized into in-vehicle, waiting, and walking durations. Analyzing these components offers a deeper understanding of the desired flexibility of the new service, whether it is stop-based or door-to-door. The walking time from/to the pick-up/drop-off point can be 5, 10, and 15 min, while the waiting time cannot exceed 15 min in the scenarios included in the stated preferences survey. Three levels are also determined in the in-vehicle time variable, i.e., 10, 20, and 30 min. Last, a set of individual-specific or socio-demographic variables are considered, namely age, gender, income, education, car ownership, and bicycle ownership.
Table 1 presents the main explanatory variables.
As has been mentioned, the most noteworthy advancement is the incorporation of two context variables that account for different times of the day. These context variables introduce interaction effects with the previously presented explanatory variables, implying that aspects such as travel time or cost might have varied significance based on the time context. This consideration aids in devising planning solutions that more accurately align with time-specific demands and preferences, thereby enhancing the likelihood of the service being utilized. The inaugural context variable pinpoints the peak travel hour. This variable is binary: a value of 0 signifies off-peak times, while 1 indicates peak travel hours. To further categorize the peak periods, a secondary variable named period discerns whether the time is between afternoon and midnight or between morning and midday. This creates a set of 2 × 2 combinations splitting the day into four periods, i.e., 07:00–09:59 (morning/midday peak), 10:00–13:59 (morning/midday off-peak), 14:00–16:59 (afternoon/evening/midnight peak), and 17:00–23:59 (afternoon/evening/midnight off-peak). The specification of time slots was based on travel surveys and traffic measurements conducted in the study area. Based on the above considerations, the model utility function can be defined. In essence, Equation (1) is the mathematical transformation of
Table 1.
where
: the probability of using the on-demand bus service by individual j in scenario i;
: systematic utility of using j on-demand bus service by individual j in the scenario i;
intercept parameter of the utility function;
: model beta parameters;
: service cost in euros in scenario i;
: 1, if peak hour period in scenario i;
: 1, if morning or midday period in scenario i;
: in-vehicle travel time in minutes in scenario i;
: waiting time in minutes in scenario i;
: walking time in minutes in scenario i;
: age group of individual j;
: 1, if individual j is male;
: income group of individual j;
: education level of individual j;
: 1, if individual j owns at least one car;
: 1, if individual j owns at least one bicycle.
Considering all the variables, there are 2 × 2 × 3 × 3 × 3 × 3 = 324 combinations. The evaluation of 324 scenarios by a single respondent is surely not possible. That is why the survey is constructed based on the fractional factorial design method, which ensures zero correlations among the defined explanatory variables while eliminating the output scenarios. However, this design does not minimize correlations among interaction effects of variables unless these effects are specifically included in the utility function. For instance, in this survey, the interaction effect between contexts and trip variables should not be colinear with the other model variables. In other words, respondents should balance their choices considering all the different contexts (i.e., period of the day) that can be formulated. The fractional factorial design is based on an orthogonal table, which in this case has 36 scenarios in total. Four blocks of questions are constructed so that each respondent will evaluate only nine scenarios.
The following notice is added before the scenarios’ presentation; it gives the main hypotheses that should be considered by the respondent before answering: “In the upcoming experiment, imagine that you need to travel a distance of 12 km on an average day. By car, the estimated travel time is 18 min, assuming no traffic congestion. This estimation does not account for the time it might take to find parking. On foot, covering this distance would take approximately 144 min (or 2 h and 22 min). If you were to cycle, it would take about 48 min. Additionally, there is a new on-demand service available. Through a user-friendly app, you can call a bus to pick you up at a designated passenger collection point”.
In the subsequent phase of this procedure, scenarios are translated into relevant question sets. As an illustration,
Figure 2 presents a typical scenario found in the survey. To offer a succinct overview of the conditions presented in each scenario, color coding and bolded key terms are employed. Questions about socio-demographic characteristics were positioned at the end of the survey. The form also captures the current travel patterns of respondents, allowing for a comparison with their expressed preferences. The survey was digitized using Google Forms, accompanied by a comprehensive guide and overview on the introductory page. Before participating, every respondent gave informed consent. Despite the anonymity of responses, participants had the option to bypass questions related to socio-demographic information.
The survey was primarily shared through social media and emails targeting residents of Corinth and Loutraki, Greece. These individuals represent potential future users of flexible public transport services, making it essential to carefully consider their needs. However, individual needs can vary significantly. Thus, efforts were made to ensure the survey represented diverse social groups, with special emphasis on capturing varying employment statuses and age groups, both of which greatly influence preferences in the end. In other words, in this approach, the primary focus was not on sample size but rather on capturing a diverse range of opinions from the study area. The data collection process spanned from June to September 2022. A block randomization algorithm was employed to distribute the various blocks of scenarios using a single link. This ensures that the same number of responses will be collected per block. It ensures zero correlations among the selected independent variables in the final dataset, as the survey was designed in the first planes. The estimation of unknown parameters is achieved by applying the maximum likelihood estimation (MLE) method.
2.2. Spatial Analysis and Conceptual Planning
This stage entails all the activities related to strategic planning of the routes. Notably, it contributes to the formulation of different types of routes in the study area.
Figure 3 illustrates the basic steps needed to accomplish this planning stage. The main spatial analysis technique involves an adjusted shortest-path algorithm developed to translate the conceptual routes into real ones.
Step 1 involves the analysis of the existing conditions of the study area through the examination of its urban and transport characteristics. Specific elements are documented: The road network includes data about the hierarchy of the road network, road pavement width, and traffic direction of the roads. Population and density are examined in each settlement within the study area. Points of interest encompass archaeological sites, beaches, and others. Routes and stops of public transportation include railway lines, regional bus routes, and local (urban) bus services. Land uses are sports facilities, commercial and recreational areas, cultural sites, educational institutions, health facilities, industrial zones, public services, public spaces, places of worship, tourism-related areas, and other land use categories (i.e., clusters for commercial activities).
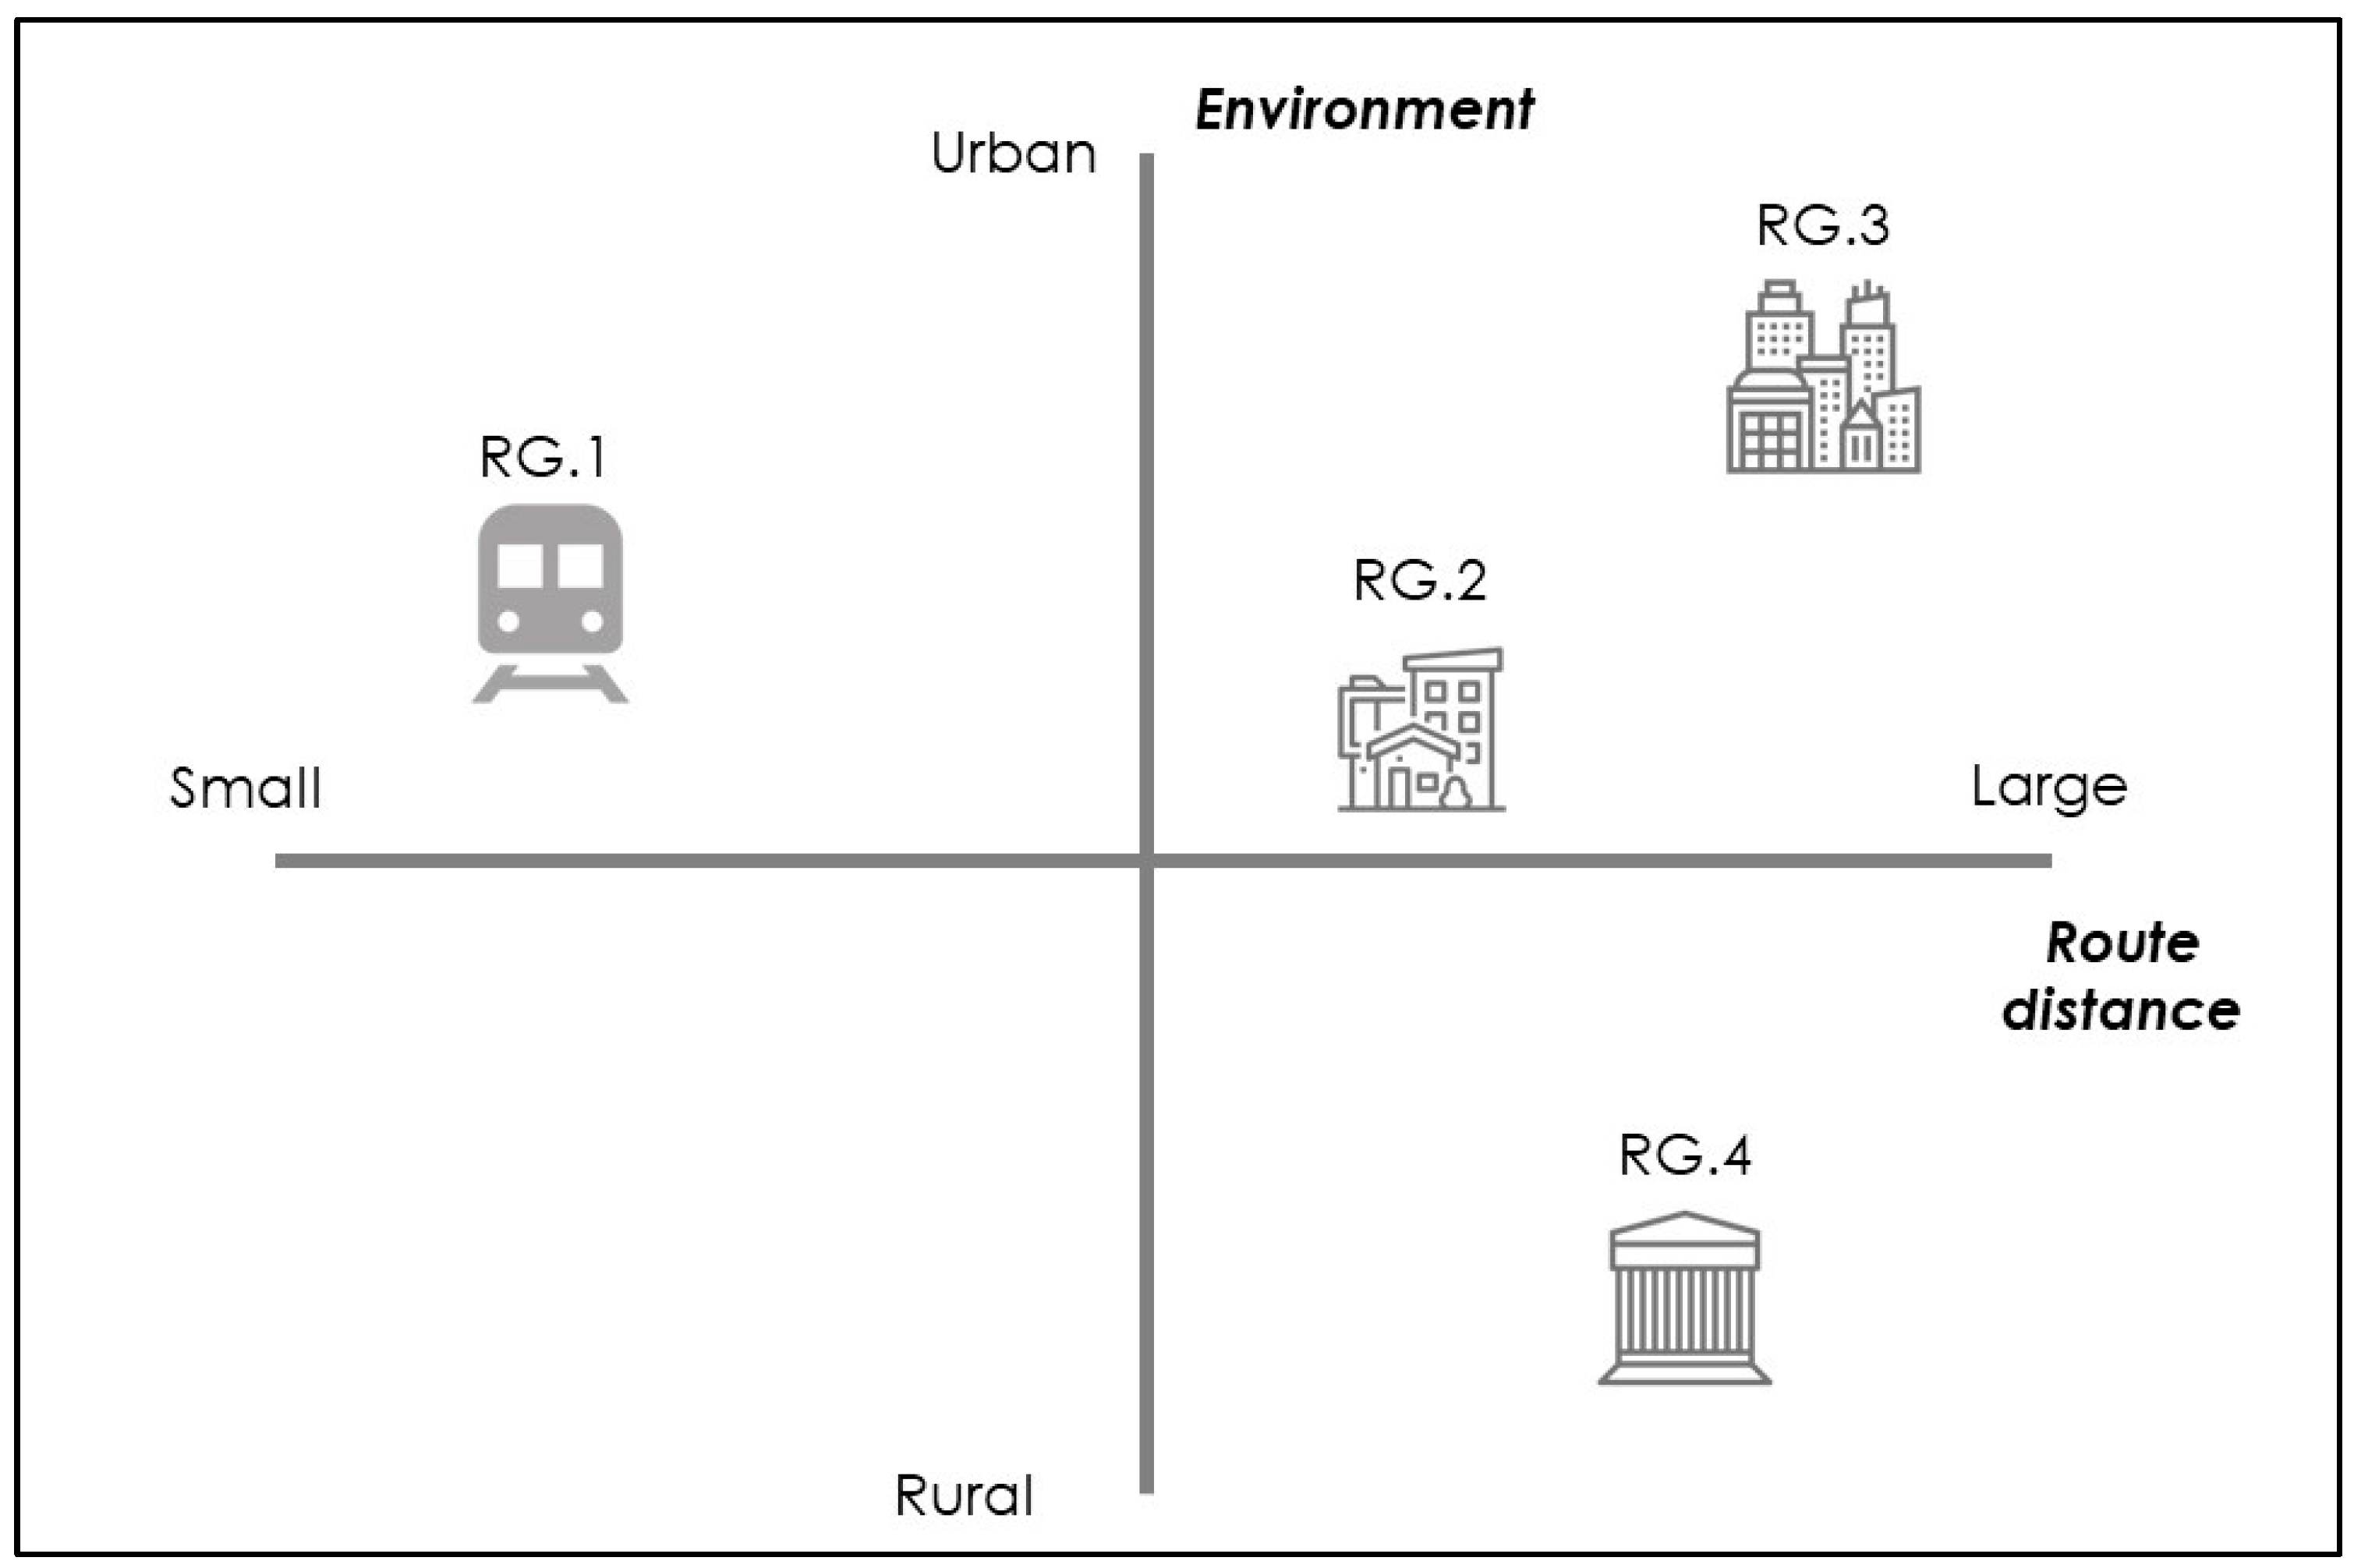
In step 2, the groups of routes are defined, describing various objectives and characteristics. Routes are divided into four groups. The first group addresses feeding services to the suburban railway (RG1). The next two groups concern the connection of settlements, specifically the connection between settlements and urban centers (RG2) and the connection of urban centers with each other (RG3). The fourth group is destined to serve the touristic destinations within the study area (RG4). These groups are characterized by different levels of urbanization and distances to be covered. The following conceptual figure (see
Figure 4) illustrates the relationship between urbanization levels and route distances of each group.
What is more, some illustrative cases depicting conceptual connections per route group are presented in
Figure 5. More specifically, in RG1, a direct connection between settlements and urban centers with suburban train stations is suggested. In the same line, RG2 resembles direct connections. Moving to RG3, it is essential to note that two types of connections are noticed. The first one addresses the connection of urban centers with each other, and the second one relates to the connection of urban centers with suburban train stations and regional bus stations. Finally, RG4 emphasizes touristic destinations. Interestingly, this type of route group connects points of interest with settlements, urban centers, and public transport stations as well.
Step 3 involves the actual spatial determination of the routes, where “conceptual connections become reality”. In this context, only town centers with more than 2000 residents and settlements with more than 1000 residents are considered further. Especially concerning the main urban centers, they are linked with settlements that can be encountered within a 10 km radius (Euclidean distance) from the central area of each town. The shortest paths connecting these points are determined; the Dijkstra algorithm is applied. Not all points are connected though, as it would be impractical and unrealistic for the flexible bus system. When it comes to routes passing through the main town, the methodology slightly changes. The routes follow an adjusted shortest route based on the number of non-residential land uses (i.e., demand/attraction points), weighted by the road width, which ensures the feasibility of the flexible bus operation [
32,
33]. Advanced network analysis tools are utilized. Finally, criteria related to the walking distance from the nearest passenger collection point are established, namely 200, 300, 400, and 500 m. This condition gives a range of four-stop spacing scenarios referring to spatial variations of collection points. This option is followed only in areas with more than one demand/attraction point. In the small settlements of rural areas, only one scenario is developed. Specifically, one passenger collection point is established in each central square of rural settlements.
2.3. Assessment and Routes’ Ranking
In the final stage of the SPA method, the evaluation of the routes is carried out via the multi-criteria analysis REGIME. More specifically, during this stage, the routes are ranked based on significance and feasibility.
Multicriteria analysis (MCA) is a remarkable tool, allowing the analysis and evaluation of multiple aspects of a problem that could be considered in the decision-making process. It is used in various cases, including classification, ranking, and evaluation of different alternative proposals or scenarios [
34]. The fundamental components of the multi-criteria analysis process are the following: (a) alternative solutions; (b) criteria; and (c) weights related to these criteria [
35]. Multi-criteria techniques are used in many transportation policy studies to address complex decision-making problems where policymakers face multiple and sometimes conflicting criteria [
36]. An interesting paradigm of using MCA in the planning process is the development of the Bicycle Metropolitan Network in Athens [
37]. Overall, MCA can easily be combined with other participatory methods, creating a more flexible evaluation framework that facilitates the involvement of a broad range of stakeholders during the assessment process [
38].
REGIME is a distinct process of multi-criteria evaluation that accepts both qualitative and quantitative data [
39]. It is a qualitative method of multiple attributes that solves the problem based on a pairwise comparison of all alternatives. The application of this method relies on two types of input data: the evaluation (impact) matrix and a set of policy weights [
40].
At this point, the evaluation criteria for the routes and the evaluation process should be chosen. The criteria are drawn from the relevant literature and are divided into three main categories, i.e., urban planning, demographics, and transportation [
12,
15,
33,
41]. The criteria are also aligned with the strategic objectives of this service, established at the start of the planning process. Firstly, the urban planning criteria include the following: 1. Route significance; 2. Land uses along the route; and 3. Land use mix. Next, the demographic category encompasses one criterion, that of 4. Served population. Lastly, category 3 represents the transportation criteria, which are as follows: 5. Estimated route travel time; 6. Route length; 7. Road network hierarchy discontinuity; and 8. Feeder service of suburban railway stations. These criteria cover a wide range of dimensions and factors related to the operation of a flexible bus service [
22,
42]. They can be found along with their description in
Table 2.
After defining the criteria, the REGIME evaluation takes place. The method is chosen to be applied four times due to validation and clarity reasons, i.e., (1) non-weighted evaluation, (2) demographics-urban planning-transportation, (3) urban planning-demographics-transportation, and (4) transportation-urban planning-demographics.
4. Discussion
This research aimed to identify factors influencing the willingness to use flexible services and to plan efficient and effective routes that comply with these factors. Questionnaire survey, spatial analysis, and multicriteria analysis techniques were employed. To the authors’ knowledge, similar research attempts have not adopted such a holistic approach. Mainly, they either focus on questionnaires like Thao et al. [
44] and Jittrapirom et al. [
45] or on planning [
27,
28]. Additionally, multicriteria decision-making has been used quite rarely and mostly on evaluating the entire scheme and not the proposed routes [
22]. This approach offers several distinct advantages over previous studies that primarily focused on optimizing on-demand service responsiveness or defining optimal routes [
6,
27,
28]. The proposed planning method achieves a practical solution that delivers a simple and feasible public transport service. A key strength of this approach is its high level of customization: the service is specifically designed to align with local land use patterns and user preferences. Consequently, the bus makes several deviations to meet high demand needs. To this end, spatiotemporal variations in demand should be adequately forecasted before designing such a “realistic flexible” service [
26]. This method also includes policymakers and planners directly in the co-formulation process, ensuring that the service aligns with local objectives.
When it comes to questionnaire surveys, this research quantified the operational factors of a flexible bus service, intending to seek an efficient and concurrently effective design and thus rendering the service more appealing to users. Influential factors to be tested, such as cost, delays, connectivity to areas with low service coverage, congestion, etc., emerged from a narrative literature review. Undoubtedly, cost and time are two statistically significant utility variables. This is in line with relevant studies [
13,
15]. However, in this study, an advanced analysis of model outputs was performed to unveil the cost associated with various time components of a public transport trip, i.e., in-vehicle, waiting, and walking times, during different times of the day. As a general conclusion, during the morning peak, users are notably disinclined to walk to the nearest passenger pickup point, in contrast to evening hours where walking to the stop is not a deterrence. Comparatively, during the afternoon peak, extended waiting times decrease the service’s appeal. This is related to the activities that are performed in each period of the day. Indeed, the time cost holds the highest value during the afternoon peak when commuters are “rushing” to return home. Thus, the service should be more efficient during this period. But during the morning peak, based on the results, the design should focus on a door-to-door service, reducing walking times significantly from/to work locations. These findings are particularly interesting when aligned with the existing literature, which suggests that on-demand services should be prioritized during afternoon peak hours [
46]. Overall, it is noteworthy that users are unwilling to pay more than 3.5 euros for a 20-min journey using this new mode of transport. This relatively high price elasticity underscores the potential profitability of offering such a customized mobility solution. A diagram showing the main inputs coming from the stated preferences experiment to the planning process is shown in
Figure 12.
Regarding socio-demographic characteristics, age and gender matter [
17]. Noticeably, it was revealed that women are more interested in using this flexible service, in line with Terry and Bachmann [
18]. Conversely, concerning men, even minor price fluctuations lead to substantial changes in the intent to use the new service. The same applies to individuals aged 18–29. This is indeed interesting since the existing literature has not reached a consensus. For instance, Anburuvel et al. [
17] indicated that younger people are more likely to use flexible bus services; on the contrary, Knierim and Schluter [
20] demonstrated that the elderly (especially in rural areas) are keen on choosing such a scheme. Depending on these results, pricing policies should be accordingly adjusted to ensure affordable conditions for all users [
47].
The spatial planning of the routes appears to be a time-consuming process, but it involves crucial details. The preferences of respondents to the questionnaire were taken seriously into account. This is exactly the meaning of the adopted holistic approach: to make synergies between the questionnaire and spatial analysis. An effort was made to clarify the success factors of a flexible bus service adapted to the demand. Noticeably, demand also has a spatial structure; hence, land uses were investigated in this paper. This can be found in similar research by Wang et al. [
22]. The study area was thoroughly examined, and the proposed solutions are tailored to the characteristics of the area. This research serves as a guide for designing similar flexible bus routes in other regional cities in Greece and beyond in the Mediterranean context. This is because the attraction points are limited and concentrated in the city centers. Like many other cities, Corinth is monocentric, with a railway station located outside the central core. Simultaneously, there are suburban and interurban settlements with low road network connectivity to the center. Therefore, the solution groups are quite limited. The latter, as evident, demonstrates the importance and compatibility of the proposed methodology in planning flexible bus lines. These findings are not usually found in the literature since several articles emphasize optimization algorithms and machine learning, which can handle and evaluate more extensive solutions [
27]. In complex transportation systems, such as those in metropolitan areas, they can prove to be more useful.
Focusing on the study area, a total of eight different routes were presented for the flexible bus service. These are divided into four groups according to their respective serving purposes, complying with the conceptual planning process: (a) train feeder, (b) connecting settlements to urban centers, (c) connecting main urban centers, and (d) serving touristic destinations. Furthermore, the routes are ranked based on their significance using the REGIME multi-criteria evaluation method. REGIME has been used in similar studies but not in route planning. Therefore, this study encapsulates multicriteria analysis in route planning. This ranking assists in selecting the route that the flexible bus service will operate based on the demand and operational cost constraints. In other words, this ranking may help policymakers and transport providers decide which routes should operate first.
When it comes to routes passing through Corinth, ranking reflected complexity; on the other hand, concerning routes that do not reach Corinth, results were homogeneous. Routes 6 and 8 were deemed the most critical from this analysis for areas outside and within Corinth, respectively. Hence, at a strategic level, there is a wide range of line choices available to the regional bus services. At an operational level, the transport project manager selects which lines will operate, always considering passenger demands. This selection should be made daily to ensure a truly dynamic service. Additionally, the routes are modified throughout the day, considering the survey results. This is partially in line with Iqbal et al. [
48], who proposed intelligent bus stops that will be effective or ineffective depending on the occurring demand.
With regards to the passenger collection points (only) within Corinth, four alternative solutions are presented, differing in their distance density. High density offers shorter walking distances for most building blocks in the city. Based on the analysis process, it is evident that the city of Corinth is adequately covered by the 300 m and 400 m density values. Therefore, there is no need to implement a denser solution. This spatial approach could contribute to implementing flexible bus services in real-life conditions. Transport operators could test these intervals and decide which is the most efficient for balancing operational conditions and walking requirements.
Despite its notable contribution, this research illustrates some limitations that should be addressed at this point. First and foremost, the sample of the survey is characterized by a low representation of elderly individuals, as the questionnaire was exclusively distributed online. As the primary users of public transport today, it is certain that this service will attract them. What is more, the survey results reflect the preferences of local residents only, meaning that applying the proposed method would require the recalibration of the demand model by conducting the same stated preference experiment. A restraining factor might be familiarity with technology, though this depends more on the design of the electronic platform and less on the design of bus routes. Regarding the flexibility of the planning method, it should be underlined that the method also has some drawbacks. It tends to be more static than dynamic, concentrating on finite routes. The dynamic nature relies on the different number of stops per morning and evening. However, this is suitable for urban–rural areas, but it would be a significant limitation for complex metropolitan cities. Additionally, routes utilized existing infrastructure; a discussion about building new roads was not on the table in this study. Furthermore, the conceptual design was mainly based on geographical thinking and the importance of points of interest rather than an optimization technique. Finally, when looking into the evaluation of the routes, the criteria are limited, representing certain categories (demographic, urban, and transport); new perspectives should be explored in the future.
The future of research in the field of route planning holds tremendous promise, with novel algorithms and machine-learning techniques at the forefront of innovation. One exciting avenue of research lies in developing algorithms that can adapt in real time to changing traffic conditions, ensuring efficient and time-saving routes. Incorporating machine learning into route planning can enable systems to learn from historical data, user preferences, and real-time traffic updates, resulting in more personalized and context-aware recommendations. Advanced spatial tools are another frontier in route planning research. These tools leverage the power of geographic information systems (GIS) to provide users with an even deeper understanding of their surroundings. For instance, 3D mapping and visualization can offer a more immersive and accurate depiction of the terrain, allowing for better route selection, especially in complex urban landscapes or natural environments. Furthermore, the integration of augmented reality (AR) into navigation apps can overlay real-time information, such as points of interest, traffic signals, or even potential hazards.
Expanding the evaluation criteria for route planning systems is crucial for ensuring they meet the diverse needs of users. While traditional criteria often focus on distance and travel time, the future of research should encompass a wider range of factors. These could include energy efficiency, carbon footprint, and even the impact on mental well-being. Accessibility and equity implications are fundamental aspects of future route planning research. Public transport systems must be designed with inclusivity in mind, addressing the needs of all individuals, including those with disabilities. In the future, route planning systems could also play a pivotal role in promoting sustainable and eco-friendly modes of transportation. By encouraging users to choose routes that minimize their carbon footprint, these systems can contribute to reducing greenhouse gas emissions and combating climate change. Additionally, incorporating dynamic pricing models into route planning research can help optimize traffic flow and reduce congestion during peak hours.


 ,
, 


