Article

Identifying Public Perceptions toward Emerging Transportation Trends through Social Media-Based Interactions

1
Department of Civil and Environmental Engineering, Florida International University, 10555 W Flagler St., EC 3680, Miami, FL 33174, USA
2
School of Civil Engineering and Environmental Science, University of Oklahoma, 202 W. Boyd St., Norman, OK 73019, USA
*
Author to whom correspondence should be addressed.
Future Transp. 2021, 1(3), 794-813; https://doi.org/10.3390/futuretransp1030044
Submission received: 14 September 2021 / Revised: 22 November 2021 / Accepted: 9 December 2021 / Published: 15 December 2021

Abstract

:
The objective of this study is to mine and analyze large-scale social media data (rich spatio-temporal data unlike traditional surveys) and develop comparative infographics of emerging transportation trends and mobility indicators by adopting natural language processing and data-driven techniques. As such, first, around 13 million tweets for about 20 days (16 December 2019–4 January 2020) from North America were collected, and tweets closely aligned with emerging transportation and mobility trends (such as shared mobility, vehicle technology, built environment, user fees, telecommuting, and e-commerce) were identified. Data analytics captured spatio-temporal differences in social media user interactions and concerns about such trends, as well as topics of discussions formed through such interactions. California, Florida, Georgia, Illinois, New York are among the highly visible cities discussing such trends. Being positive overall, people carried more positive views on shared mobility, vehicle technology, telecommuting, and e-commerce, while being more negative on user fees, and the built environment. Ride-hailing, fuel efficiency, trip navigation, daily as well as shopping and recreational activities, gas price, tax, and product delivery were among the emergent topics. The social media data-driven framework would allow real-time monitoring of transportation trends by agencies, researchers, and professionals.

Graphical Abstract

1. Introduction and Motivation

With the rapid expansion of modern technologies, the wide availability of spatial data and smartphone apps, and emerging transportation options, the landscape of transportation demand and supply are changing. The increased availability of technology-enabled transportation options (e.g., ridesharing) and modern communication devices (smartphones, in particular) are transforming travel-related decision-making in the population differently at a different level. These complex dynamics of emerging mobility behaviors are also expected to be influenced by individual lifestyles and different social (e.g., education), economic (e.g., employment), demographic (e.g., gender) factors. National Cooperative Highway Research Program (NCHRP) explores the effect of these factors on travel demand [1,2,3]. Several studies reflect the dynamics of mobility patterns influenced by the built environment [4,5,6,7]. Moreover, numerous studies have paid attention to exploring the impact of different socioeconomic factors, such as age, gender, and income levels on travel behavior [8,9,10].
The main sources of data used in the abovementioned studies are surveys (e.g., travel surveys), that feature representative populations and detailed information about travel mode and trip purposes. Survey data have some limitations, such as variabilities across different locations in data collection method and data availability, lack of real-time engagement of the respondents, expansive and time-consuming as trend analysis requires periodic data collection. So, the real-time spatiotemporal monitoring of people’s travel behavior, which is very crucial for transportation planning, remained unexplored in the studies mentioned above using survey data.
Nowadays, people have become more active on Social Media Platforms (SMPs) (e.g., Twitter) [11]. SMPs are increasingly leveraged to overcome the drawbacks of surveys and other sources of travel data as it serves the need for a more unified, less privacy-invading, and simply accessible method to fully understand the dynamics of travel patterns. Moreover, Social media data incorporates the spatiotemporal feature and real-time engagement of the respondents.
An in-depth understanding of the continuously changing emerging transportation and mobility trends in real-time is needed to better design the nation’s transportation infrastructure to meet people’s mobility needs over the next decades. Existing studies using traditional methods of research (e.g., survey) leave the real-time spatiotemporal monitoring of transportation trends unexplored due to the limitation of data. This necessity lays the foundation of the research motivation of this pilot study. The novelty of this pilot study is in introducing the framework to demonstrate the capability of large-scale social media data using natural language processing techniques to capture emerging transportation trends in real space-time. This study will not only contribute methodologically but also is expected to produce a higher quality of results as it will deal with the people’s spontaneous real-time engagement.
In this study, for the first time, Twitter data has been used to track emerging transportation trends over a large geological scale with a large volume of data (around 13 million tweets) which would not be achievable with survey techniques. We explored emerging travel trends in North America using data obtained from Twitter for around 20 days from 16 December 2019 to 4 January 2020. The main purpose of this study is to understand public opinion and identify emerging transportation trends based on social media interactions with enriched space and time information. This study aims to contribute by achieving the following objectives:
  • Identify spatio-temporal characteristics of relevant social media interactions on shared mobility, vehicle technology, built environment, user fees, e-commerce, and telecommuting which can give an understanding about the spatial and temporal distribution of the relevant tweets describing the emerging transportation trends;
  • Measure public sentiments and perceptions on emerging transportation trends through natural language processing such as sentiment analysis, which can allow the classification of tweets based on sentiment scores (highly positive, positive, neutral and negative, highly negative);
  • Explore spatio-temporal differences of user sentiments by classifying sentiment scores on transportation and mobility indicators which can make sense about the spatial and temporal distribution of tweets concerning their sentiment direction;
  • Extract emerging transportation topics and user concerns from social media interactions through Latent Dirichlet Allocation (LDA) which is a machine learning approach to identify the patterns of the filtered relevant tweets to recognize the emerging transportation trends.

2. Background and Related Work

Though SMPs are relatively new fields for research, researchers have used them in various cases such as travel demand forecasting, mobility pattern identification, disaster management, mass transit evaluation, and traffic incident management.
There are several studies where SMPs have been used to forecast travel demand. Golder and Macy [12] and Yin et al. [13] investigated the capacity, scope, and application of various SMPs to derive information on household daily travel. Tasse and Hong discussed the opportunities of using geotagged social media data instead of traditional survey data to understand people’s mobility patterns, the average distance traveled, and the overall spatial distribution of urban areas [14]. Liao et al. [15] developed a novel approach using geotagged tweets which demonstrated twitter’s potentiality for estimating travel demand, through careful consideration of sampling method, estimation model, and sample size.
SMPs have been applied to understand mass human mobility patterns, too. These studies have established Location-based Social Networking (LBSN) data as a strong proxy not only for tracking and predicting human movement, identifying mobility patterns, and recognizing various geographic and economic factors that affect human mobility patterns at aggregate levels across different geographical scales [16,17,18] but also to model user activity patterns. Hasan and Ukkusuri presented a novel approach to understand the urban human activity and mobility patterns using large-scale location-based data characterizing temporal and spatial aspects of the mobility and activity patterns [19,20]. Üsküplü et al. [21] discovered and analyzed the activity patterns of the parts of the historical districts of Istanbul by evaluating the data generated from location-based social networks.
Opinion mining has been performed in a few studies to show people’s attitude towards public transit, which can affect the way stakeholders think about future transit investments [22]. Pender et al. [23] applied crowdsourcing techniques to derive transit service information that can satisfy the increased demand and expectation for real-time information dissemination. Luong and Houston [24] also used social media data to study public attitudes about light rail transit services in Los Angeles. Haghighi et al. [25] proposed a framework to examine the opinion of transit riders’ opinions about the quality of transit service in the region of Salt Lake City using Twitter data.
Recent studies have also extracted traffic data from social media for transportation network operation and management purposes. Tian et al. [26] validated traffic incidents posted on social media by checking camera footage data and found that tweets about severe incidents tended to be more accurate. Steur [27] showed the correlation between accidents and the frequency of tweets near the incident locations. Several studies also show the potentiality of SMPs in disaster management. Wang and Taylor [28,29] studied the perturbation and resilience of human mobility patterns during and after tropical storms and confirmed the correlation of daily human trajectories between steady-state and perturbation state and the high inherent resiliency of human mobility using Twitter data. Researchers also have focused on detecting effective social media users and explored their network features to understand the spread of targeted information in major disasters [30,31]. There are few recent studies that showed the potentiality of Twitter data at a traffic predictor [32,33,34]. This made Twitter a promising source for real-time traffic management and potentially extended for traffic prediction at any time of day.
In summary, SMPs have been utilized to retrieve relevant information for demand prediction, pattern recognition, transit evaluation, incident management, and disaster management. No study has used SMPs to infer public opinions and perceptions toward emerging transportation trends on spatio-temporal platforms. As such, this pilot study presents a comprehensive approach to exploring how SMPs (Twitter) can be used to understand public perceptions and attitudes towards emerging transportation and mobility trends using natural language processing and data-driven methods.

3. Data Collection and Preparation

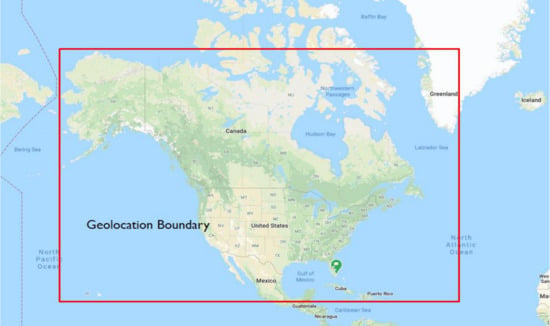
The research team created a Twitter Developer Account using Twitter Apps [35] to retrieve data through Twitter Streaming API (Application Programming Interfaces). Python programming language was used to collect the data and associated Python libraries have been used. The focus of this study is English geotagged tweets as tweet geographic information is a potential parameter for spatio-temporal analysis, the location-based data collection method produced a more suitable and reliable dataset that serves the goal of the study. As a result, tweets from North America and its surrounding area (as most of the people in this region speak English), are collected using a location-bounding box for around 20 days (16 December 2019–4 January 2020) which covered USA, Canada, Mexico, Cuba, Puerto Rico, and part of Guatemala and Greenland (Figure 1).
The raw data contain approximately 12.9 million tweets. Approximately 100% of tweets are geotagged and mostly in English (about 77%) with around 0.97 million unique users. Tweets retrieved from the streaming API contain additional information such as user id, profile information, coordinate of tweeting location, and creation time along with the tweet text. Only tweet texts, tweet creation time, and location information were considered for analysis in this study. Given the inherent ambiguity of tweets (e.g., non-standard spelling, inconsistent punctuation, and/or capitalization), additional preprocessing steps are performed to extract clean tweet text which is suitable for analysis. Noises (such as html tags, character codes, emojis, stop words, etc.) were removed from the text data, and tweets were tokenized which is the process of breaking down an expression, sentence, paragraph, or even an entire text document into smaller units such as individual words or phrases. Tokens are the names given to each of these smaller units.
The purpose of this study is to understand public opinion and identify emerging transportation trends using twitter data. For this purpose, the relevant tweets regarding emerging transportation trends need to be crawled systematically, which is one of the most important tasks in this study. During tweet crawling the following six major categories of emerging mobility trends were planned to keep in focus.
  • Shared Mobility: shared, mobility, carpool, car, uber, lyft, etc.;
  • Vehicle Technology: autonomous, automated, self-driving, connect, connected, etc.;
  • Built Environment: walk, gym, cycle, activity, sidewalks, bypass, access, bus, station, etc.;
  • User Fees: toll, express, lane, mileage, price, gas, gallon, fee, fare, tax, booth, etc.;
  • Telecommuting: telecommute, job, flexible, hours, dollar, commute, telework, mobile, remote, etc.;
  • Ecommerce: ecommerce, amazon, delivery, walmart, publix, ebay, fedex, ups, etc.
To facilitate the relevant tweet crawling, researchers searched different emerging transportation related words (e.g., uber, e-scooter, transit, e-hail) in twitter to check the availability of emerging transportation related tweets. Finally, in total 205 keywords in the six major categories were identified as relevant to emerging mobility trends. If any tweet contained at least one of the keywords from the list of 205 keywords, that tweet was considered relevant to this study. Although this approach may filter out some relevant tweets, it ensures that all tweets involving these keywords were included in the filtered dataset for further analysis. After filtering the dataset, a total number of 1.25 million (9.68% of the total tweets) relevant English tweets to emerging mobility trends were obtained for this study. Table 1 presents the keywords used to filter relevant tweets and the total relevant tweet count for each category. The percentage value represents the percentage of tweets that contained the specific keywords concerning the whole dataset.

4. Methodology

4.1. Spatial and Temporal Analysis

Twitter allows users to share their location from where the user posted the tweet, which is a confined area, generated automatically with the tweet if the location of the user’s device remains enabled. Geolocational information and timestamp of tweets were extracted from the ‘place’ and ‘created_at’ fields, respectively. Temporal or time series analysis is one of the best techniques to understand the internal patterns (trends, temporal variation) within data over time. Heatmaps were produced to represent the correlation between the most frequently used words in relevant tweets and the dates when they were tweeted. This illustrates the daily variation of popular words that have been tweeted, which provides insight into the temporal variation of the most popular and unpopular trends over time. Another type of heatmaps, plotting the inter-relationship between the most frequently used words and tweet location, was also created. It is a very efficient way to understand the spatial variation of the popularity of transportation trends. For this reason, geotagged tweets were considered as a source to improve situational awareness and improve the understanding of real-world transportation trends.

4.2. Sentiment Ratings

Sentiment analysis or opinion mining is the computational study of opinions, sentiments, and emotions. It tries to infer people’s sentiments based on their language expressions expressed in a text. It usually uses a sentiment lexicon to provide sentiment scores on the generated corpus (a textual body clustered by required class or cluster). The analysis focuses on individual sentence targets to determine whether a sentence expresses an opinion or not (often called subjectivity classification), and if so, whether the opinion is positive or negative (called sentence-level sentiment classification). Assume an opinionated document (tweet) be w, which expresses on a subject or a group of subjects. Generally, w = (w1, w2, …wi, …, wn) where wi is a word or sentence. An opinion passage on a feature f of an object o evaluated in w is a group of consecutive sentences in w that expresses a positive or negative opinion on f. Additionally, sentiments also contain subjectivity. A subjective sentence expresses some personal feelings or beliefs. Sentence-level sentiment classification involves two definite tasks with a single assumption [36]. These are stated below:
  • Task: Given a sentence s, two subtasks are performed:
    • Subjectivity Classification: Determine whether w is a subjective sentence or an objective sentence,
    • Sentence-level sentiment classification: If w is subjective, determine whether it expresses a positive or negative opinion.
  • Assumption: The tweet w expresses a single opinion from a single opinion holder
In this study, we used a Python package called VADER [37], which detects the sentiment value of a short text, for analyzing the sentiments of relevant tweets about emerging transportation trends. Using a pre-defined list of words, VADER assigns a final compound score to each of the input words, which is the sum of all the lexicon ratings which have been standardized to range between −1 and 1 [38]. VADER considers currently, frequently used slang and informal writings—multiple punctuation marks, acronyms, and emoticons—to express how a person is feeling, which makes VADER great for social media text.
People express their attitudes differently on different topics on twitter. Some show neutral views on certain topics but express dissatisfaction on other issues. Similarly, on a specific issue, some people may give just satisfactory remarks, and some may express their highest satisfaction. In the case of the transportation sector, this variability of people’s attitudes towards different topics (e.g., transportation facility or trend) is a goldmine for transportation authorities (e.g., researchers, professionals) to assess public satisfaction and acceptance level of transportation facilities. This will discover valuable insights about a certain transportation facility or trend that will help the transportation authority to make better decisions. To capture this different level of attitude (highly negative, negative, neutral, positive tweets, and highly positive) new intervals of scores have been introduced between the standardized compound sentiment score from −1 to 1.
As there is no systematic approach in the literature to identify different sentiment categories, equal intervals of the scores have been taken between the standardized compound sentiment score from −1 to 1 to define sentiment classes. So, to decide on a range to categorize highly negative, negative, neutral, positive tweets, and highly positive, a heatmap of the sentiment scores was produced and used to gauge roughly where scores were landing −1 to −0.6 (highly negative), −0.6 to −0.2 (negative), −0.2 to 0.2 (neutral), 0.2 to 0.6 (positive), and 0.6 to 1.0 (highly positive). These intervals were ultimately set as the bounds for the five categories. Some real tweets from this study were presented here as examples to demonstrate the categories:
  • “thank you for creating vision for sustainability and leading the way not only electric cars but also solar autonomous software energy storage among other accomplishments im looking forward seeing what you and your team create”—Highly Positive (Score: 0.7992);
  • “loves tesla though it’s the worst drive during holiday who knew”—Positive (Score: 0.3182);
  • “bosch finally making lidar sensors for autonomous cars”—Neutral (Score: 0);
  • “They’d stop fighting long enough maybe we’d all have autonomous self-driving cars the road now”—Negative (Score: −0.296);
  • “autonomous cars are highly susceptible risk being commandeered visual spoofing attacks”—Highly Negative (Score: −0.6461).

4.3. Topic Mining

To identify the patterns of the filtered tweets to recognize the emerging transportation trends, the topic mining technique is applied in this study. Latent Dirichlet Allocation (LDA) or topic modeling approach [39] is applied in this study. Topic modeling is a machine learning technique that analyzes text data automatically to classify cluster terms for a series of documents. LDA used a probabilistic latent semantic analysis model to recognize the patterns of the posted tweets. Though the topic model has been used popularly in machine learning, recently it was being applied in transportation studies [20,40,41].
The probabilistic procedure for the document (tweet) generating is adopted in LDA which starts with choosing a distribution ψ k over words in the vocabulary for each topic k (k ϵ 1, K) (Steyvers and Griffiths 2007). Here, ψ k is selected from a Dirichlet distribution D i r i c h l e t v ( β )   . After that, another distribution θ d over K topics is sampled from a different Dirichlet distribution D i r i c h l e t k ( α )   to generate a document d (a set of word wd). Thus, a topic is assigned for each word in wd followed by selecting each word w d i based on θ d .
For LDA, initial sampling is done on a particular topic z d i ϵ 1, K from a multinomial distribution Multinomial k ( θ d ) in generating each word w d i . Finally, the word w d i is selected from the multinomial distribution M u l t i n o m i a l v ( ψ z d i )   . Figure 2 shows the graphical representation of LDA by Sun and Yin [42]. The inference of LDA models can be done by applying the variational expectation-maximization (VEM) algorithm [39] or through Gibbs sampling [43]. The posterior of document-topic distribution θ d and topic-word distribution ψ can be efficiently inferred by both methods which allow us to discover the latent thematic structure from a large collection of documents [42].
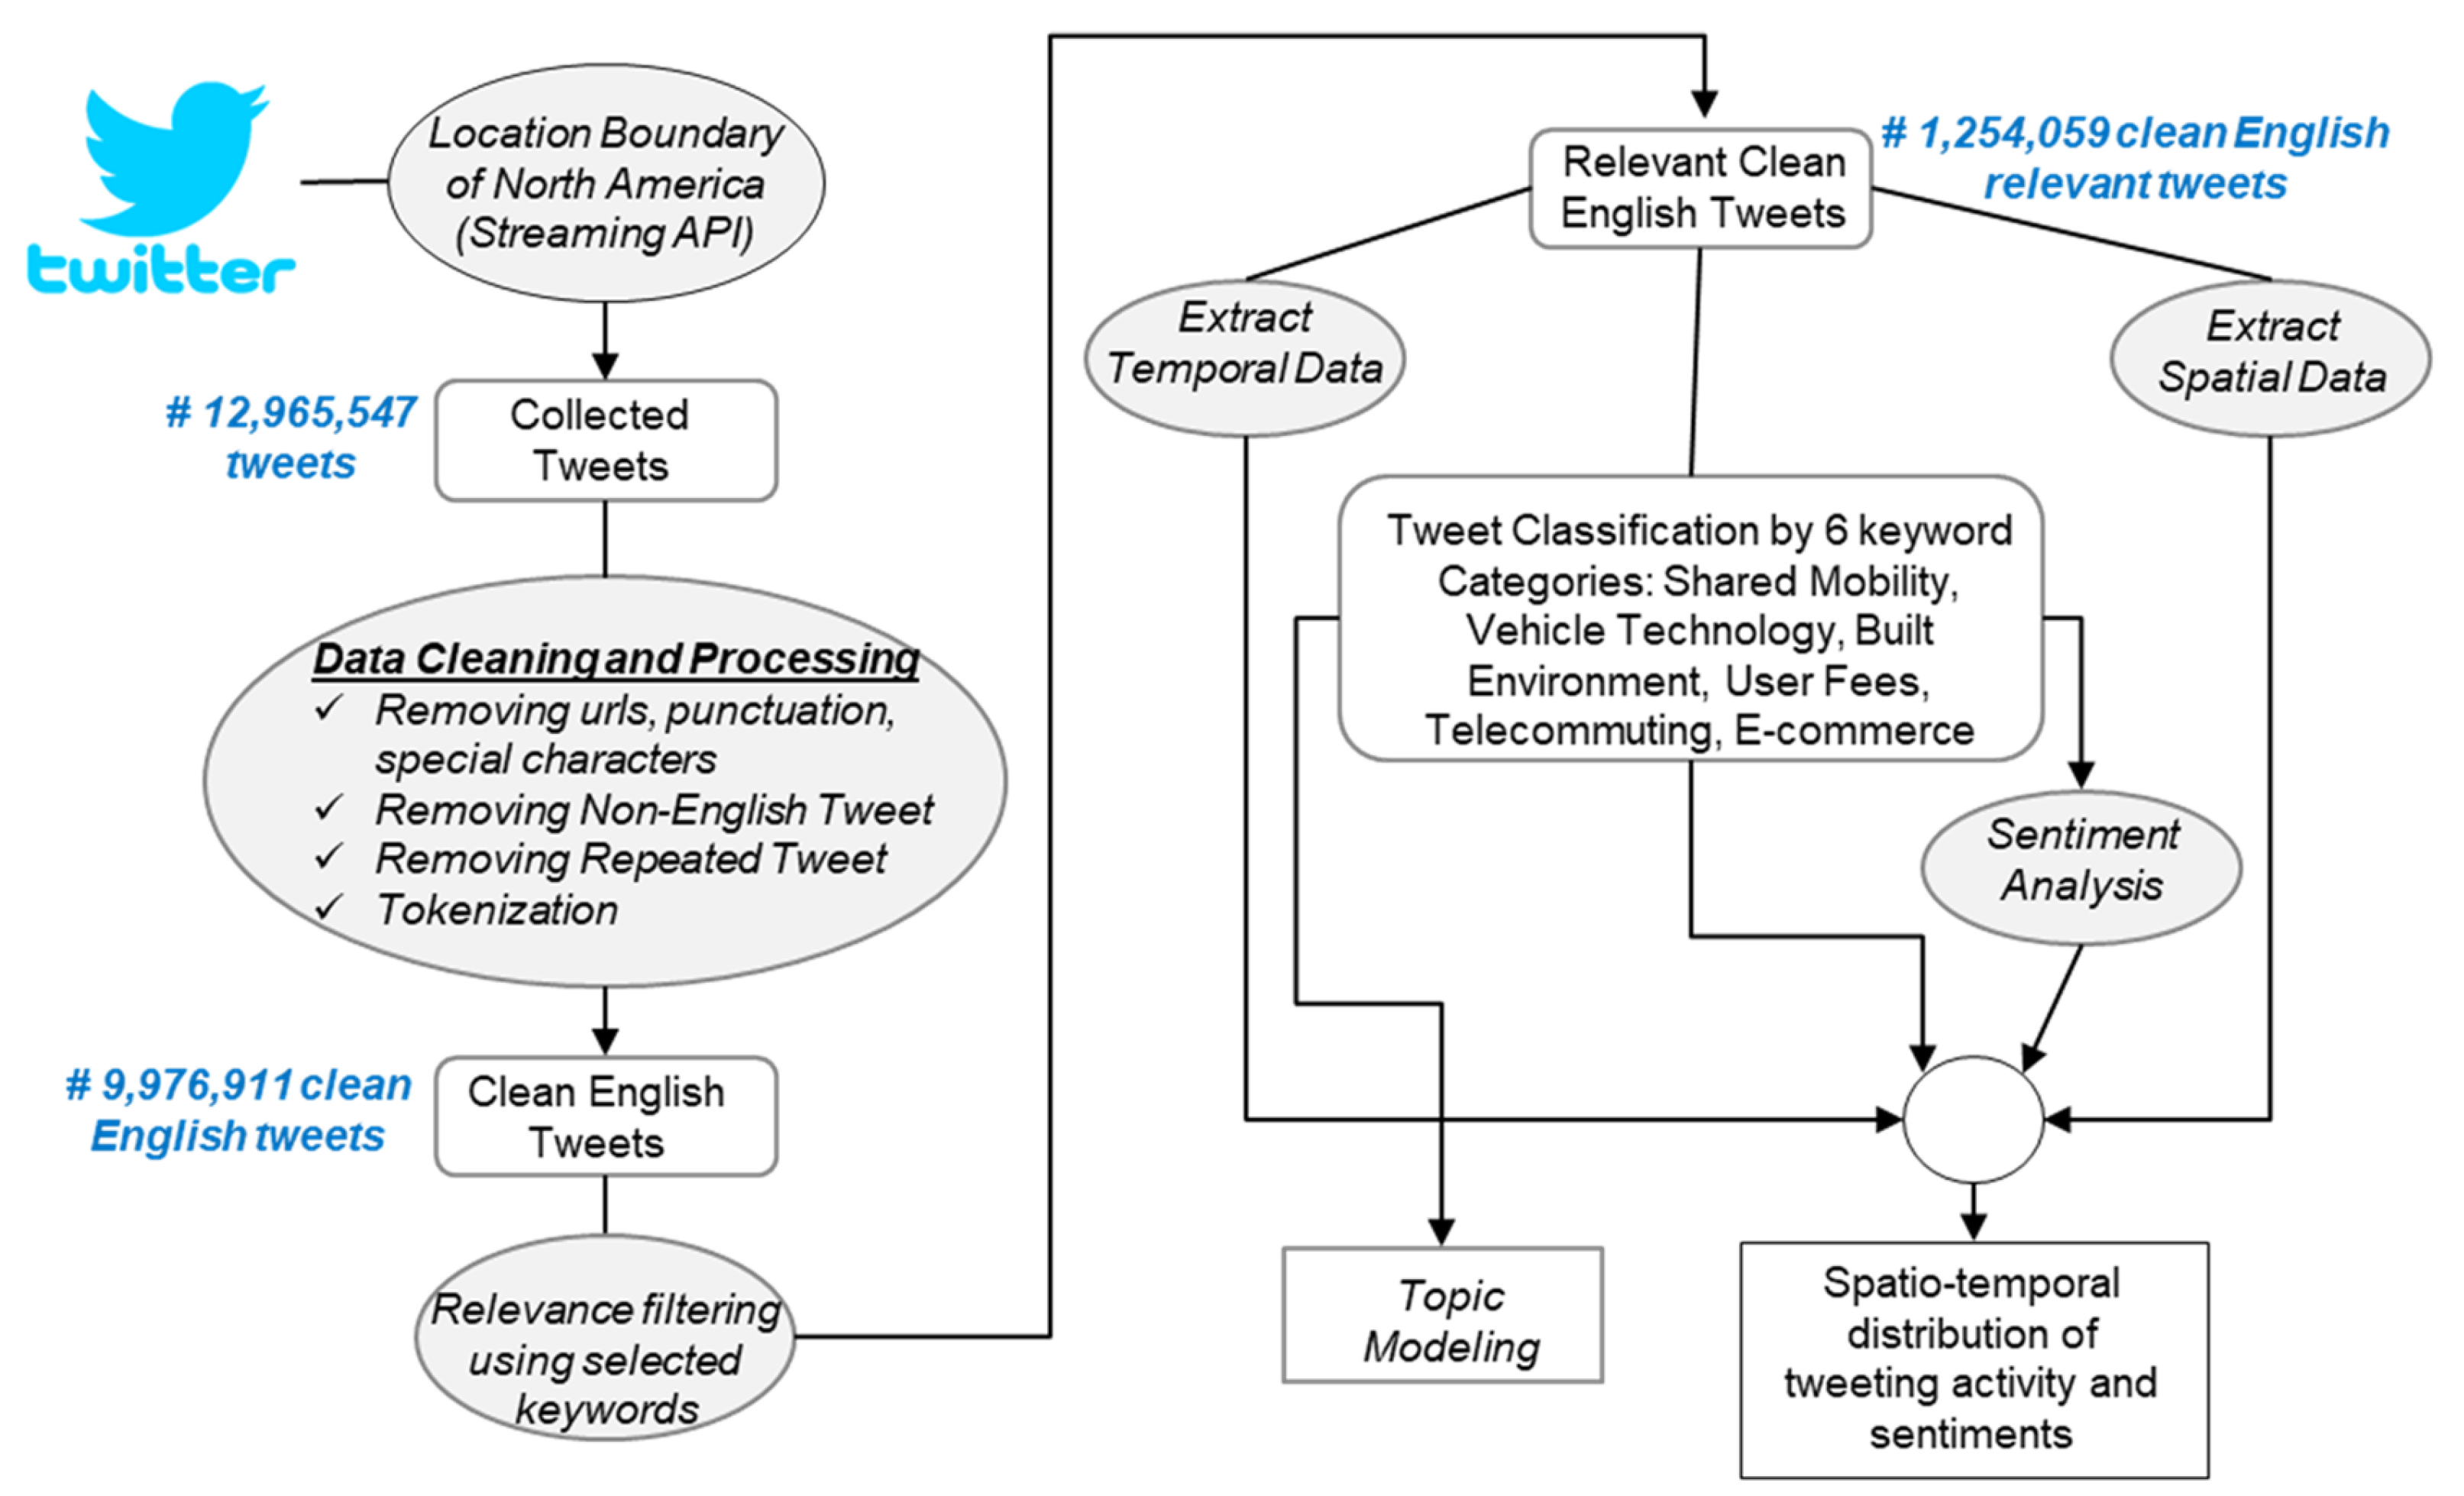
The key steps involved in the data analysis for the Tweet data are summarized in Figure 3.

5. Results and Discussion

After data processing and cleaning, a total number of 1.25 million relevant English tweets were obtained for further analysis. Figure 4 presents the main components and characteristics of the dataset. There are mostly three kinds of location information that can be extracted from a tweet:
  • Profile Location is the location of residence of the person (set by the account holder) who posted the tweet;
  • Tweet originating city (Tweet_location) is the boundary of the location from where the user posted the tweet. This feature is generated automatically with the tweet if the location of the user’s device remains enabled. The tweet containing this information is called a geotagged tweet which is the focus of this study;
  • The exact tweet location is the exact point location from where the user posted the tweet. This feature is generated automatically with the tweet when the user does check-in or tag that place while posting the tweet.

5.1. Spatio-Temporal Heatmaps of Tweets

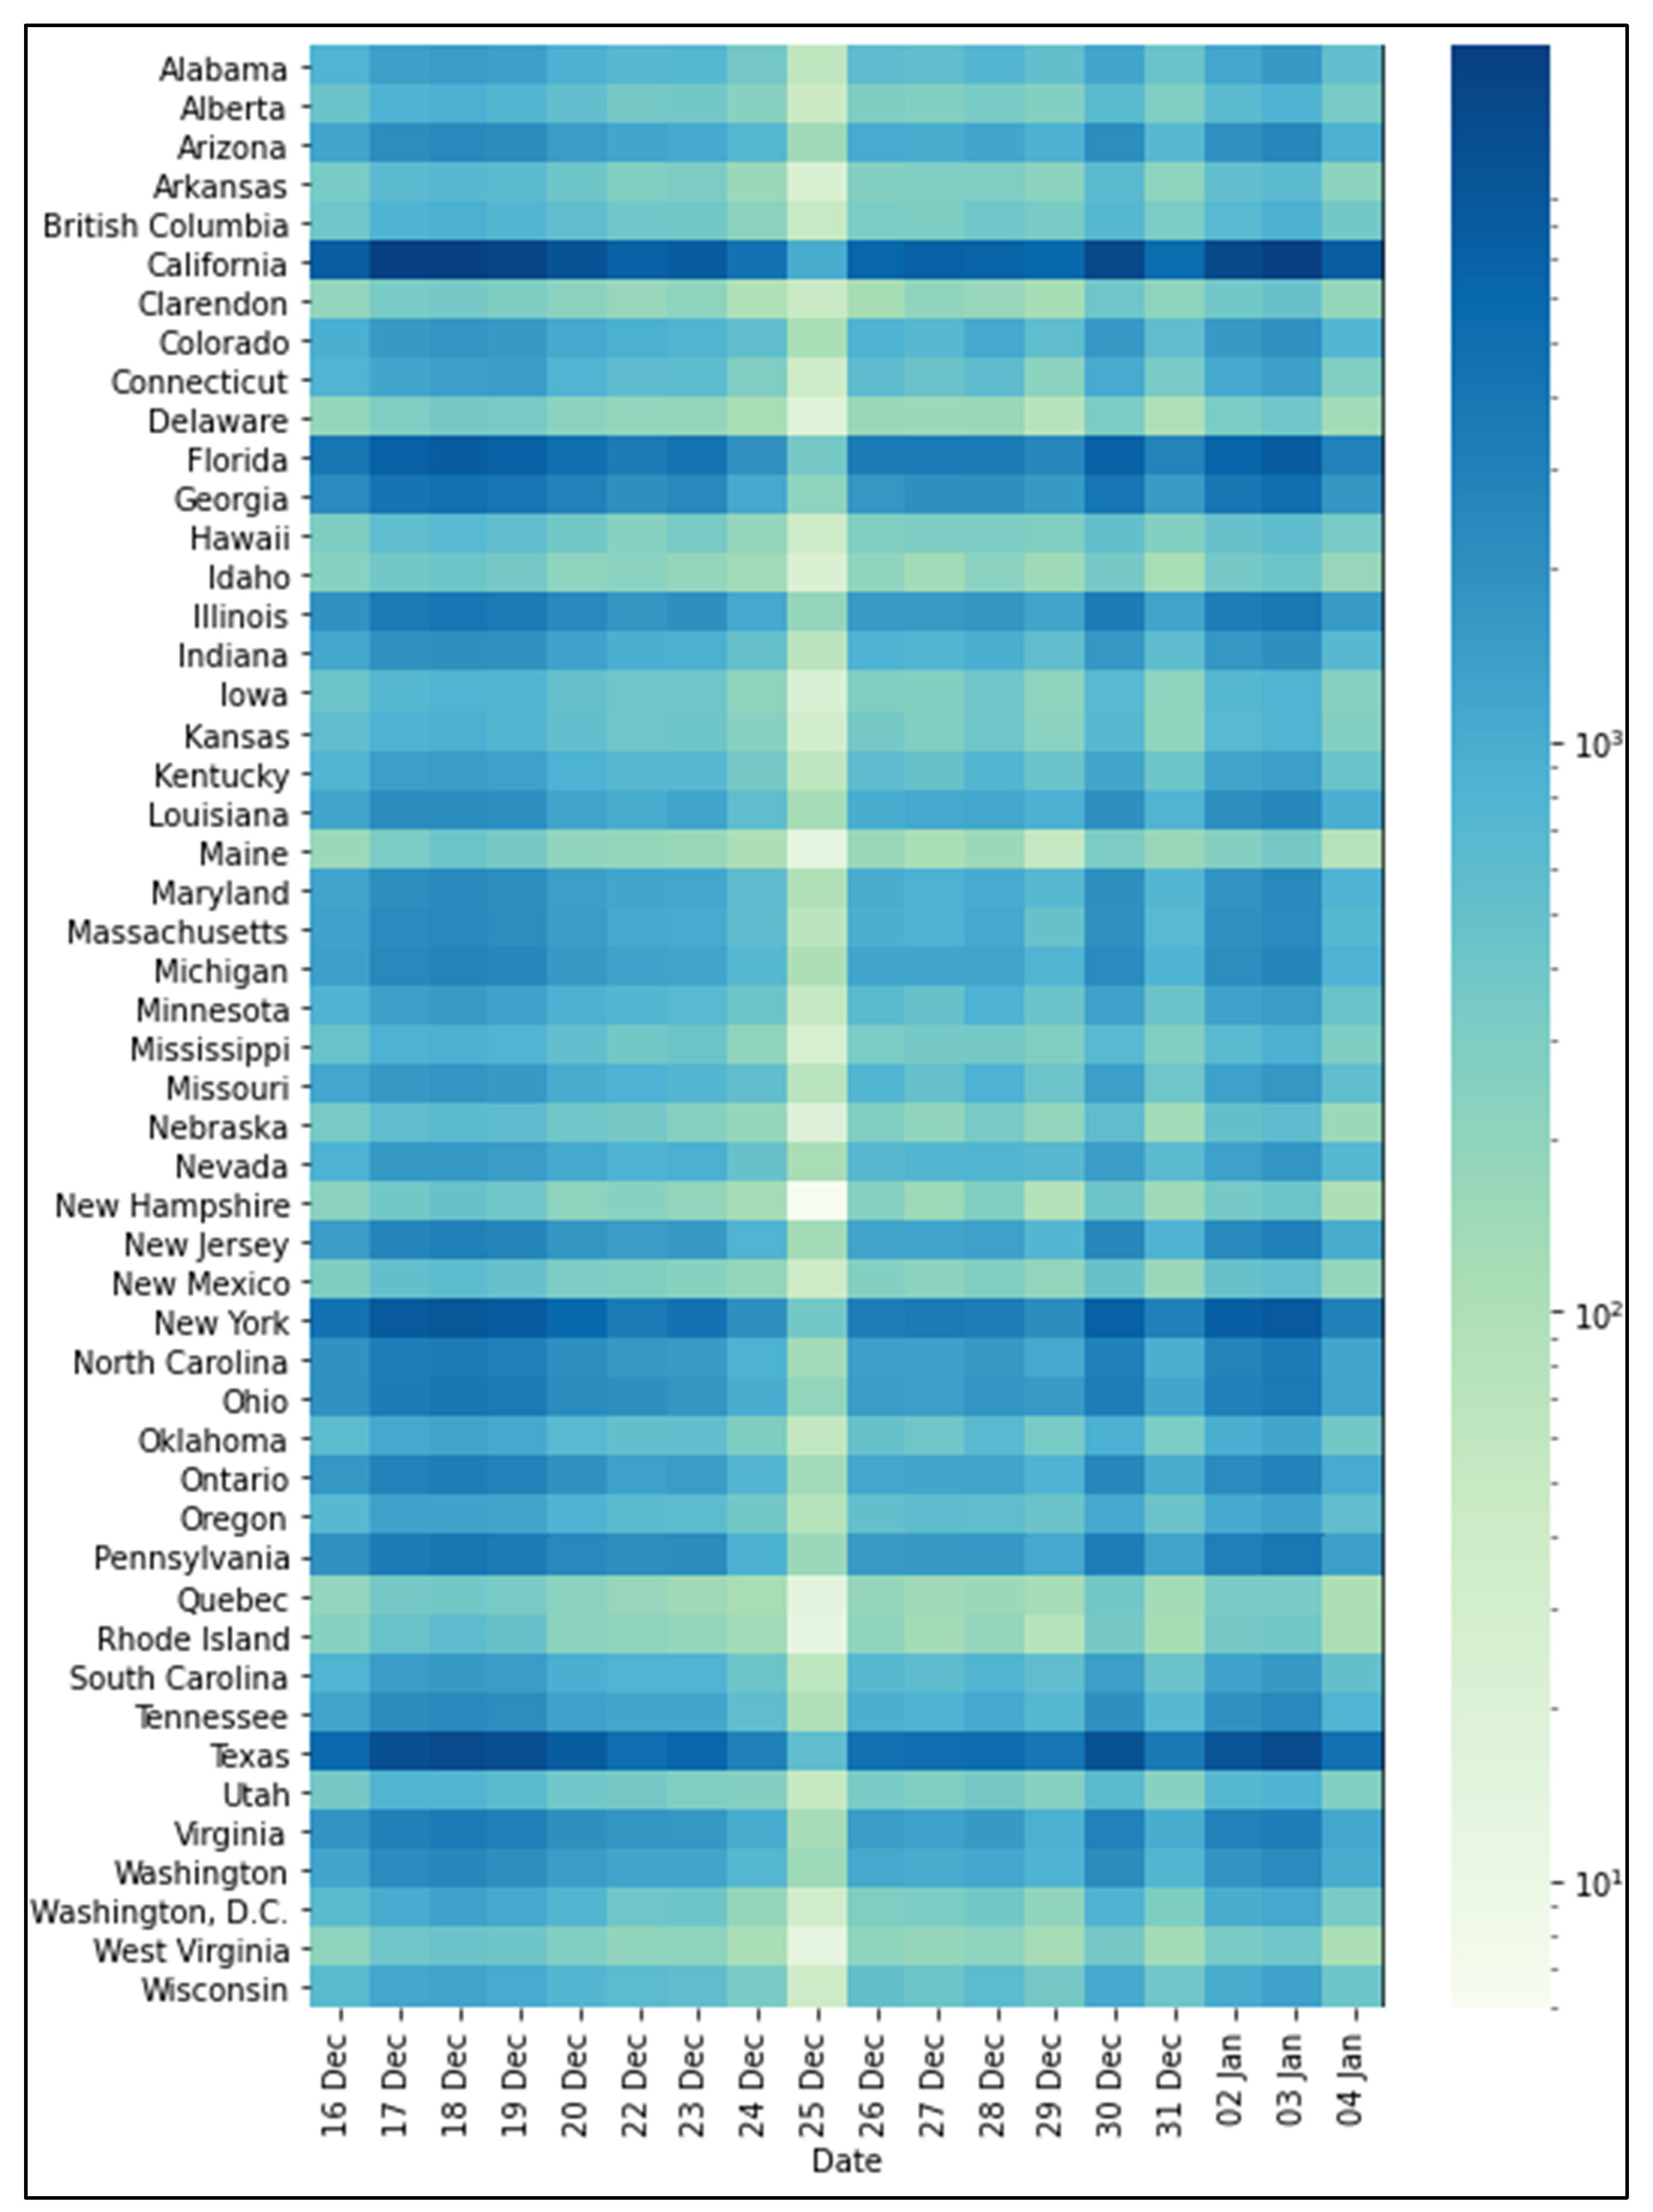
Spatio-temporal distribution of tweeting activities can broaden the understanding of the credibility and representativeness of the datasets being used for the analyses over space and time. Due to the limitation of measuring the statistically significant difference mathematically over different categories across different places, visual inspection was adopted, and almost identical spatio-temporal distribution patterns were observed over across all categories i.e., shared mobility, vehicle technology, built environment, user fees, telecommuting, and e-commerce (Figure 5). Figure 5 is a two-dimensional representation of tweeting activities based on tweet originating dates and the most frequent 50 locations (state-level).
Places such as California, Florida, Georgia, Illinois, New York, North Carolina, Ohio, Pennsylvania, Texas, Virginia, and Washington were among the most frequent locations and generated around 10 thousand tweets daily on emerging transportation trends. People from these locations were likely to be more expressive of emerging mobility trends through social media interactions as evident from Twitter. In contrast, places such as Alberta, Clarendon, Delaware, Hawaii, Maine, Nebraska, New Hampshire, New Mexico, Quebec, Rhode Island, Utah, and West Virginia generated as low as only around 1.5 thousand tweets per day on emerging trends. Other locations that appear in Figure 5 represent moderate levels of concern among social media users (around 3–10 thousand tweets on average). Locations that do not appear in Figure 5 were inactive with less than 100 tweets a day. These findings indicate spatial diversity of the transportation-related needs and concerns people express through social media channels and the need to utilize such information to develop new policies meeting the diverse needs people may have in different locations. Moreover, the temporal patterns for almost all locations indicate people were less expressive of such concerns during and immediately before/after a government holiday such as Christmas and New Year.

5.2. Temporal Heatmaps of Tweet Keywords

To delve deeper into the understanding of social media interactions on different categories, i.e., shared mobility, vehicle technology, built environment, user fees, telecommuting, and e-commerce, temporal heatmaps of tweet keywords were generated (Figure 6).
The word frequencies in the heatmaps indicates that people tweeted more about user fees and e-commerce, followed by vehicle technology, telecommuting, built environment, and shared mobility. This indicates the potential to utilize such information to rank people’s social media interactions and leverage social sharing platforms to promote user interests in emerging trends based on similar word clustering. A closer look at the word heatmaps by categories shows the following findings:
  • Shared Mobility:
    • ‘car’, ‘share’, and ‘ride’ showed strong presence, followed by ‘uber’, ‘bike’, ‘bird’, and ‘shared’;
    • ‘Uber’ was more popular than ‘Lyft’;
    • Emerging platforms such as ‘vanpool, ‘bikeshare, ‘escooter’, ‘uberpool’ were found less frequent on Twitter;
    • ‘bike’ and ‘bicycle’ showed less prominence compared to ‘car’. This is indicative of the need to leverage social media for bike-sharing.
  • Vehicle Technology:
    • ‘energy’ was highly prominent. This is a commonly used word, also a fuel-efficient transportation platform;
    • ‘drive’, ‘google’, ‘intelligence’, ‘connect’ also showed strong presence, followed by ‘tesla’, ‘electric’, ‘map’, ‘connected’, and ‘hybrid;’
    • ‘electric’ was more popular than ‘hybrid;’
    • emerging platforms such as ‘automation’, ‘artificial’, ‘automated’, ‘autonomous’ were found less frequent on Twitter.
‘Hybrid’ and ‘autonomous’ showed less prominence relative to ‘energy’. This is indicative of the need to leverage social media for hybrid and autonomous transport.
  • Built Environment:
    • ‘work’ was highly prominent;
    • ‘stop’, ‘office’, ‘bar’ also showed strong presence, followed by ‘station’, ‘shop’, ‘land’;
    • ‘bus’ was more popular than ‘rail’;
    • ‘dropoff’ showed less prominence. This is indicative of the need to leverage social media for online shopping.
  • User Fees:
    • ‘tax’ was highly prominent;
    • ‘market’, ‘gas’, ‘price’, ‘charge’ also showed strong presence, followed by ‘lane’, ‘express’, ‘duty’, and ‘booth;’
    • Financial activities such as ‘levy’, ‘liter’, ‘tariff’ were found less frequent on Twitter;
    • ‘toll’ and ‘tariff’ showed less prominence relative to ‘tax’. This is indicative of the need to leverage social media for the charge on using bridges or roads and the duty on imports and exports.
  • Telecommuting:
    • ‘job’ is highly prominent. This is also an important telecommuting platform;
    • ‘video’, ‘hours’, ‘phone’, ‘voice’ also showed strong presence, followed by ‘dollar’, ‘mobile’, ‘screen’, and ‘technology;’
    • emerging platforms such as ‘freelance’, ‘outwork’, ‘telework’, ‘yammer’ was found less frequent on Twitter;
    • ‘zoom’ showed less prominence relative to ‘phone’. This is indicative of the need to leverage social media for zoom meetings.
  • Ecommerce
    • ‘wish’ was highly prominent. This is a popular e-commerce platform;
    • ‘sale’, ‘online’, ‘trade’, ‘internet’ also showed strong presence, followed by ‘retail’, ‘amazon’, ‘delivery’, ‘target’;
    • ‘Walmart’ was more popular than ‘Publix;’
    • platforms such as ‘home depot’, ‘BestBuy’, ‘paperless’ were found less frequent on Twitter;
    • ‘Walmart’ was less frequent relative to ‘amazon’. This is indicative of the popularity of ‘amazon’ over ‘Walmart’ as an e-commerce platform.

5.3. Sentiment Analysis

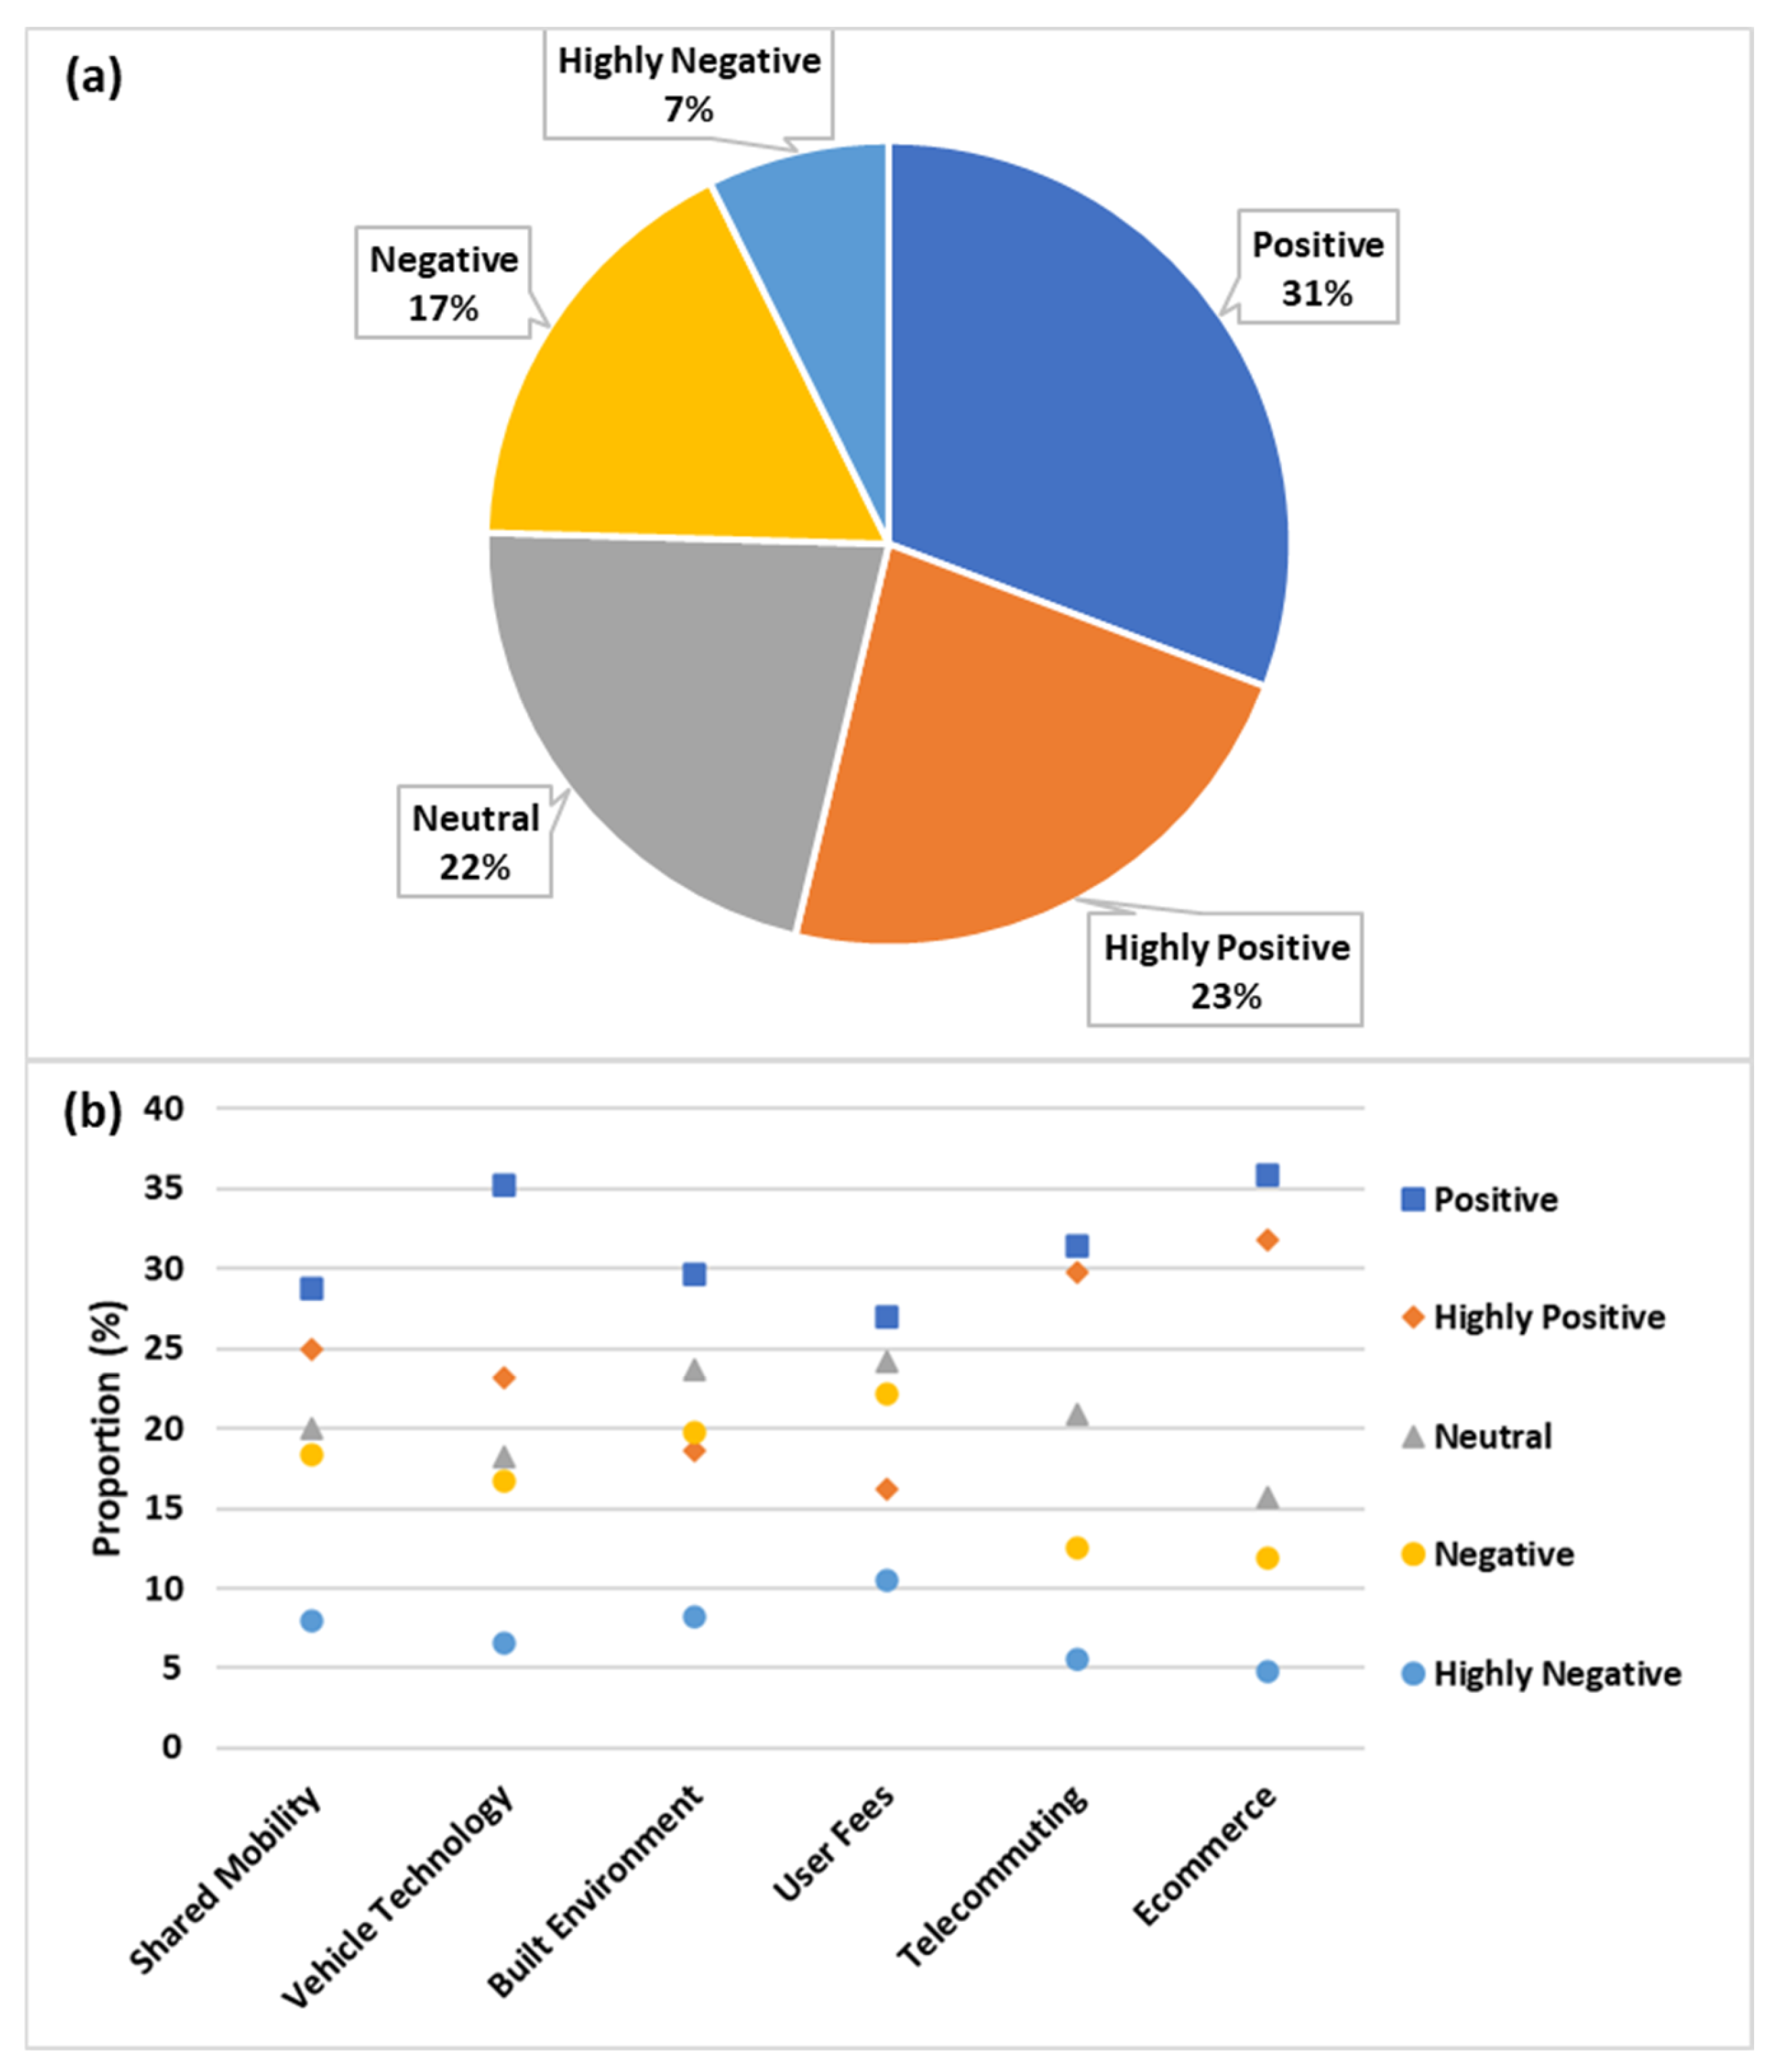
While the heatmaps of tweeting keywords provided the significance of individual keywords representing social media user concerns on transportation and mobility trends, the combined effects of multiple words in each tweet were analyzed to quantify user emotion or sentiments based on such interactions. Sentiment analyses of tweets were performed by the VADER python package and corresponding user sentiments were reported as highly negative, negative, neutral, positive, and highly positive. Sentiment or opinion mining results are presented in Figure 7 and Figure 8 for each category i.e., shared mobility, vehicle technology, built environment, user fees, telecommuting, and e-commerce. While Figure 7a shows the distribution of relative sentiments i.e., percentage distribution of five different sentiment types for all the relevant tweets, Figure 7b presents the distribution of relative sentiments i.e., percentage distribution of five different sentiment types for all the six categories. Figure 8 presents the percentage distribution of five different sentiment types at the top 50 tweeting locations (state level) for all the six categories i.e., sentiments over space. Larger visuals for Figure 8 for each category can be found in Supplementary Figures S1–S6. A few key observations from Figure 7a,b are summarized here:
  • Overall, around one-third of the relevant tweets are positive, and about one-fifth expressed highly positive views. Around 24% of tweets showed a negative view (negative and highly negative);
  • At the individual category level, most of the tweets are positive, and the least of the tweets are highly negative which reflects people’s positive attitude towards the studied emerging transportation trends;
  • While shared mobility, vehicle technology, telecommuting, and ecommerce have a higher proportion of positive tweets than negative tweets, built environment and user fees showed opposite scenarios. This indicates the necessity of taking appropriate steps to improve facilities in the areas of built environment and user fees;
  • Vehicle technology and ecommerce have the highest proportion of positive tweets among all the categories which represents people’s higher satisfaction with these emerging mobility trends. Rapid advancements in available facilities in these sectors are probably the reasons behind this higher public satisfaction;
  • User fees have the least proportion of positive tweets and the highest proportion of negative and highly negative tweets among all the categories which represents people’s unsatisfactory attitude towards this sector of emerging mobility trend. Authorities should take steps to improve the facilities of this sector to gain people’s satisfaction.
A few key observations from Figure 8 are summarized here:
  • Most of the tweets on shared mobility showed positive and highly positive views in almost all the places. However, places such as Arkansas, Clarendon, Georgia, Louisiana, and Mississippi showed some exceptions, generating a relatively higher proportion of neutral and negative tweets which reflects the people’s less positive attitude towards shared mobility in these places. Necessary steps should be taken to improve the facilities in this sector of emerging mobility trends at these places;
  • Though tweets on vehicle technology also showed an almost similar trend such as shared mobility at different places, places such as Alabama, Connecticut, Delaware, Rhode Island, and West Virginia generated a relatively higher proportion of neutral and negative tweets. Authorities in these places should plan accordingly to introduce facilities of this sector of emerging mobility trends to attain people’s positive attitudes;
  • In the case of the built environment, though most of the tweets are positive over different places, there is also a higher proportion of neutral and negative tweets in many places concerning other categories (except user fees);
  • In most places, tweets are more likely positive, neutral, and negative on user fees. Even places such as Rhode Island, Washington, Colorado generated a higher proportion of negative tweets than other sentiment types. Necessary steps should be taken to improve the facilities in this sector of emerging mobility trends at these places;
  • Telecommuting and E-commerce showed similar patterns over different places. In all places, tweets showed mostly positive and highly positive views and there are a very small proportion of neutral, negative, and highly negative tweets. Rapid advancements in available facilities in these sectors of emerging mobility trends are probably the reasons behind this higher public satisfaction;
  • Overall, most locations showed a more positive attitude towards shared mobility, vehicle technology, telecommuting, and e-commerce, whereas relatively more negative on the built environment and user fees.
These findings indicate the need to design and implement more dedicated and targeted efforts to improve public satisfaction on certain transportation aspects based on quantitative evidence observed through social media interactions.

5.4. Topic Modeling

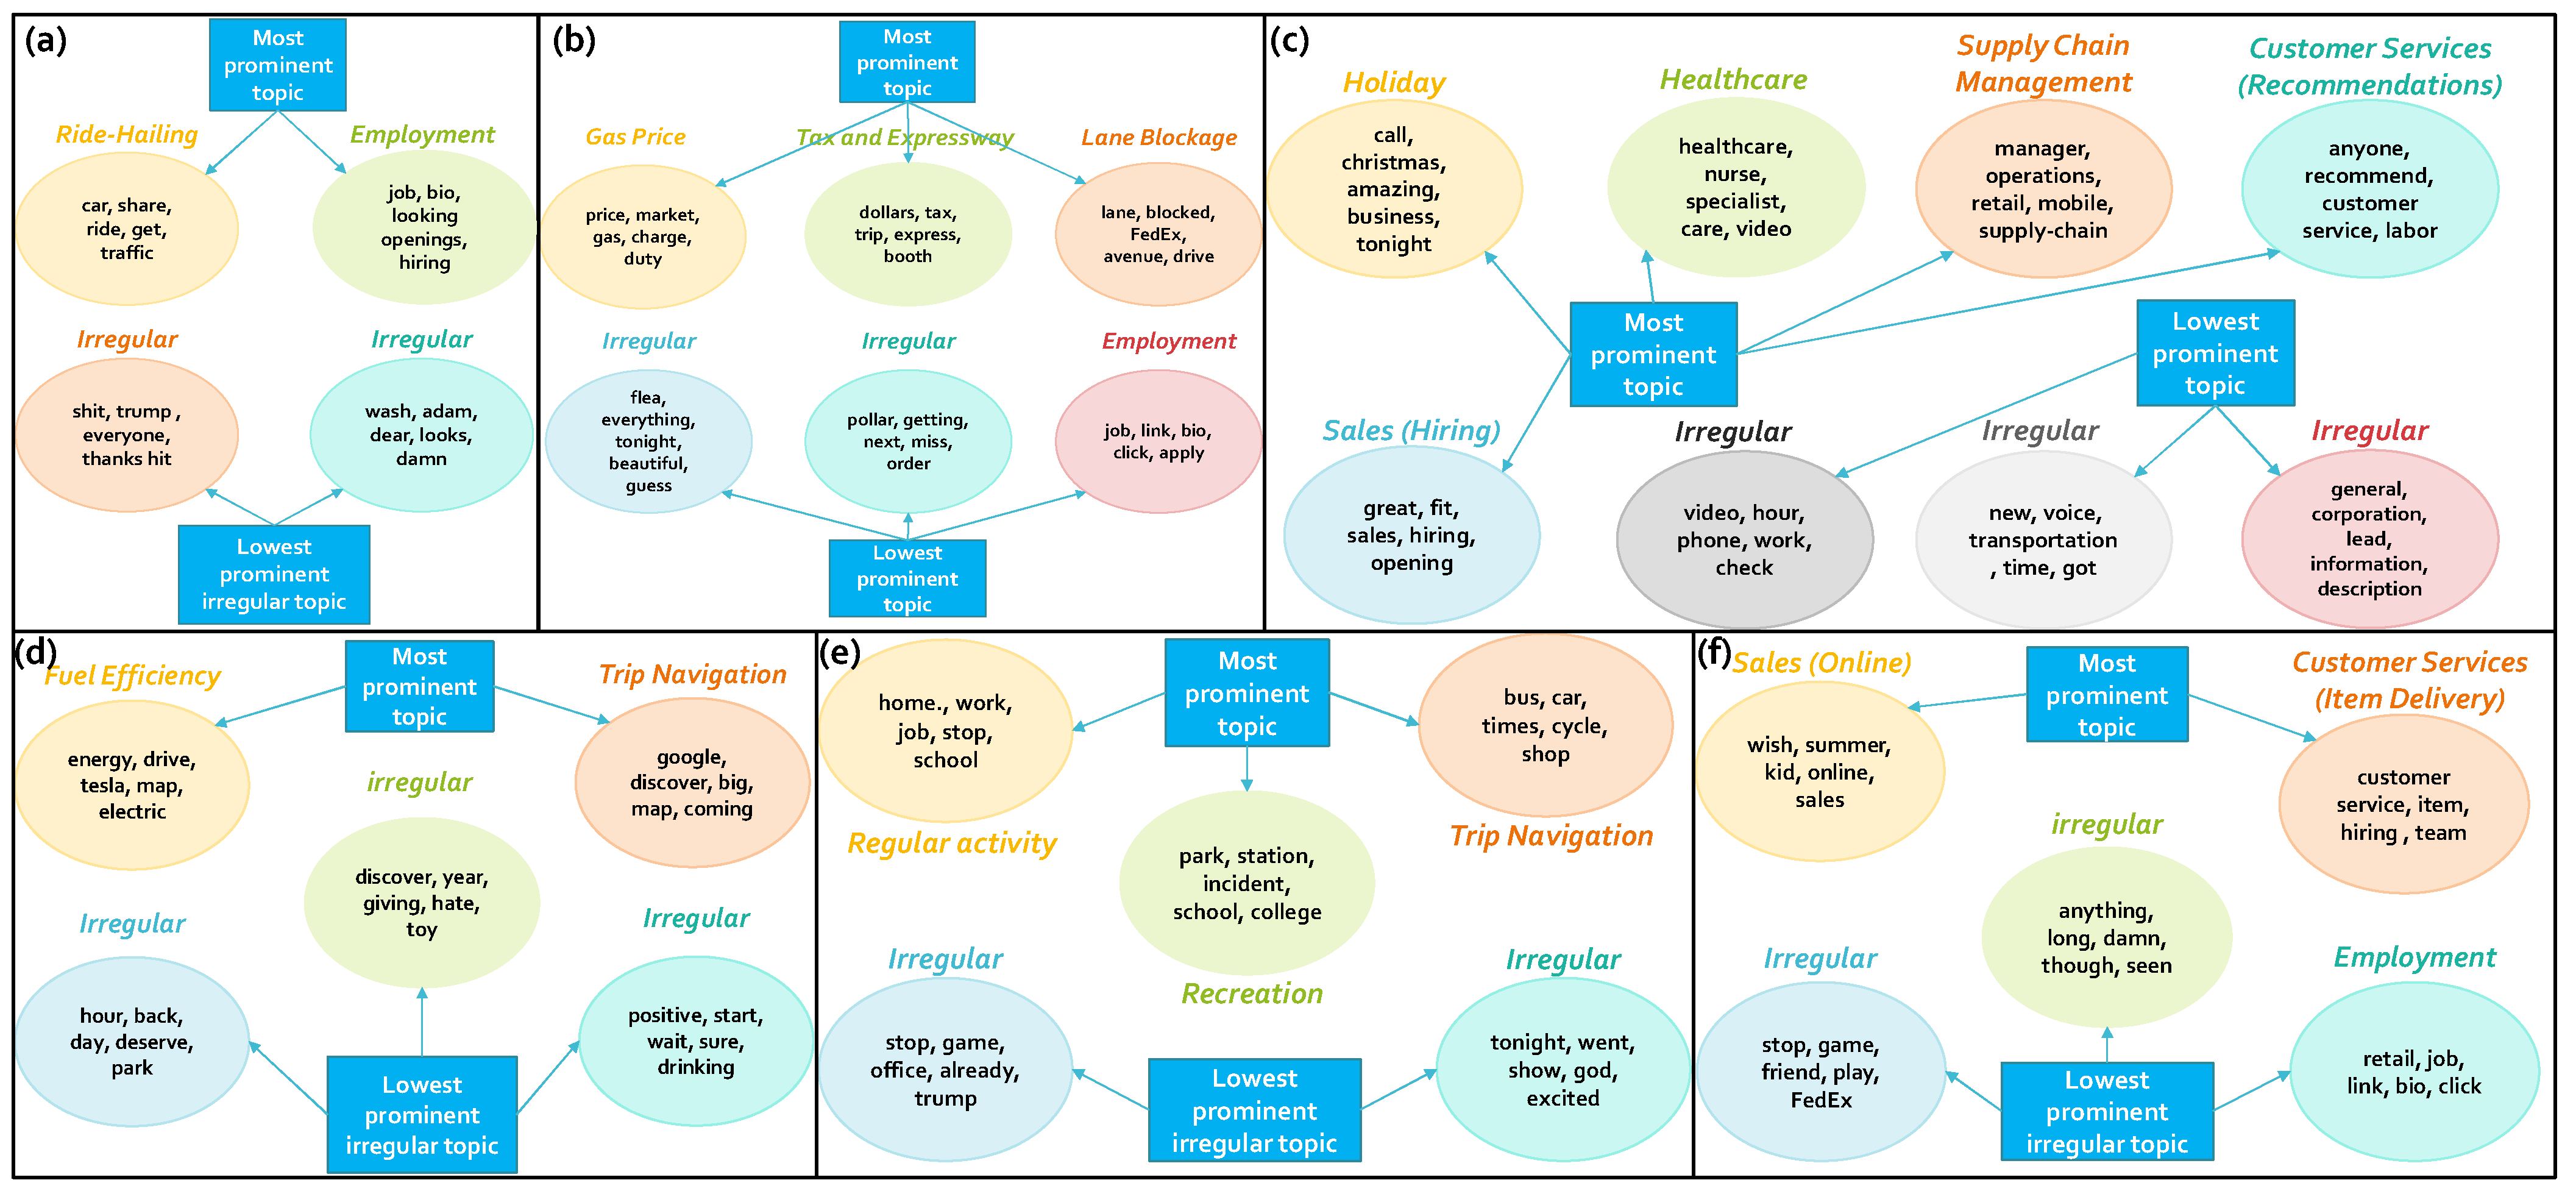
Topic modeling analysis was applied to investigate how different combinations of words in the data may constitute social interaction topics of transportation trends. While sentiment analyses helped to quantify positive, neutral, or negative attitudes of social media users, topic models typically provide more insights on the actual topics that exist in text data. Topic coherence means the average/median of the pairwise word-similarity scores of the words in the topic, and has been used to specify the number of unique topics [44]. A good topic modeling depends on the higher coherence which depends on two predefined parameters: (a) number of topics; (b) number of iterations. The optimal number of topics and iteration was estimated after several trials. The tentative generated topics (in total 33) for six categories are presented in Figure 9.
Among these 33 topics, some are relevant, and some are irrelevant to this study. Finally, a total of 17 topics were identified as relevant to different emerging transportation trends which have been reported in Table 2. Table 2 reports the topic modeling coherence score for each category as well as the probable interaction topics with their probability in that category. Topic probability represents the probabilistic distribution of all the tweets in a certain category of transportation trend among different topics generated by topic modeling. For example, “Ride-Hailing” has a topic probability of 0.472 in the “Shared Mobility” category. This indicates that 47.2% of tweets in “Shared Mobility” are expected to discuss ride-hailing.
Moreover, only the five most frequent associated words contributing to the formation of a topic with their probability in that topic (in brackets) were reported in Table 2 for illustration purposes. A topic consists of hundreds of words depending on the volume of datasets. As a result, the word probability in a certain topic for a given word may be very small. However, the reported five most frequent words in Table 2 for a certain topic have significantly higher probability values than the remaining words in that topic.
People primarily mentioned ride-hailing and employment opportunities as part of shared mobility. On vehicle technology, interactions mainly included topics on fuel efficiency and trip navigations. Regular activities on a day-to-day basis are among the built environment topics in addition to shopping and recreational activities. Under the user fees category, people were more concerned about gas price, tax, and expressways along with their probable frustration towards lane blocks while driving. On telecommuting, people talked more about the holiday season and healthcare activities, customer services related to item delivery were among the predominant topics on e-commerce. Such topics and associated words provide better insights on how to identify and connect to social media users based on their topics of interest and the use of specific keywords that can maximize influence.

5.5. Study Limitations and Future Research Directions

These study results showed that there seem to be significant potentials for using social media data to develop models for the identification of emerging transportation indicators and long-term planning purposes. However, it is acknowledged that small events that are retweeted several times may affect the collected dataset. Future studies should address these issues to eliminate biases due to such small events. Moreover, due to issues with user privacy that limit the availability of personal information, there is usually insufficient information on social media users to detect biases in any given subject’s sample population. Further studies are needed to consider the user’s profile background (e.g., gender, race) in the analysis to reduce the sample population biases.
Twitter users include people, news organizations, companies, and, perhaps most troublingly, are not always human. Previous research has shown that Twitter includes many bots that automatically send tweets, mostly to promote a product or a political campaign [45]. The elimination of these tweets is not achieved in this study, but several methods for finding them have been proposed [46,47,48]. So special caution is required to the biases associated with social media data in future studies.
Another limitation is that Twitter data was not able to collect all the tweets during that period as the streaming API was used for collecting tweets. As that specific API does not allow collecting all data. To make this type of online social media research more authentic and comprehensive, a different type of paid Twitter API (Power track, Enterprise) and other social media platforms (Facebook, LinkedIn, etc.) can also be used for future research which will collect most of the tweets.
In this study, no spatial analyses using spatial statistics have been performed. Further analyses are suggested using spatial statistics that will allow for better understanding of the spatial distribution of emerging transportation trends using twitter data. This will lead to new perspectives of decision making for the researchers, professionals, etc. This sort of spatial strategy, visualization, and statistical data may assist in making data-driven planning decisions [49].

6. Conclusions

Transportation researchers in recent times have used SMPs extensively for problems related to travel demand forecasting, activity pattern modeling, transit service assessment, traffic incident, and disaster management, among others. Yet, there is still much more to explore how such information can contribute towards understanding public perception and attitude towards emerging transportation trends and mobility indicators. As such, the goal of this study is to mine and analyze large-scale public interactions from SPMs enriched with time and location information and develop comparative infographics of emerging transportation trends and mobility indicators using natural language processing and data-driven techniques.
About 13 million tweets for about 20 days (16 December 2019–4 January 2020) were collected using Twitter API. Tweets closely aligned with emerging transportation and mobility trends such as shared mobility, vehicle technology, built environment, user fees, telecommuting, and e-commerce were identified. Data analytics captured spatio-temporal differences in social media user interactions and concerns about such trends as well as topics of discussions formed through such interactions. California, Florida, Georgia, Illinois, New York, North Carolina, Ohio, Pennsylvania, Texas, Virginia, and Washington are among the highly visible cities discussing such trends. Key observations from sentiment analysis indicate that around one-third of the relevant tweets are positive and about one-fifth expressed highly positive views. Moreover, around 24% of tweets showed negative views (negative and highly negative). People carried more positive views on shared mobility, vehicle technology, telecommuting, and e-commerce while being more negative on user fees, and built environment. Analysis of sentiment over space showed that most locations showed a more positive attitude towards shared mobility, vehicle technology, telecommuting, and e-commerce, whereas attitude was relatively more negative on the built environment and user fees. These findings show the need to create and implement more committed and targeted measures to increase public satisfaction on certain emerging transportation trends at different places.
Topic modeling analysis identified 17 topics related to transportation trends. Ride-hailing, fuel efficiency, trip navigation, daily as well as shopping and recreational activities, gas price, tax, product delivery were among the topics. Specifically, people primarily mentioned ride-hailing and employment opportunities as part of shared mobility. On vehicle technology, interactions mainly included topics on fuel efficiency and trip navigations. Regular activities on a day-to-day basis are among the built environment topics in addition to shopping and recreational activities. Under the user fees category, people were more concerned about gas price, tax, and expressways along with their probable frustration towards lane blocks while driving. On telecommuting, people talked more about the holiday season and healthcare activities, customer services related to item delivery were among the predominant topics on e-commerce. Such topics and associated words provide better insights on how to identify and connect to social media users based on their topics of interest and the use of specific keywords that can maximize influence. The above-listed topics and information can help transportation planners and policymakers systematically make better and timely decisions while facing future transportation demand for emerging technology. This will lead to a step forward in understanding the need for a modern transportation system to reduce dependency on fossil fuel, controlling climate changes, reducing traffic jams and accidents while increasing the reliability of the transportation system.
This study for the first time introduced a social media data-driven framework that would allow real-time monitoring of transportation trends by agencies, researchers, and professionals. A better understanding of the demands and viewpoints of users may help with public transportation planning, management, and supervision, as well as achieving transportation policy objectives. Moreover, exploration of acquired data through spatio-temporal analysis of tweeting activity and tweet sentiments might give significant instruments for policy exercise and evaluation by building and strengthening the participative process in citizens’ digital societies. Potential applications of the work may include: (1) identify spatial diversity of public mobility needs and concerns through social media channels; (2) develop new policies that would satisfy the diverse needs at different locations; (3) leverage SMPs to promote user interests on emerging trends based on similar word clustering; (4) design and implement more efficient strategies to improve and influence public interest and satisfaction. While data biases may exist in such an approach, however, large-scale observations from SMPs would help to predict convincing patterns with heightened statistical power.

Supplementary Materials

The following are available online at https://www.mdpi.com/article/10.3390/futuretransp1030044/s1, Figure S1: Sentiment Analysis over Space for six categories: Shared Mobility, Figure S2. Sentiment Analysis over Space for six categories: Vehicle Technology, Figure S3. Sentiment Analysis over Space for six categories: Built Environment, Figure S4. Sentiment Analysis over Space for six categories: User Fees, Figure S5. Sentiment Analysis over Space for six categories: Telecommuting, Figure S6. Sentiment Analysis over Space for six categories: Ecommerce.

Author Contributions

Conceptualization, M.R.A., A.M.S. and X.J.; writing—original draft preparation, M.R.A.; data curation, M.R.A.; formal analysis, M.R.A.; software, M.R.A.; visualization, M.R.A.; methodology, M.R.A.; writing—review and editing, A.M.S. and X.J.; supervision, A.M.S. and X.J. All authors have read and agreed to the published version of the manuscript.

Funding

This research is funded by Florida Department of Transportation (BDV29 977-53). The opinions, findings, and conclusions expressed in this publication are those of the authors and not necessarily those of the Florida Department of Transportation or the U.S. Department of Transportation.

Institutional Review Board Statement

Not applicable.

Informed Consent Statement

Not applicable.

Data Availability Statement

The data that support the findings of this study are available from the corresponding author, A.M. Sadri, upon reasonable request.

Conflicts of Interest

The authors declare that they have no known competing financial interests or personal relationships that could have appeared to influence the work reported in this paper.

References

  1. Meyer, M.; Flood, M.; Keller, J.; Lennon, J.; McVoy, G.; Dorney, C.; Leonard, K.; Hyman, R.; Smith, J. Strategic Issues Facing Transportation, Volume 2: Climate Change, Extreme Weather Events, and the Highway System: Practitioner’s Guide and Research Report; No. Project 20-83 (5); Transportation Research Board of The National Academies: Washington, DC, USA, 2014. [Google Scholar] [CrossRef]
  2. Popper, S.W.; Kalra, N.; Silberglitt, R.; Molina-Perez, E.; Ryu, Y.; Scarpati, M. Strategic Issues Facing Transportation, Volume 3: Expediting Future Technologies for Enhancing Transportation System Performance; No. Project 20-83 (2); Transportation Research Board of The National Academies: Washington, DC, USA, 2013. [Google Scholar] [CrossRef]
  3. Zmud, J.; Barabba, V.P.; Bradley, M.; Kuzmyak, J.R.; Zmud, M.; Orrell, D. Strategic Issues Facing Transportation, Volume 6: The Effects of Socio-Demographics on Future Travel Demand; National Academies Press: Washington, DC, USA, 2014. [Google Scholar]
  4. Cheng, L.; De Vos, J.; Shi, K.; Yang, M.; Chen, X.; Witlox, F. Do Residential Location Effects on Travel Behavior Differ between the Elderly and Younger Adults? Transp. Res. Part D Transp. Environ. 2019, 73, 367–380. [Google Scholar] [CrossRef]
  5. Wang, D.; Zhou, M. The Built Environment and Travel Behavior in Urban China: A Literature Review. Transp. Res. Part D Transp. Environ. 2017, 52, 574–585. [Google Scholar] [CrossRef]
  6. Lin, T.; Wang, D.; Guan, X. The Built Environment, Travel Attitude, and Travel Behavior: Residential Self-Selection or Residential Determination? J. Transp. Geogr. 2017, 65, 111–122. [Google Scholar] [CrossRef]
  7. Wang, D.; Lin, T. Built Environment, Travel Behavior, and Residential Self-Selection: A Study Based on Panel Data from Beijing, China. Transportation 2019, 46, 51–74. [Google Scholar] [CrossRef]
  8. Cheng, L.; Chen, X.; Lam, W.H.K.; Yang, S.; Wang, P. Improving Travel Quality of Low-Income Commuters in China: Demand-Side Perspective. Transp. Res. Rec. 2017, 2605, 99–108. [Google Scholar] [CrossRef]
  9. Figueroa, M.J.; Nielsen, T.A.S.; Siren, A. Comparing Urban Form Correlations of the Travel Patterns of Older and Younger Adults. Transp. Policy 2014, 35, 10–20. [Google Scholar] [CrossRef]
  10. Scheiner, J.; Holz-Rau, C. Gendered Travel Mode Choice: A Focus on Car Deficient Households. J. Transp. Geogr. 2012, 24, 250–261. [Google Scholar] [CrossRef]
  11. Pacheco, E. COVID-19’s Impact on Social Media Usage. Available online: https://www.thebrandonagency.com/blog/covid-19s-impact-on-social-media-usage/ (accessed on 5 July 2021).
  12. Golder, S.A.; Macy, M.W. Digital Footprints: Opportunities and Challenges for Online Social Research. Annu. Rev. Sociol. 2014, 40, 129–152. [Google Scholar] [CrossRef] [Green Version]
  13. Yin, Z.; Fabbri, D.; Rosenbloom, S.T.; Malin, B. A Scalable Framework to Detect Personal Health Mentions on Twitter. J. Med. Internet Res. 2015, 17, e138. [Google Scholar] [CrossRef] [PubMed]
  14. Tasse, D.; Hong, J.I. Using Social Media Data to Understand Cities. 2014. Available online: https://kilthub.cmu.edu/articles/journal_contribution/Using_Social_Media_Data_to_Understand_Cities/6470645/1 (accessed on 5 July 2021).
  15. Liao, Y.; Yeh, S.; Gil, J. Feasibility of Estimating Travel Demand Using Geolocations of Social Media Data. Transportation 2021, 1–25. [Google Scholar] [CrossRef]
  16. Cheng, Z.; Caverlee, J.; Lee, K.; Sui, D. Exploring Millions of Footprints in Location Sharing Services. In Proceedings of the International AAAI Conference on Web and Social Media, Catalonia, Spain, 17–21 July 2011; Volume 5. [Google Scholar]
  17. Jurdak, R.; Zhao, K.; Liu, J.; AbouJaoude, M.; Cameron, M.; Newth, D. Understanding Human Mobility from Twitter. PLoS ONE 2015, 10, e0131469. [Google Scholar] [CrossRef]
  18. Noulas, A.; Scellato, S.; Lambiotte, R.; Pontil, M.; Mascolo, C. A Tale of Many Cities: Universal Patterns in Human Urban Mobility. PLoS ONE 2012, 7, e37027. [Google Scholar] [CrossRef]
  19. Hasan, S.; Ukkusuri, S.V. Location Contexts of User Check-Ins to Model Urban Geo Life-Style Patterns. PLoS ONE 2015, 10, e0124819. [Google Scholar] [CrossRef] [PubMed]
  20. Hasan, S.; Ukkusuri, S.V. Urban Activity Pattern Classification Using Topic Models from Online Geo-Location Data. Transp. Res. Part C Emerg. Technol. 2014, 44, 363–381. [Google Scholar] [CrossRef]
  21. Üsküplü, T.; Terzi, F.; Kartal, H. Discovering Activity Patterns in the City by Social Media Network Data: A Case Study of Istanbul. Appl. Spat. Anal. Policy 2020, 13, 945–958. [Google Scholar] [CrossRef]
  22. Schweitzer, L. Planning and Social Media: A Case Study of Public Transit and Stigma on Twitter. J. Am. Plan. Assoc. 2014, 80, 218–238. [Google Scholar] [CrossRef]
  23. Pender, B.; Currie, G.; Delbosc, A.; Shiwakoti, N. Social Media Use during Unplanned Transit Network Disruptions: A Review of Literature. Transp. Rev. 2014, 34, 501–521. [Google Scholar] [CrossRef]
  24. Luong, T.T.B.; Houston, D. Public Opinions of Light Rail Service in Los Angeles, an Analysis Using Twitter Data. In Proceedings of the IConference 2015 Proceedings, Newport Beach, CA, USA, 24–27 March 2015. [Google Scholar]
  25. Haghighi, N.N.; Liu, X.C.; Wei, R.; Li, W.; Shao, H. Using Twitter Data for Transit Performance Assessment: A Framework for Evaluating Transit Riders’ Opinions about Quality of Service. Public Transp. 2018, 10, 363–377. [Google Scholar] [CrossRef]
  26. Tian, Y.; Zmud, M.; Chiu, Y.-C.; Carey, D.; Dale, J.; Smarda, D.; Lehr, R.; James, R. Quality Assessment of Social Media Traffic Reports–A Field Study in Austin, Texas. In Proceedings of the Transportation Research Board 95th Annual Meeting, Washington, DC, USA, 10–14 January 2016. [Google Scholar]
  27. Steur, R. Twitter as a Spatio-Temporal Information Source for Traffic Incident Management. Geogr. Inf. Manag. Appl. 2014. [Google Scholar]
  28. Wang, Q.; Taylor, J.E. Quantifying Human Mobility Perturbation and Resilience in Hurricane Sandy. PLoS ONE 2014, 9, e112608. [Google Scholar] [CrossRef] [PubMed]
  29. Wang, Q.; Taylor, J.E. Resilience of Human Mobility under the Influence of Typhoons. Procedia Eng. 2015, 118, 942–949. [Google Scholar] [CrossRef] [Green Version]
  30. Sadri, A.M.; Hasan, S.; Ukkusuri, S.V.; Cebrian, M. Crisis Communication Patterns in Social Media during Hurricane Sandy. Transp. Res. Rec. 2018, 2672, 125–137. [Google Scholar] [CrossRef] [Green Version]
  31. Roy, K.C.; Hasan, S.; Sadri, A.M.; Cebrian, M. Understanding the Efficiency of Social Media Based Crisis Communication during Hurricane Sandy. Int. J. Inf. Manag. 2020, 52, 102060. [Google Scholar] [CrossRef]
  32. Yao, W.; Qian, S. From Twitter to Traffic Predictor: Next-Day Morning Traffic Prediction Using Social Media Data. Transp. Res. Part C Emerg. Technol. 2021, 124, 102938. [Google Scholar] [CrossRef]
  33. Salazar-Carrillo, J.; Torres-Ruiz, M.; Davis, C.A.; Quintero, R.; Moreno-Ibarra, M.; Guzmán, G. Traffic Congestion Analysis Based on a Web-GIS and Data Mining of Traffic Events from Twitter. Sensors 2021, 21, 2964. [Google Scholar] [CrossRef]
  34. Cui, Y.; Meng, C.; He, Q.; Gao, J. Forecasting Current and next Trip Purpose with Social Media Data and Google Places. Transp. Res. Part C Emerg. Technol. 2018, 97, 159–174. [Google Scholar] [CrossRef]
  35. Twitter Developers. Available online: https://developer.twitter.com/en/portal/projects-andapps (accessed on 4 January 2020).
  36. McDonald, D.D. Natural Language Generation. In Handbook of Natural Language Processing; Marcel Dekker Inc.: New York, NY, USA, 2010; Volume 2, pp. 121–144. [Google Scholar]
  37. GitHub-Cjhutto/vaderSentiment: VADER Sentiment Analysis. VADER (Valence Aware Dictionary and sEntiment Reasoner) is a Lexicon and Rule-Based Sentiment Analysis Tool that Is Specifically Attuned to Sentiments Expressed in Social Media, and Works Well on Texts from Other Domains. Available online: https://github.com/cjhutto/vaderSentiment (accessed on 1 August 2021).
  38. Hutto, C.J.; Gilbert, E. Vader: A parsimonious rule-based model for sentiment analysis of social media text. In Proceedings of the International AAAI Conference on Web and Social Media, Ann Arbor, MI, USA, 1–4 June 2014; Volume 8. [Google Scholar]
  39. Blei, D.M.; Ng, A.Y.; Jordan, M.I. Latent Dirichlet Allocation. J. Mach. Learn. Res. 2003, 3, 993–1022. [Google Scholar]
  40. Farrahi, K.; Gatica-Perez, D. Discovering Routines from Large-Scale Human Locations Using Probabilistic Topic Models. ACM Trans. Intell. Syst. Technol. 2011, 2, 1–27. [Google Scholar] [CrossRef] [Green Version]
  41. Huynh, T.; Fritz, M.; Schiele, B. Discovery of Activity Patterns Using Topic Models. In Proceedings of the UbiComp ‘08: The 10th International Conference on Ubiquitous Computing, Seoul, Korea, 21–24 September 2008; pp. 10–19. [Google Scholar] [CrossRef]
  42. Sun, L.; Yin, Y. Discovering Themes and Trends in Transportation Research Using Topic Modeling. Transp. Res. Part C Emerg. Technol. 2017, 77, 49–66. [Google Scholar] [CrossRef] [Green Version]
  43. Griffiths, T.L.; Steyvers, M. Finding Scientific Topics. Proc. Natl. Acad. Sci. USA. 2004, 101 (Suppl. 1), 5228–5235. [Google Scholar] [CrossRef] [PubMed] [Green Version]
  44. Ahmed, M.A.; Sadri, A.M.; Pradhananga, P.; Elzomor, M.; Pradhananga, N. Social Media Communication Patterns of Construction Industry in Major Disasters. In Construction Research Congress 2020: Computer Applications-Selected Papers from the Construction Research Congress 2020; American Society of Civil Engineers: Reston, VA, USA, 2020; pp. 678–687. [Google Scholar] [CrossRef]
  45. Howard, P.N.; Kollanyi, B. Bots, #Strongerin, and #Brexit: Computational Propaganda During the UK-EU Referendum. SSRN Electron. J. 2017. [Google Scholar] [CrossRef] [Green Version]
  46. Chu, Z.; Gianvecchio, S.; Wang, H.; Jajodia, S. Who Is Tweeting on Twitter: Human, Bot, or Cyborg? In Proceedings of the 26th Annual Computer Security Applications Conference, Austin, TX, USA, 6 December 2010; pp. 21–30. [Google Scholar] [CrossRef]
  47. Clark, E.M.; Williams, J.R.; Jones, C.A.; Galbraith, R.A.; Danforth, C.M.; Dodds, P.S. Sifting Robotic from Organic Text: A Natural Language Approach for Detecting Automation on Twitter. J. Comput. Sci. 2016, 16, 1–7. [Google Scholar] [CrossRef] [Green Version]
  48. Dickerson, J.P.; Kagan, V.; Subrahmanian, V.S. Using Sentiment to Detect Bots on Twitter: Are Humans More Opinionated than Bots? In Proceedings of the 2014 IEEE/ACM International Conference on Advances in Social Networks Analysis and Mining (ASONAM 2014), Beijing, China, 17–20 August 2014; pp. 620–627. [Google Scholar] [CrossRef]
  49. Sikder, S.K.; Behnisch, M.; Herold, H.; Koetter, T. Geospatial Analysis of Building Structures in Megacity Dhaka: The Use of Spatial Statistics for Promoting Data-Driven Decision-Making. J. Geovisualization Spat. Anal. 2019, 3, 7. [Google Scholar] [CrossRef]
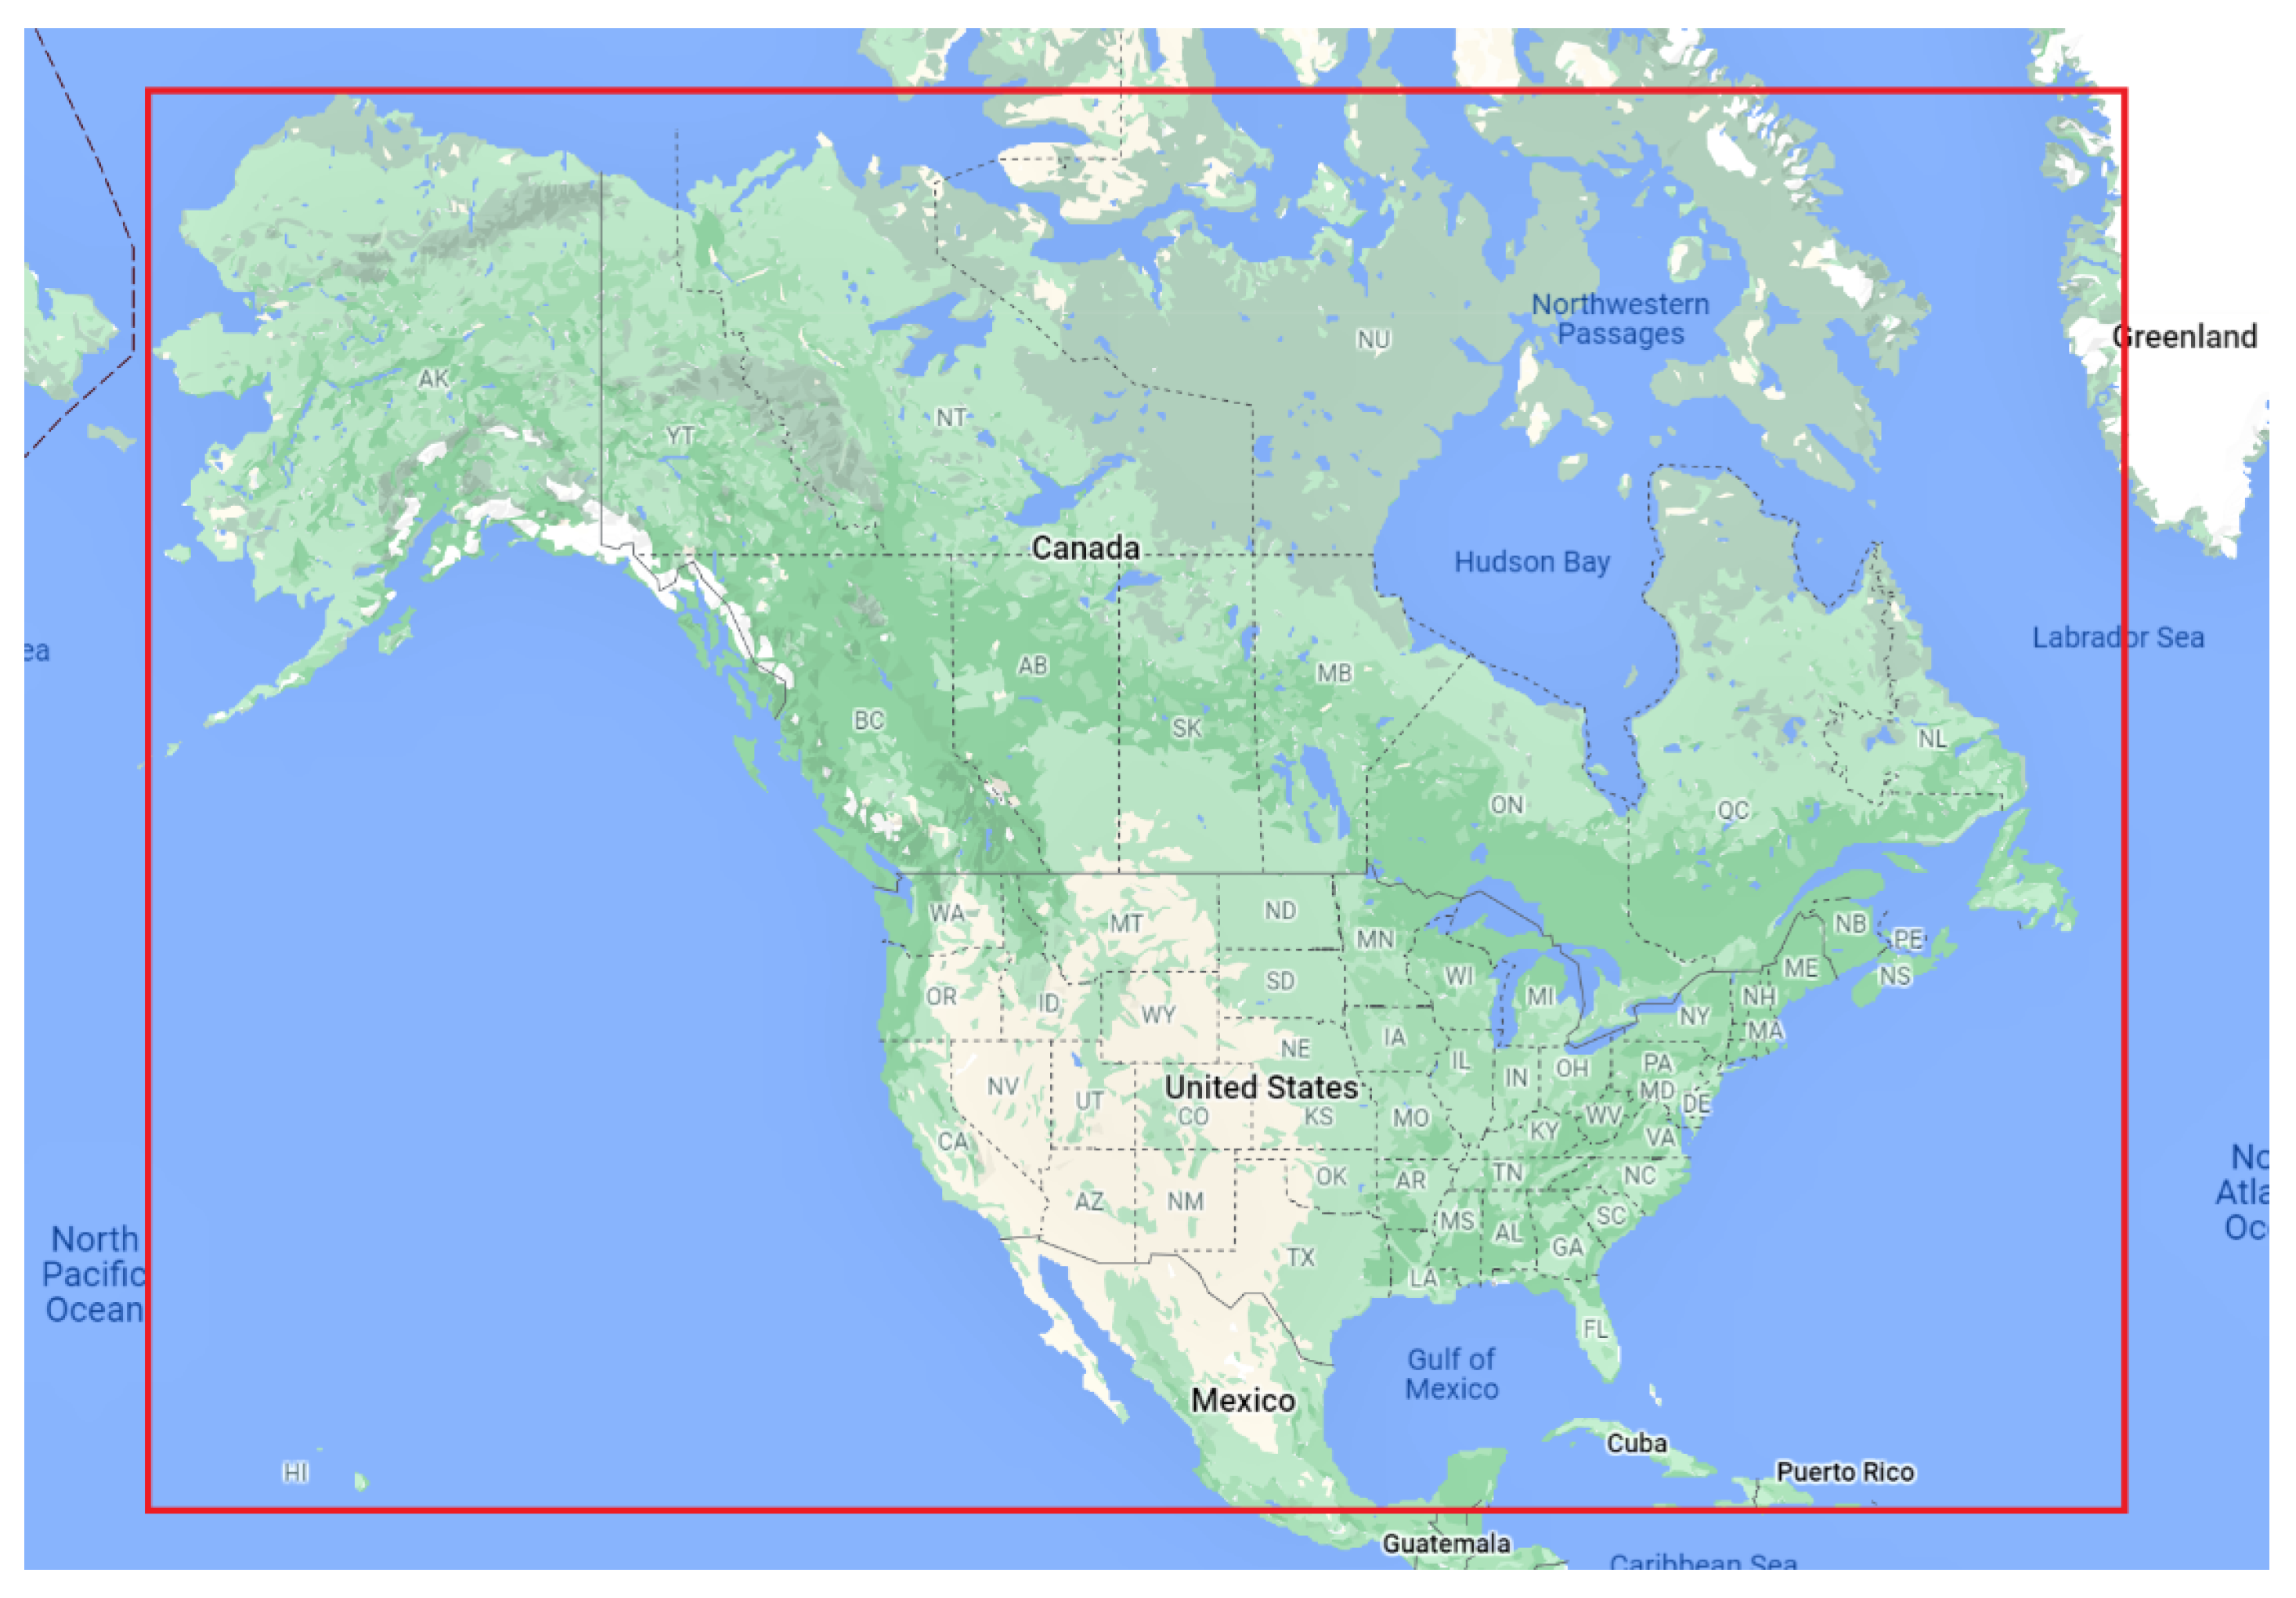
Figure 1. Bounded box used for the data collection for North America.
Futuretransp 01 00044 g001
Figure 2. Graphical representation of LDA model (modified form Sun and Yin [42]).
Futuretransp 01 00044 g002
Figure 3. Framework for Data Collection, Preparation, and Analysis.
Futuretransp 01 00044 g003
Figure 4. Description of the dataset.
Futuretransp 01 00044 g004
Figure 5. Spatio-temporal distribution of relevant tweets (Top 50 location).
Futuretransp 01 00044 g005
Figure 6. Word frequency over time for six keyword categories. (a) Shared Mobility, (b) Vehicle Technology, (c) Built Environment, (d) User Fees, (e) Telecommuting, (f) E-commerce.
Futuretransp 01 00044 g006
Figure 7. Sentiment distribution of the tweets. (a) On aggregate level, (b) Over six categories.
Futuretransp 01 00044 g007
Figure 8. Sentiment Analysis over Space for six categories. (a) Shared Mobility, (b) Vehicle Technology, (c) Built Environment, (d) User Fees, (e) Telecommuting, (f) E-commerce.
Futuretransp 01 00044 g008
Figure 9. Tentative generated topics for six categories. (a) Shared Mobility, (b) User Fees, (c) Telecommuting, (d) Vehicle Technology, (e) Built Environment, (f) E-commerce.
Futuretransp 01 00044 g009
Table 1. Complete List of Keywords Used for Keyword-Based Data Collection.
CategoryRelevant KeywordsTweet Count
Shared Mobility (44 words)shared, mobility, carpool, car, uber, lyft, tnc, share, zipcar, waze, juno, driver, passenger, ride, maas, e-hail, ehail, carclubs, bicycle, via, uberpool, hail, scooter, flexdrive, vehicle, zebra, flexwheels, e-scooter, escooter, lime, wheels, spin, bird, mobi, bike, evo, gogo, jax, rental, curb, wingz, birdj, traffic, fdot170,289 (1.31%)
Vehicle Technology (26 words)autonomous, automated, self-driving, connect, connected, v2v, v2i, v2x, tesla, electric, hybrid, google, drive, platoon, airbags, energy, phonefob, vpa, telematics, ai, b2v, eascy, automation, artificial, intelligence, map74,144 (0.60%)
Built Environment (49 words)built environment, walk, gym, cycle, activity, sidewalks, bypass, access, bus, station, stop, transit, mile, metro, rail, mover, land, work, office, shop, school, bank, airport, flight, plane, restaurant, park, malls, theater, bar, pick-up, pickup, drop-off, dropoff, atm, fitbit, train, subway, universal, disney, hyperloop, everglades, tour, tourist, arrive, depart, destination, eta, home631,697 (4.87%)
User Fees (20 words)toll, express, lane, mileage, price, gas, gallon, fee, fare, tax, booth, market, charge, payment, tariff, dues, levy, duty, liter, litre66,668 (0.51%)
Telecommuting (32 words)telecommute, job, flexible, hours, dollar, video-conference, videoconference, commute, telework, mobile, remote, workplace, technology, home-sourced, home sourced, e-work, ework, outwork, operation, mode, labor, regime, freelance, screen, voice, chat, video, phone, yammer, zoom, virtual, employee344,868 (2.66%)
E-commerce (34 words)ecommerce, amazon, deliver, delivery, walmart, publix, ebay, fedex, ups, browse, purchase, e-business, ebusiness, online, trade, internet, sale, retail, transaction, paperless, macy’s, macys, wish, lowe’s, lowes, best buy, bestbuy, target, home depot, homedepot, etsy, rakuten, groupon, ebates142,101 (1.10%)
Table 2. Emerging Transportation Trends Related Most Coherent Topics.
Trend Category
(Coherence Score)
Interaction
Topics
Topic
Probability
Most Probable Words in the Coherent Topic
Shared Mobility
(0.363)
Ride-Hailing0.472Car (0.016), share (0.011), ride (0.011), get (0.006), traffic (0.005)
Employment Opportunity0.192Job (0.027), bio (0.026), looking (0.017), openings (0.017), hiring (0.12)
Vehicle Technology
(0.321)
Fuel Efficiency0.561Energy (0.026), drive (0.016), tesla (0.008), map (0.005), electric (0.005)
Trip Navigation0.168Google (0.039), discover (0.03), big (0.022), map (0.009), coming (0.008)
Built Environment
(0.325)
Daily Activities0.569Home (0.012), Work (0.011), job (0.023), stop (0.007), school (0.007)
Shopping0.152Bus (0.017), car (0.016), times (0.007), cycle (0.007), shop (0.005)
Recreation0.063Park (0.023), station (0.023), incident (0.01), school (0.007), college (0.007)
User Fees
(0.338)
Gas Price0.582Price (0.01), market (0.01), gas (0.01), charge (0.007), duty (0.005)
Tax and
Expressway
0.064dollars (0.023), tax (0.019), trip (0.009), express (0.006), booth (0.006)
Lane Blockage0.065lane (0.018), blocked (0.013), FedEx (0.013), avenue (0.012), drive (0.012)
Telecommuting
(0.353)
Holiday0.5call (0.032), Christmas (0.026), amazing (0.023), business (0.022), tonight (0.021)
Healthcare0.303Healthcare (0.06), nurse (0.01), specialist (0.044), care (0.045), video (0.022)
Supply Chain Management0.055manager (0.036), operations (0.021), retail (0.036), mobile (0.026), supply chain (0.023)
Customer
Services (Recommendations)
0.077anyone (0.137), recommend (0.134), customer service (0.048), labor (0.043)
Sales (Hiring)0.266Great (0.06), fit (0.042), sales (0.041), hiring (0.040), opening (0.033)
Ecommerce
(0.390)
Sales (Online)0.523Wish (0.023), summer (0.01), kid (0.01), online (0.006), sale (0.006)
Customer
Services (Item Delivery)
0.192customer service (0.025), item (0.01), hiring (.078), team (0.05)
Publisher’s Note: MDPI stays neutral with regard to jurisdictional claims in published maps and institutional affiliations.