1. Introduction
Modelling in Ergonomics and Human Factors has a long tradition [
1,
2,
3]. This tradition of modelling goes back to the dawn of the discipline, with the invention ‘Therblig’, a term used to describe a basic human action [
4]. Therbligs comprised 18 elements, including: search, find, select, grasp, hold, transport, position, assemble, use, disassemble, inspect, release, delay, plan and rest. These elements were used by Gilbreth and colleagues to model a human manual performance in pursuit of more effective and efficient work patterns. Operator Event Sequence Diagrams [
5,
6] may be considered as a development of the approach to model human–machine interactions in a pictorial representation. Operator Event Sequence Diagrams can be used as part of the interaction design process in developing new interfaces between humans and technology [
7]. This may be thought of in terms of the co-evolution of sociotechnical systems, where the human activity and technical process are designed together [
8], rather than the human activity resulting from tasks left over from automation [
9]. There are many examples of the application of Operator Event Sequence Diagrams, such as: modelling single pilot operations in commercial aviation [
10], aircraft landing [
11], air traffic control [
12], electrical energy distribution [
13], maritime collision avoidance [
5], process control [
6] and automatic emergency braking systems in automobiles [
14]. Despite this wide variety of applications, there is scant validation evidence to support their continued use [
15,
16,
17]. This paper has the twin aims of showing the application of Operator Event Sequence Diagrams to the design of the automated vehicle to driver handover task and providing validation evidence from a high-fidelity driving simulator study.
In one of the very first applications of Operator Event Sequence Diagrams, Kurke [
5] showed how this method could be used to design navigation systems on a maritime vessel. The representation was used to compare collision avoidance using the traditional approach with a new computer supported approach. Kurke argued that, in the new approach, a computer would automatically calculate the closest point of approach; thus, minimizing error and reducing collision risk. Comparing the two Operator Event Sequence Diagrams side by side allows the analyst to see how the work of the Watch Officer had changed with the introduction of the computer support. This can help to ensure that the system design has been constructed to establish meaningful operational procedures [
5], something Gilbreth [
4] himself was also keen to promote. More recently, Harris et al. [
10] also used Operator Event Sequence Diagrams to compare the work of two pilots on the flight deck of a civil aircraft with that of a single-pilot configuration. Again, the authors invited the reader to spot the difference in a side-by-side comparison of the two versions of the work. The revised work allocation in the reduced crewing option showed that the workload did not reduce by half (although there were substantially fewer cross-checks and communications) and could potentially overload the single pilot [
10]. Both of these examples, and others, show the value of Operator Event Sequence Diagrams in modelling future versions of systems and them being able to anticipate the work that might be undertaken. Banks et al. [
14] showed how Operator Event Sequence Diagrams can be applied to the design of the interaction between the human driver and the various vehicle subsystems for driving automation. The current paper focuses on the interaction between driver and in-vehicle subsystems during handover of control.
Other modelling approaches in Ergonomics and Human Factors have determined predictions about human error [
18,
19,
20,
21], time to perform tasks [
22,
23,
24]), visual sampling behaviour [
2,
25] and the structure of work [
26,
27]. The advantage of Operator Event Sequence Diagrams is that they make the interactions between various subsystems (including the human operators) explicit, within and between ‘swim-lanes’ (the columns containing work associated with each of the actors). Each swim-lane contains the activities of that subsystem, and interactions are depicted as connectors across the swim-lane. Similar to Therbligs [
4], the approach has a taxonomy of activities, but these can apply to both the social and technical subsystems. Operator Event Sequence Diagrams categories include: process, decision, delay, display, inspection, operation, receipt, speech, storage and transport [
5,
6,
7]. Several of these seem very similar to the Therbligs (such as: delay, inspection and transport), but rather than applying solely to human activities, they can also be applied to the technical aspects of the system. Connectors are used in Operator Event Sequence Diagrams to make explicit links between the inputs and outputs of one or more subsystems.
Human Factors methods are designed to improve product design by understanding or predicting user interaction with devices [
15]. These approaches have a long tradition in system design and tend to have a greater impact (as well as a reduced cost) when applied early on in the design process [
15,
16]. Kirwan and Ainsworth [
6] noted that the original purpose of Operator Event Sequence Diagrams was to represent complex, multi-person tasks. The output of an Operator Event Sequence Diagram graphically depicts a task process, including the tasks performed and the interaction between operators over time, using standardised symbols. The OESD symbol set leads one to evaluate specific aspects of human interface elements while generic SysML activities within SysML activity diagrams do not force this specification (see [
28], for an example of SysML applied to design). There are numerous forms of Operator Event Sequence Diagrams, ranging from a simple flow diagram representing the task order, to more complex analyses of team interaction and communication, and often including a timeline of the scenario under analysis and potential sources of error. Operator Event Sequence Diagrams have been used during the design of complex systems, such as nuclear power and petrochemical processing plants [
6].
Kurke [
5] originally proposed Operator Event Sequence Diagrams for the human–machine systems interaction design as well as the layout of the interfaces. His examples focused on the design of interfaces between humans and machines to specify the sequence of operations between these subsystems (Kurke’s analysis had swim-lanes for the object to be avoided, the ship, the computer and the Watch Officer). As such, Operator Event Sequence Diagrams may be best suited to a scenario analysis where there are discrete sets of tasks to be undertaken. In the present study, we analysed the handover of vehicle control between human drivers and automation, which is presented in the next section.
2. Development of the Operator Event Sequence Diagram for Automation–Human Driver Handover
This section focuses on the first aim of the paper by showing the application of Operator Event Sequence Diagrams to the design of the automated vehicle to driver handover task. The rationale for the interaction design is described as well as further detail regarding the elements captured in the diagrams.
Descriptions on the development of Operator Event Sequence Diagrams may be found in books on Human Factors methods [
6,
7]. In essence, the scenario start and end points are decided, together with the main actors. The analysis presented in the current paper was based on a use-case of a vehicle automation handover scenario on a UK motorway with an SAE level four vehicle [
29]. The use case stated that drivers would be expected to drive manually onto the motorway and hand the driving task over to vehicle automation when it becomes available. Whilst vehicle automation is engaged, the driver would be free to engage in non-driving tasks (such as reading, emailing, working on a tablet computer). The vehicle would alert the driver of the need to take back control of the vehicle in a planned, non-emergency, handover in a timely manner before the exit junction. Failure to take back manual control of the vehicle would result in the vehicle continuing on the motorway until it either ran out of fuel or road. In which case, the vehicle would automatically pull over and come to a halt on the hard shoulder (for regular motorways) or Emergency Refuge Area (in the case of smart motorways). The handovers are described using the task elements from Operator Event Sequence Diagrams as shown in
Table 1.
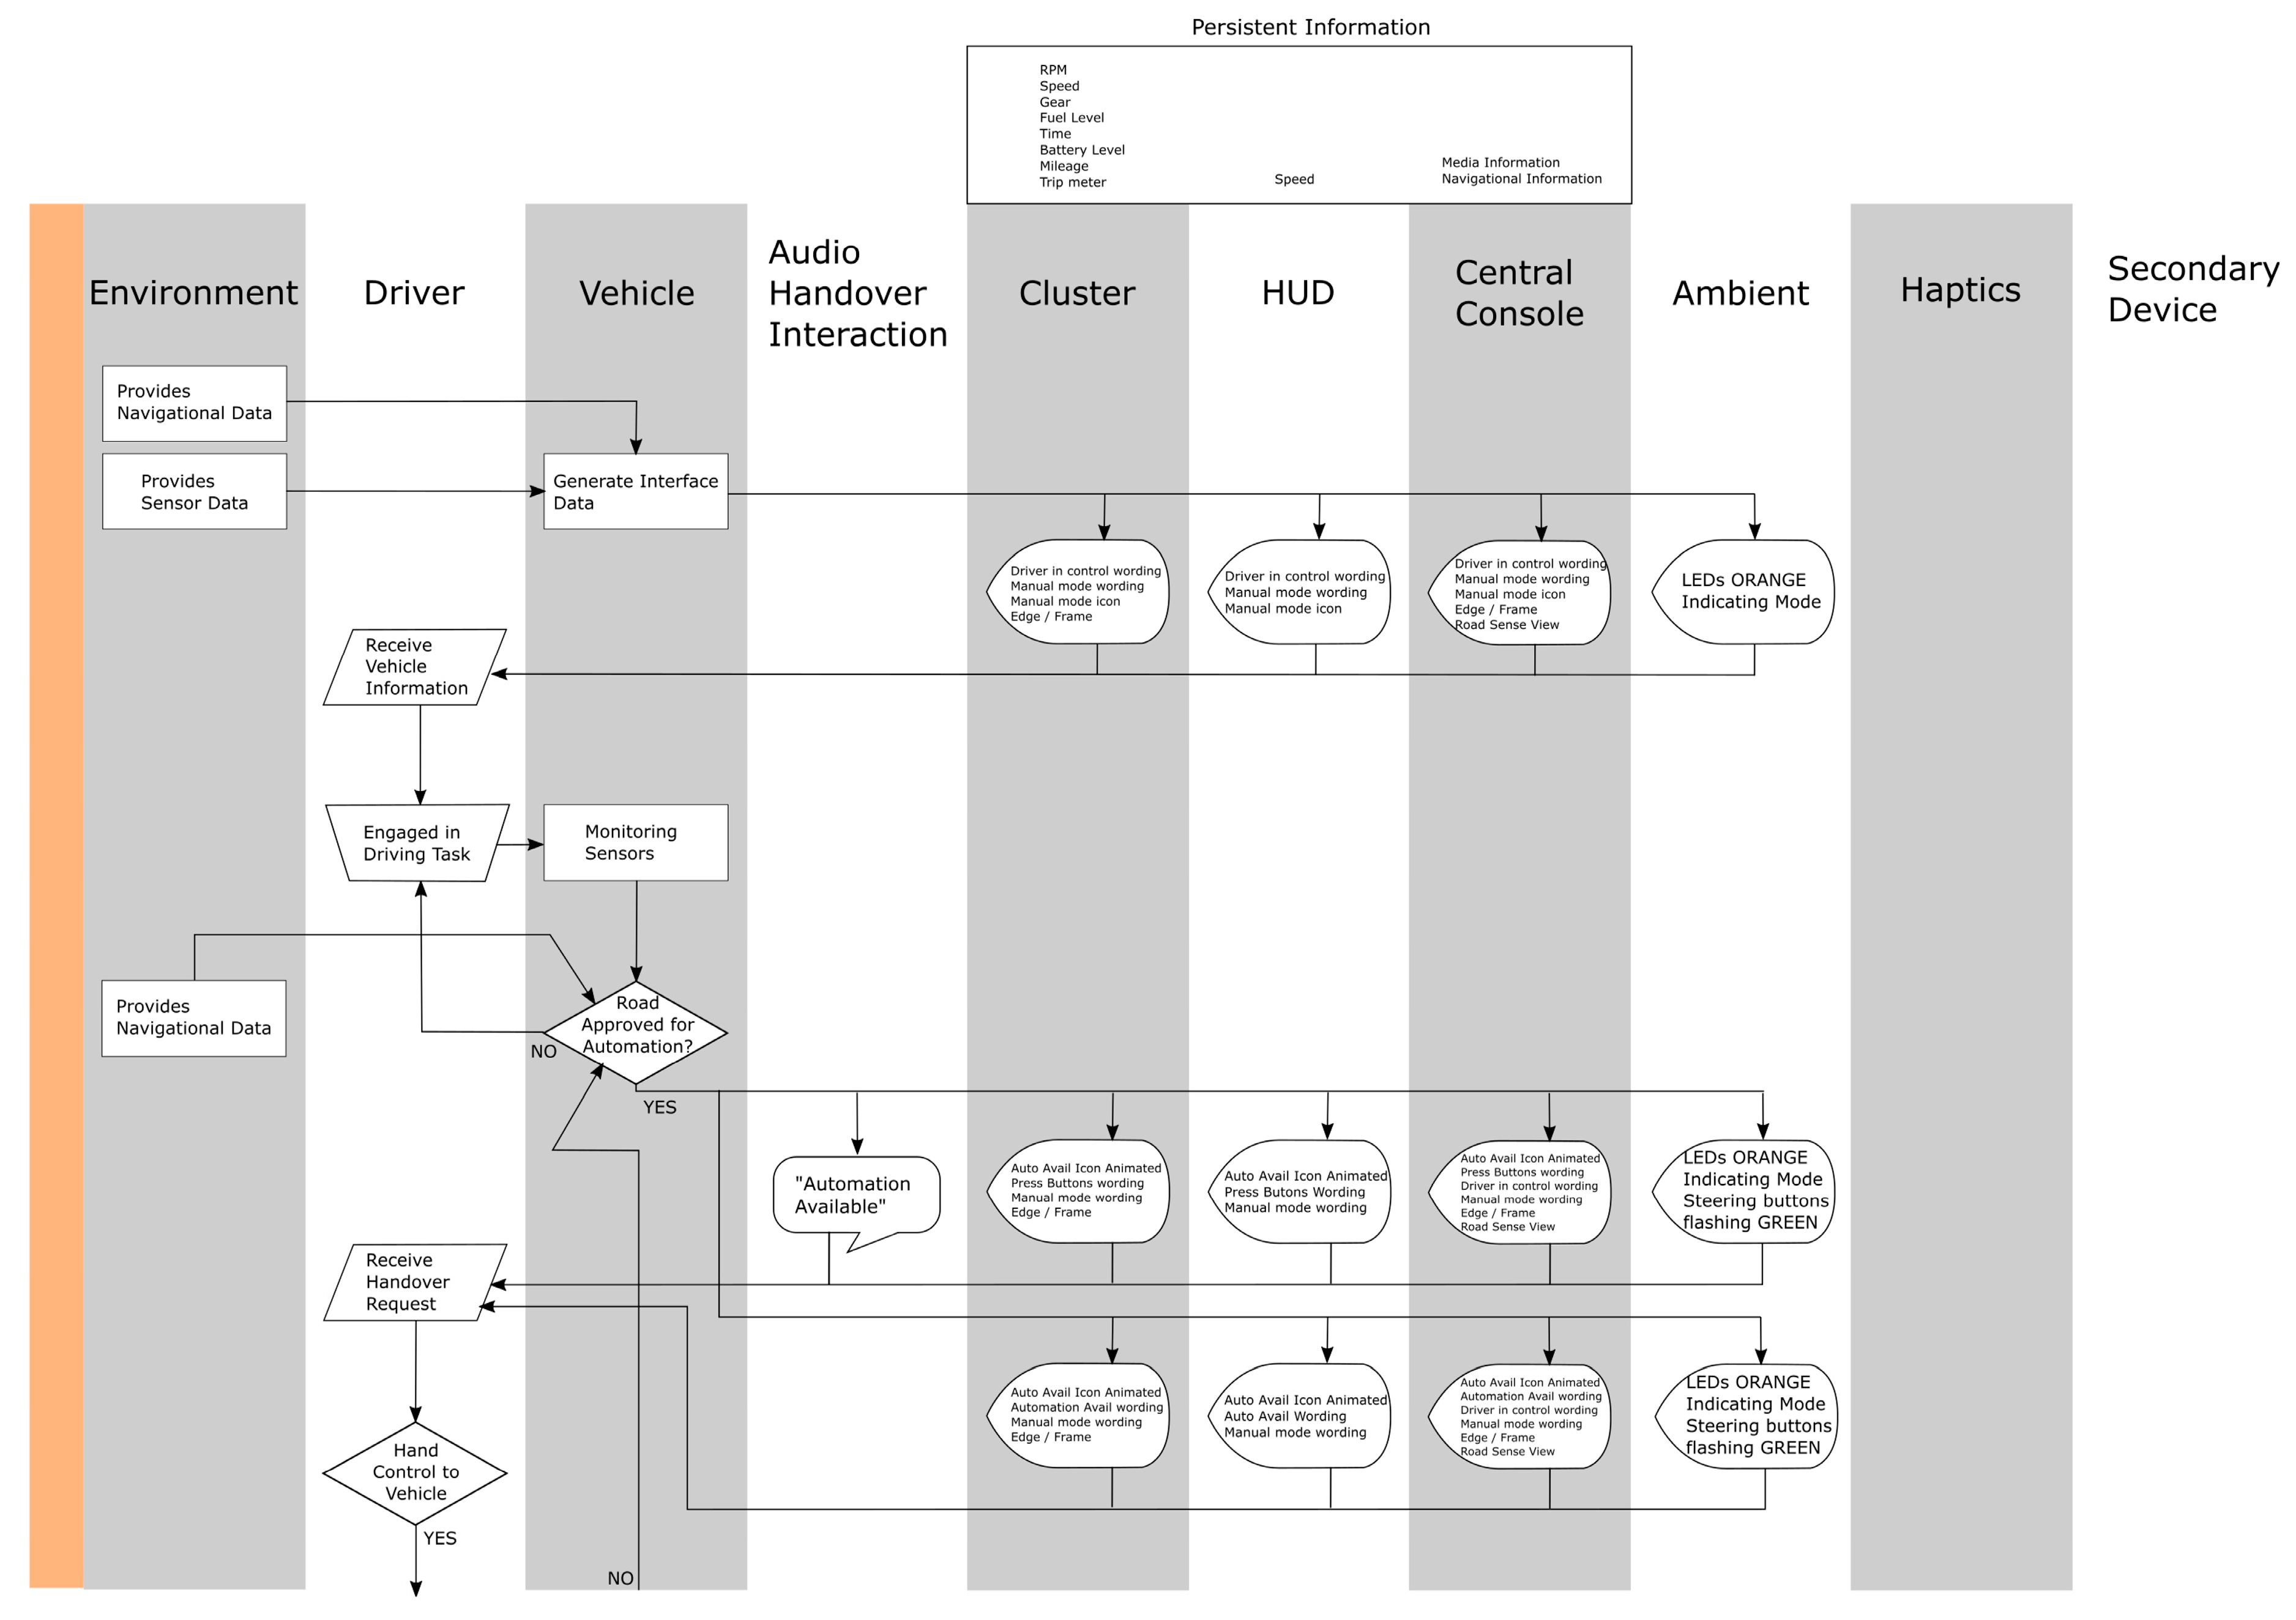
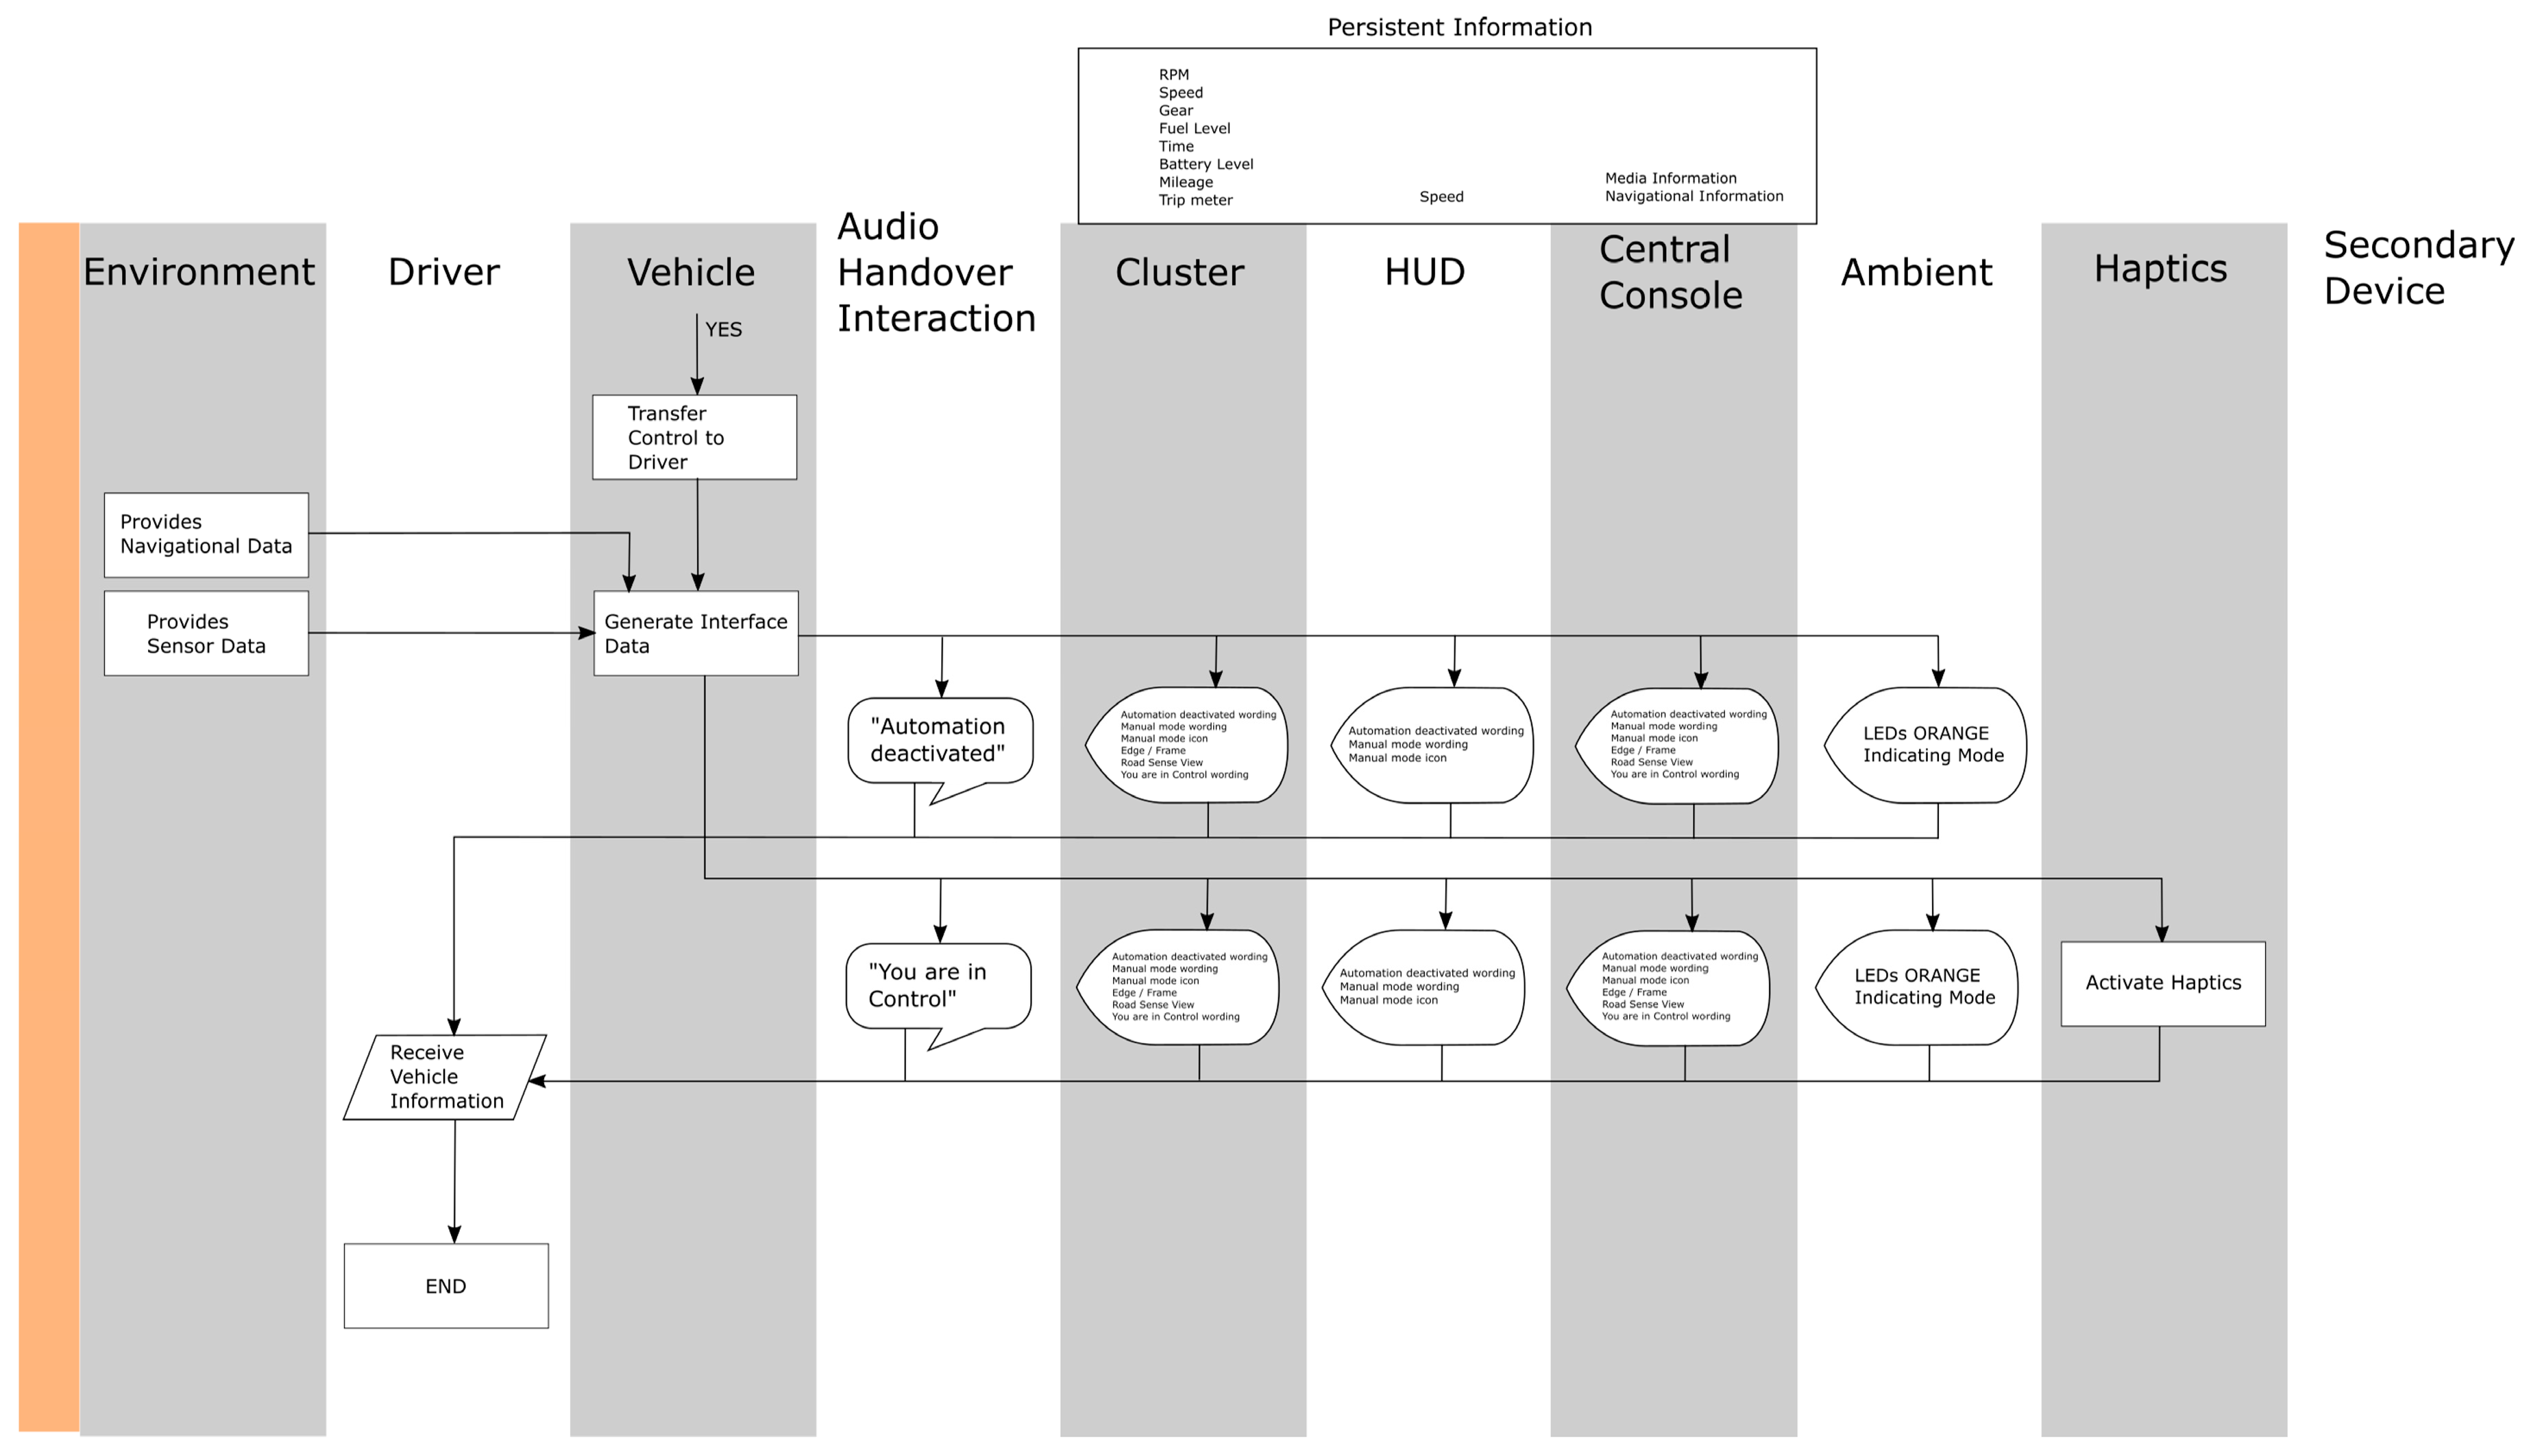
The 10 swim-lanes show the different ‘actors’ under consideration in the design of the handovers to and from the human driver and vehicle automation (via the instrument cluster (instruments viewed through the steering wheel), HUD (Head-Up Display viewed in the windscreen or windshield), centre console (the upper part of the centre of the dashboard), ambient (lighting around the dashboard and vehicle interior) and haptic (vibration through the driver’s seat) displays). The arrows are connectors that show the links between the events in the swim-lanes. The handover protocol presented in
Figure 1,
Figure 2,
Figure 3,
Figure 4 and
Figure 5 was designed to raise the situation awareness of drivers, by presenting them with contextually relevant questions about the vehicle status, other road users as well as the surrounding environment and infrastructure. This was based on the research evidence that the degraded performance of drivers of automated vehicles is, in part, due to poor situation awareness [
30]. For example, the collisions in the Tesla and Uber vehicles report that the driver was not aware of the environment outside the vehicle [
31,
32]. As can be seen in
Figure 1, it was assumed that the vehicle is under manual control (orange ambient cabin lighting mode in
Figure 1) until the system detects that the road is suitable for automation to operate (blue ambient cabin lighting mode in
Figure 2). Then, the system prompts the driver with the message that automation is available, via the four interfaces (cluster, HUD, centre console and ambient display) should they wish to use it.
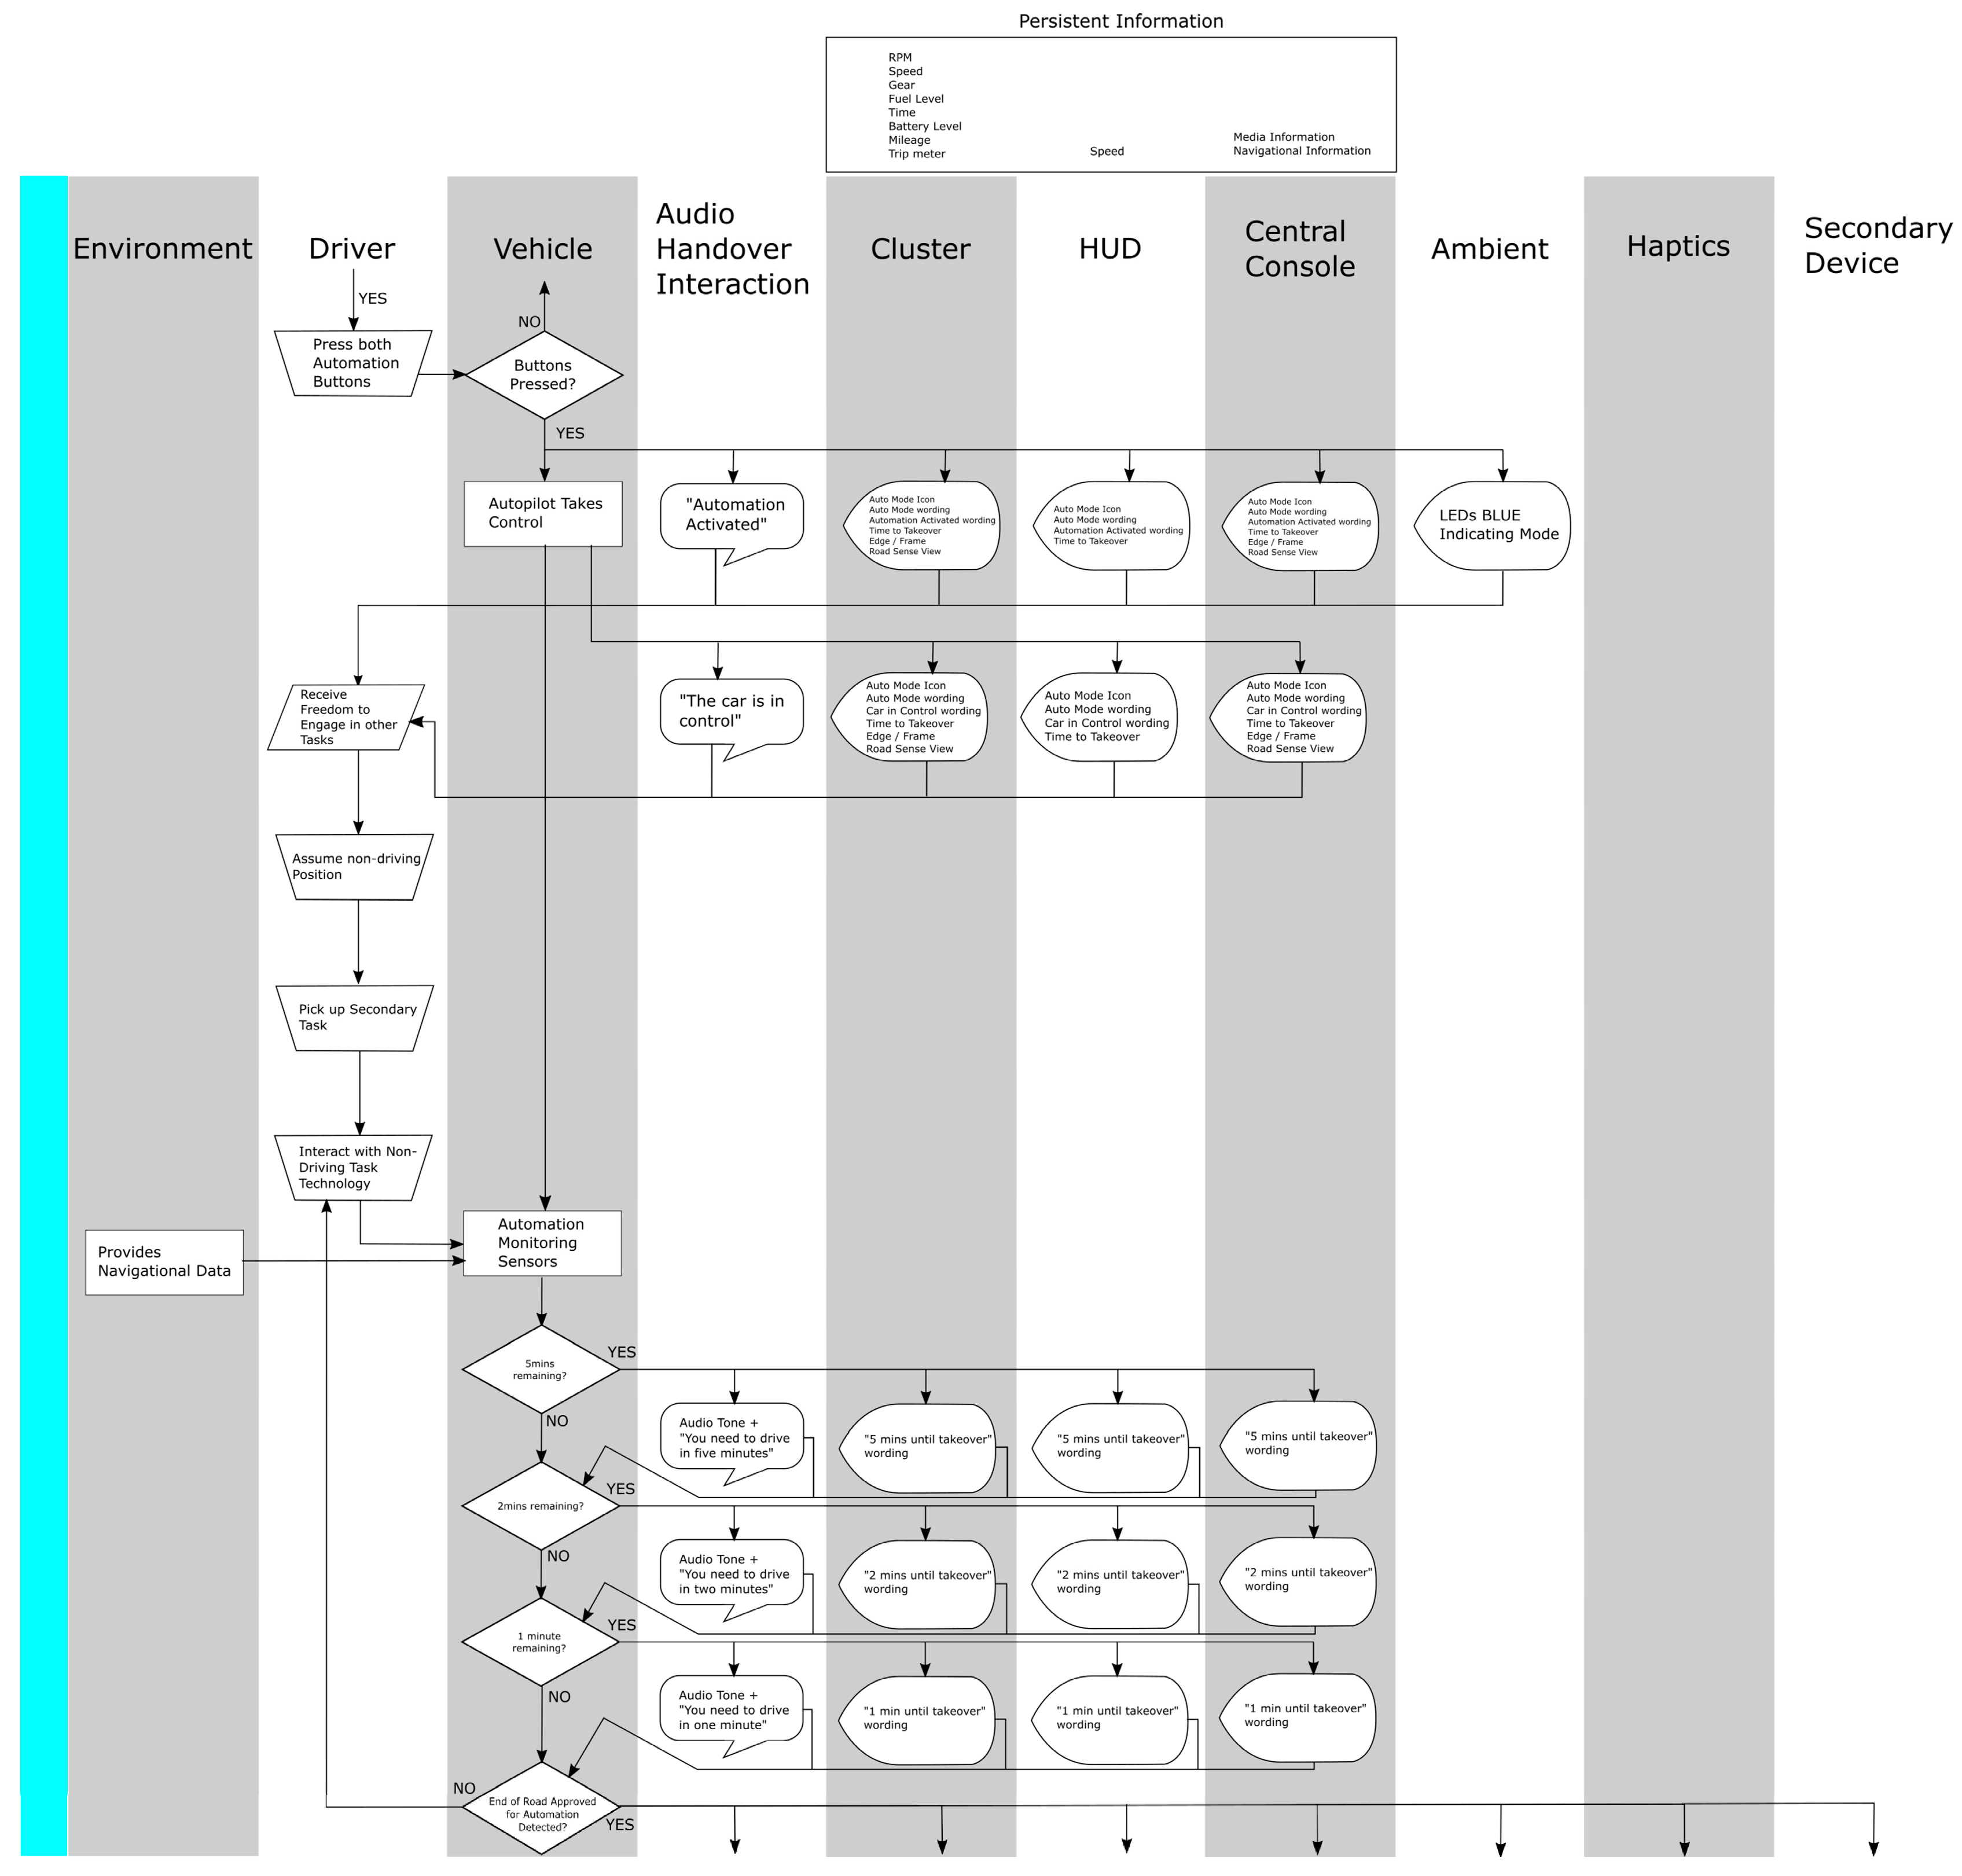
If the driver chooses to engage vehicle automation, then they would press two buttons on the steering wheel with their thumbs simultaneously (assuming that their hands are in the ten-to-two clock position on the steering wheel). At this point, the interfaces would display “Automation Activated” followed by “The car is in control” (see
Figure 2). At the same time, the ambient lighting in the car would change from orange (indicating manual driving mode) to blue (indicating automated driving mode). Then, the driver is able to engage in non-driving tasks (on a tablet computer in this scenario, as level four SAE is assumed, so there is no need for the driver to monitor the automated driving system). The scenario assumes that there is a planned handover of driving from automation back to the human driver (such as when their exit from the motorway is coming up, which would have been pre-programmed into the satellite navigation system). The driver is given a five, then two, then one minutes notice that the handover process will begin (see
Figure 2).
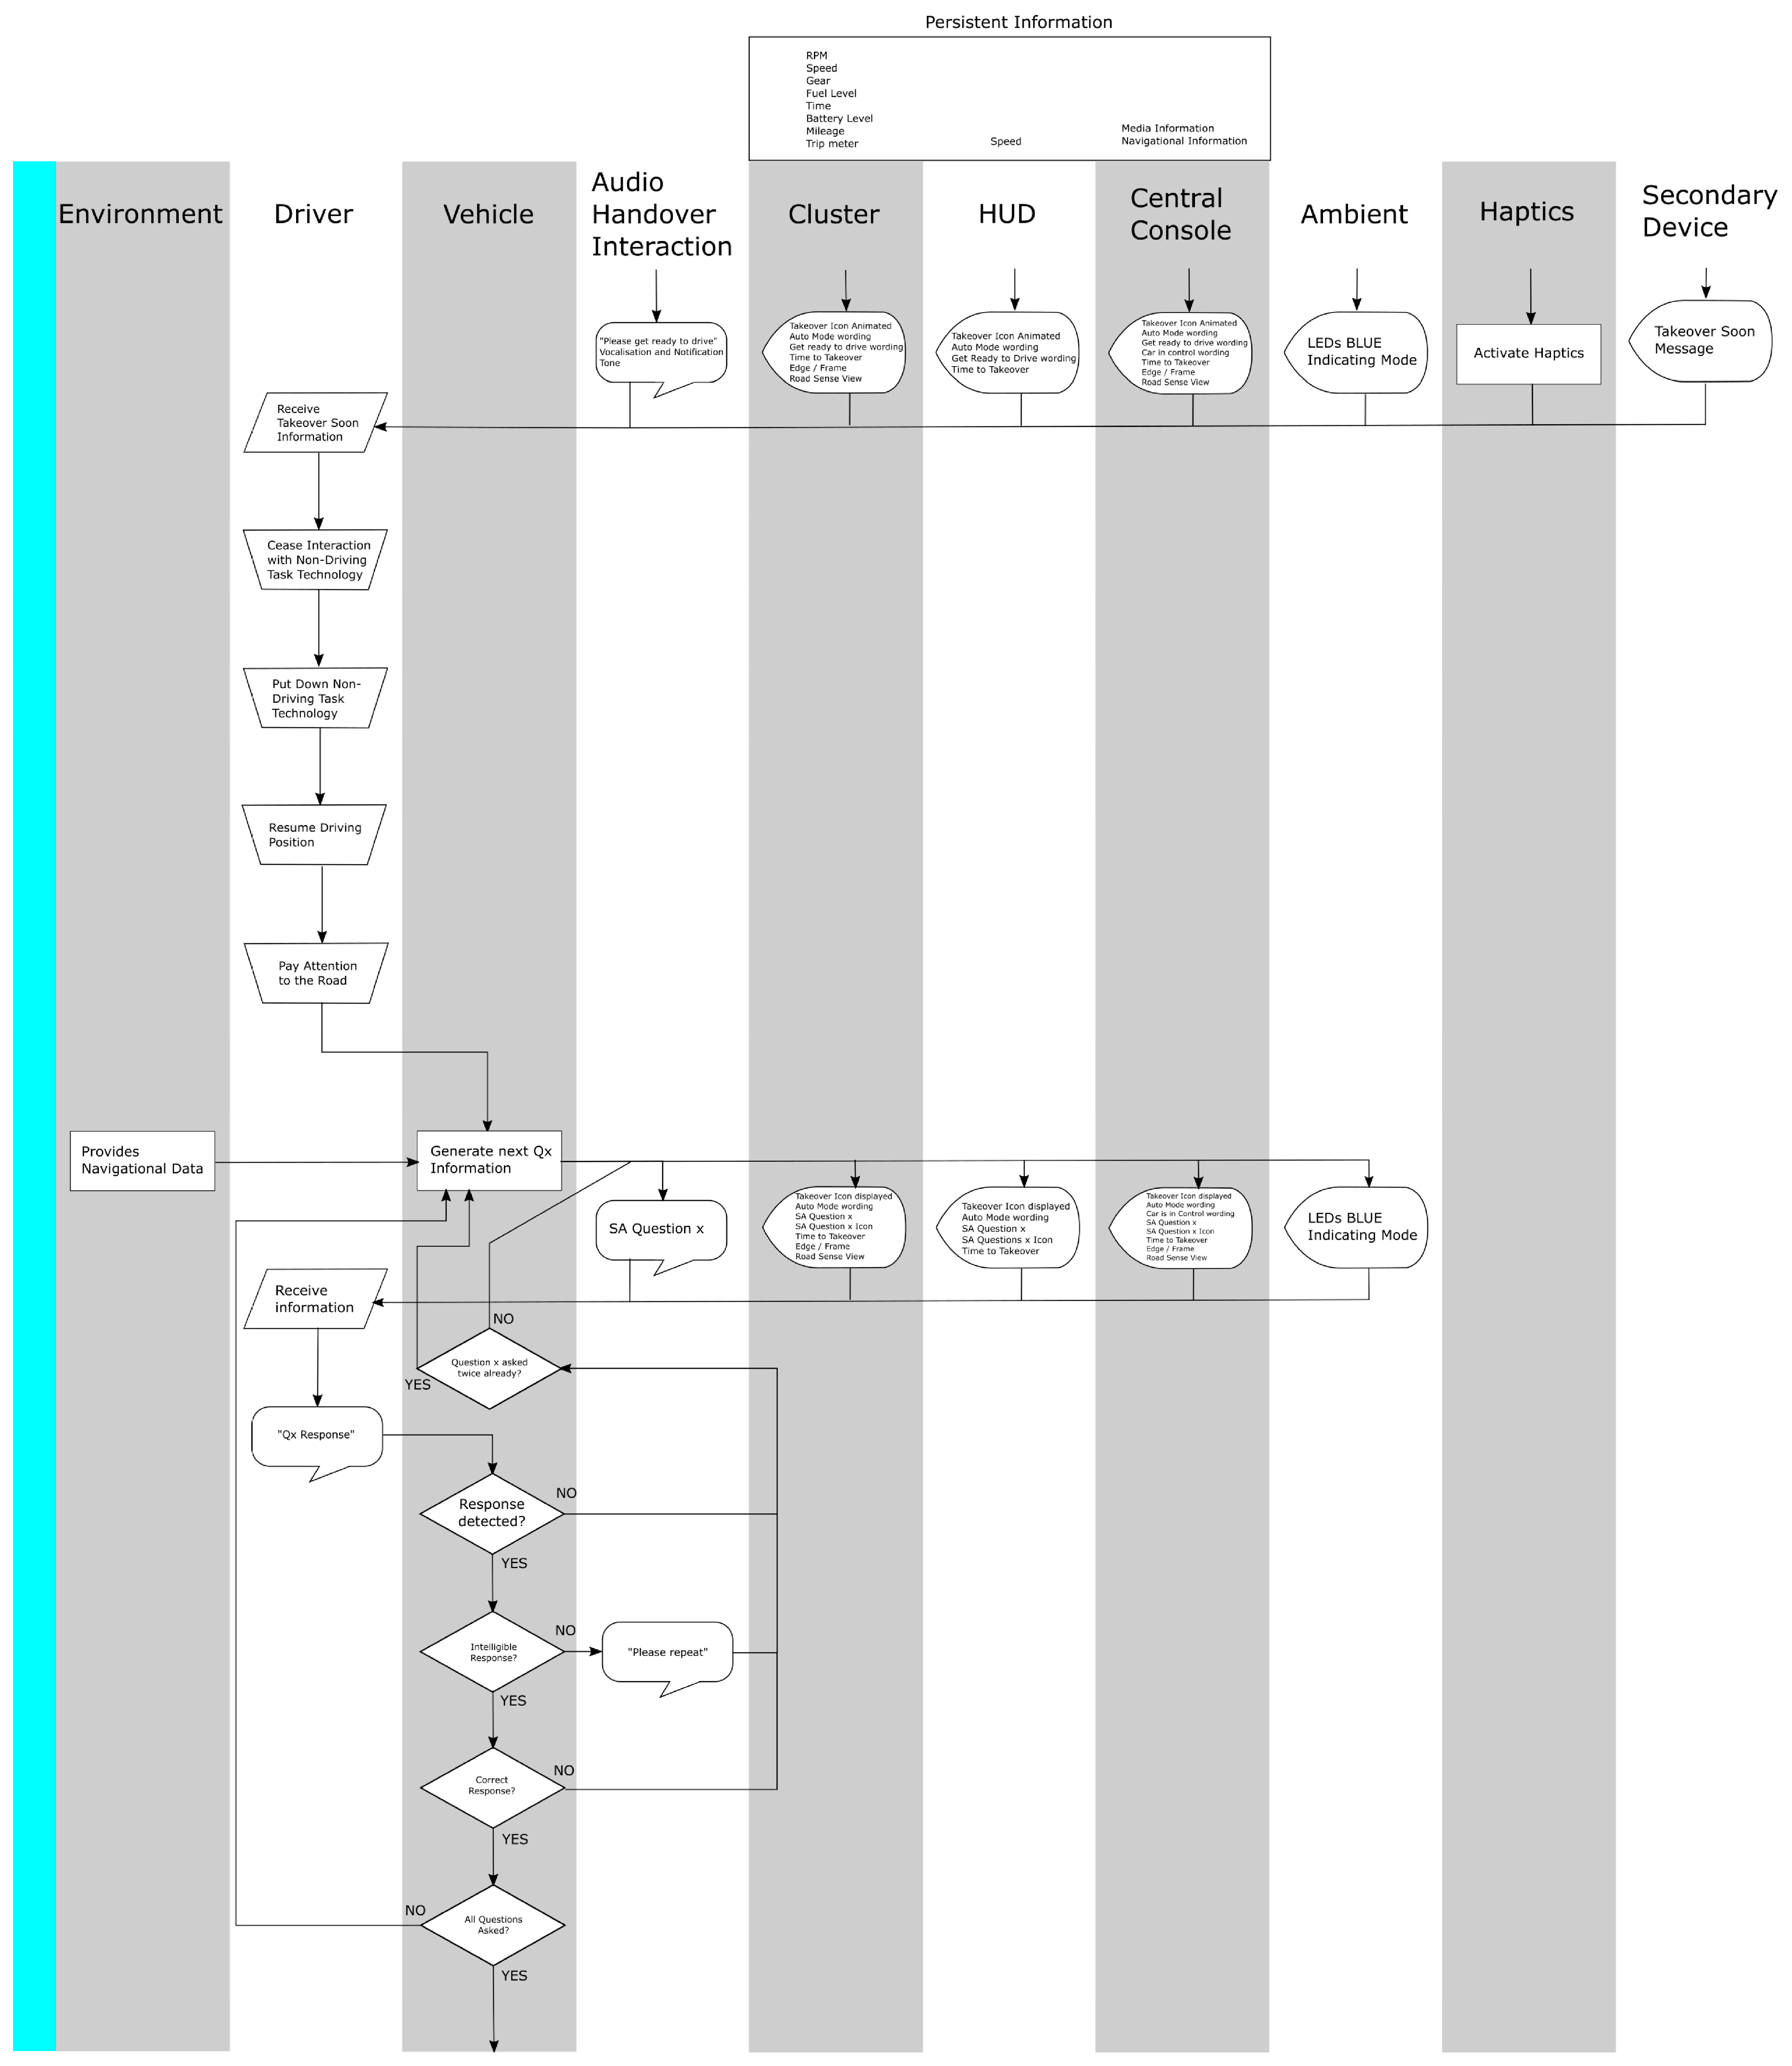
Upon the prompt from the automated system that the driver needs to become ready to drive, it is assumed that the driver ceases the non-driving task, puts down the tablet computer and resumes the driving position (as shown in
Figure 3). The system then presents a series of questions designed to raise the situation awareness of the driver (such as: What speed is the vehicle currently travelling at? What lane are you currently in? What colour is the vehicle in front of you? What is your remaining fuel range? Can you see a bend in the road ahead?. The driver is expected to respond to these questions (which are presented auditorily as well as on all of the visual interfaces). If the answer is correct, then the next question is presented until all questions have been answered. If the answer is incorrect, then the question is repeated for a maximum of two additional times before moving onto the next question. When all questions have been presented, the handover interaction moves on to that presented in
Figure 3.
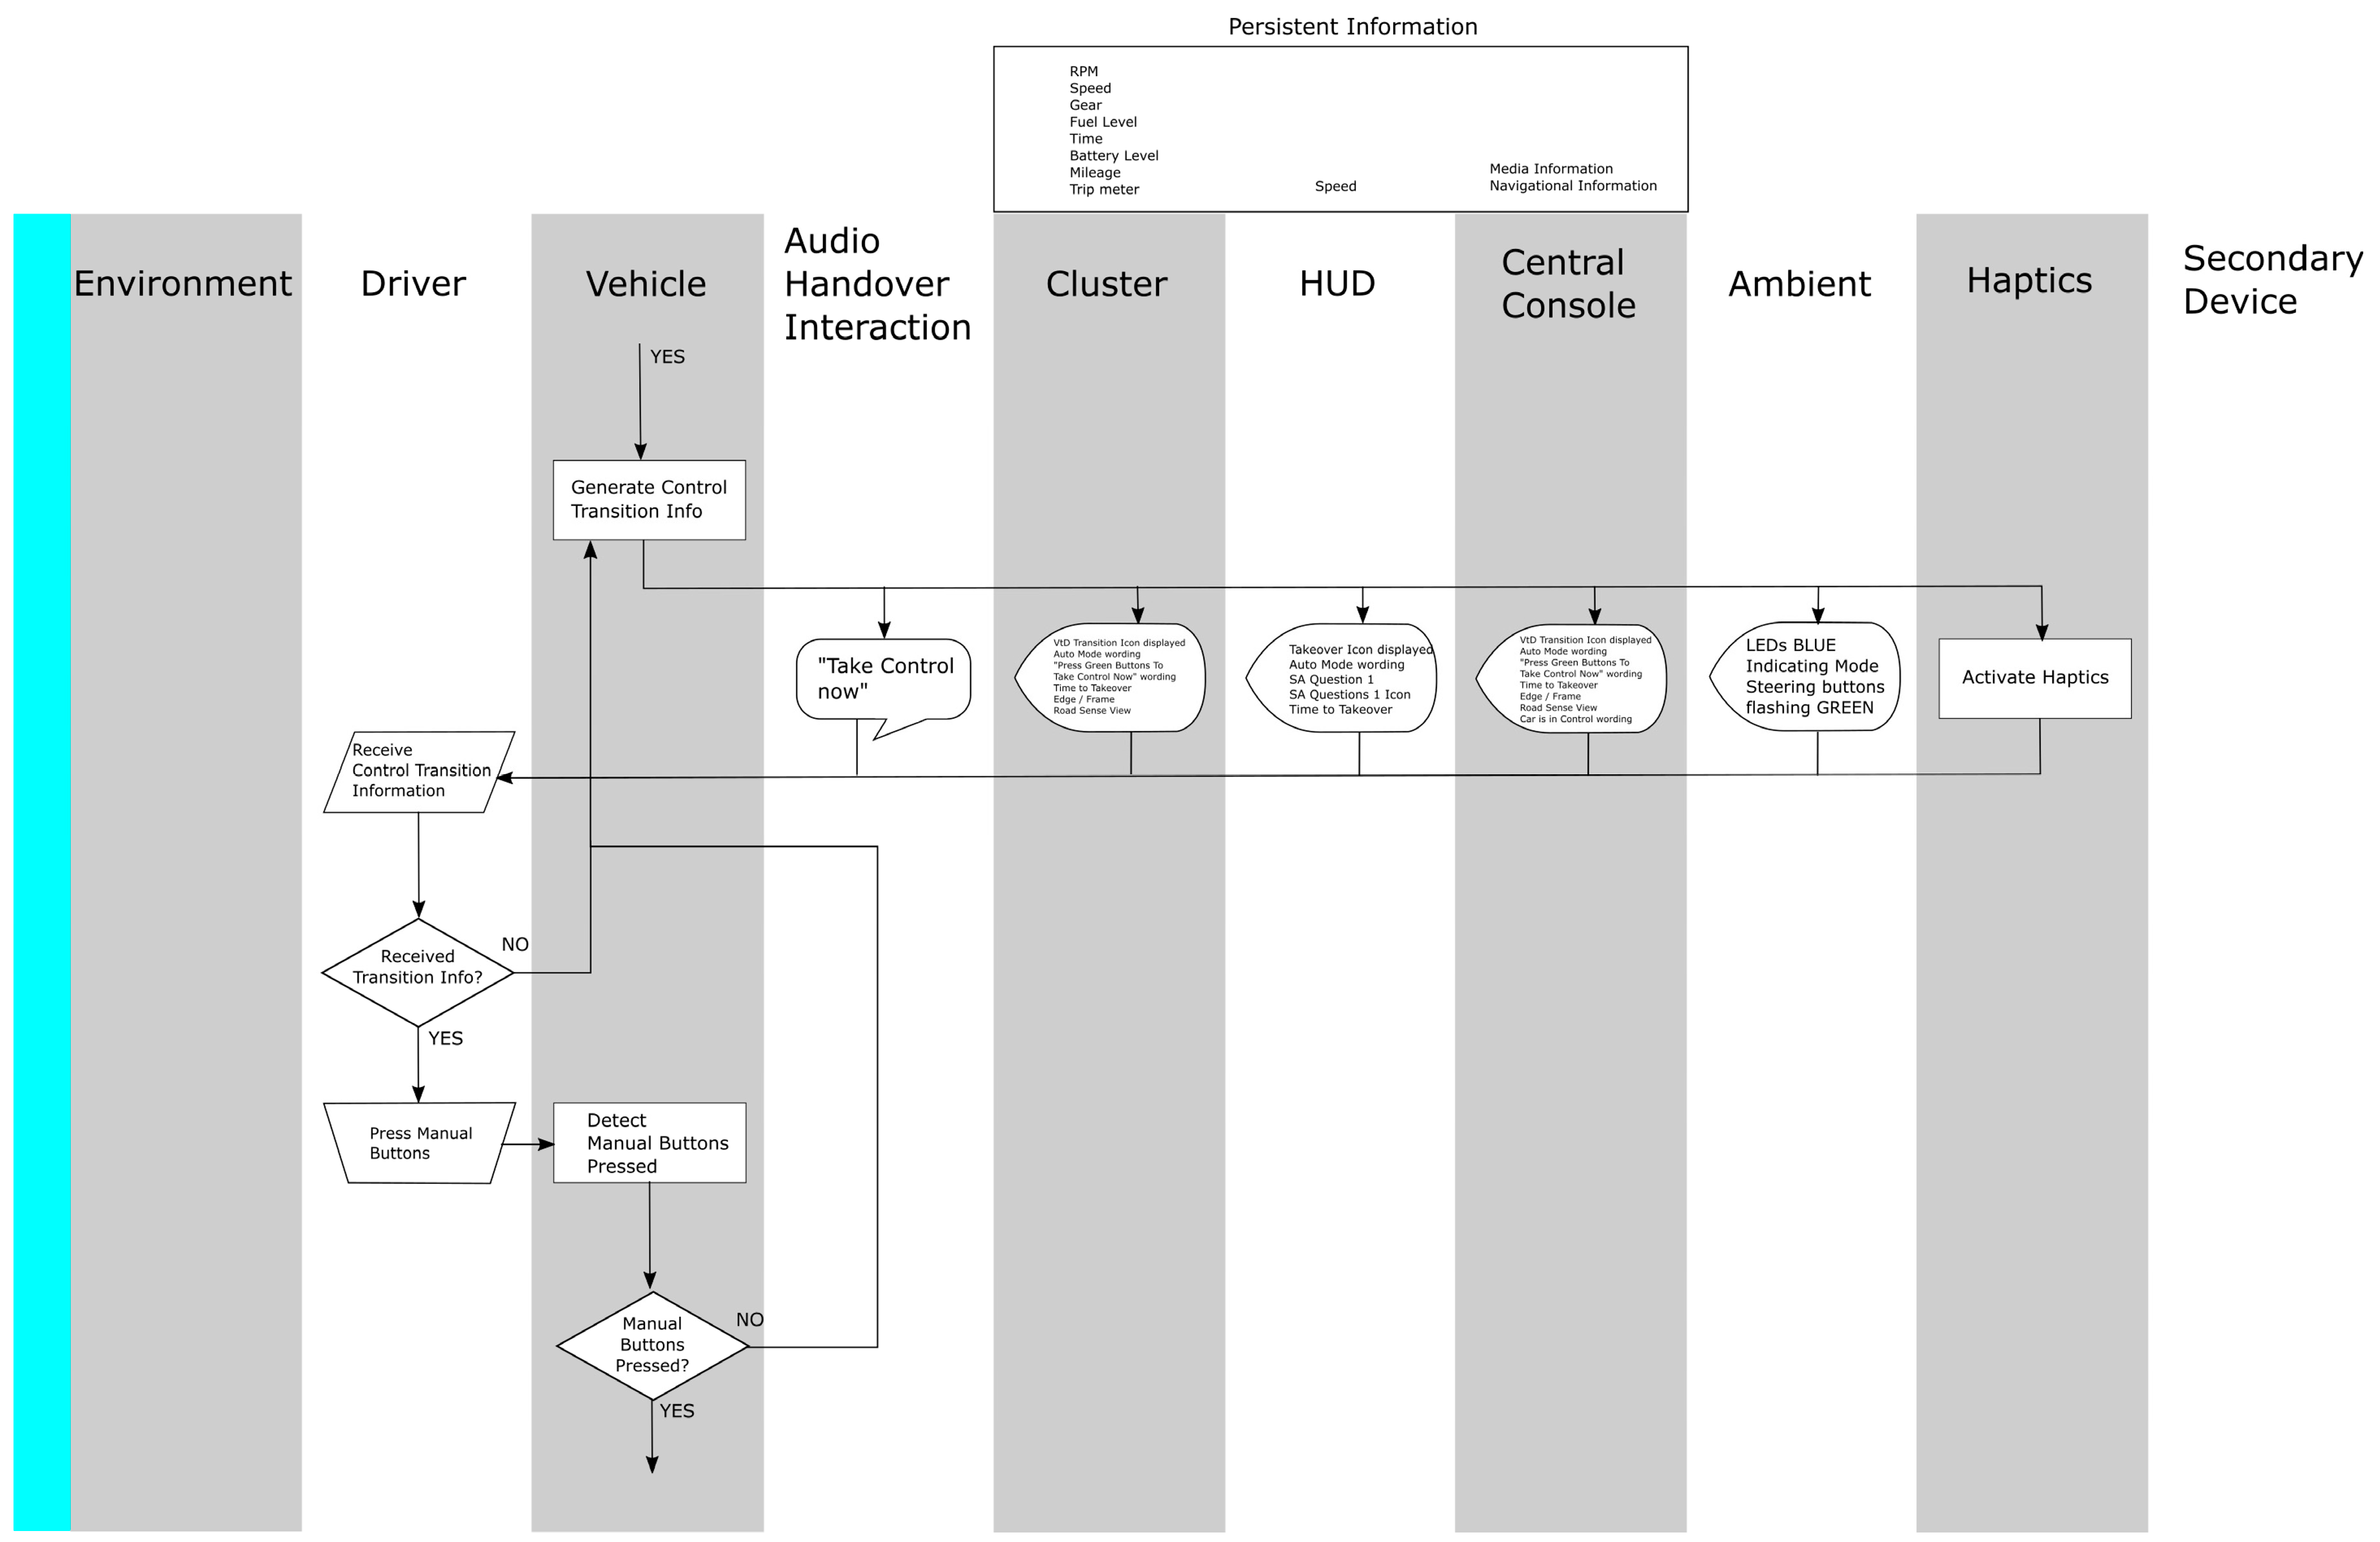
The driver is then requested to take manual control of the vehicle, which will mean placing both hands on the steering wheel and positioning their foot on the accelerator pedal. To transfer control from the automated system to the driver, they need to press two buttons mounted on the steering wheel at the ten-to-two clock position with their thumbs (in the same manner as they do for handing control over to the vehicle automation system).
As
Figure 5 shows, when control of the vehicle is passed back to the human driver, the ambient lighting changes back from blue to orange (indicating the vehicle is now in manual driving mode) and the words “Automation deactivated” are presented auditorily as well as on the visual displays. This is followed by the words “You are in control”, which are also presented auditorily and on the visual displays. The human driver is now driving the vehicle.
As well as showing how Operator Event Sequence Diagrams can be used to design the interactions between automations and humans, the other aim of this study was to empirically validate the approach. This is introduced in the following section.
3. Validation of Methods
The remainder of the paper focuses on aim two, the validation of OESDs modelling using evidence of actual behaviour from a high-fidelity driving simulator study. The validation of Ergonomics and Human Factors methods has proved very challenging to the community, with scant evidence produced on even the most commonly used approaches [
15,
16,
17]. To paraphrase Stanton and Young [
15],
‘validity is often assumed but seldom empirically tested’. Most Ergonomics and Human Factors methods have a theoretical construct and content validity, which helps to convey the credibility of the method to its users. This means that it is often based on a contemporary theory and uses appropriate terminology. With systems theory in ascendancy [
30], there is perhaps a resurgence of interest in Operator Event Sequence Diagrams, as they are able to represent the interactions between subsystems.
Nevertheless, establishing a concurrent and predictive validity for contemporary applications, such as road vehicle automation, is a priority. Just because a method has 60 years of use, it does not necessarily mean that validation is proven, nor that the validity generalisation can be assumed. Therefore, a concurrent and predictive validity needs to be formally tested [
16,
17,
33,
34]. Such validations were undertaken for methods that predict error [
35,
36,
37] and task time [
23,
24,
38]. A comparison of the reliability and validity of a range of Human Factors methods was undertaken by Stanton and Young [
15,
16,
39]. These studies show that the methods vary quite considerably in their performance. Previous work made use of the signal detection paradigm for validity testing of Ergonomics and Human Factors methods [
15,
16,
34]. This approach was used in the current paper and, based on previous work, it was expected that Operator Event Sequence Diagrams would achieve reasonable levels of validity, above the threshold for acceptance for use in modelling the automation–human interaction.
7. Equipment
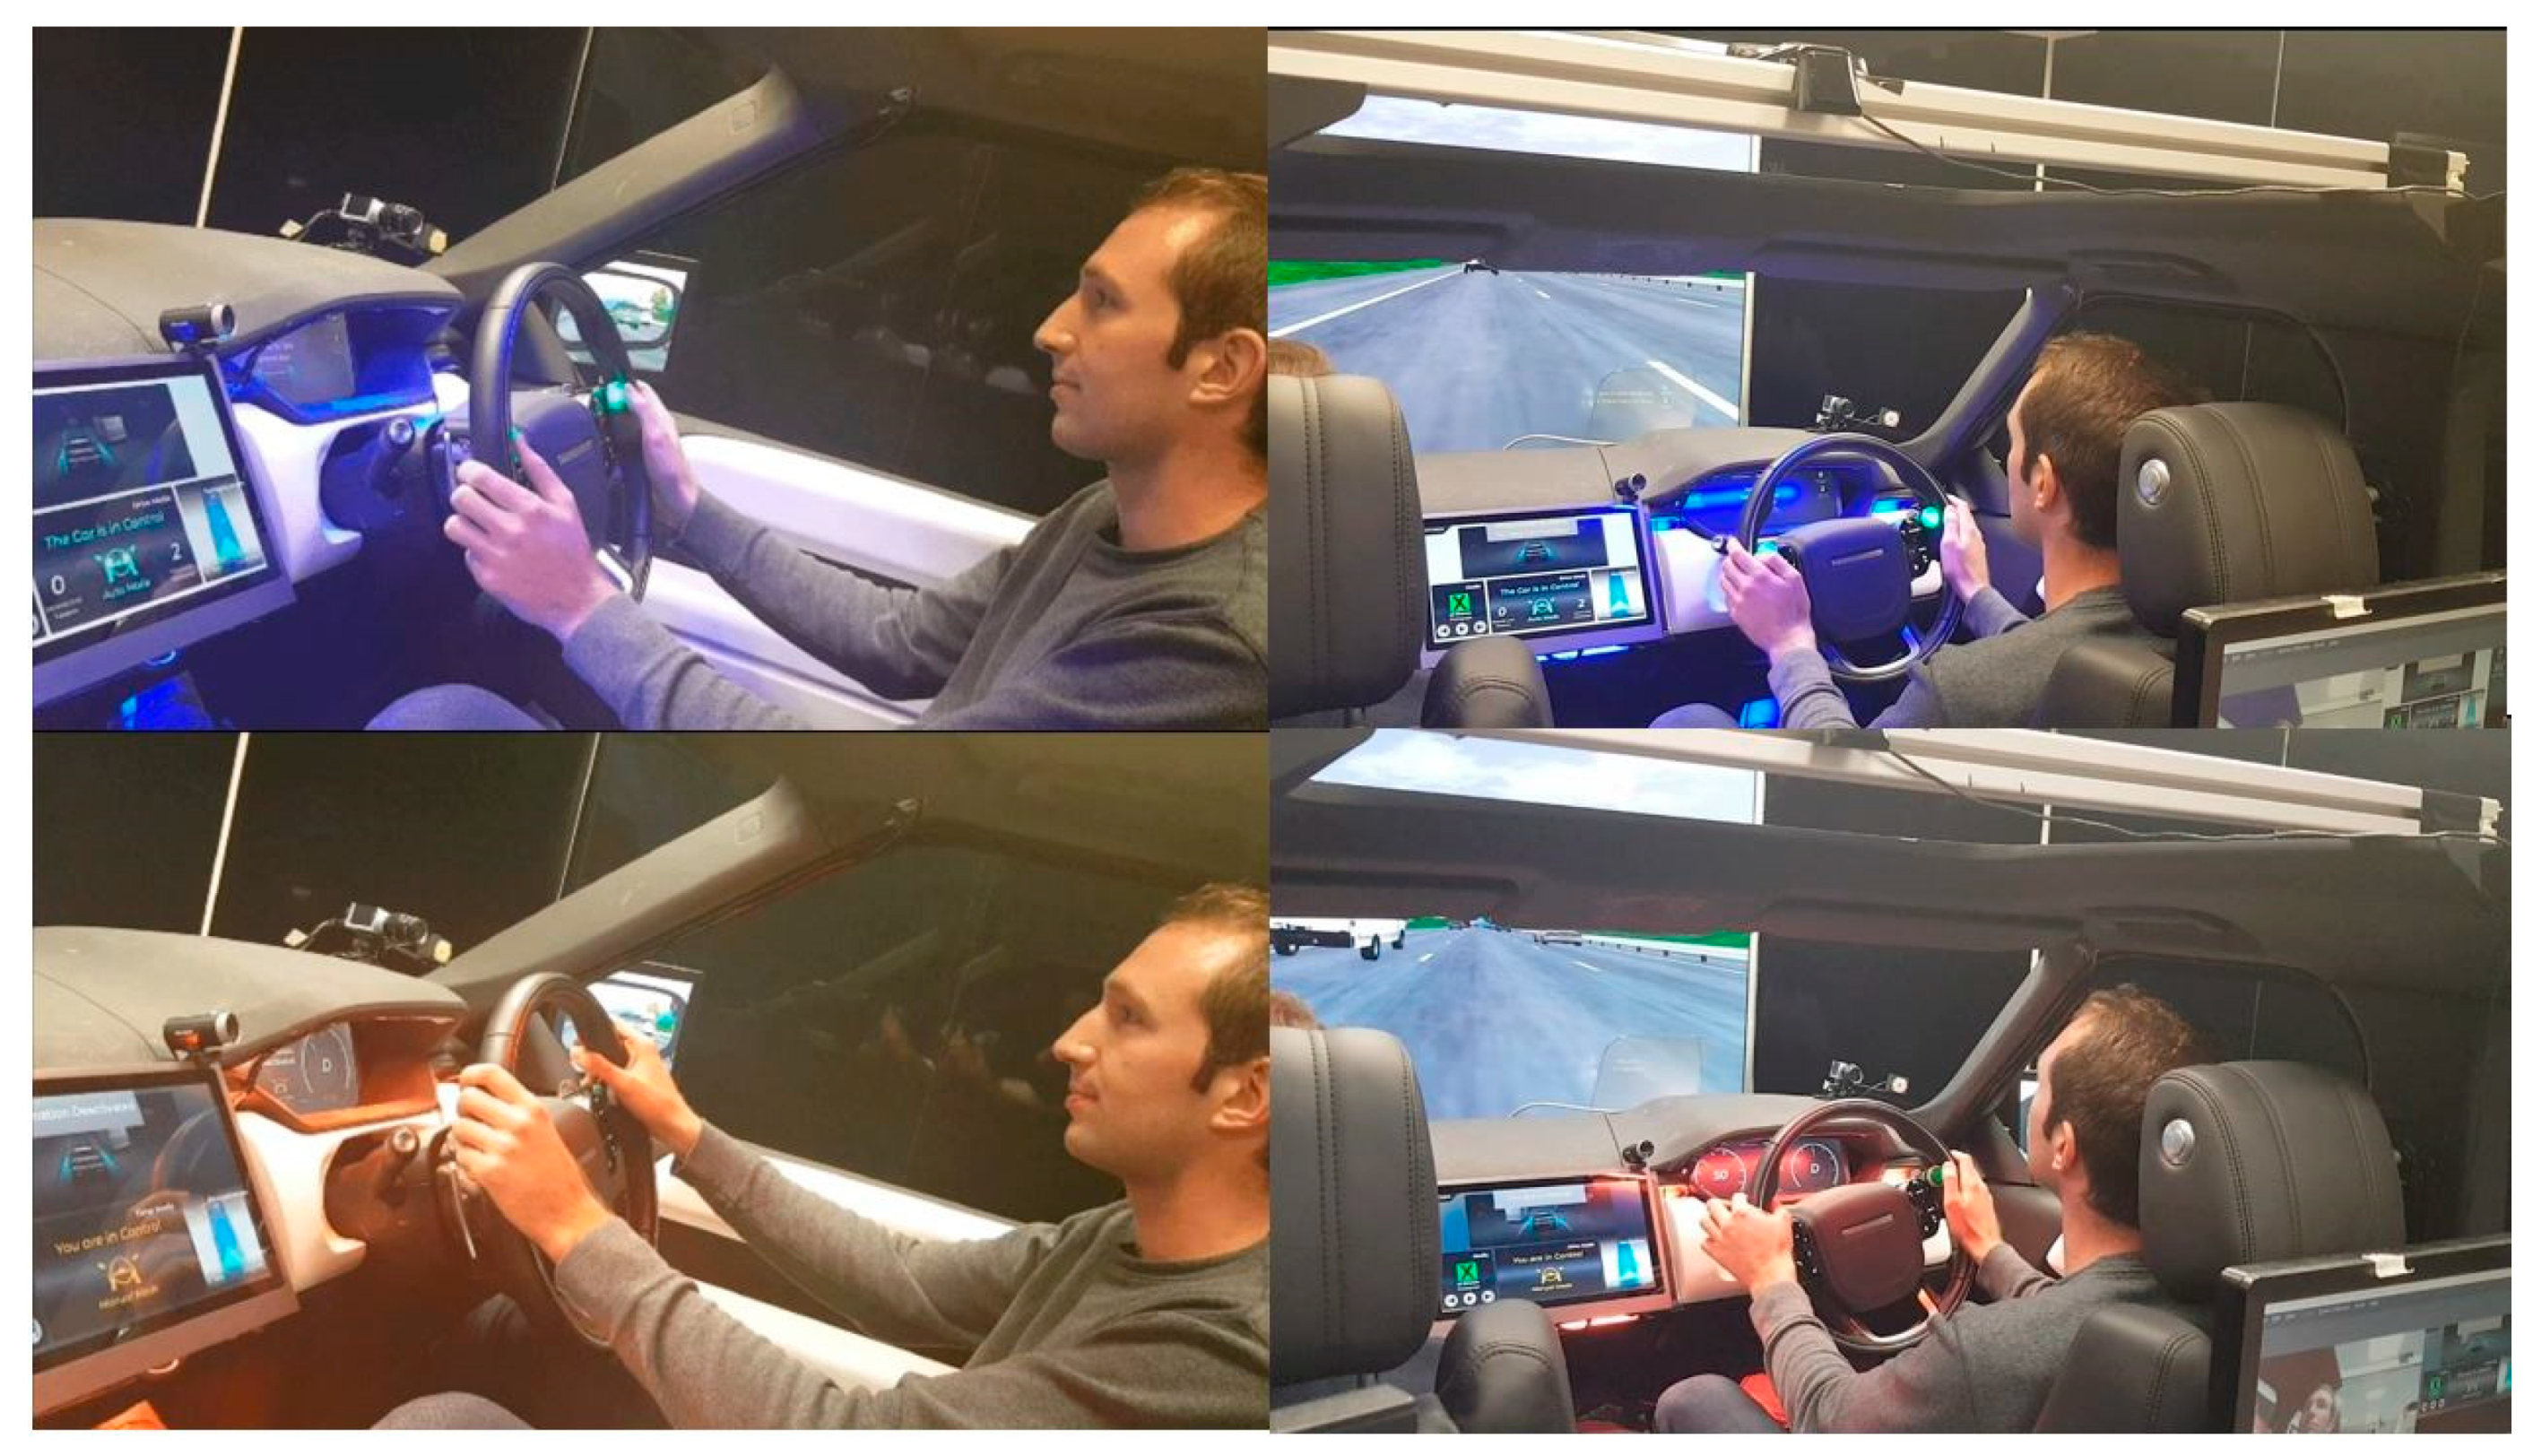
The driving simulator was based on a Land Rover Discovery Sport vehicle interior, with a fixed base running STISIM software (see
Figure 6). The simulated driving environment comprised a congested, three-lane, motorway (to simulate the rush hour in the UK) in dry conditions with good visibility. To help reduce mode error [
40,
41], the cabin ambient lighting displayed two distinct colours. As shown in
Figure 6, blue was used to indicate that the vehicle was under automated control and orange was used to indicate the vehicle was under manual driver control.
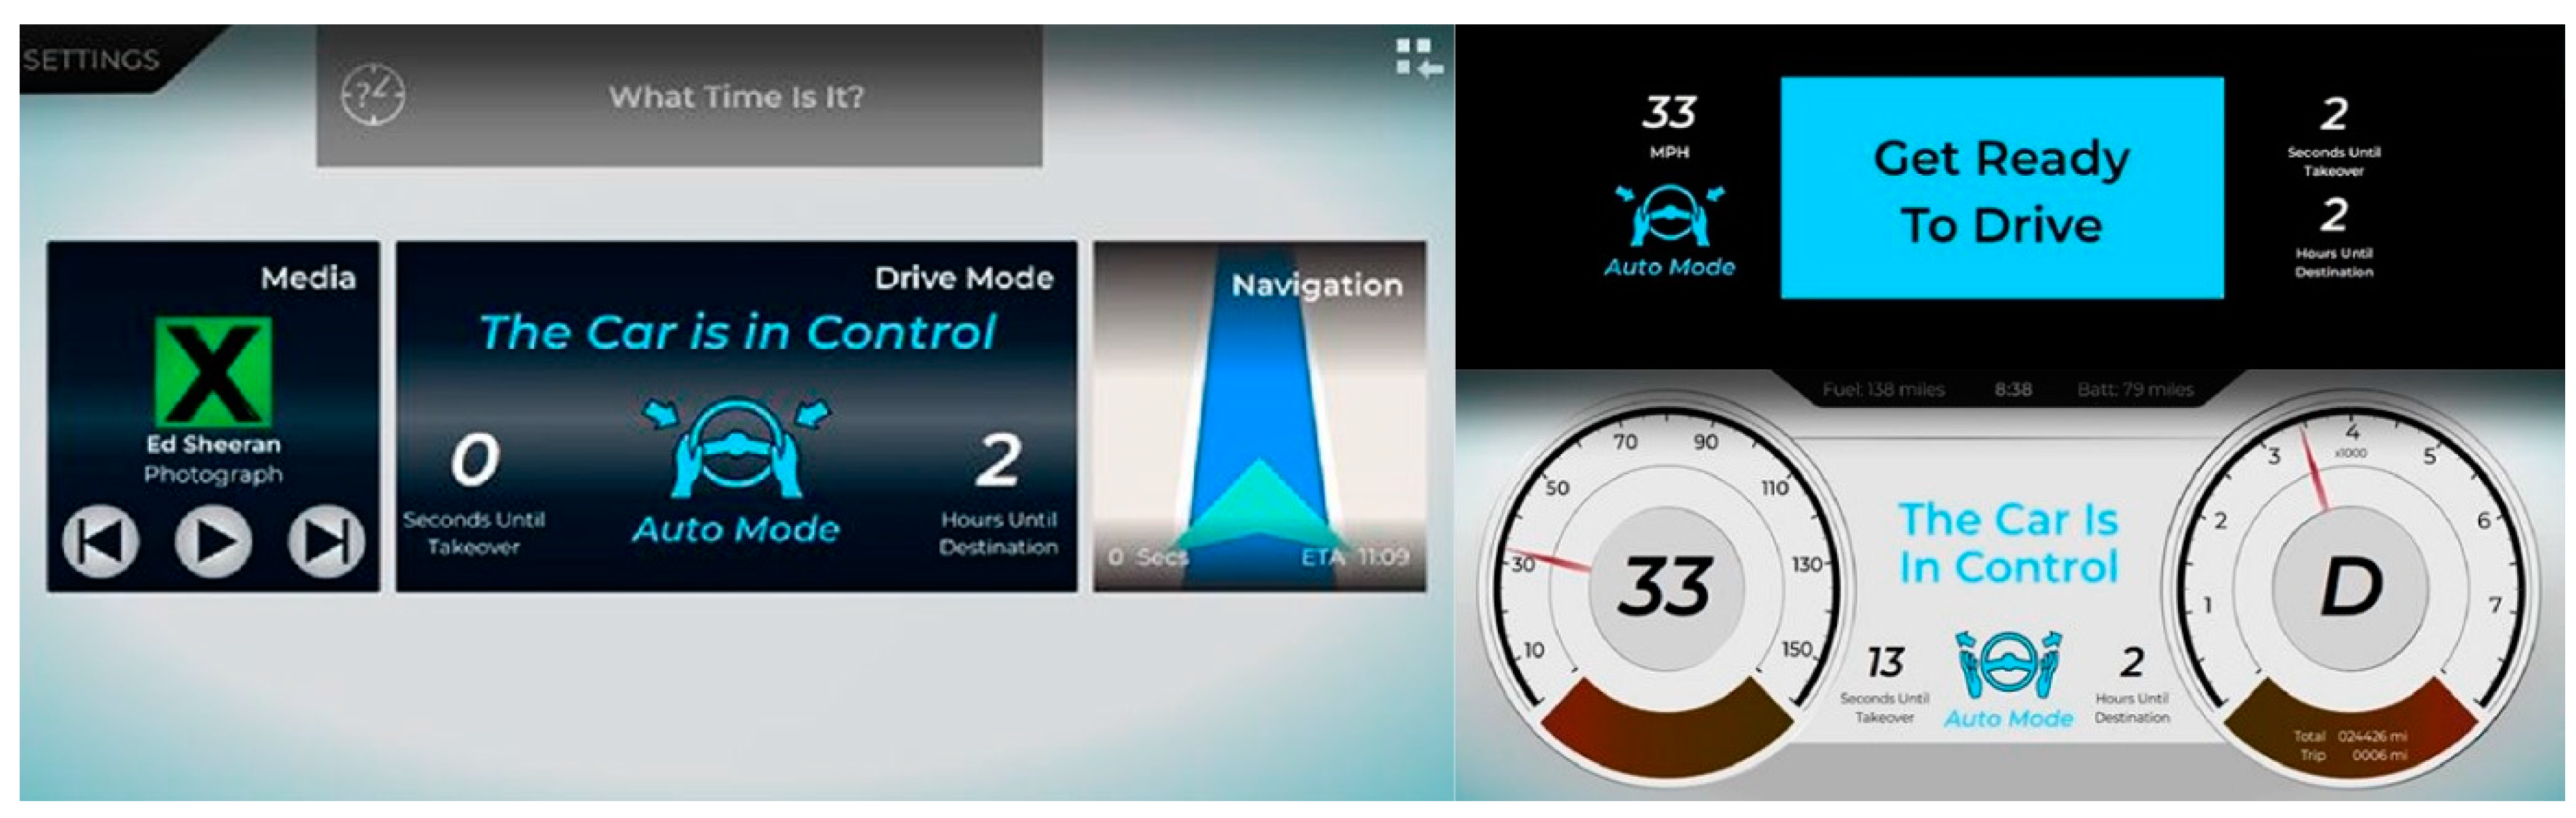
Interfaces in the vehicle comprised a Head-Up Display (HUD: showing the car in automated mode but beginning the preparation for the human driver to take control, see
Figure 7), instrument cluster (showing the icon associated with the car in automated mode, see
Figure 7), a centre console (showing the car in automated mode, see
Figure 7), haptic seat (to prompt the driver when the handover begins), speech input/output (to communicate the handover questions) and ambient light display (to indicate the driving mode when blue meant automation was in control and orange meant the human driver was in control). The engagement and disengagement of vehicle automation was undertaken by pressing two green buttons mounted on the steering wheel with the driver’s thumbs simultaneously. Audio sounds and synthesised speech were generated automatically by the vehicle automation and presented through the in-vehicle speaker system.
In addition, a Microsoft Surface tablet computer was in the cabin loaded with a Tetromino game. This was used as the secondary task to engage the driver when automation was driving the vehicle. In some conditions (if selected by the driver), a visual alert was presented on the tablet to start the handover process. This was accompanied by a speech alert through the vehicle speakers.
A control desk at the rear of the vehicle was used by the experimenter as a ‘Wizard-of-Oz’ environment, to interpret the driver’s vocal responses to the speech synthesis questions during the handover process. If the driver gave an incorrect response, then the question was repeated until a correct response was given. If more than two incorrect responses were given, then the next question was presented until all questions were answered. Then, the driver was requested to resume manual driving. All handovers were planned (not as a result of an emergency or system failure) and proceeded at the pace of the driver.
8. Procedure
On arrival at the driving simulation facility, participants were welcomed, and presented with a participant information sheet informing them of the details of the study. Their right to halt the study at any time was explained, they were then provided with an informed consent form which they had to read, initial and sign in order for the study to continue. On completion of the consent form, participants were given a bibliographical form to complete to capture demographics data. They were then introduced to the simulator. The main driving controls were explained, and they were informed of the functionality of the vehicle automation and the human–machine interfaces (instrument cluster, head-up display, centre console, haptic seat, speech input/output and ambient light display). Participants then took part in a test run, where they experienced three handovers after 1 min out-of-the-loop intervals. After completion of the test run, the main trials started with the participant being asked to accelerate onto the motorway, join the middle lane, keep up with traffic and follow the instructions presented on the displays. After a period of approximately one minute, the displays indicated to the participant that automation was available and informed them via text, icon, vocalisation and two flashing green steering wheel buttons. Participants then activated automation by pressing the two steering wheel buttons; this was followed by the instruction indicating that the automation system was now in control of the vehicle. Participants then picked up the secondary task tablet and started to engage with the Tetromino secondary task. After a period of either 1 min or 10 min, dependent upon counterbalancing, the automation indicated via the displays that the driver was required to become ready to take control. Participants were expected to put aside their secondary task, and follow the instructions presented on the displays. The handover protocol consisted of a set of questions designed to raise situation awareness. These questions were presented in vocal, word and icon form. Participants responded vocally to each question, the answers to which were judged by an experimenter taking the part of the automation system using the Wizard-of-Oz approach. Incorrect or missed questions were repeated twice before moving to the next. When all the questions were answered by the participant, the HMI indicated for them to take control, which they performed by pressing the two green buttons on the steering wheel. This constituted one handover, the process was repeated twice more; after completion, the participant was asked to pull safely to the hard shoulder and stop the vehicle. This process was repeated three more times, allowing participants to adjust the handover displays after each trial. Once the trials were complete, participants were debriefed and thanked for their time.
9. Data Reduction and Analysis
The video data for each driver during the handover process were reduced into hits, misses, false alarms and correct rejections by comparison with the Operator Event Sequence Diagram as follows (and in
Table 2):
Hits: present in the video and the Operator Event Sequence Diagram;
Misses: present in the video but not the Operator Event Sequence Diagram;
False Alarms: not present in video but present in Operator Event Sequence Diagram;
Correct rejections: not present in video and not present in Operator Event Sequence Diagram.
The latter category can be difficult to calculate as it could be infinity, but for the purposes of this investigation, it was based on the total number of false alarms generated by all 65 participants, minus the number of false alarms for each individual participant.
Inter-rater reliability testing was conducted on the categorisation scheme for approximately ten percent of the video footage between two analysts. Equal weighted Cohen’s Kappa was calculated (0.718) showing an acceptable agreement between the two independent analyses in their classification of hits, misses, false alarms and correct rejections [
42].
The data for each trial were pooled and Matthews Correlation Coefficient (Phi: [
43]) was used to quantify the correlation between the expected and observed behaviour, as a means to validate the OESDs, which was calculated using the following formula:
Phi was selected as an appropriate statistic for the validation of Human Factors methods, as it has been previously used with some success [
15,
39]. In particular, the method of categorising the data offered a way of correlating predicted behaviours from the OESD with those observed in the videos of the drivers in the simulator.
10. Results
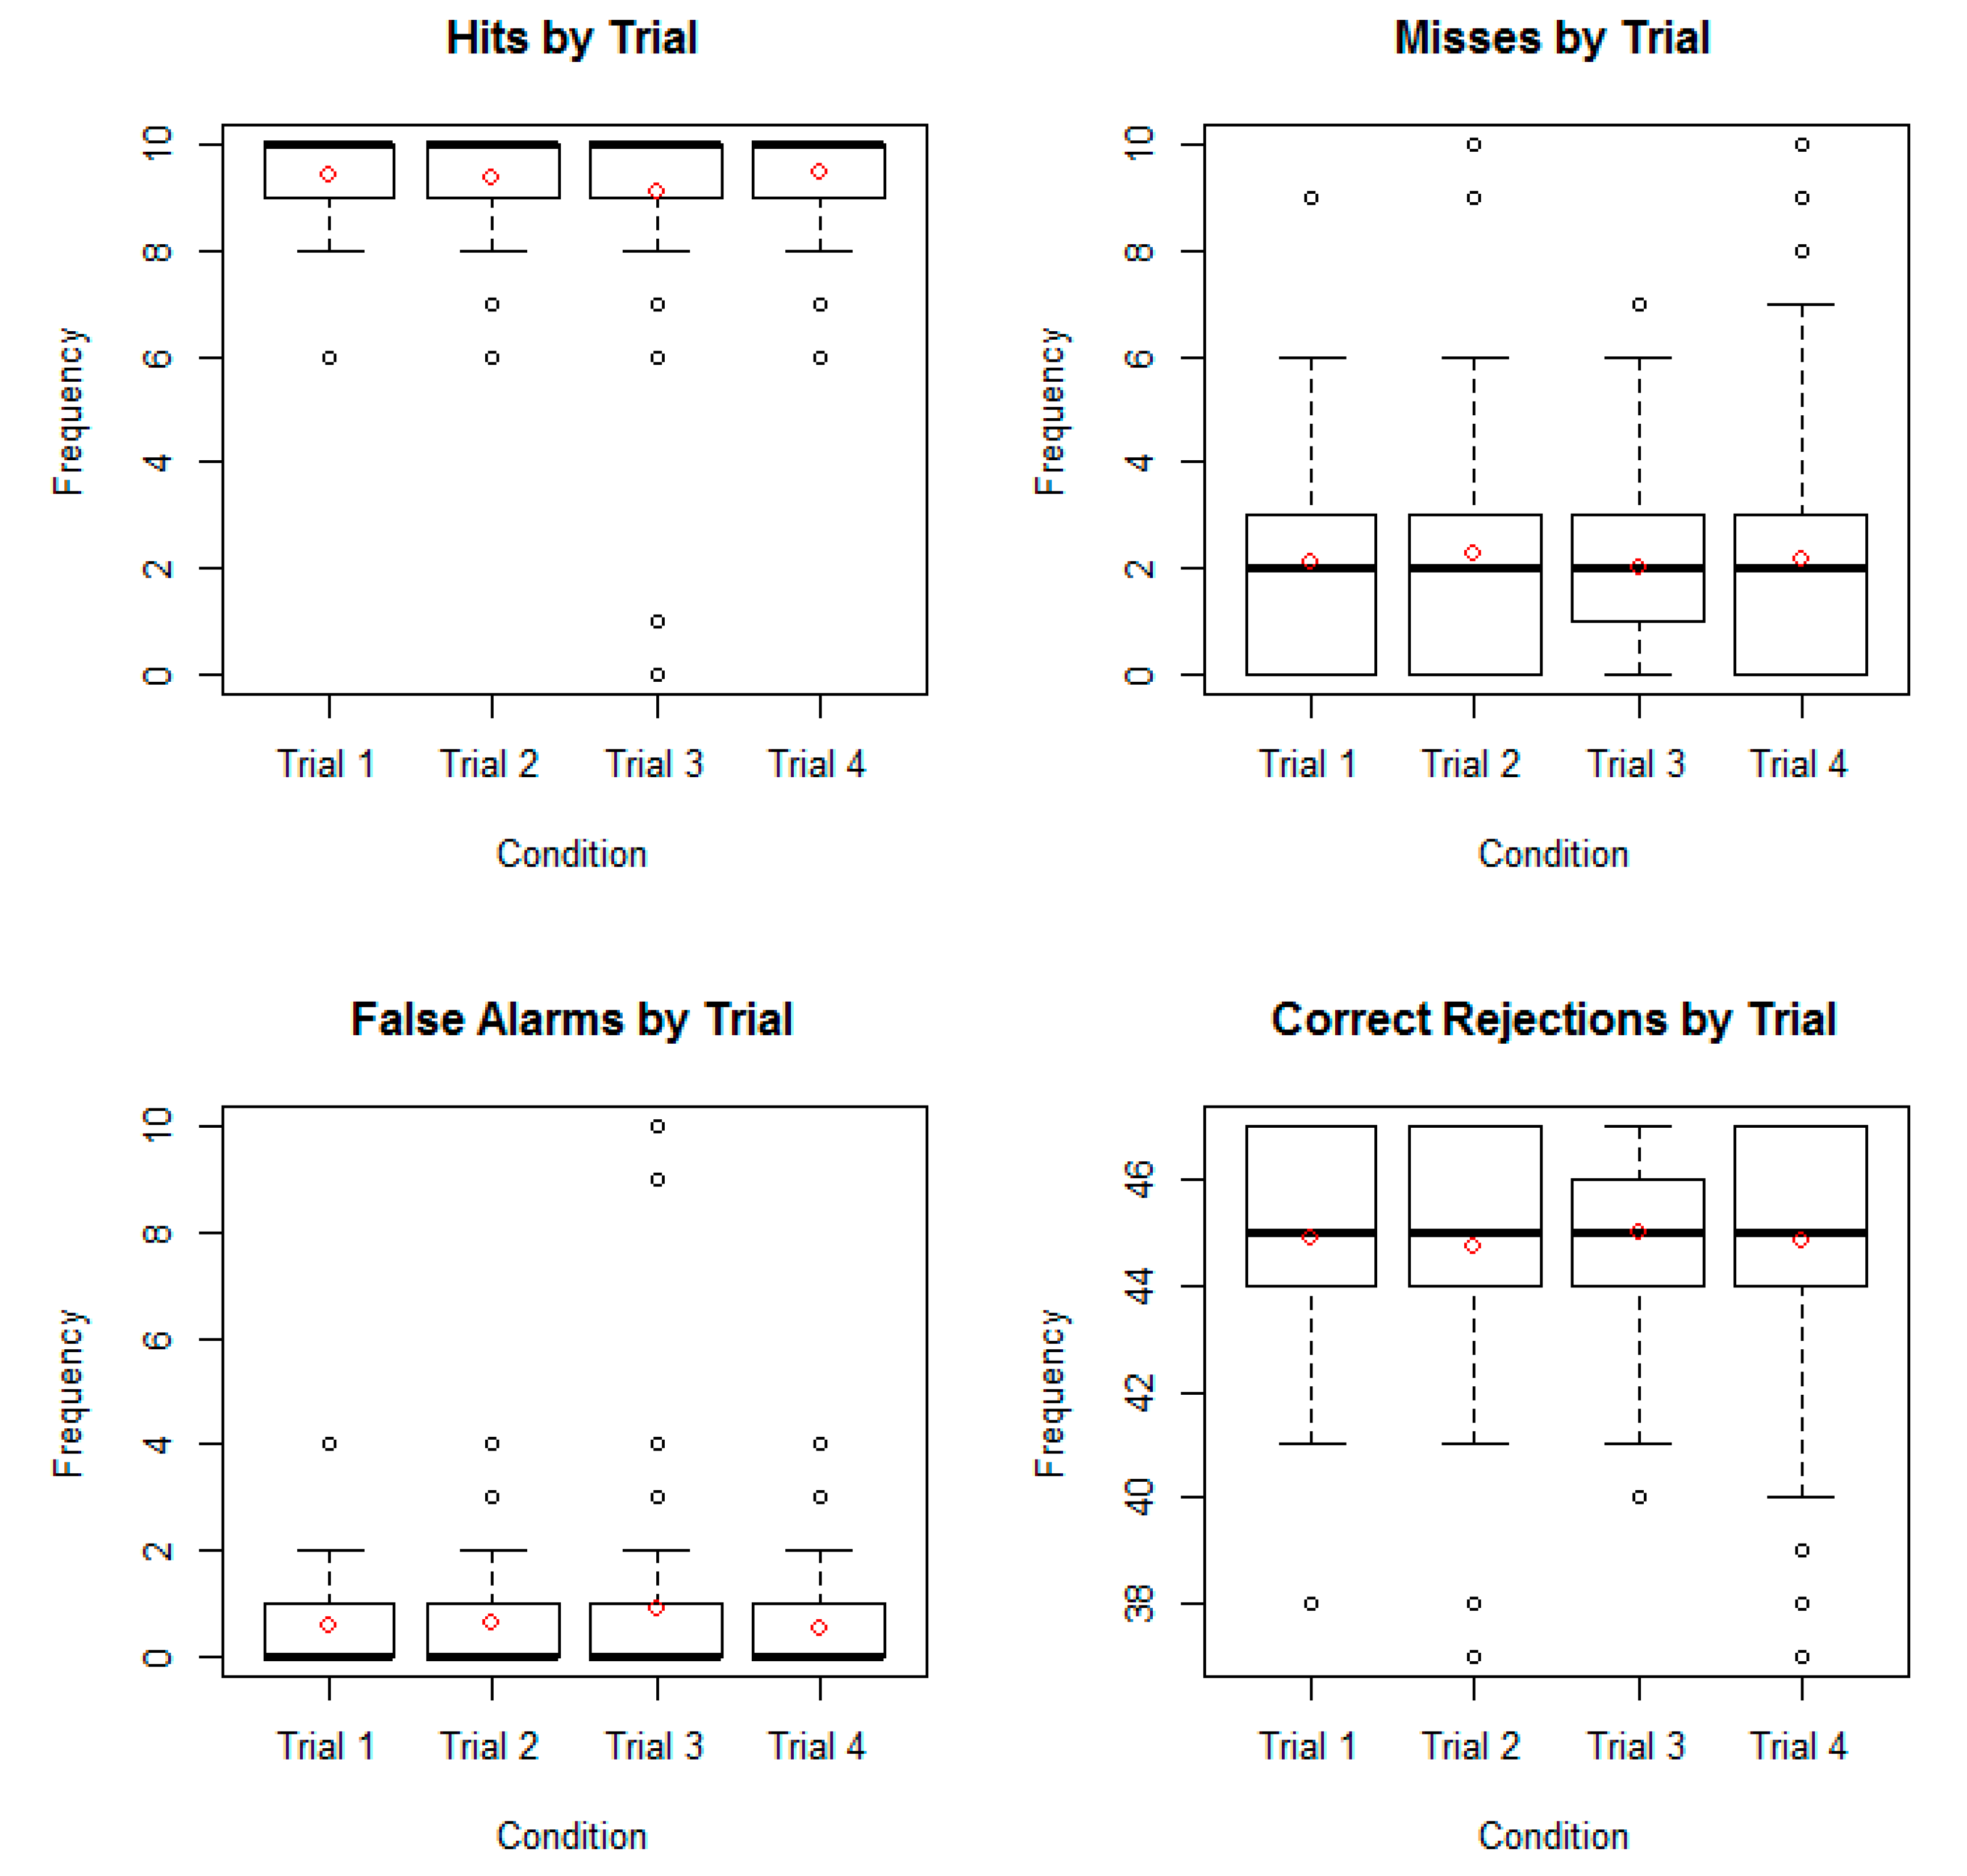
The frequency of hits, misses, false alarms and correct rejections for each of the four handovers (one for each trial) are presented in
Figure 8. The box-and-whisker plots show the median (thick line) range (whisker to whisker) and interquartile range (the box) as well as the mean (red circle) and outliers (black circles). As
Figure 8 shows, the hits were quite high (10 on average) and misses were low (2 on average). Similarly, the false alarms were low (0 on average) and correct rejections were high (45 on average). This was encouraging for the usefulness of Operator Event Sequence Diagrams to predict driver–automation handover activity before empirical studies.
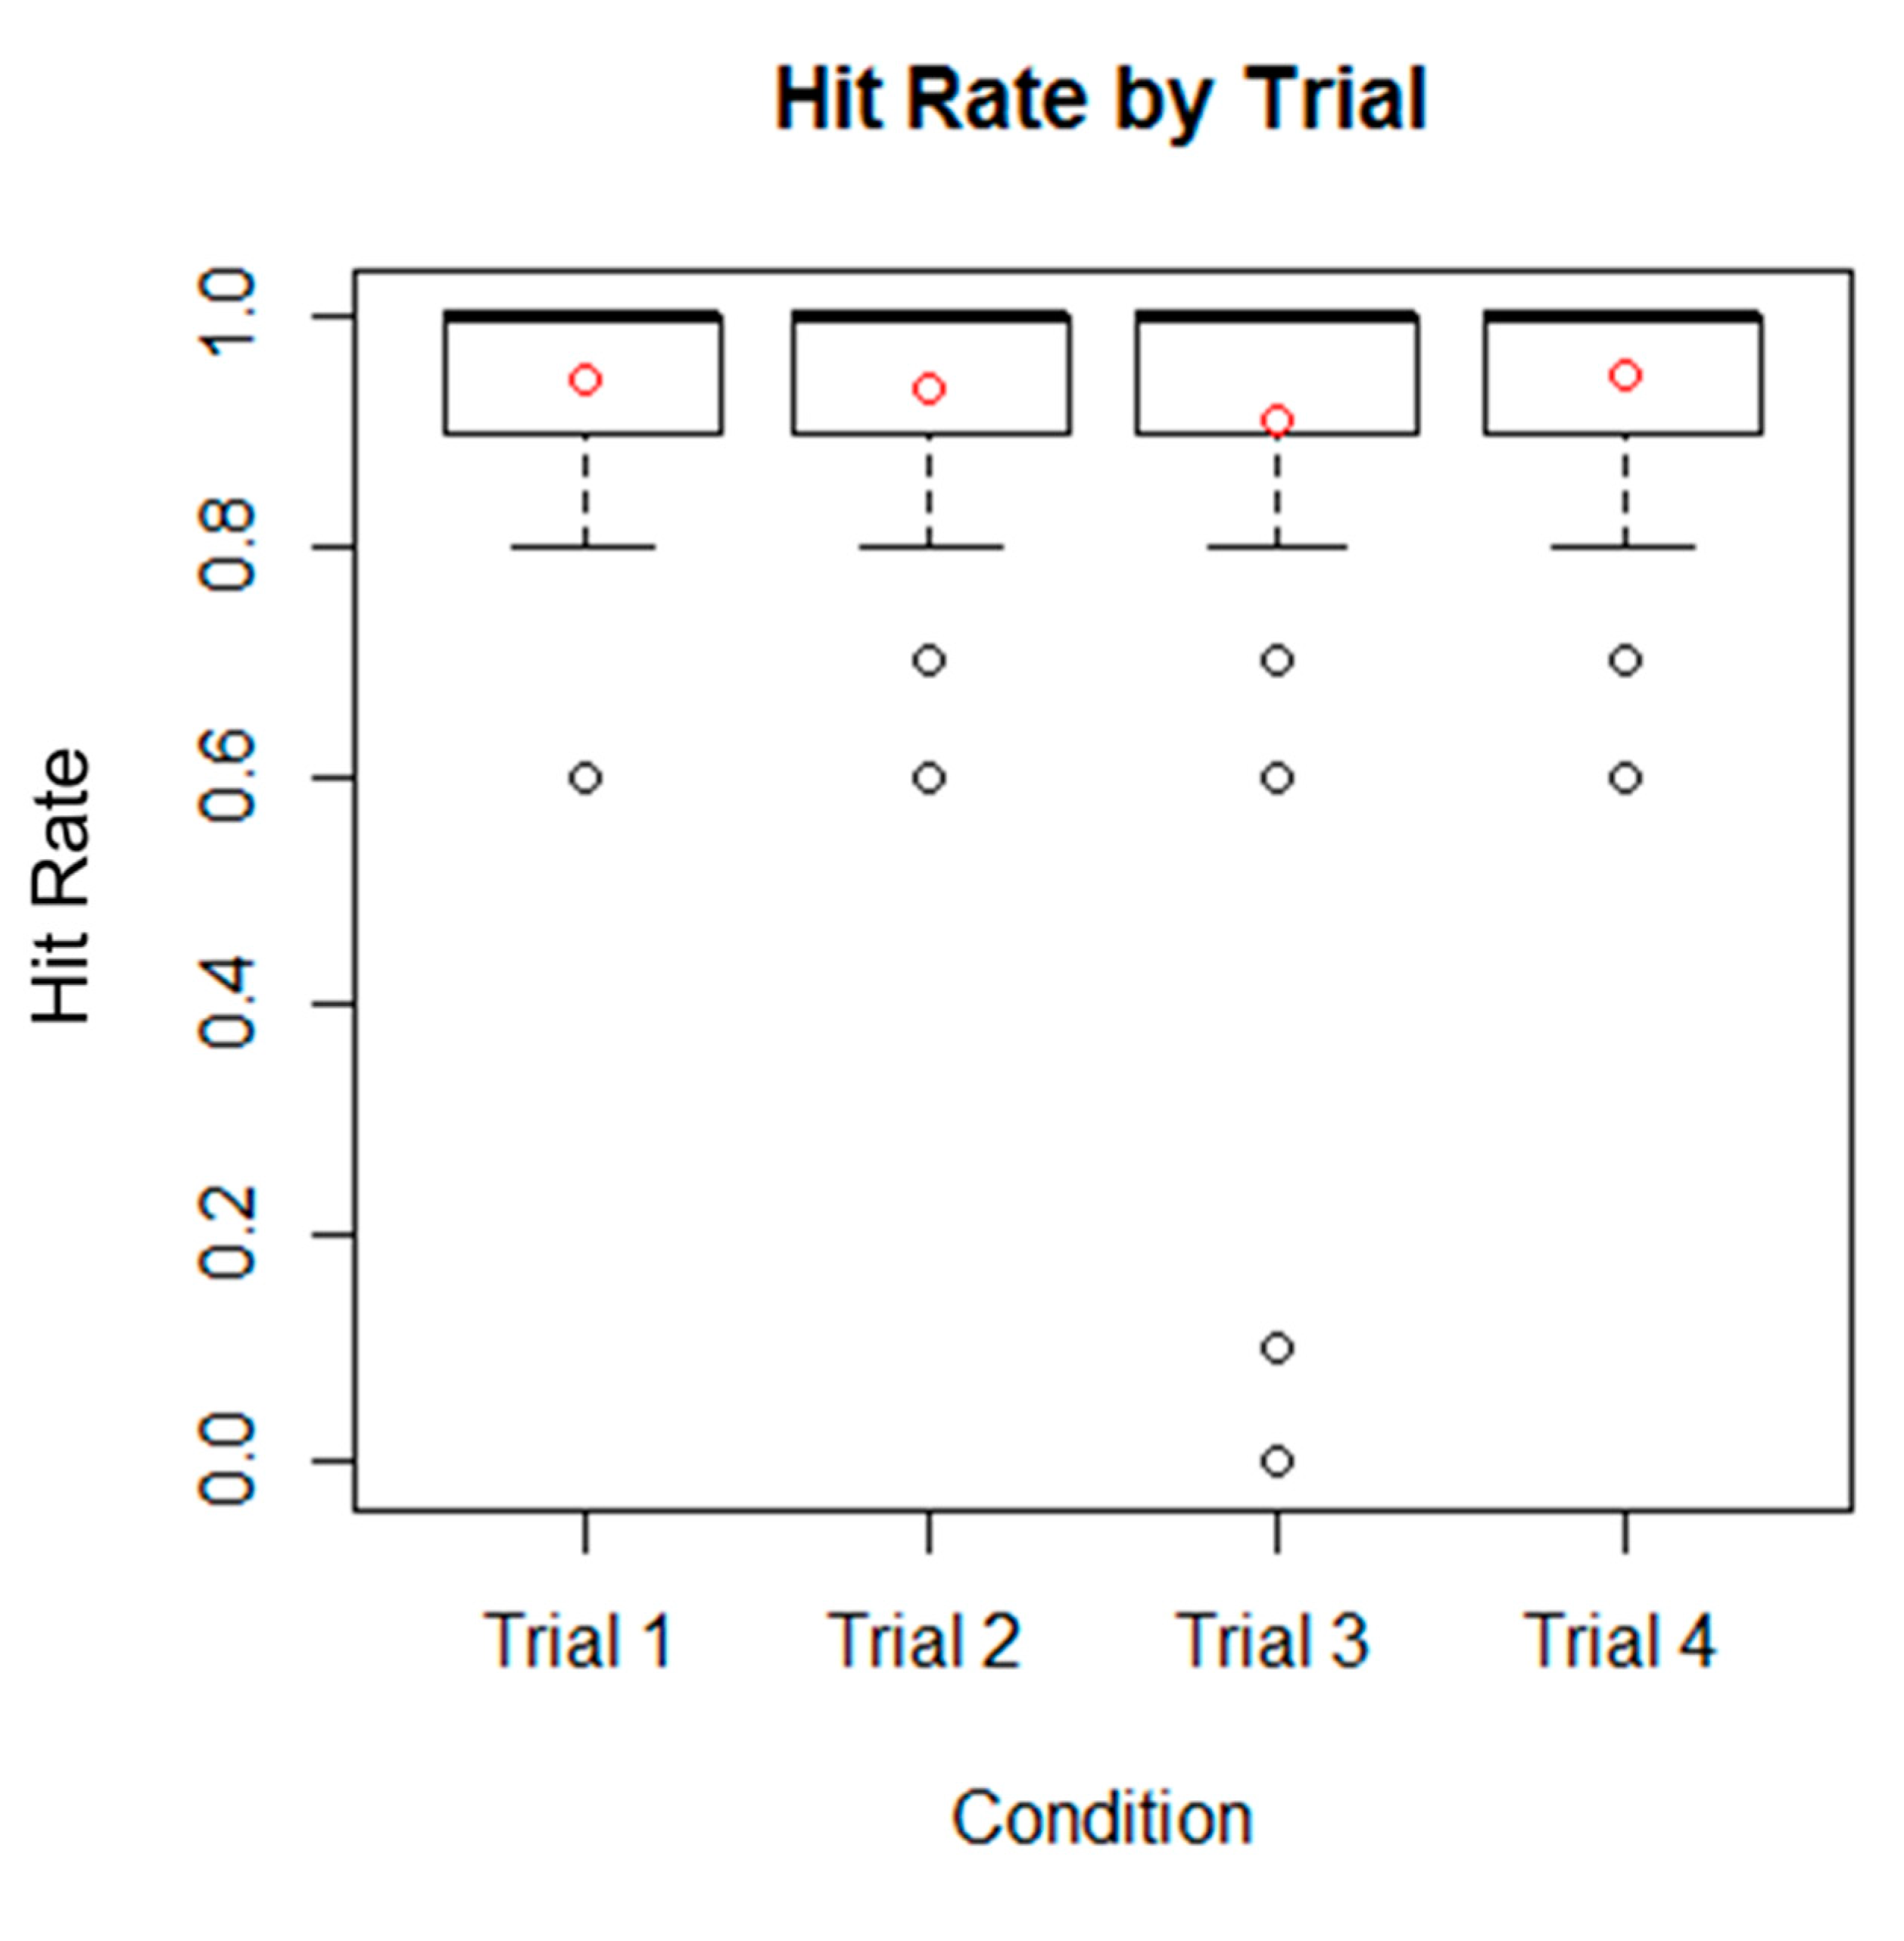
The hit rate (hits/hits + misses) was similarly encouraging, with a median of one and a mean very close to one, as shown in
Figure 9. A hit rate of one is perfect. This means that the Operator Event Sequence Diagram process was able to identify most of the behaviours that were observed.
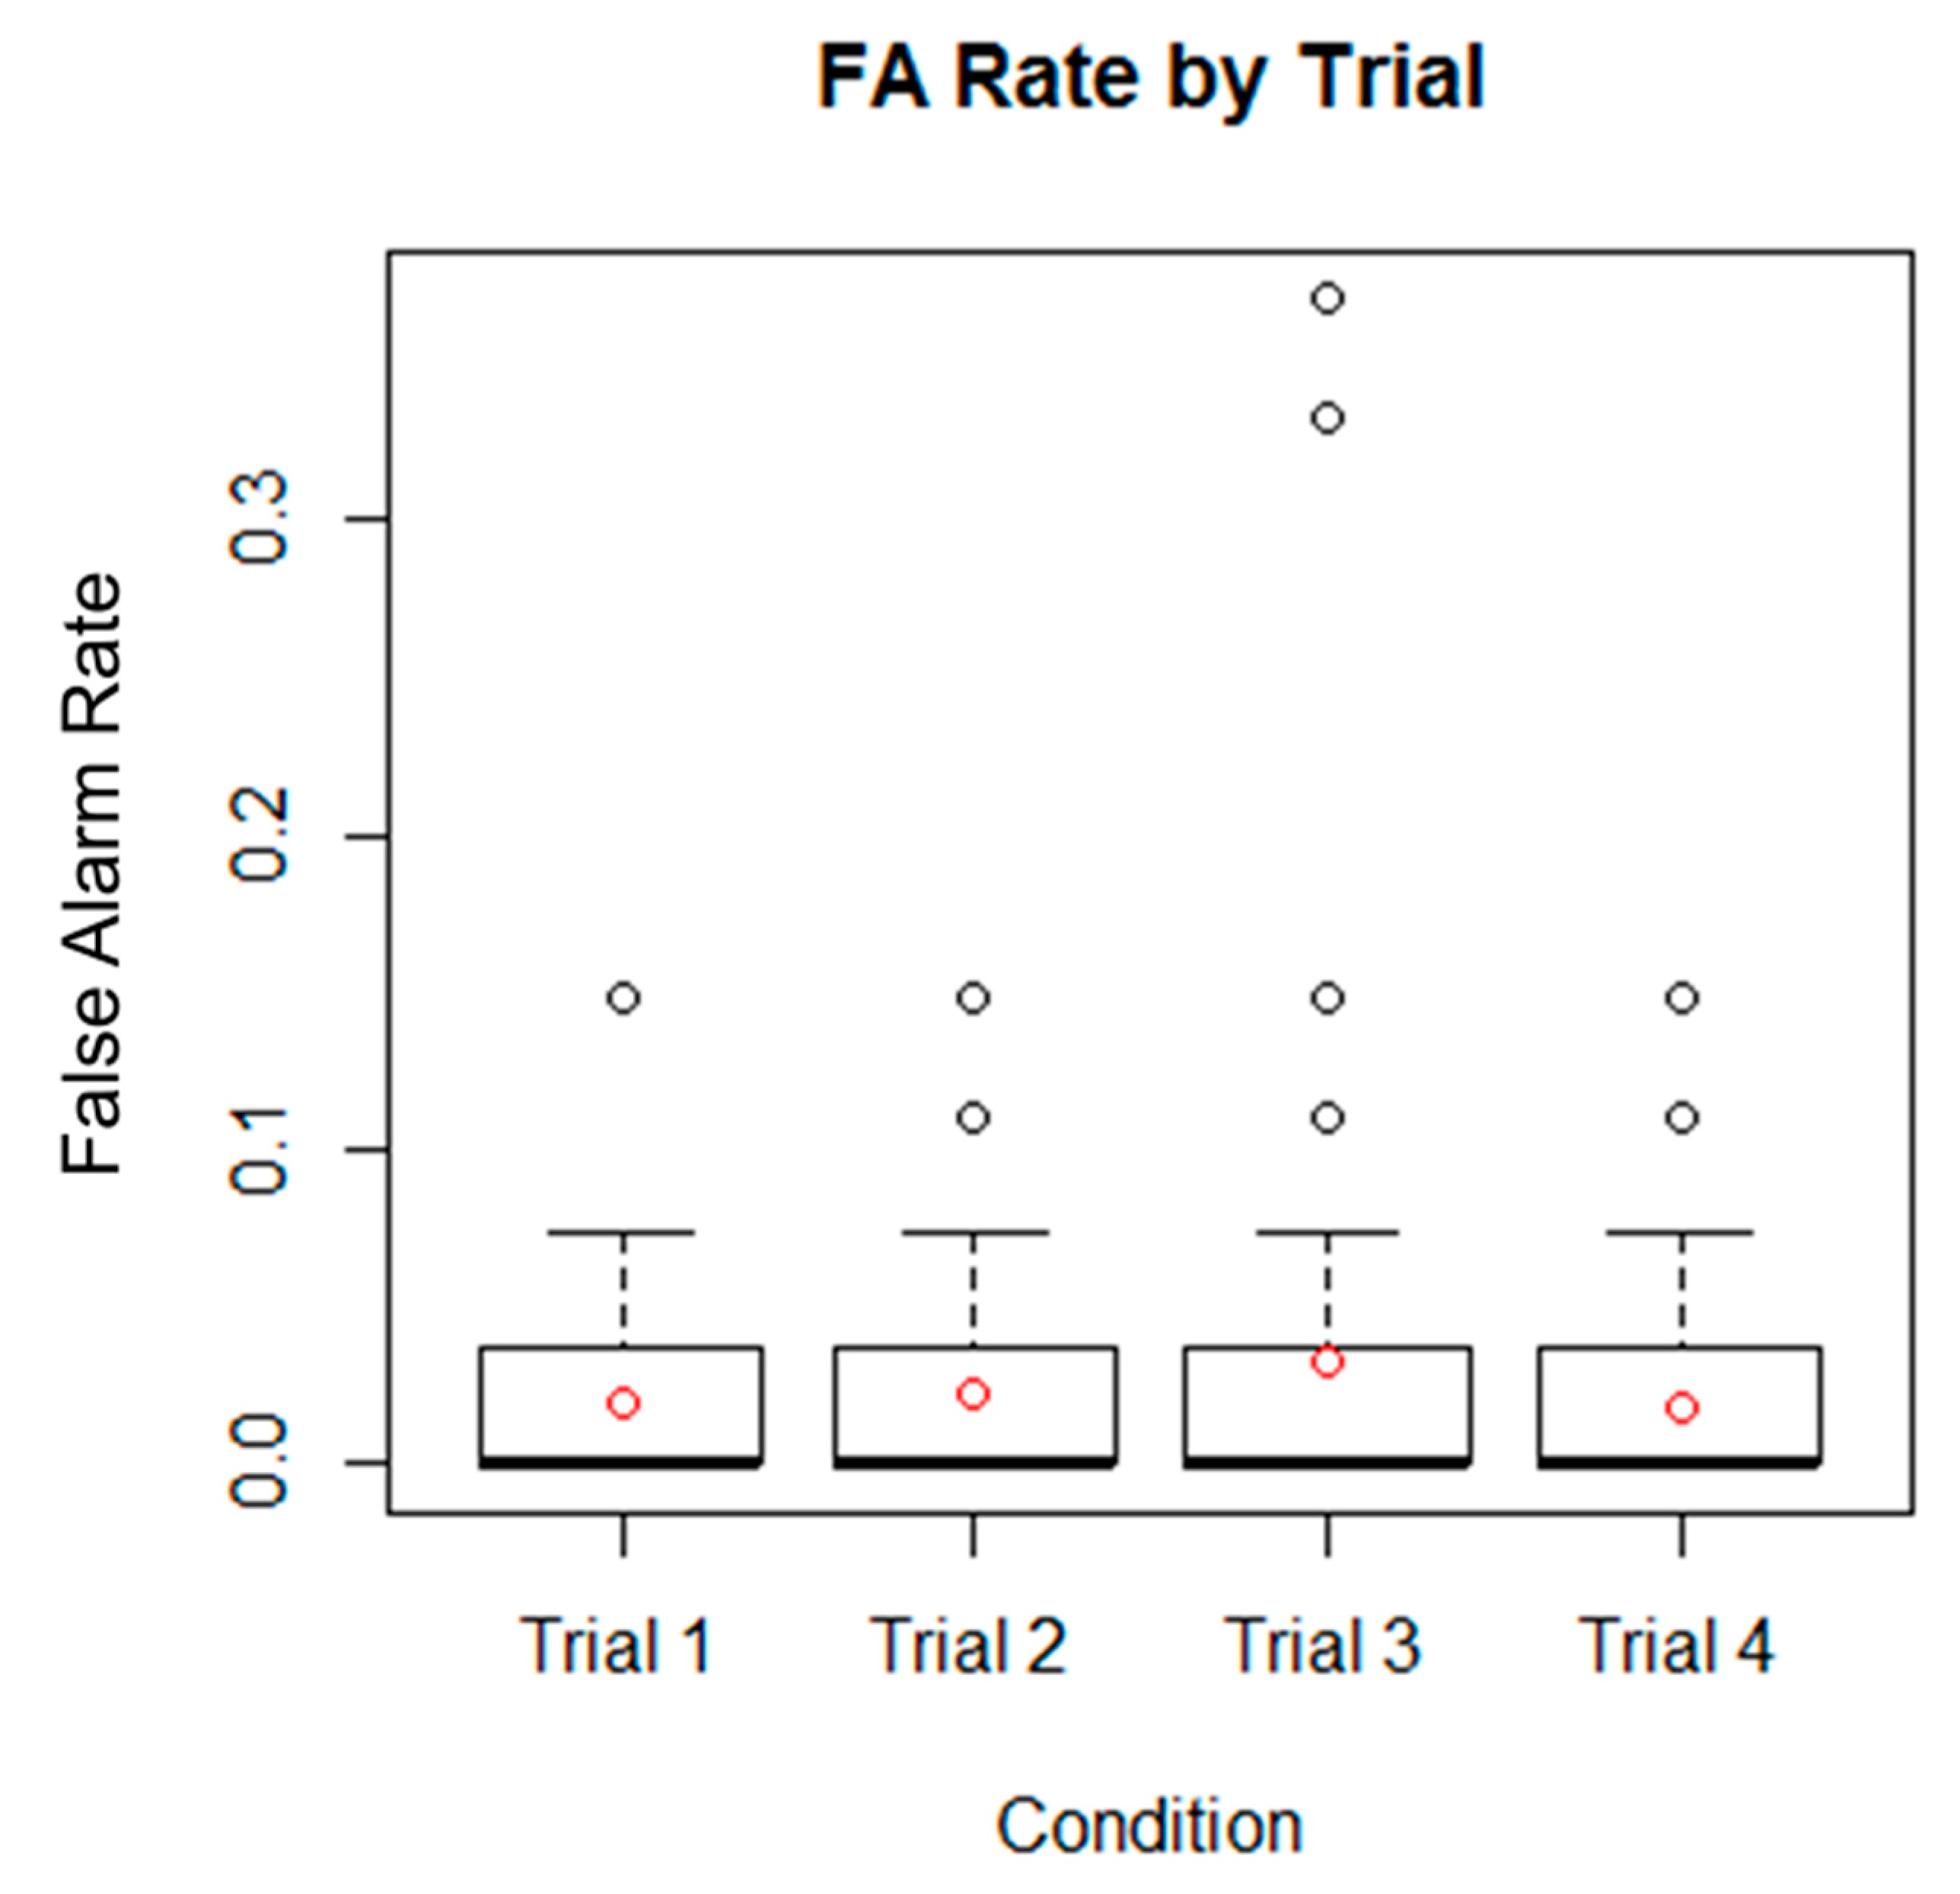
The false alarm rate (false alarms/false alarms + correct rejections) was very low, with a median of 0 and a mean around 0.03, as shown in
Figure 10. This means that the Operator Event Sequence Diagrams process tended not to predict behaviours that did not occur.
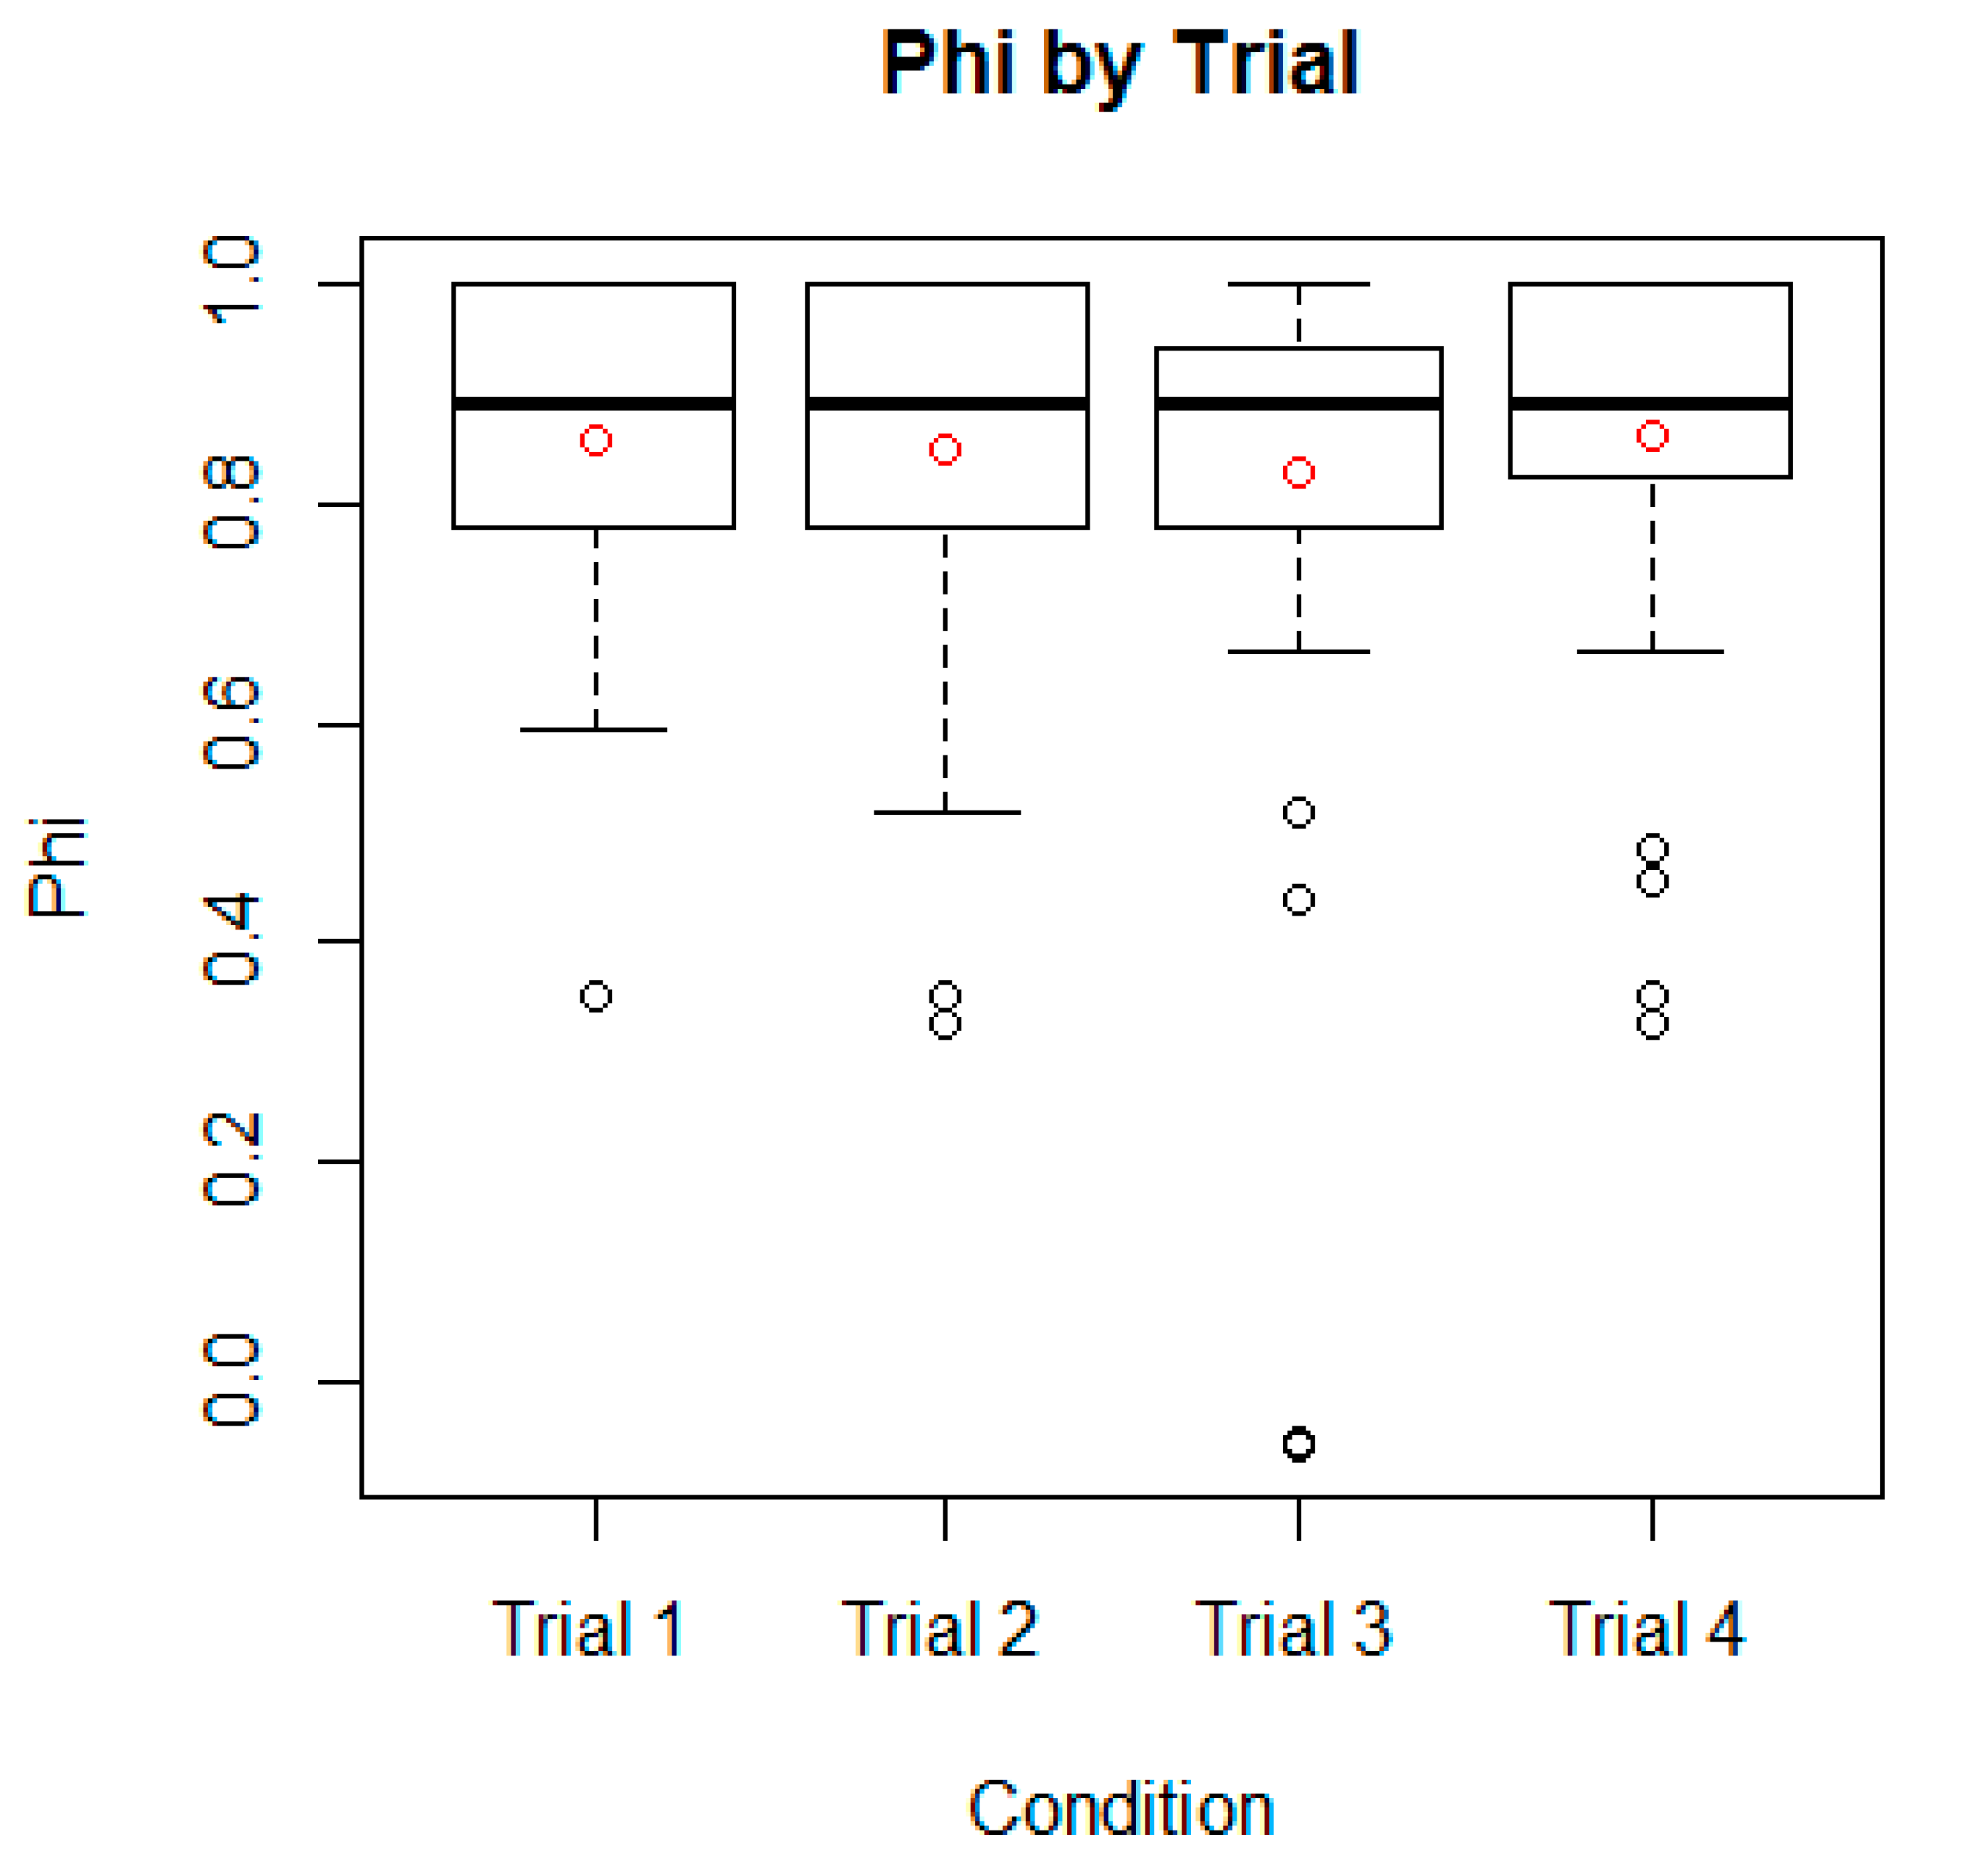
Finally, Phi was above 0.8 (the criterion value) for both median and mean values, as shown in
Figure 11. This means that the Operator Event Sequence Diagrams had a good predictive validity, at least for the driver–automation handover activity. It should be noted that the outlier in trial three at zero did not go through any of the handover protocol and simply took manual control of the vehicle. The design of the vehicle allowed drivers to take manual control at any point, but it was anticipated that they would go through the handover protocol before resuming manual control.
11. Discussion
The main finding from this study was that the Operator Event Sequence Diagram presented in this paper was able to produce reasonable predictions of the handover activity conducted by human drivers in all four trials to an acceptable level (as shown in
Figure 11). This is very encouraging for the method as not all Ergonomics and Human Factors methods performed this well [
15,
16,
34,
39]. For example, similar values have been reported for the Systematic Human Error Reduction Prediction Approach [
44] and the Keystroke Level Model [
15]. Although Operator Event Sequence Diagrams have been in continuous use over the past 60 years, we know of no other formal test of predictive validity [
17]. This finding has important implications for the use of the method as a modelling activity before empirical studies with human participants. This lends credibility to the comparative analysis used by others for choosing between alternative design solutions [
5,
6,
10] and modelling future human–automation interactions [
45]. Indeed, on the basis of this study, Operator Event Sequence Diagrams could be seen as a possible method for discriminating between alternative approaches for the human–automation interaction, where there are too many alternatives for empirical studies.
Moray [
3] proposed that the modelling of human performance in technological systems has long been the goal of the discipline of Ergonomics and Human Factors. Certainly, this would help raise the credibility of the methods as in the engineering of systems. Some progress has already been made on the empirical validation of some of the methods, such as those that predict task-related human error [
37] and task time [
23,
24], which have shown acceptable levels of performance. The prediction of the tasks themselves is what was presented in the current research. Certainly, the performance of the Operator Event Sequence Diagram in the study of handover has achieved similar levels to those reported for other methods [
7,
34]. This means that there is good evidence for their continued use, but future studies should attempt to provide validation data in a range of applications and domains.
Research into handovers in a wide range of domains has shown that this task is problematic [
46], particularly with the failure to transmit appropriate information from one agent to another [
20]. Certainly, handovers from automated systems to human drivers are no exception [
31,
47]. This is a field of endeavour that is currently challenging researchers to facilitate raising the situation awareness of the driver before the handover is completed [
30]. Situation awareness is a hotly debated topic in Human Factors, with views ranging from it being a concept that resides in the mind of humans [
48] to that of it being embedded within the interaction of a sociotechnical system [
49]. In vehicle automation, there is an argument for the latter approach [
30]. Certainly, an automated vehicle needs to be aware of the surrounding vehicles, road environment and infrastructure similar to a human driver, albeit in different ways. In the handover process, some vehicle manufacturers are simply providing a countdown for the time until vehicle control becomes the responsibility of the human driver. This approach does not provide any guarantee about what is transferred in the handover. The approach presented in this paper took inspiration from human–human handovers [
50], which aim to support the transaction of awareness of the situation between system agents. The Operator Event Sequence Diagrams can help to make the specification of what is to be transacted more explicit in the design of the interfaces, as was the case in the study reported in this paper.
What the Operator Event Sequence Diagram was not able to predict was the occasion when the driver simply took control of the vehicle without going through the formal handover protocol. This was just one participant, as shown in
Figure 11 on trial 3. That stated, one would not wish to design a handover protocol that would force drivers to go through every handover step if they wanted to resume control immediately. The design of the handover protocol was focused on guiding drivers back into the driving task through a series of situation awareness transactions between the driver and vehicle [
30].
At present, Operator Event Sequence Diagrams model normative performance of systems. Armed with this early validation evidence, their use could be expanded to include the non-normative performance of systems [
32]. Typically, such an analysis tended to focus on either human [
18] or technical [
51] failures in systems, although not exclusively so [
20,
52]. A possible future direction for the further development of Operator Event Sequence Diagrams could address the potential to model failures in automation and suboptimal responses by human drivers together. The ‘miss’ data observed in the current study could serve as a starting point for the modelling of alternative human activity, such as taking over control of the vehicle at any point during the handover protocol.
Another avenue for the development of Operator Event Sequence Diagrams could be the addition of time data to both the human and technical activities, to model the minimum, maximum and median handover times [
38]. Prediction of task time is quite popular in Human Factors modelling [
22], and there are examples of application in domains such as the human–computer interaction [
23], rail [
24] and in-car infotainment systems [
38]. Given the growing literature on automation–human handover times, (see Eriksson and Stanton, [
53] for a review), modelling such activities could prove useful in helping to understanding how to improve the design and efficiency of the protocols.
There is the broader question of the validation of Human Factors and Ergonomics methods more generally to be addressed by the community [
17]. These are obvious differences between novice [
15,
16,
39] and expert analysts [
54,
55], with experts showing better validity data than novices. However, there are also domain differences in validity data, suggesting that the classification schemes may have a domain bias (Stanton et al., 2009). The classification scheme for the activities in Operator Event Sequence Diagrams has developed over the past 60 years [
5], with developments in technologies and the changing nature of human work. It is reasonable to expect the scheme to continue to evolve, particularly as technologies become more animated and with developments in automation and artificial intelligence [
30].
In broad terms, this paper also demonstrated how Operator Event Sequence Diagrams can be used to undertake the human-centred automation design, focusing on the handover problem. It is suggested that the approach can be used in the co-evolution of both human and technical subsystems with the sociotechnical systems paradigm [
56]. Operator Event Sequence Diagrams are used to guide the task sequences and define what needs to appear on the interfaces in different media. Each of the media had their own ‘swim-lane’, so that the design could be coordinated. In this way, the Operator Event Sequence Diagrams provided a structured approach to guide the design. In each stage of the design, the interaction was simulated in the Operator Event Sequence Diagram first, to check that the automated and human agents were coordinated. When satisfied that this was the case, the prototype interfaces were built and tested with human participants in a driving simulator. Some iteration between the Operator Event Sequence Diagrams and the simulator prototypes was required before the final interfaces were accepted for testing with drivers.


 ,
, 


