Article

Consumer Adoption of Plug-In Electric Vehicles in Selected Countries

O’Neill School of Public and Environmental Affairs, Indiana University, Bloomington, IN 47405, USA
*
Author to whom correspondence should be addressed.
Future Transp. 2021, 1(2), 303-325; https://doi.org/10.3390/futuretransp1020018
Submission received: 27 June 2021 / Revised: 24 July 2021 / Accepted: 29 July 2021 / Published: 10 August 2021

Abstract

:
The transition to plug-in electric vehicles is examined from the consumer’s perspective. Since risk-averse consumers perceive disadvantages as well as advantages, consumers are reluctant to choose electric propulsion without significant nudges from the government. Norway, California, Germany and China are analyzed to determine why and how electric vehicles are promoted by public policies. Each jurisdiction has accomplished rates of electric-vehicle penetration that are far above the global average. This success is largely attributed to various policies which range from vehicle mandates, producer and/or consumer subsidies, or taxation in respective regions—otherwise PEVs remain relatively unappealing to risk-averse consumers. Demand and supply side policies have been effective tools in spurring adoption of the new electric propulsion system. Norway is one notable jurisdiction that has PEV penetration exceeding 80% of new vehicle sales despite no supply side incentives. Germany has recently surpassed California and China in PEV penetration rate, though all three jurisdictions exceeded 10 percent by 2020 or early 2021. Research is recommended to identify ways to encourage consumer adoption of electric vehicles.

1. Introduction

When entrepreneurs bring an invention to the marketplace, they are often stunned to learn that many consumers are not interested in their invention. The harsh reality is that 60% of new products in the economy are no longer sold within three years [1]. Marketing experts argue that inventors do not focus enough on understanding how customers evaluate products and make purchase decisions [2].
The modern plug-in electric vehicle (PEV) is an invention that is gaining market momentum but not at the rate that politicians desire to address urgent societal concerns such as poor urban air quality, global climate change and energy insecurity. The global penetration rate of PEVs in the new vehicle market grew from virtually 0% in 2010 to about 4.6% in 2020 [3].
We use the umbrella term “plug-in electric vehicles” (PEVs) to encompass all-electric vehicles and plug-in hybrid-electric vehicles (PHEVs). Conventional hybrid electric vehicles (HEVs) are not PEVs because they do not access the grid for electricity. The term battery-electric (BEV) is also used to refer to all-electric vehicles.
Except for a few premium PEVs (e.g., the Tesla Model S and the BMW i3), the actual number of sales of first-generation PEVs fell far short of the corporate sales goals established by vehicle manufacturers [4]. Table 1 compares the corporate sales plans for each first-generation modern PEV with the number of PEVs actually sold in the US or globally. In general, the affordable PEVs aimed at the mainstream retail market (the MiEV, the Chevrolet Volt, and the Nissan Leaf) fell far short of achieving their sales goals. The upscale PEVs aimed at the luxury-sedan segment did better, with the Tesla Model S selling better than Tesla’s goal. The shortfalls suggest that the companies selling the more affordable PEVs underestimated—by a big margin—how difficult it would be to sell them.
Some cities, countries and regions have experienced rapid penetration of PEVs, especially where policy makers create strong incentives for consumers to select a PEV and/or strong disincentives to purchase a conventionally powered vehicle. In 2020, for example, the rate of PEV penetration of new vehicle sales was almost 75% in Norway, 13.5% in Germany, 8.1% in California and about 5.4% in China [6]. Table 2 illustrates the discrepancies in EV uptake across various regions around the world.
In this article, we explore the challenges of mass commercialization of PEVs and offer insights as to why different jurisdictions are at different stages of commercialization. To the best of our knowledge, this is the first academic paper to compare these four jurisdictions in terms of motivations for PEV policy and the mix of pro-PEV policies that they chose to adopt. We build on the substantial pre-existing literature that evaluates the effectiveness of different policy instruments; see [7,8,9,10,11].
We start from the perspective of the mainstream retail purchaser of light-duty passenger vehicles. We identify the salient advantages and disadvantages of a modern PEV compared to conventionally powered vehicles. For each disadvantage, we describe innovations underway to reduce or minimize the disadvantage. We then consider how risk aversion among ordinary consumers complicates efforts to sell PEVs to mainstream buyers, especially since conventional hybrid electric vehicles (HEVs) and plug-in hybrid electric vehicles (PHEVs) are viable alternatives to all-electric vehicles. In the last section of the paper, we describe steps policy makers are taking to stimulate commercialization of PEVs. We focus on policy innovations in Norway, California, Germany and China. We conclude with some future research needs related to consumer adoption of PEVs.

2. Consumer Perspectives

In 2015 an expert committee of the US National Research Council identified the possible advantages and disadvantages of PEVs from the consumer’s perspective [12]. These factors are not societal concerns (pollution, climate change and energy insecurity) because most consumers evaluate PEVs based on private considerations rather than societal concerns. An exception is the “early adopter” community which sometimes has societal symbolism in mind when they purchase their vehicle. The State of California found, for example, that some early buyers of the Nissan Leaf (38%) and Chevrolet Volt (18%) cited “reducing environmental impacts” as the most important reason for their vehicle choice [13].
There is a substantial literature on the perceptions and characteristics of early adopters of PEVs in different countries. Early adopters are crucial to creating the positive “word of mouth” praise that boosts the commercial fortunes of new technologies. Once PEV commercialization proceeds beyond the early adopters, it becomes more important for the PEV to have a tangible value proposition related to a household’s transport needs [14].

2.1. Advantages

2.1.1. Sporty Performance

The instant response of the electric motor in a PEV creates a meaningful difference in pedal response for consumers who notice acceleration. It shows in street-start acceleration—also called the “rolling start” test—from 5 to 60 miles per hour (mph). While rolling with the car in gear, testers floor the accelerator at 5 mph and shift quickly at the optimal shift point. One test compared the Tesla Model 3 to the gasoline powered BMW 330i, a popular sporty sedan. In the rolling start test, the Model 3 consumed 5.1 s, 1.4 s faster than the 330i [15].
One of the reasons that PEVs have penetrated the near-premium and premium sedan market is that consumers of such vehicles tend to value performance. This is also the reason that PEVs may have promise in the large US market for pick-up trucks, where acceleration and towing capability are important dimensions of performance.

2.1.2. Lower Operating Costs

The PEV’s most tangible advantage is lower operating cost. In the United States, where gasoline taxes are relatively low, consumers pay USD 2 to USD 4 per gallon for gasoline (depending on the state); since electricity prices are quite low, travel-equivalent operating cost of a PEV is about 60–70% smaller than a gasoline vehicle. Given travel patterns in the US, a consumer can expect to save USD 500–1000 per year, assuming the consumer can access low residential electricity rates (which usually requires at-home charging) [16]. The comparison in most of Europe is even better for PEVs because electricity prices are not much higher than the US, but fuel prices (due to heavy taxation) are two to three times higher than US fuel prices. China’s fuel prices are an intermediate case between the extremes of the US and Europe.

2.1.3. Lower Maintenance and Repair Costs

The PEV’s design is simpler than a gasoline- or diesel-powered vehicle due to fewer moving parts that can wear out and no oil changes or emissions-system repairs [17]. In the US, a consumer might save an average of USD 400 per year in maintenance and repair, assuming the PEV’s battery does not fail and require replacement (discussed below under disadvantages) [18]
As policy makers require vehicle manufacturers and suppliers to address the full lifecycle costs of batteries (e.g., disposal of battery wastes and/or recycling of batteries), the prices of lifecycle management will need to be reflected in the purchase price of the PEV.

2.1.4. Convenience in Daily Use

For owners of PEVs that can charge their vehicles at home and/or work, they avoid the hassle of making special trips to gasoline refueling stations. Even for motorists that lack home and workplace charging, a well-developed public charging system may allow them to routinely charge while engaged in other activities such as grocery shopping, medical visits, and shopping mall trips.
However, if PEV owners make extensive use of public charging during peak times, peak loads on the grid will rise and more capacity may be required. A smart grid network is likely to include time-of-day pricing for electricity that encourages charging at off-peak times (e.g., nighttime charging). Thus, there is a tradeoff between making charging convenient for PEV owners and smoothing the demand for electricity for electricity providers.

2.1.5. Less Internal Vehicle Noise

During vehicle operation, a PEV is quieter than a gasoline- or diesel-powered vehicle [19]. A study of taxi drivers suggests that a PEV’s quieter driving experience contributes to enhanced mental health due to reduced stress and greater happiness [20]. PEVs are so quiet that regulators in Europe and the US have set minimum standards for external noise to protect the safety of unsuspecting pedestrians (e.g., the blind).

2.2. Disadvantages

If PEVs had no disadvantages, the five advantages would likely be compelling enough to trigger a rapid transition to PEVs. The hard truth is that PEVs do have some disadvantages, though efforts are underway to minimize those disadvantages.

2.2.1. Higher Purchase Cost

A 2018 comparison of manufacturer suggested retail prices (MSRPs) in the US market found that the average price premium for a PEV, within vehicle segment, ranged from USD 6000 to USD 17,000 [21]. Since some automakers are selling PEVs at a loss to achieve regulatory compliance, it is likely the observed price premiums are temporarily deflated below break-even levels.
The biggest single contributor to the cost of a PEV is the lithium-ion battery pack, and 70–90 percent of pack costs are battery-cell costs [22]. Average battery cell costs declined by 80% from USD 1000 per kWh in 2010 to USD 200–300 per kWh in 2018 [23]. The price declines in 2019–2020 continued, with the lowest prices in the industry below USD 150 per kWh [24]. A rule of thumb in the industry is that PEV applications for sedans might achieve cost parity with gasoline vehicles if battery prices fall below USD 100 per kWh [25]. Figure 1 displays the projected decline in battery-cell prices over the next decade (e.g., as new battery chemistries curtail the use of expensive cobalt) but experts disagree about how much and how fast. The production costs of electric motors, inverters and electronics should also fall significantly by 2030 due to economies of scale in production.
Naïve forecasts suggest that PEVs may be cheaper than gasoline vehicles within a few years. Those forecasts ignore some countervailing trends that will put a floor on battery-cell prices: rising prices for raw materials (which account for a larger share of cell costs than they did ten years ago); regulations on mining companies that minimize environmental damages of mining; regulations that require less use of hazardous materials in cell design and end-of-life battery waste-management plans (including recycling of batteries or components); new battery designs that can simultaneously increase driving range while reducing charging time; and enhanced cooling systems to further reduce heat-related battery failure and safety risks [27]. Completely new battery designs (e.g., solid state batteries) are promising but unlikely to achieve significant market penetration prior to 2030. Given the above, it seems likely that PEVs will be more costly to produce than gasoline vehicles for the foreseeable future. The cost issue is especially concerning for light trucks (SUVs, minivans and pickup trucks) since such vehicles require relatively large battery packs because of their weight and vehicle profile (poor aerodynamics). Consumer demand for light trucks is growing faster than demand for sedans in the US, Europe and China [28].

2.2.2. Limited Driving Range

Why have PEVs with driving ranges less than 100 miles not been successful commercially successful? The average number of miles of travel per day varies across countries but all the averages are far below 100 miles per day (Japan 14 miles, Germany 25 miles, US 27 miles and China 30 miles) [29]. The reason is that consumers purchase vehicles to meet their predictable peak transport needs, not their average needs [30]. Think of consumers who buy a four-wheel drive vehicle because it snows several times a year or drive a pickup truck because they can tow their trailer a few weeks in the summer. Extreme uses are highly salient to consumers [5] (pp. 34–64).
American households want vehicles that can make long trips during the Memorial Day, Independence Day, Labor Day, Thanksgiving and Christmas holidays. Even in Europe, where intercity train service is much better than the US, many households own (or rent) a private vehicle to drive from northern Europe for extended vacations in Spain, southern France, Italy and Greece. Additionally, marketing PEVs in colder climates is especially challenging because cold weather reduces the driving range of the PEV.
In multiple-vehicle households, a short-range PEV could be used for commuting and local shopping while a second vehicle handles long-distance trips. If it is not a diesel or gasoline vehicle, it could be an HEV, PHEV or fuel cell electric vehicle. For modest-income households that can afford only one vehicle, a short-range PEV is not appealing.
Automakers now recognize that mass commercialization of PEVs will not occur without longer driving range. The more recent PEV offerings provide greater range. The second-generation Leaf (base version) has a range (151 miles) more than double the first-generation Leaf (73 miles). The price of the Leaf has not declined significantly in the last ten years, despite the 80% decline in battery-cell prices, in part because those savings have been poured into packs that achieve longer driving range and lower risk of battery degradation (which contributes to shorter driving range in real-world use) [5] (pp. 458–459).
How long must range be to satisfy consumers? The second-generation Leaf is not selling especially well. The Chevrolet Bolt has not been a big seller even though its driving range is more than 250 miles. The best-selling PEV in the world is the Model 3, which has a driving range of 263 miles (base version) or 353 miles (Long Range version)—the 2021 models. Keep in mind that Tesla owners also can access a proprietary charging network that curbs some of the disadvantages of limited driving range. However, the pricing of Tesla products is too high to achieve mass commercialization beyond premium markets [31].

2.2.3. Long Charging Time

The three levels of available charging can achieve a full charge in 12–18 h (Level 1, no cost), 3-6 h (Level 2, USD 1500–2000 for home system), and 80% charge in 30 min (Level 3, USD 40,000 for commercial system). Porsche has introduced the Taycan with “ultra-fast charging” (80% in 15–20 min). The capability for ultra-fast charging raises the cost of producing battery cells and creates risks of accelerated battery degradation (which reduces range). For a vehicle in the Taycan’s price range (>USD 100,000), ultra-fast charging is viable; it may be many years before ultra-fast charging is offered on an affordable PEV [32].
None of these options competes with the 3 to 7 min it takes to refuel most gasoline tanks. This is a significant marketing disadvantage for the PEV. GM officials have stated that ultra-fast charging will be necessary to achieve mass commercialization of PEVs [33].
A Level 2 arrangement can suffice for a consumer that can charge daily at home or work. Reliance on public charging has drawbacks. Outdoor public charging exposes motorists to all the elements: frigid temperatures, freezing rain, snow and hot humid air. This is not an issue in much of coastal California where the weather is relatively dry and moderate throughout the year. Reliance on public charging also exposes motorists to elevated electricity prices and potential waiting lines for stations.
China is exploring battery swapping stations as well as public charging stations [34]. At the end of 2020, China had 555 battery swapping stations in operation, 81% more than in 2019. Both established and startup Chinese companies are planning to work with the central government on a large-scale pilot project of battery swapping.
The barriers to widespread implementation of battery swapping are formidable. There is no standardization in the design and location of battery packs in vehicles. Automakers and their suppliers resist standardization because they are seeking competitive advantage with innovation in battery design and location. One Western start-up (Better Place) attempted battery swapping but went bankrupt, in part due to an inability to recruit participation by automakers and consumers. Moreover, the fixed costs of a battery-swapping station are substantial because space is required for a large inventory of battery packs and specialized equipment is required to manipulate, charge, and repair battery packs. China may have more success with battery swapping for urban delivery vehicles and taxi fleets than with retail customers.

2.2.4. Uncertain Battery Life

The big uncertainty about the PEV’s repair-cost advantage is the low-probability, high-cost outcome of battery failure and replacement. The frequency of battery failure is unknown because few real-world PEVs have been used for more than a decade. It is the second decade of a vehicle’s lifetime when battery failure might be most likely to occur.
Battery replacement is expensive. Replacement of the Leaf’s battery pack costs USD 5499 plus installation costs (2011–2014 models). The Chevrolet Bolt’s battery pack costs USD 15,734 to replace [35]. The Tesla Model 3 has sixteen separate battery modules; replacing one of them costs USD 5000 to USD 7000 [36]. Replacement costs are a bigger concern for individual retail buyers than fleet buyers. Fleet buyers (e.g., car sharing companies or rental car companies) can build the costs of replacements into the average price of car sharing or car rentals.
To relieve consumer concern about battery failure, the affordable PEVs in the US were sold largely on three-year leasing arrangements. Even Tesla introduced a leasing option in 2019. For PEV buyers, the typical warranty is for 8 years or 100,000 miles, which is slightly greater than half of the average vehicle’s life in the US [37]. Tesla’s warranties are not entirely reassuring, as they do not cover the first 30% of battery degradation within the warranty period—100,000 miles for the Model 3; 150,000 miles for the Model S and X [38].
Battery failure may be a smaller risk for premium vehicles with large battery packs and long driving range. Each cell experiences less load in a pack that achieves longer range. Larger packs may also experience fewer full charging events, which means that they will less frequently experience the low rates of charge that trigger accelerated battery degradation. For affordable PEVs with short driving range, battery degradation is a real issue, and this has been confirmed in real-world experiences with the Nissan Leaf [39].

2.2.5. Poor Resale Value

With the exception of the Tesla products, the annual depreciation rates of PEVs are significantly larger than for conventional vehicles [40]. This is partly a reflection of government purchase incentives for PEVs, which typically apply to new PEVs but not used PEVs. However, it may also reflect the fact that PEVs have a constrained resale market. Lower-income households are a big force in the market for used vehicles. They may be able to afford only one vehicle, and it must meet their short- and long-distance needs. Moreover, lower-income households are less likely to own a private garage where they can charge at home. Public charging, even if available, will have elevated electricity prices, which attenuates the PEV’s operating-cost advantage. Tesla vehicles hold their value because Tesla’s sales have been production constrained, and numerous early adopters that cannot obtain one new are happy to buy them used. Moreover, an early adopter that cannot afford a new Tesla product will entertain a used Tesla purchase. One of the good signs in the PEV market is that the depreciation rates for PEV products appear to be declining over time [41]. Nonetheless, for the retail buyer that studies resale values, the PEV will look a bit risky.

3. The Risk Averse Consumer and the Hybrid Alternative

Early adopters of automotive technology are not very risk averse because they are wealthy enough to own multiple vehicles and they can trade in a troublesome vehicle for a new vehicle before the troubled vehicle has serious problems. They also enjoy owning the most recent automotive technology, and they accept some of the inevitable risks of new technology [42].
For the mainstream retail buyer, risk aversion is a common attitude in car buying. The car purchase is the second largest investment a typical household makes after the home purchase. The mainstream buyer is not necessarily inclined to pay a premium price for a new propulsion system with so many potential risks: uncertain battery life, insufficient public charging, especially on rural roads and highways that connect cities, and fears of public charging in poor weather with long waiting times [43]. Additionally, these buyers may not be able to afford Tesla products and their associated proprietary charging system.
A risk-averse consumer, even if they are prepared to innovate, might be more inclined to purchase an HEV or PHEV rather than an all-electric vehicle. The HEV accomplishes significant (20–30%) savings in operating costs compared to a conventional vehicle but without all the complications associated with home, workplace and public charging [44]. The purchase premium of the HEV today is less than half of the purchase premium of an all-electric vehicle. Additionally, HEVs pose little risk of battery failure because their battery-management systems are designed to preclude deep discharges and charges. The batteries in the Toyota Prius typically last longer than the life of the vehicle [45].
Given these considerations, it should not be surprising that Toyota’s HEV sales in Europe and the USA have grown explosively in the last two years, serving as a real competitor to electric vehicles [46]. For related reasons, the PHEV has made a comeback in Europe in the last two years, and it has also gained some traction in the Chinese market. Whether HEVs and PHEVs can compete in the long run (when battery technologies are improved and PEV prices lower) is less certain, since the consumer must purchase two propulsion systems rather than one.

4. Spurring Pev Adoption through Public Policies

Politicians are not satisfied with the current rates of PEV penetration because they envision PEVs meeting the needs of society as well as the daily transport needs of consumers. Those societal needs may be urban air quality, climate-change mitigation, energy security and/or industrial policy. In this section, we explore why and how selected jurisdictions are stimulating PEV penetration. For illustrative purposes, we chose Norway, Germany, China, and California because they have each achieved above-average rates of PEV penetration. Other countries with above-average PEV penetration rates that we do not address are Iceland, Sweden, Finland, France, Denmark, the Netherlands and the UK.

4.1. Norway

Norway does not have a severe energy-insecurity or air-quality issue. Nor does it have a significant auto industry or a plan to develop one. Since the 1980s and 1990s, Norwegian politicians have been pioneers of—and proponents of—progressive climate policies [47]. This may seem surprising since oil and gas development is the country’s largest industry. Norway’s major oil company, Stateoil, is a publicly traded company but the government owns a 67% interest, which it manages through a dedicated ministry. Additionally, since Stateoil sells most of its oil outside of Norway, PEVs in Norway are not a significant threat to Stateoil’s commercial future. Thus, there are no powerful interests in Norway opposed to PEVs.
Several features of Norway explain why this small country has been highly effective in promoting electric vehicles. Norway is a wealthy country where 75% of consumers park their cars on land that they own and another 12% park their car less than 100 m away from their home [48]. As a result, home charging is more feasible in Norway than in most other countries. Most of the population lives in the Oslo metropolitan area or in a series of smaller mid-sized cities and towns where public charging networks are feasible.
Average gasoline prices in Norway are among the highest in the world, around USD 7 per gallon, due to heavy taxation [49]. Electricity prices are quite low (around USD 0.14 per kWh in 2019), among the lowest in Europe. Hydropower supplies 96% of the country’s electricity, and is a clean, renewable energy source [50].
In June 1991 a PEV startup, TH!NK Global, launched in Norway [51]. With the assistance of French automakers, it made limited production runs of PEVs with nickel-cadmium batteries. The original owners of the TH!NK vehicles contributed to the nucleus of the Norwegian Electric Vehicle Association (NEVA), which formed in the 1990s to advocate pro-PEV policies. TH!NK Global struggled through four bankruptcies and multiple owners before ceasing operations in 2011. In the interim, however, the TH!NK experience demonstrated that Norway’s city centers might be good niche markets for improved PEVs. Several global automakers responded by offering PEVs in Norway: Mitsubishi in 2010; Nissan and the French automakers in 2011; and BMW, Volkswagen and Tesla in 2012–2013.
Two key turning points occurred in Norway’s pro-PEV policies. In 1996 the government decided to exempt PEVs from the country’s large registration tax. Without this broad exemption, a USD 50,000 Tesla Model 3 would have cost a Norwegian consumer USD 100,000 to purchase. In contrast, gasoline- and diesel-power cars were penalized with the initial registration tax (now a CO2 tax on vehicles), annual vehicle ownership fees, and high gasoline taxes and road ferry tolls.
The second turning point occurred in 2012 when the Norwegian government prepared its first comprehensive White Paper on climate policy [52]. The Paper included a comprehensive plan to promote PEVs in Norway. Parliament acted on the Paper and extended pro-PEV incentives for five years (2014–2018) or until 50,000 PEVs were sold, whichever came first [53].
Table 3 compares Norway’s retail prices (USD) of PEVs to competitive gasoline vehicles in 2017. The Norwegian consumer saves about USD 3500 by selecting a VW e-Golf over a conventional VW Golf. A consumer also saves almost USD 6000 by selecting a Tesla Model 3 over a gasoline-powered Audi A-7, a popular executive sedan in Norway. Considering Norway’s high fuel prices and low electricity prices, a consumer will also save an additional USD 1500 to USD 2000 per year in operating costs with a PEV. If the consumer lives and works in the Oslo area, the PEV owner can save up to USD 5000 per year in parking fees and USD 1400 per year in toll road charges, depending on the consumer’s precise circumstances. To top it off, during times of day when Oslo is congested with traffic, the PEV owner accessed the uncongested bus lanes.
The cumulative effect of Norway’s policies was a powerful incentive for consumers to select a PEV. Consumers responded. The PEV’s penetration rate of new vehicle sales rose from virtually 0% in 2010 to 21% in 2015 and to over 75% in 2020 [55]. The PEVs sold in Norway are the same products offered by global automakers around the world. The top sellers in 2019 were the Tesla Model 3, the VW e-Golf, the Nissan Leaf, the Hyundai Kona EV and the Renault Zoe.
A key point about Norway’s success with PEV commercialization is that it occurred with a tangible value proposition, not simply a symbolic appeal. Surveys of Norwegian consumers indicate that 72% chose a PEV for economic reasons; 26% for environmental reasons and 2% for other reasons [56].
Indeed, the financial case for PEVs in Norway is so overwhelming that it is difficult to imagine why 20–25% of consumers do not choose PEVs. Two factors may help explain the continued sales of conventional vehicles. Few PEVs have been offered in the SUV market, yet SUVs are growing in popularity in Norway. In addition, the northern regions of Norway have extremely cold weather and inadequate charging networks, both factors known to discourage PEV sales.
One feature of Norway’s pro-PEV policies may not be generalizable to other countries. The PEV’s purchase-price advantage was accomplished by heavy taxation of gasoline- and diesel-powered vehicles rather than public subsidies of PEV purchases. Subsidies can have the same effect on the government’s balance sheet but the electoral risks to politicians are less for subsidies than for taxation of conventional vehicles. Such harsh taxation of conventional vehicles seems politically implausible in the US.

4.2. California

California has three reasons for promoting PEVs: improved air quality in cities, control of greenhouse gases linked to climate change, and economic development in the State through a PEV industry. Unlike Norway, California has employed both supply side and demand-side policies to stimulate the PEV market.
California’s major challenge is to expand PEV penetration in the mainstream vehicle market. Sales data for 2020 reveal that Tesla is the dominant seller of PEVs in the state, accounting for approximately half of all new PEV sales and four of the five top selling PEV models [57]. See Table 4. In each segment that Tesla entered, it penetrated primarily the premium end of the segment. Tear-down studies indicate that Tesla is making a profit not on the base version of the Model 3 (offered in 2021 for about USD 41,190 without much content; the long-range model starts at USD 50,190) but on its long-range and performance versions that include numerous upgrades [58]. Tesla has announced no concrete plans to offer an affordable PEV for mainstream consumers in the US. The announced plans for Tesla’s new plant in Austin, Texas include an upscale pickup truck (the Cybertruck), a Class 8 semi-truck (the Semi), and additional volume of its premium Model 3 sedan and Model Y SUV [59].
The early adopters of Tesla products in California may be seeking the most advanced automotive technology and the Silicon Valley brand as much as electric propulsion per se. The significant commercial success of Tesla’s products in premium markets does not ensure that PEVs will soon penetrate the large-volume affordable segments of the California market [58]. By affordable, we mean buyers looking for a new vehicle that costs less than USD 40,000, the median transaction price for a new passenger vehicle in the US in 2020 [61].
Nissan and Chevrolet have made the most concerted efforts to penetrate California’s mainstream vehicle market [5] (pp. 413–422, 452–455). The affordable Nissan Leaf has struggled for commercial success in California, despite almost a decade of focused marketing in the state, eligibility for a USD 7500 federal tax credit, access to HOV lanes, and a second-generation model with longer driving range. Chevrolet began with the affordable Volt, a PHEV, but it was terminated in early 2019 due to poor sales volume. The Chevrolet Bolt, now in its second generation, is an affordable BEV but its California sales volume is limited (8230 in 2020); with assistance from aggressive manufacturer discounts, Bolt sales in California (2839) increased in the first quarter of 2021 [62]. The other affordable PEVs offered by global automakers (e.g., the Fiat 500e, the Toyota Prius Prime, the Mitsubishi Outlander PHEV, the BMW MINI Electric Hardtop, the Hyundai Ioniq Electric, the Kia Niro PHEV, the Honda Clarity PHEV, and the Volkswagen ID.4) are not selling in California as well as they are selling in Europe [5] (pp. 61–62).
Preliminary data for the first quarter of 2021 show that California’s PEV share continue to increase (10.8%), now above 10% for the first time. Much of the increase is attributable to expanded sales of the Tesla Model Y, a premium crossover priced at USD 53,190 (Long Range model), rather than greater PEV penetration by affordable models. Several premium models offered by Tesla’s competitors (the Ford Mustang Mach-E, the Porsche Taycan, and Jaguar I-PACE) are also attracting interest [63].
On the supply side, if automakers want to sell vehicles in California, they must comply with the State’s zero emission vehicle (ZEV) mandate [5] (pp. 348–349, 458–459). They must sell enough PEVs, or purchase credits from other automakers that sell more than the required number of PEVs. In recent years, Tesla has earned large volumes of credits and sold them to Honda, Chrysler and other companies with few PEV offerings [64]. California’s current ZEV mandate was first issued in 2011 and reaffirmed in 2017 [65]. It was intended to accomplish a PEV penetration rate of up to 15% by 2025, yet California regulators have recently announced bold plans to achieve 60% PEV penetration by 2030 and 100% by 2035 [66].
On the demand side, California employs several policies: consumer rebates for PEVs, high gasoline taxes, low carbon fuel credits for PEVs, access to carpool lanes for PEV owners, and subsidies for charging stations.
California’s 2019 consumer rebate was USD 2000 for BEVs and USD 1000 for PHEVs (except low-income consumers are eligible for even larger rebates) [67]. The California rebate supplements the US consumer tax credit of USD 7500 for a qualified PEV purchase. The federal credit expires when a company sells 200,000 PEVs, a threshold that Tesla and GM surpassed before other automakers.
California has adopted the largest gasoline taxes in the country, causing fuel prices to average USD 4.14 per gallon in October 2019, much larger than the national average of USD 2.65 per gallon. Other factors that contribute to higher fuel prices in California are stringent fuel-quality standards and occasional outages at West Coast refineries. The high fuel prices offset one of the few PEV disadvantages in California’s: high electricity prices (USD 0.21 per kWh, residential, April 2021) that have been increasing steadily in recent years.
California has adopted a relatively new program to encourage sales of PEVs through the state’s low-carbon fuel standard (LCFS). The standard’s primary purpose is to encourage biofuels, but electric utilities can generate compliance credits if they produce low-carbon electricity for use by PEV owners. Utilities are expected to share some of the credits with PEV purchasers through a point-of-sale rebate. In November 2020 CARB and the state’s electric utilities offered a new USD 1500 point-of-sale rebate for PEV buyers, on top of the long-standing CVRP rebate [68]. Those rebates ranged from USD 200 to USD 599 in 2017 but are expected to gradually increase between now and 2030 [69].
Since California freeways are heavily traveled, access to the less-congested carpool lanes is highly desired by motorists. In 2013, California withdrew HEV access to carpool lanes, reserving the privilege for PEVs and FCVs (fuel cell vehicles). It is estimated that 25% of the PEV sales in California are buyers seeking access to carpool lanes [70].
On charging infrastructure, the California Energy Commission has authorized utilities to expend almost USD 1 billion on a buildout of the state’s network of public charging stations. The program is financed by a general rate increase on users of electricity throughout the state [71].
In summary, California has promoted PEVs with multiple policies since 1990. Meaningful progress did not occur until after 2010, when lithium-ion battery technology spilled over from consumer electronics to automobiles. Tesla is the dominant seller of PEVs in California, but other startups and established automakers are now contesting Tesla with competitive offerings. In 2020 the PEV penetration rate in California was 8.1%, about four times larger than the national average and far ahead of any of the other 49 states. The pro-PEV policies of the Obama administration from 2009 to 2016 provided tailwinds; anti-PEV policies by the Trump administration created headwinds from 2017–2020. It is not entirely clear how California intends to persuade 60% of consumers to purchase PEVs by 2030 but the Biden administration is likely to assist California where they have the legal authority and resources to do so.

4.3. Germany

German automakers and the Merkel government showed limited interest in PEVs until the Volkswagen emissions-cheating scandal broke in 2015. As early as 2007, BMW boasted a long-term R&D program to bring a new line of PEVs to the megacities of the world but did not make dramatic progress on commercialization (the i3 was one of the few successful first-generation PEVs) [72]. Prior to 2015, Daimler and Volkswagen offered some low-volume PEVs but without serious plans for mass commercialization [73].
The Merkel government set national goals for PEV penetration starting in 2009 but did not back those goals with the aggressive policies adopted in Norway and California [74]. The Merkel team was concerned about poor urban air quality (especially NO2), GHG emissions, and energy insecurity. They were also concerned that the German auto industry might underestimate the threat posed by advances in lithium-ion battery technology. Despite the concerns, the Merkel administration from 1998 to 2015 joined with other auto-producing countries in Europe to moderate the European Commission’s CO2 regulatory agenda, ensuring that German automakers could meet CO2 standards with diesels. The Merkel government also touted hydrogen fuel cell electric vehicles as a more promising long-run technology than PEVs based on lithium-ion batteries; the European Commission followed Germany’s lead with more R&D on hydrogen than lithium-ion batteries [75].
Volkswagen’s direct-injection diesel engine was so commercially successful in Europe that the company prepared an ambitious plan to bring the technology to the US market, where consumers had rejected GM’s clumsy diesels in the 1980s. VW saw the diesel as a superior alternative to the hybrid electric vehicle that Toyota championed with the Toyota Prius. Additionally, VW proved in Europe that the diesel could outsell HEVs [5] (pp. 329–353).
There was a simple flaw in the VW plan: EPA and California refused to give the compliance break on NOx emissions that was provided to diesel-engine suppliers in Europe and Japan. Despite intense pressure from upper management, VW’s creative engineers could not devise a technology to meet California NOx standards (which were slightly more demanding than US EPA standards).
Volkswagen decided to cheat rather than comply [76]. Software was written that turned off the VW emissions controls unless the vehicle was undergoing laboratory testing on a chassis dynamometer. During a short test, the VW lean NOx trap worked fine but it was not durable and effective in continuous use. Incredibly, the VW diesels were sold worldwide for almost ten years with NOx emissions in real-world driving conditions 10–40 times the amounts permitted by applicable standards.
The cheating was ultimately detected but not by the German government or the European Commission. The key comparison of laboratory and real-world testing was done by a team of engineers at West Virginia University operating under contract to John German and colleagues at the International Council on Clean Transportation [5] (pp. 322–360). ICCT published the results and shared them with VW, CARB and EPA. CARB and EPA verified the results and then confronted VW. VW admitted to the presence of the illegal software on 3 September 2015; VW CEO Martin Winterkorn resigned on 23 September 2015 but denied knowledge of the cheating.
“Dieselgate” provided an enormous, unexpected boost to the nascent global PEV industry. The VW Group, the world’s largest automaker, flip-flopped its product planning to favor PEVs instead of diesels. In the US, the legal settlement required VW to build USD 2.7 billion in charging infrastructure throughout the country. BMW and Daimler, caught by the ripple effects of Dieselgate, moved to make expanded offerings of PEVs but in a more nuanced way than VW. Angela Merkel, angered by the scandal, called a summit of stakeholders, and announced a new suite of pro-PEV policies. The European Commission, no longer constrained to protect diesel technology, adopted much stricter post-2021 CO2 standards that could not be met without significant PEV penetration in Europe [77]. The Commission did not adopt a ZEV-style mandate like California or China, but did include some compliance incentives for automakers that sell large volumes of PEVs. In the public furor over Dieselgate, some politicians began to utter the unthinkable: a ban on the internal combustion engine [78].
The regulatory pressure from the European Commission is important but the size and duration of the German purchase incentives for PEVs should not be overlooked. The Merkel government started in 2016 with a PEV purchase incentive of 3000 euros for BEVs, 2000 euros for PHEVs. The German incentives do not apply to cars priced above 60,000 euros; they are explicitly aimed at mass commercialization of affordable PEVs. Funds were also authorized to electrify 20% of the government vehicle fleet. When consumer interest did not pick up quickly, the purchase incentives were doubled starting 2020 and extended to 2025. The Value Added Tax on car purchases was reduced from 19% to 16% for 2020, which clips another 1,000 euros off the purchase cost of an affordable PEV [5] (pp. 34–64). Additionally, the tax on company cars, a big source of sales in Germany, was curbed if the car is a PEV.
The Merkel administration also focused on charging infrastructure. From 2017 to 2020, investments in fast-charging and slow-charging infrastructure were 200 million euros and 100 million euros, respectively. The infrastructure packaged was enlarged in 2020. About USD 2.5 billion was made available, with a goal of increasing the number of charging stations from 28,000 in 2020 to 1 million in 2030 [79].
A major challenge for Germany and the European Commission is to resolve the commercial future of the PHEV technology. General Motors, Mitsubishi, Toyota and Renault pioneered PHEV offerings, but German companies have become major sellers of PHEVs in Europe. In the German market, for example, the PEV share in December 2020 was 26.6%, split almost evenly between PHEVs and BEVs [80]. Globally, the PHEV share of PEV sales is much smaller, less than 20% [81]. Companies with especially high PHEV/BEV ratios in Germany (2020) are Mercedes Benz, Audi, BMW, SEAT, Skoda, Volvo and Kia.
The PHEV design is appealing to consumers because it neutralizes several disadvantages of BEVs [3]. The total driving range of a PHEV equals or exceeds the total driving range of a comparable gasoline-powered vehicle. Table 5 presents the all-electric ranges and total driving ranges of a selection of prominent PHEV models. The typical gasoline powered vehicle will make it 300–400 miles before a refueling stop is required, but some popular SUVs and pickup trucks with large fuel tanks can travel 500–700 miles on a tank of gasoline [5]. Moreover, if a PHEV owner does not have time to wait while a depleted battery pack is charged, he or she can instead refuel the gasoline tank in 5 min. In the early stages of PEV commercialization, when the public charging network is not yet fully developed, the PHEV has a notable advantage: It protects the owner from the “range anxiety” that BEV owners experience.
The environmental advantages of the PHEV may not be nearly as large as the European Commission compliance values suggest. The Commission’s compliance values are based on laboratory tests and engineering judgment, not the actual, real-world behavior of PHEV owners and their drivers. If a battery pack of a PHEV is never charged, then its fuel consumption and CO2 emissions will be like a conventional vehicle with a similar gasoline engine. In a study of the real-world use of 100,000 PHEVs in China, Europe and North America, the investigators found that average fuel consumption and CO2 emissions were two to four times larger than the compliance values approved in the European Union [83]. The share of real-world driving that is electric was about half as large as the value assumed by the European Union in compliance values. The compliance gap was especially large for PHEVs sold in Germany, the Netherlands and China, where subsidies for PHEVs have been generous. The study points to three strategies to address the compliance gap: reduce the power of gasoline engines, increase the all-electric range of PHEVs, and increase the frequency of charging by owners. Some environmental groups are urging an end to subsidies for PHEVs and stricter EU regulation of PHEV design [84]. The most recent Commission proposal for 2030 does not call for any change in how PHEVs are treated in compliance calculations, but the Commission recognizes that the real-world data on PHEVs must be monitored carefully in the future. The Commission is considering a complete phaseout of conventional engines by 2040, which—absent some exemption—would terminate the commercial future of PHEVs [85].
The cumulative effect of the European CO2 standards, the new pro-PEV positioning of German automakers, and the new pro-PEV subsidies has been explosive in Germany. In 2015 the PEV share of the new vehicle market in Germany was slightly less than 1%. In 2020 it was 13.5%, with most of the increase occurring in 2020. A distinctive feature of the German market is that plug-in hybrid electric vehicles (PHEVs) have captured almost half of the PEV market, a much higher PHEV share than seen in Norway, California or China [86]. Overall, Germany has accomplished more PEV penetration in a few years than California did in 30 years; in 2020 Germany also outpaced China’s fast start in PEV penetration.

4.4. China

In China the environmental rationales for PEVs are secondary compared to the industrial-policy and energy-security rationales. In fact, China was already developing its plans for PEVs (2004–2012) before the central government demonstrated seriousness about the problems of poor urban air quality and China’s contribution to [82]. Indeed, PEVs in China are much more effective at reducing oil consumption than reducing air pollution, since when PEVs access the grid they contribute to air pollution at China’s numerous coal-fired powerplants [87].
For decades Chinese central planners envisioned a globally competitive auto industry that could sell vehicles and parts around the world [88]. They were openly envious of what GM did for the US, Toyota for Japan, and Volkswagen for Germany.
The original industrial strategy was joint ventures between China’s state-owned automakers and foreign automakers. The theory was that Chinese auto companies would learn about advanced technologies through the joint ventures and become more competitive manufacturing enterprises. Once dominated by Russian, Japanese and other foreign automakers, Chinese automakers have gradually gained market share in China’s large and growing domestic market. However, Chinese planners remain disappointed that Chinese companies cannot compete globally with gasoline and diesel engines. A strategic decision was made gradually from 2010 to 2015 to “leapfrog” the internal combustion engine and become a global leader in PEVs and the supply chains that support PEVs [89].
Security planners in China also voiced grave concerns about dependence on petrol-based vehicles [5] (pp. 443–445). China became a net importer of oil in 1993. Due to its booming economy, in 2017 China became the largest importer of oil in the world [90]. China’s oil-import share is projected to rise from 70.9% in 2018 to 80% in 2030, unless policies are changed. China’s oil imports come largely from the politically volatile Mideast.
Despite rapid improvements in China’s Navy, security planners concluded that the country could not reliably defend the long sea lanes (about 3557 nautical miles) from Kuwait in the Persian Gulf through the Indiana Ocean to the South China Sea and China’s prosperous eastern cities [91]. Of particular concern was the potentially hostile US Navy in war-time scenarios. Even if the US Navy could not interdict, it could harass the oil transports and reduce the rate of supplies that reach China.
Security planners became interested in PEVs because China has plenty of coal and can produce it cheaply to support electricity production. In an October 2019 public speech to energy policy makers, China’s Premier Li Keqiang underscored that development of China’s coal industry is critical to the country’s energy security [92].
To guide a possible transition to PEVs, China in 2009 selected ten cities that each pledged to put 1000 PEVs into operation within three years (2010–2013) [93]. The central government pledged USD 8800 of subsidy for each PEV purchased for government use, while provinces and municipalities supplemented with additional resources. The cities tried different methods of promoting PEVs. In 2010 a separate pilot in five cities provided a similar subsidy to private purchasers of PEVs. In 2012 the program was expanded to 25 cities, with lessons from the initial cities shared with all 25. Evaluations of the city demonstrations were mixed but uncovered three key insights: cities that denied inner-city access to non-PEV vehicles were more successful in finding willing PEV users; purchase incentives were important; and public charging was especially critical for private buyers because most Chinese live in high-rise apartments and lack a private garage where they can charge their PEV at night.
From 2013 to 2015, the central government extended the purchase subsidies nationwide but varied the size of the subsidy depending on vehicle design characteristics (USD 5656 to USD 9695 per vehicle) [94]. The subsidies are quite large relative to the typical prices of new small cars in China, which can be as low as USD 5000. The practical effect of the subsidy policies was to reduce the average prices of a BEV and PHEV by 50% and 25%, respectively. Chinese automakers, both startups and established automakers, raced to expand production of PEVs. Foreign automakers complained that they could not access the subsidies unless they assembled the vehicle in China through a joint venture. Tesla was not simply ineligible for subsidies; it faced a 25% Chinese tariff when it tried to export the Model 3 from the US to China [95]. Tesla now avoids the tariff with its huge new assembly plant outside Shanghai.
The leaders of China’s six large eastern cities boosted PEV sales with licensing/registration policies. These cities were already curbing the number of cars with access to the inner-city to reduce congestion and lessen air-quality problems. Some cities were auctioning off vehicle licenses to the highest bidder; others used lottery systems [96]. In early 2020, for example, 3.3 million Beijing residents applied for city license plates but only 6300 applicants were selected monthly, a selection rate of 0.2%. Even if an applicant is selected, they then need to pay a registration fee that ranges from USD 4000 in Tianjin to USD 12,000 in Shanghai. To give PEVs a big boost, six cities exempted owners of PEVs from the inner-city access restrictions and the vehicle registration fee. Since auto ownership opens numerous employment opportunities in Chinese cities, the PEV exemptions were a potent stimulus to PEV sales. In 2017 alone, 21% of all PEV purchases in the world occurred in six Chinese cities, all which restricted vehicle use in the city unless it was a PEV [97]. The restrictions were eased temporarily during the COVID pandemic, but city planners are now adjusting the ratios of PEV and non-PEV licenses to achieve the desired mix of vehicles.
The major challenge for China is to make PEVs a practical technology for high-rise urban apartment dwellers that have no place at home to charge a PEV. One strategy is to rely on the network of public charging stations but, while useful as a supplement to home and workplace charging, public charging is not attractive as a primary source of daily charging. Public charging takes too long (even at a Level 2 or Level 3 charger) and the PEV owner is vulnerable to unpredictable waiting times at public stations. Moreover, the price of electricity at public charging stations is typically set at commercial rates that are much higher than residential rates.
The central government of China, and some PEV producers and municipalities, are interested in battery swapping as a supplement or alternative to public charging [98]. If a PEV is designed to facilitate battery swapping, a robot can replace a PEV’s battery pack in as little as a minute. If swapping stations were ubiquitous like gasoline stations, PEV owners could rely on battery swaps when their pack runs low on power. Commercial stations would have an inventory of battery packs, maintain them, and make sure they are fully charged before installation.
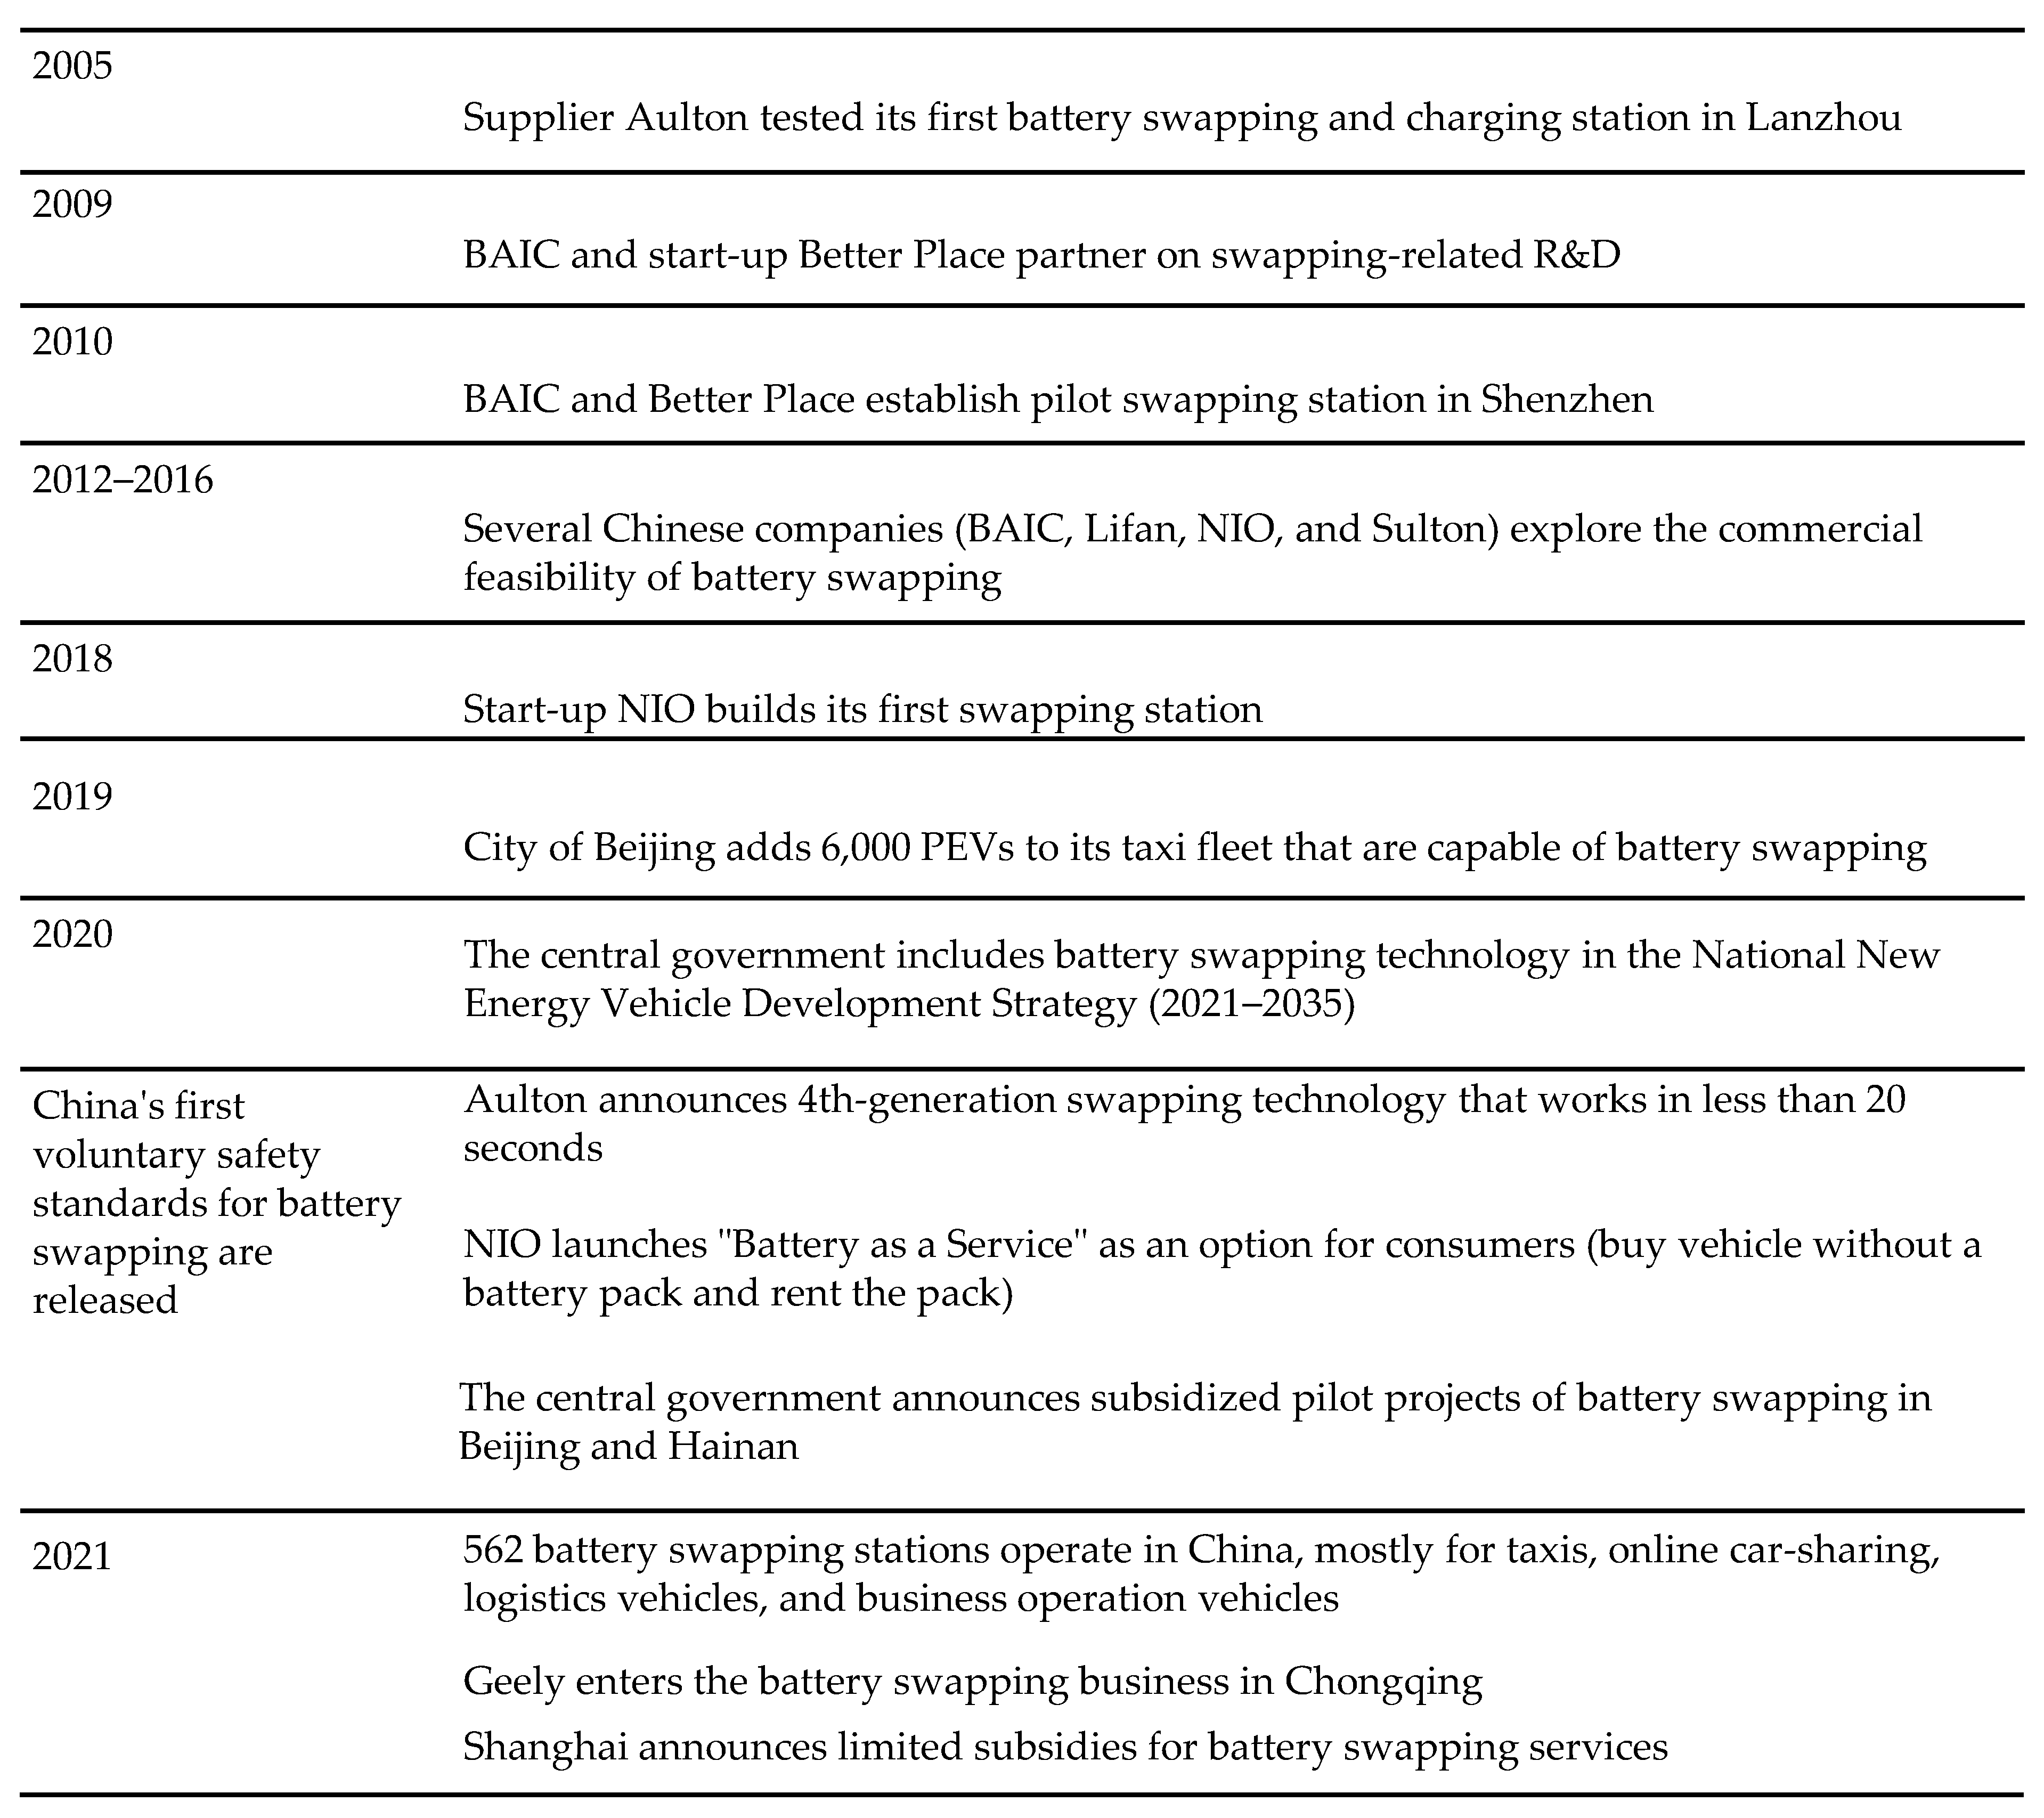
Figure 2 is a timeline of China’s milestones in battery swapping from 2005 to the present. The central government has recently taken several actions to boost battery swapping. The 2020–2022 PEV subsidies are restricted to vehicles priced less than USD 45,700 unless the vehicle is capable of battery swapping. The exclusion has encouraged premium PEV producers, like NIO, to accelerate their battery-swapping plans. In July 2020 the central government announced subsidized battery-swapping pilot projects in Beijing and Hainan.
NIO, a startup PEV manufacturer with a line of premium PEVs, has announced the most advanced plans to implement battery swapping for retail customers [100]. The company sees battery swapping as a competitive response to Tesla, which has a growing business in China and a huge new assembly plant in Shanghai. Tesla explored the feasibility of swapping in 2014 but rejected the idea in favor of a network of proprietary charging stations. A NIO customer has the option of buying the PEV without a battery pack and signing a battery service agreement on the terms of swapping. As of July 2021, NIO had 301 “Power Swap” stations operating in China and had completed 2.9 million swaps. The company’s goal is to have 2700 battery-swapping stations throughout China in 2025 [99].
China has made methodical progress in boosting its PEV penetration rate. In 2015 it was 0.98%; in 2020 it was 5.4%. Prior to COVID19, the central government vetted a draft plan to reach 25% PEV penetration by 2025; the current goal is 20% by 2025 [101].
The PEV market in China is quite different from Europe and the US. Table 6 lists the top ten PEV models sold in California, China, Germany and Norway. The major difference between California and Germany/Norway is that premium Tesla products dominate the California market whereas more affordable PEVs are also selling well in Europe and Norway. The Chinese PEV market is distinctive in several respects. Since 2010, most of the PEVs sold in China were assembled by Chinese automakers, and those products are not even offered in Europe or the United States. Chinese PEVs, which are often microcars, have a wide range of price points, which is a healthy sign from a mass-commercialization perspective [102]. The newest development in China is the rapid rise of Tesla’s premium Model 3 and the USD 4000 Wuling HongGuang MINI, offered by GM through one of its Chinese partners. Despite being introduced in July of 2020, sales of the MINI surpassed the Tesla Model 3 in the last quarter of 2020 [103].
Now that PEV technology has passed the demonstration phase, the central government is gradually replacing vehicle subsidies with a California-style ZEV mandate. The original schedule called for vehicle subsidies to expire in 2020 but they were extended to 2022 when car sales in China plummeted unexpectedly [105]. The savings from smaller vehicle subsidies have been channeled into central government support for a comprehensive national network of charging infrastructure, with near term emphasis on the highways connecting large cities [5] (pp. 373–378, 412).
In summary, China pursued PEVs for industry-policy and energy-security reasons. Both Chinese and foreign automakers now offer PEVs at a wide range of price points. PEVs will offer only modest environmental advantages in China as long as the country remains committed to coal-fired electricity. The new coal-fired powerplant in China do have impressive controls on the conventional air pollutants linked to smog and soot, but they do not have capture and sequestration systems for carbon dioxide [106].

5. Conclusions

The transition from the internal combustion engine to PEVs was not feasible until lithium-ion battery technology spilled over from consumer electronics to automotive applications in 2010. Current PEV technology, though much improved from the first-generation PEVs, remains unappealing beyond early adopters without government support. Risk-averse consumers are concerned about the PEV’s high purchase price, limited driving range, long charging time, battery degradation, and poor resale value.
This article contributes to knowledge about consumer adoption of PEVs by comparing how four diverse political jurisdictions are overcoming the established reasons for consumer reticence to adopt a new propulsion system. Norway, California, Germany and China are jurisdictions that have adopted demand-side and/or supply side policies to accelerate the transition to PEVs, see Table 7. Pro-PEV policies have been effective in spurring PEV commercialization. In addition, Table 7 highlights some of the key drivers behind pro-PEV policies in various jurisdictions around the world.
Norway accomplished almost 80% PEV penetration from 2010 to 2020 without any supply side mandate and has plans to accomplish 100% PEVs by 2030. The focus was taxing conventional vehicles to the point where consumers save significant money at purchase by choosing a PEV instead of a conventional vehicle. More systematic research should address how the Norwegian policies might be received by publics around the world since politicians in many countries might find it politically risky to impose such harsh taxes on conventional vehicles.
California has promoted PEV adoption since 1990, longer than any other jurisdiction in the world. The state combines a ZEV mandate on automakers with a creative mix of consumer incentives designed to spur PEV sales. California’s politicians seek 60% PEV penetration by 2030 and 100% by 2035. The PEV penetration rate in California finally surpassed 10% in early 2021 but surveys suggest that most consumers in California are not yet ready for a revolution in personal transportation [107]. More research is needed to determine how consumers can be persuaded to purchase and use EVs. Supply side mandates help by energizing auto companies and dealers to market PEVs, but a supply side mandate by itself does nothing to make a PEV more appealing to consumers. Favorable national policies from the Biden administration could make it more feasible for California—and another dozen states aligned with California—to achieve the planned transition to PEVs.
Due to its dominant position in diesel engine technology and long-term interest in hydrogen, Germany lagged Norway and California in the transition to PEVs. The 2015 Volkswagen emissions-cheating scandal caused German automakers and the German government to change strategies and become determined proponents of PEVs. In 2020, Germany surpassed California in PEV penetration, and committed to aggressive pro-PEV policies through 2025. Perhaps more importantly, the European Commission is no longer obliged to protect diesel technology and is setting such stringent greenhouse gas standards that all European countries will be required to achieve significant commercialization of PEVs in the 2021–2030 period. More research is needed to understand why PHEVs have been more commercially successful in Germany than in other countries, and how consumers can be persuaded to utilize the electric capabilities of the PHEV to the maximum extent feasible.
China explored PEVs for industrial-policy and energy-security reasons, as environmental considerations were secondary. In its plan to “leapfrog” the internal combustion engine, China has succeeded in offering consumers PEVs at a wide range of price points (as low as USD 4000 per vehicle). Moreover, the Chinese supply of PEVs comes from an impressive mix of Chinese startups, established Chinese automakers and foreign automakers (including Tesla). An unexpected auto recession and the COVID19 pandemic caused the central government to extend PEV subsidies until 2022, but a national ZEV mandate is gradually replacing PEV subsidies. More research is needed on how to serve the charging needs of the numerous Chinese households that live in high-rise apartments without space for home charging. Without a solution to this challenge, China will have difficulty meeting its national goal of 20% PEV penetration by 2025.
In most markets around the world, Toyota has achieved some success offering HEVs as an alternative to PEVs or as a bridge technology until consumers area ready for PEVs. Japan has achieved 35% HEV penetration but only 1% PEV penetration. Over the last two years, the rate of HEV penetration grew rapidly in Europe and the United States (including California), even though the HEV is not favored by government policies like the PEV is. More research is needed comparing HEVs and PEVs from the perspective of both the consumer’s and society’s needs [108].
In the future, the full commercialization of PEVs will require more focus on building the public charging infrastructure to serve the numerous motorists that do not have the capability to charge at home or work. Of special concern are the charging needs of rural and small-town residents and low-income communities. Public charging facilities on the highways that connect cities and small towns will also be crucial. Future research should compare the advantages and disadvantages of different methods of financing public charging infrastructure.

Author Contributions

Conceptualization, J.D.G.; methodology, J.D.G.; formal analysis J.D.G., resources, E.B., writing—original draft preparation, J.D.G., writing—review and editing, E.B., visualization, E.B., supervision, J.D.G. All authors have read and agreed to the published version of the manuscript.

Funding

This research received no external funding.

Institutional Review Board Statement

Not applicable.

Informed Consent Statement

Not applicable.

Data Availability Statement

Data used in the paper are available through the references provided.

Acknowledgments

The authors acknowledge helpful suggestions from David Audretsch, Keith Belton and John Rupp.

Conflicts of Interest

The authors declare no conflict of interest.

References

  1. Anderson, E.; Lin, S.; Simester, D.; Tucker, C. Harbingers of Failure. J. Mark. Res. 2015, 52, 580–592. [Google Scholar] [CrossRef] [Green Version]
  2. Simester, D. Why Great New Products Fail. MIT Sloan Management Review. Spring. 2016. Available online: Sloanreview.mit.edu (accessed on 1 June 2020).
  3. International Energy Agency. In Global EV Outlook 2021; Technology Report; IEA: Paris, France, April 2021; Available online: https://www.iea.org/reports/global-ev-outlook-2021 (accessed on 15 June 2021).
  4. Coffman, M.; Bernstein, P.; Wee, S. Electric Vehicles Revisited: A Review of Factors that Affect Adoption. Transp. Rev. 2017, 37, 79–93. [Google Scholar] [CrossRef]
  5. Graham, J.D. Chapter 2: Consumer Perspectives. In The Global Rise of the Modern Plug-in Electric Vehicle: Public Policy, Innovation and Strategy; Edward Elgar Publishing: Cheltenham, UK, 2021. [Google Scholar]
  6. International Energy Agency. Global EV Outlook 2021; Trends and Developments in Electric Vehicle Markets; IEA: Paris, France, April 2021; Available online: https://www.iea.org/reports/global-ev-outlook-2021/trends-and-developments-in-electric-vehicle-markets (accessed on 15 June 2021).
  7. Wee, S.; Hoffman, M.; La Croix, S. Do Electric Vehicle Incentives Matter: Evidence from the 50 States. Res. Policy 2018, 47, 1601–1610. [Google Scholar] [CrossRef]
  8. Broadbent, G.H.; Drozdzewski, D.; Metternicht, G. Electric Vehicle Adoption: An Analysis of Best Practices and Pitfalls for Policy Making from Experiences in Europe and the US. Geogr. Compass 2018, 12, e12358. [Google Scholar] [CrossRef]
  9. Hardmann, S.; Chandan, A.; Tal, G.; Turrentine, T. The Effectiveness of Financial Purchase Incentives for Battery Electric Vehicles—A Review of the Evidence. Renew. Sustain. Energy Rev. 2017, 80, 1100–1111. [Google Scholar] [CrossRef]
  10. Wappelhorst, S.; Hall, D.; Nicholas, M.; Lutsey, N. Analyzing Policies to Grow the Electric Vehicle Market in European Cities; White Paper; ICCT: Washington, DC, USA, 2020. [Google Scholar]
  11. Cui, H.; Hall, D.; Lutsey, N. Update on the Global Transition to Electric Vehicles through 2019; Briefing; ICCT: Washington, DC, USA, 2020; p. 687. [Google Scholar]
  12. National Research Council. Overcoming Barriers to Deployment of Plug-In Electric Vehicles; National Academies Press: Washington, DC, USA, 2015; p. 113.
  13. Center for Sustainable Energy. The Clean Vehicle Rebate Project: Summary Documentation of the Electric Vehicle Consumer Survey, 2013–2015 edition; Report for CARB; Center for Sustainable Energy: San Diego, CA, USA, June 2017. [Google Scholar]
  14. Jenn, A.; Lee, J.H.; Hardman, S.; Tal, G. An In-depth Examination of Electric Vehicle Incentives: Consumer Heterogeneity and Changing Response Over Time. Transp. Res. Part A Policy Pract. 2020, 132, 97–109. [Google Scholar] [CrossRef]
  15. Tony Quiroga. The 2019 BMW 330i xDrive is not the Heroic Revolution We Were Hoping For. 1 April 2019. Available online: Carandriver.com (accessed on 1 June 2020).
  16. EPA Fuel Economy Guide Model Year 2020 and Avg. BEV energy consumption, EPA Fuel Economy Guide Model Year 2020. Available online: www.fueleconomy.gov (accessed on 15 June 2021).
  17. UBS Evidence Lab. Electric Car Teardown—Disruption Ahead? Global Research, 18 May 2017. [Google Scholar]
  18. Don Norman. What Noise Does the Electric Car Make? MIT Technology Review, 7 February 2014. [Google Scholar]
  19. Electric Vehicles Reduce Stress Behind the Wheel. 20 May 2018. Available online: Levc.com (accessed on 15 June 2021).
  20. McDonald, Loren. EVAdoption Study. Supply: Model Availability and Price Discrepancy Between EVs and ICE Vehicles Remain a Top Hurdle to Mass Adoption in the US. 19 May 2019. Available online: www.evadoption.com (accessed on 15 June 2021).
  21. Lutsey, N.; Nicholas, M. Update on Electric Vehicle Costs in the United States through 2030. ICCT. 2019. Available online: https://theicct.org/publications/update-US-2030-electric-vehicle-cost (accessed on 1 June 2020).
  22. MIT Energy Initiative. Insights into Future Mobility; A Report from the Mobility of the Future Study; MIT: Cambridge, MA, USA, 2019. [Google Scholar]
  23. Cole, J.; Chem, L.G. “Ticked Off” with GM for Disclosing $145/kWh Battery Cell Pricing. 23 October 2015. Available online: Insideevs.com (accessed on 1 June 2020).
  24. Cembalest, M. Eye on the Market; Annual Energy Paper; JP Morgan: New York, NY, USA, 2018. [Google Scholar]
  25. MIT Energy Initiative. Insights into Future Mobility; MIT Energy Initiative: Cambridge, MA, USA, 2019; Available online: http://energy.mit.edu/insightsintofuturemobility (accessed on 15 June 2021).
  26. Hsieh, I.L.; Menghsuan, S.P.; Chiang, Y.M.; Green, W.H. Learning Only Buys You So Much: Practical Limits on Battery Price Reduction. Appl. Energy 2019, 239, 218–224. [Google Scholar] [CrossRef]
  27. Cozzi, L.; Petropoulos, A. Growing Preference for SUVs Challenges Emissions Reductions in Passenger Car Market; Commentary; International Energy Agency: Paris, France, 2019. [Google Scholar]
  28. Deloitte. 2020 Global Automotive Consumer Study: Is Consumer Interest in Advanced Automotive Technologies on the Move? 2020. Available online: www.deloitte.com/autoconsumers (accessed on 15 June 2021).
  29. Michael Brian Schiffer. Taking Charge: The Electric Automobile in America; Smithsonian Institution Press: Washington, DC, USA, 1994; p. 187. [Google Scholar]
  30. Olsen, P. Buying and Electric Car for a Cold Climate? Double Down on Range. Consumer Reports, 15 February 2019. [Google Scholar]
  31. International Energy Agency. Global Electric Vehicle Outlook. Paris, France. 2018, p. 63. Available online: https://centrodeinnovacion.uc.cl/assets/uploads/2018/12/global_ev_outlook_2018.pdf (accessed on 12 December 2018).
  32. Myersdorf, D. Ultra-Fast Charging Batteries and the Cure for EV Charge Anxiety. 16 December 2020. Available online: Intelligenttransport.com (accessed on 15 June 2021).
  33. Jian, Y. Chinese Companies on Board to Expand EV Battery Swap Stations. Automotive News China, 27 May 2021. [Google Scholar]
  34. Voelcker, J. How Much is a Replacement Chevy Bolt EV Electric-Car Battery. 9 June 2017. Available online: Greencarreports.com (accessed on 1 June 2020).
  35. Miley, J. Tesla Puts Price on Model 3 Battery Module Replacement around $5000–$7000. Interesting Engineering, 15 April 2009. [Google Scholar]
  36. Electric Vehicle Batteries and Warrantees. 2 January 2019. Available online: Energysage.com (accessed on 1 June 2020).
  37. Gorzelany, J. Which Electric Cars Offer the Best Warranties? Insideevs News, 18 January 2019. [Google Scholar]
  38. Tesla, Vehicle Warranty. Available online: https://www.tesla.com/support/vehicle-warranty (accessed on 23 July 2020).
  39. Adlen, N. Is Battery Degradation Still a Major Issue for Electric Cars? New Data Shows How Much Capacity EV Models Lose Over Time. 2020. Available online: tflcar.com (accessed on 15 June 2021).
  40. Mueller, D. Used EV Prices Are Finally Heating Up—A Little. Automotive News, 31 December 2018. [Google Scholar]
  41. Rogers, C. Resale Prices Tumble on Electric Cars. Wall Street Journal, 27 February 2015; 51. [Google Scholar]
  42. Henry, J. EV Residual Values a Concern for Lenders. 94(6924). Automotive News, 9 March 2020; 26. [Google Scholar]
  43. Kahn, D. EVs Still Elite but Getting More Equitable. Energy and Environment News, 5 December 2018. [Google Scholar]
  44. Greene, D.L. Uncertainty, Loss Aversion and Markets for Energy Efficiency. Energy Economics 2011, 33, 608–616. [Google Scholar] [CrossRef]
  45. German, J. Hybrid Vehicles: Trends in Technology Development and Cost Reduction. Briefing. International Council on Clean Transportation. 23 July 2015. Available online: https://theicct.org/publications/hybrid-vehicles-trends-technology-development-and-cost-reduction (accessed on 1 June 2020).
  46. Duncan, D.; Ku, A.L.; Julian, A.; Carley, S.; Siddiki, S.; Zirogiannis, N.; Graham, J.D. Most Consumers Don’t Buy Hybrids: Is Rational Choice a Sufficient Explanation? J. Benefit-Cost Anal. 2019, 10, 1–38. [Google Scholar] [CrossRef] [Green Version]
  47. Mordor Intelligence. Hybrid Vehicle Market: Growth, Trends, COVID-19 Impact, and Forecasts (2021–2026); Mordor Intelligence: Hyderabad, Telengana, India, 2021. [Google Scholar]
  48. Anker, P. A Pioneer Country? A History of Norwegian Climate Policies. Clim. Chang. 2018, 151, 29–41. [Google Scholar] [CrossRef]
  49. Figenbaum, E. Perspectives on Norway’s Supercharged Electric Vehicle Policy. Environ. Innov. Soc. Transit. 2017, 25, 14–34. [Google Scholar] [CrossRef] [Green Version]
  50. Bloomberg. Gasoline Prices around the World: The Real Cost of Filling Up. 17 January 2020. Available online: Bloomberg.com (accessed on 1 June 2020).
  51. Doyle, A.; Adomaitis, N. Norway Shows the Way with Electric Cars, But at What Cost? 13 March 2013. Available online: www.reuters.com/article/2013/03/13/environment-cars-norway (accessed on 1 June 2020).
  52. Figenbaum, E.; Assum, T.; Kolbenstuedt, M. Electromobility in Norway: Experiences and Opportunities. Res. Transp. Econ. 2015, 50, 29–38. [Google Scholar] [CrossRef]
  53. Norwegian Climate Policy. Report Number 21 to the Parliament (2011–2012). Recommendations from the Ministry of the Environment. 25 April 2012, approved by the Cabinet on the same date (Stoltenberg II Government). Available online: www.regjering.co (accessed on 1 June 2020).
  54. Kane, M. Norway Looks to Cut Some Electric Car Incentives in the Future. Inside EVs. 12 May 2015; Kjetil Malkerns Hovland. Electric-Car Perks Put Norway in a Pinch. Wall Street Journal, 12 May 2015; B4. [Google Scholar]
  55. Haugneland, P.; Lorentzen, E.; Bu, C.; Haugo, E. Put a Price on Carbon to Fund EV Incentives: Norwegian Policy Success. EV30 Symposium. 2017. Available online: https://elbil.no/wp-content/uploads/2016/08/EVS30-Norwegian-EV-policy-paper.pdf (accessed on 1 June 2020).
  56. Holland, M. Norway in November: EV Market Share at 80%, Fossils Disappearing. 3 December 2020. Available online: Cleantechnica.com (accessed on 15 June 2021).
  57. Brooks, A. Norway Wrestles with Costly EV Subsidies: World Leader at a Crossroads. 27 June 2017. Available online: MasterResources.org (accessed on 1 June 2020).
  58. Edelstein, S. California $1500 Point-of-Sale Rebate on EVs Starts This Week. 19 November 2020. Available online: Greencarreports.com (accessed on 1 June 2020).
  59. Kane, M. California Plug-Ins Capture 8% of the Market in 2020. 6 February 2021. Available online: Evnews.com (accessed on 15 June 2021).
  60. Edmunds. 2021 Tesla Model 3. Available online: Edmunds.com (accessed on 19 July 2021).
  61. Carlson, K. As it Speeds Ahead with Austin Factory, Tesla Hits New Production High. Austin- American Statesman. 2 April 2021. Available online: Statesman.com (accessed on 15 June 2021).
  62. Automotive, C. Average New-Vehicle Transaction Prices Continue to Surpass $40,000, According to Kelley Blue Book. 15 February 2021. Available online: Coxautoinc.com (accessed on 15 June 2021).
  63. Lutz, H. Bolt Surges with New Markets, Attention. Automotive News, 9 January 2021. [Google Scholar]
  64. Kane, M. California: Plug-Ins Capture Almost 11% of the Market in Q1 2021. 28 June 2021. Available online: Evnews.com (accessed on 10 July 2021).
  65. Union of Concerned Scientists. What is ZEV? 7 August 2012. Available online: https://www.ucsusa.org/resources/what-zev (accessed on 17 April 2020).
  66. McConnell, V.; Leard, B.; Kardos, F. California’s Evolving Zero Emission Vehicle Program: Pulling New Technology into the Market. Resources for the Future. Working Paper. 19–22 November 2019. Available online: https://www.rff.org/publications/working-papers/californias-evolving-zero-emission-vehicle-program/ (accessed on 15 June 2021).
  67. California Air Resources Board. California’s Advanced Cars Midterm Review; Summary Report for the Technical Analysis of Light-Duty Vehicle Standards; California Air Resources Board: Sacramento, CA, USA, 18 January 2017. Available online: https://ww2.arb.ca.gov/resources/documents/2017-midterm-review-report (accessed on 1 June 2020).
  68. California Air Resources Board. Zero Emission Market Development Strategy: Sacramento, CA, USA. Available online: https://ww2.arb.ca.gov/our-work/programs/zero-emission-vehicle-program (accessed on 11 July 2021).
  69. Pendell, R.; Blumenberg, E.; Dawkins, C. What if Cities Combined Car-Based Solutions with Transit to Improve Access to Opportunity? Urban Institute: Washington, DC, USA, 2016. [Google Scholar]
  70. Kahn, D. California to Extend Low-Carbon Fuel Standard through 2030. Scientific American, 30 April 2018. [Google Scholar]
  71. Sheldon, T.L.; DeShazo, J.R. How Does the Presence of HOV Lanes Affect Plug-In Electric Vehicle Deployment in California? A Generalized Propensity Score Approach. J. Environ. Econ. Manag. 2017, 85, 1–25. [Google Scholar] [CrossRef]
  72. California Energy Commission. Report Shows California Needs 1.2 Million Electric Vehicle Chargers by 2030. Available online: https://www.energy.ca.gov/news/2021-06/report-shows-california-needs-12-million-electric-vehicle-chargers-2030 (accessed on 9 June 2021).
  73. Ciferri, L.; Franny, J. BMW Spends Big to Keep Green Lead. Automotive News. 20 August 2007. Available online: https://europe.autonews.com/article/20070820/ANE/70817006/bmw-will-spend-big-to-keep-green-lead (accessed on 15 June 2021).
  74. German Federal Government. National Electromobility Development Plan. August 2009. Available online: https://www.bmvi.de/blaetterkatalog/catalogs/219118/pdf/complete.pdf (accessed on 1 June 2020).
  75. Abnett, K.; Carey, N. Once ‘Green’ Hybrid Cars Suddenly Look Like Dinosaurs in Europe. 12 April 2021. Available online: https://www.reuters.com/business/retail-consumer/once-green-plug-in-hybrid-cars-suddenly-look-like-dinosaurs-europe-2021-04-12/ (accessed on 15 June 2021).
  76. Miravete, E.J.; Moral, M.J.; Thurk, J. Fuel Taxation, Emissions Policy and Competitive Advantage in the Diffusion of European Diesel Automobiles. RAND J. Econ. 2002, 33, 275–297. [Google Scholar] [CrossRef]
  77. Thompson, G.J.; Carder, D.K.; Besch, M.C.; Thiruvengadam, A.; Kappanna, H.K. In-Use Emissions Testing of Light-Duty Diesel Vehicles in the US; Consultant Report by West Virginia University; 30 May 2014; ICCT: Washington, DC, USA, 2014. [Google Scholar]
  78. Fritz, M.; Plotz, P.; Funke, S.A. The Impact of Ambitious Fuel Economy Standards on the Market Uptake of Electric Vehicles and Specific CO2 Emissions. Energy Policy 2019, 135, 111006. [Google Scholar] [CrossRef]
  79. Wappelhorst, S.; Mock, P.; Yang, Z. Using Vehicle Taxation Policy to Lower Transport Emissions: An Overview for Passenger Cars in Europe. ICCT. December 2018. Available online: https://theicct.org/publications/using-vehicle-taxation-policy-lower-transport-emissions (accessed on 1 June 2020).
  80. Staff, R. Merkel Wants Germany to Have 1 Million Electric Car Charging Points by 2030. 3 November 2019. Available online: reuters.com (accessed on 1 June 2020).
  81. Kane, M. Germany: Plug-In Car Share at 26%: Records Everywhere in December 2020. 16 January 2021. Available online: Insideevs.com (accessed on 15 July 2021).
  82. Langness, T. Edmunds: Top Picks for Road Trips with Maximum Range. Washington Post, 12 August 2020. [Google Scholar]
  83. U.S. Department of Energy. Compare Electric Cars Side-by-Side. U.S. Environmental Protection Agency. Available online: https://www.fueleconomy.gov (accessed on 15 July 2021).
  84. Plötz, P.; Moll, C.; Li, Y.; Bieker, G.; Mock, P. Real-World Usage of Plug-In Hybrid Electric Vehicles: Fuel Consumption, Electric Driving, and CO2 Emissions. International Council on Clean Transportation. White Paper. 27 September 2020. Available online: https://theicct.org/publications/phev-real-world-usage-sept2020 (accessed on 15 July 2021).
  85. Bannon, E. Plug-In Hybrids in New Emissions Scandal as Tests Show Higher Pollution than Claimed. 23 November 2020. Available online: Transportenvironment.org (accessed on 15 July 2021).
  86. Carey, N.; Abnett, K.; Wissenbach, I. EU Set to Call Time on Combustion Engine Within Two Decades. 13 July 2021. Available online: Reuters.com (accessed on 15 July 2021).
  87. McKerracher, C. Hyperdrive Daily: Battery Swapping Makes a Comeback in China. 6 April 2021. Available online: Bloomberg.com (accessed on 15 July 2021).
  88. Sun, Y.; Munroe, T. EV Maker Nio to Have 4000 Battery Swapping Stations Globally in 2025. 8 July 2021. Available online: Reuters.com (accessed on 15 July 2021).
  89. Lambert, F. NIO Announces Plan to Open Battery Swap Stations to Other Electric Automakers—Any Takers? 9 July 2021. Available online: Electrek.co (accessed on 15 July 2021).
  90. Bloomberg. The World’s Leading Electric-Car Visionary Isn’t Elon Musk. Economic Times, 27 September 2018. [Google Scholar]
  91. Jin, L.; He, H.; Cui, H.; Lutsey, N.; Wu, C.; Chu, Y.; Zhu, J.; Lu, X. Driving a Green Future: A Retrospective Review of China’s Electric Vehicle Development and Outlook for the Future. ICCT. January 2021. Available online: https://theicct.org/publications/china-green-future-ev-jan2021 (accessed on 15 July 2021).
  92. Kong, T.Y. New Energy Vehicles Industry in China: Developments and Challenges. East Asian Policy 2016, 8, 87–99. [Google Scholar] [CrossRef]
  93. Jaffe, A.M. Is OPEC China’s Problem? Council on Foreign Relations. Blog Post, 7 June 2019. [Google Scholar]
  94. Masters, P. Electric Cars: The Drive for a Sustainable Solution in China; Research Brief; China Environment Forum. Wilson Center: Washington, DC, USA, August 2009; Available online: www.wilsoncenter.org (accessed on 15 July 2021).
  95. Yang, S. In Tougher Times, China Falls Back on Coal. Wall Street Journal, 23 December 2019. [Google Scholar]
  96. Shepherd, C.; Zhou, E.; Manson, K. Climate Change: China’s Coal Addiction Clashes with Xi’s Bold Promise. Financial Times, 3 November 2020. [Google Scholar]
  97. Zhang, L.; Qin, Q. China’s New Energy Vehicle Policies: Evolution, Comparison and Recommendations. Transp. Res. Part A Policy Pract. 2018, 110, 57–72. [Google Scholar] [CrossRef]
  98. Edelstein, S. Electric Cars: China Extends EV Subsidies Beyond 2015. Christian Science Monitor, 13 February 2014. [Google Scholar]
  99. Li, S. Better Lucky than Rich? Welfare Analysis of Automobile License Allocations in Beijing and Shanghai. Rev. Econ. Studies 2018, 85, 2389–2428. [Google Scholar] [CrossRef]
  100. Danilovic, M.; Liu, J.L. Exploring Battery-Swapping For Electric Vehicles in China 1.0. Sweden-China Bridge Newsletter. Issue #2. April 2021. Available online: https://ju.se/center/mmtc/about-us/news-and-announcements/sticky-news/2021-04-14-research-project-sweden-china-bridge.html (accessed on 15 July 2021).
  101. Hall, D.; Cui, H.; Lutsey, N. Electric Vehicle Capitals of the World: What Markets Are Leading the Transition to Electric? ICCT Briefing. November 2017. Available online: https://theicct.org/publications/EV-capitals-of-the-world-2017 (accessed on 1 June 2020).
  102. Bloomberg. China Raises 2025 Sales Target to Galvanize Industry. Energy and Environment News, 4 December 2019. [Google Scholar]
  103. Ou, S.; Hao, X.; Lin, Z.; Wang, H.; Bouchard, J.; He, X.; Przesmitzki, S.; Wu, Z.; Zheng, J.; Lv, R.; et al. Light-Duty Plug-In Electric Vehciles in China: An Overview on the Market and Its Comparisons to the US. Renew. Sustain. Energy Rev. 2019, 112, 757. [Google Scholar] [CrossRef]
  104. Canalys. Electric Vehicle Outlook: 2021 and Beyond. 11 July 2021. Available online: canalys.com (accessed on 15 July 2021).
  105. Cui, H. China Announced 2020–2022 Subsidies for New Energy Vehicles. Policy Update. ICCT. July 2020. Available online: https://theicct.org/publications/china-2020-22-subsidies-new-energy-vehicles-jul2020 (accessed on 15 July 2021).
  106. Hart, M.; Bassett, L.; Johnson, B. Research Note on US and Chinese Coal-Fired Power Data; Center for American Progress: Washington, DC, USA, 2017. [Google Scholar]
  107. Kurani, K.S.; Hardman, S. Automakers and Policymakers May Be on a Path to Electric Vehicles, Consumers Aren’t; Institute for Transportation Studies, University of California-Davis: Davis, CA, USA, 2017. Available online: www.ucits.org (accessed on 15 July 2021).
  108. Mark Kane. In 2019, the Japanese Plug-In Electric Vehicle Market Declined Again. 23 January 2020. Available online: insideevs.com (accessed on 1 June 2021).
Figure 1. Past and projected price trajectory for lithium-ion NMC battery packs [26].
Futuretransp 01 00018 g001
Figure 2. A Timeline of China’s Milestones in the Development of Battery Swapping [99].
Futuretransp 01 00018 g002
Table 1. First-Generation Modern PEVs: Sales Targets vs. Actual Sales [5] (p. 35).
ModelYear Goal SetSales GoalTime FrameRegionActual SalesSales Year
Mitsubishi MiEV200830,0002013Global81812011–2013 *
Chevrolet Volt200950,000Per yearUS20,5922012–2018 **
Chevrolet Volt2009500,000Cumulative—2016Global187,0002010–2016
Nissan Leaf201020,0002012US98192012
Nissan Leaf20101,500,000Cumulative—2016Global470,0002010–2017
BMW i3201130,000Per yearGlobal26,3152014–2018 **
Tesla Model S201220,000Per year US23,0382014–2019 **
* Average annual sales in top markets (US, Canada, Japan and Australia) ** Annual average of sales.
Table 2. Market penetration of PEVs by region 2010–2020 [6].
Region20102011201220132014201520162017201820192020
Norway0.311.323.245.8913.321.126.637.149.155.974.70%
California0.000.501.302.503.203.103.604.808.978.268.10%
China0.000.000.060.080.360.981.392.304.604.905.40%
Europe0.010.080.230.530.751.411.351.742.503.6011.40%
France0.000.120.330.530.701.181.441.762.202.8011.20%
Germany0.000.010.110.230.420.720.731.592.003.0013.50%
USA0.000.170.430.710.770.700.981.262.302.102.20%
Japan0.060.330.580.650.690.590.501.231.100.900.60%
Global Average0.010.070.170.250.380.620.861.301.102.604.60%
Table 3. The Retail Prices [USD] of BEVs Compared to Competitor Gasoline Vehicles in Norway, 2017 [54].
PRICE FACTOR [USD]VW GOLFVW E-GOLFAUDI A-7TESLA MODEL S
IMPORT PRICE18,062.4025,990.0031,946.4063,600.00
CO2 TAX3182.70-12,525.30-
NOX TAX226.30-152.50-
WEIGHT TAX2152.60151.0010,919.80-
SCRAPPAGE FEE240.00240.00240.00240.00
25% VAT5966.00-13,946.00-
FINAL RETAIL PRICE29,830.0026,381.0069,730.0063,840.00
Table 4. Tesla’s Share of the California Market for PEVs, 2020–2021 [60].
Tesla ModelsSales Volume, 2020Sales Volume, 2021, Q1
Model 338,5809731
Model Y20,12413,786
Model X74521745
Model S4,718889
Total Tesla70,87426,151
Total CA PEVs132,77253,261
Tesla Share53%49%
Table 5. The All-Electric and Total Driving Ranges of Selected PHEVs [82].
ModelAll-Electric Range (Miles)Total Range (Miles)
Chevrolet Volt (2016)53420
BYD Tang PHEV (2021)69652
Toyota RAV4 Prime (2021)42600
Chevrolet Volt (2014)38380
Volkswagen Passat GTE PHEV (2021)34650
Ford Escape PHEV (2021)37520
Toyota Prius Prime (2021)25640
Mitsubishi Outlander PHEV (2021)24320
Range Rover Sport PHEV (2021)19480
Toyota Prius PHEV (2015)11540
Table 6. The 2020 top 10 best-selling PEV models in Norway, California, Germany, and China, respectively [104].
Norway California Germany China
1. Audi e-Tron 1. Tesla Model 3 1. Renault Zoe EV 1. Tesla Model 3
2. VW ID.3 2. Tesla Model Y 2. VW e-Golf EV 2. Wuling HongGuang MINI EV
3. VW e-Golf 3. Toyota Prius Prime PHEV 3. Tesla Model 3 EV 3. Baojun E-series
4. Hyundai Kona EV 4. Chevrolet Bolt EV 4. Volkswagen ID.3 4. Great Wall Ora R1
5. Nissan Leaf 5. Tesla Model X 5. Volkswagen Passat GTE 5. GAC Aion S
6. Tesla Model 3 6. Tesla Model S 6. Hyundai Kona EV 6. BYD Qin Pro EV
7. SAIC MG ZS EV 7. Honda Clarity Plug-In Hybrid 7. Mercedes E300e/de PHEV 7. Chery eQ
8. Mercedes EQC 8. Chrysler Pacifica Hybrid 8. Mercedes A250e 8. Li Xiang One EREV
9. Mitsubishi Outlander PHEV 9. Hyundai Kona EV 9. Smart Fortwo EV 9. BYD Han EV
10. BMW i3 10. Audi Q5 PHEV 10. Volkswagen e-Up! EV 10. NIO ES6
Table 7. Summary of distinctive pro-PEV policy drivers and policy instruments in California, China, Germany and Norway.
JurisdictionPolicy DriversPro-PEV Policy Instruments
CaliforniaUrban Air Quality Zero Emission Vehicle Mandate
Climate ChangeCar-Pool Lane Access for PEV Owners
Economic DevelopmentConsumer Subsidies for PEV Purchasers
ChinaEnergy SecurityProducer Subsidies for PEVs
Economic Development Restrictions on Inner City Use of Conventional Vehicles
GermanyUrban Air QualityConsumer Subsidies for PEVs
Climate ChangeEU CO2 Standards
Economic Development
NorwayClimate ChangeHeavy Taxation of Conventional Vehicles
Publisher’s Note: MDPI stays neutral with regard to jurisdictional claims in published maps and institutional affiliations.

