Abstract
The transportation network design and frequency setting problem concerns the optimization of transportation systems comprising fleets of vehicles serving a set amount of passengers on a predetermined network (e.g., public transport systems). It has been a persistent focus of the transportation planning community while, its NP-hard nature continues to present obstacles in designing efficient, all-encompassing solutions. In this paper, we present a new approach based on an alternating-objective genetic algorithm that aims to find Pareto optimality between user and operator costs. Extensive computational experiments are performed on Mandl’s benchmark test and prove that the results generated by our algorithm are 5–6% improved in comparison to previously published results for Pareto optimality objectives both in regard to user and operator costs. At the same time, the methods presented are computationally inexpensive and easily run on office equipment, thus minimizing the need for expensive server infrastructure and costs. Additionally, we identify a wide variance in the way that similar computational results are reported and, propose a novel way of reporting benchmark results that facilitates comparisons between methods and enables a taxonomy of heuristic approaches to be created. Thus, this paper aims to provide an efficient, easily applicable method for finding Pareto optimality in transportation networks while highlighting specific limitations of existing research both in regards to the methods used and the way they are communicated.
1. Introduction
The field of public transport optimization has attracted immense research interest for more than 50 years. The increase in the Earth’s population, increasing urbanization and widespread urban development have made the need for efficient urban transportation systems ever more pressing [1,2]. To this day, and for the foreseeable future, cities in every continent are having to build or restructure their services to meet the demands of increased population sizes [3,4]. However, across the world, city center road networks are buckling from congestion issues that lead to environmental and noise pollution, increased road accident rates and ever decreasing quality of life indexes [5,6,7]. This has turned the sights of researchers, competent authorities, and key stakeholders towards improved public transport systems, as they provide a cost-effective avenue of regulating intercity mobility, stimulating sustainable growth, and increasing citizen satisfaction [8,9]. The problem is called Transportation Network Design and Frequency Setting Problem (TRNDFSP) and this paper presents a novel twist on established approaches to create efficient networks.
2. Literature Review
2.1. The TRNDFSP Problem
One of the first researchers to describe an iterative, analytic solution method for fixed-demand networks was Rea, who demonstrated that similar methods can be sensitive to policy changes [10]. In the following years, the various methods that were developed [11,12,13,14] followed in the same steps, aiming to minimize user cost through iterative processes. However, the use of computing algorithms remained at a minimum due to computers still being at a nascent stage; something that all the above recognized.
Later years saw research interest focus on applying natural processes to the solution of transportation networks, with the most disrupting effects arising due to the following processes: (a) genetic algorithms [15], (b) simulated annealing [16] and tabu search [17]. In fact, even initial attempts of applying genetic algorithms to transportation networks saw encouraging results, even though their heavy computational load as well as their reliance of fine-tuned parameters were quickly recognized [18,19].
Nevertheless, the perception that non-computational, analytic models are better suited to individual cases and policy changes, was cemented at the start of the new century [20]. Today, the field is dominated by heuristic and meta-heuristic approaches [21], with the most prominent being genetic algorithms, as they are exceptionally suited to generating sets of routes, dealing with discrete variables and staying within constraints [22].
Hence, it is no surprise that a host of studies [23,24,25,26,27] utilize only slightly modified genetic algorithms to deal with the transit network design and frequency setting problem. Others use genetic algorithms as a cornerstone to more complex approaches such as finding Pareto optimality, using genetic algorithms to choose optimal solutions within a pool [28,29] and linking OD matrices to various parameters [30]. As for the Pareto optimality, a notable research proposed an Alternating Objective Genetic Algorithm (AOGA) to efficiently solve the TRNDFSP, in which the objective to be searched is cyclically alternated along the generations. The results evidence that the AOGA that was developed is very efficient, leading to improved solutions when compared to previously published results [31].
Lastly, recent years have seen the emergence of other nature-inspired approaches focused on hive optimization; the most prominent being ant colony optimization [32] and bee colony optimization [33]. As a first step, these are being used to select optimal routes between existing sets [7] or designing route sets before setting their frequencies [5,34,35].
Thorough reviews were published in 2009 [21] and in 2014 [36] in which, the reviewers, concentrated and presented in a table a plethora of methodologies on TRNDFSP from the establishment of the problem in the 1960s to the date of the respective review. According to the later, four major concerns arise from the reviewed methodologies. First, none of the works integrates all the mentioned modelling features. Second, many of these modelling features are not fully or properly covered. Third, other key modelling features have been omitted. Finally, the solving techniques do not guarantee an accurate solution, or are limited to the modelling features being considered [36].
At this stage, it is important to mention the sociological parameters in the problem. It is apparent that transport should not be considered only a technical phenomenon and mobility only a geographical phenomenon. Both terms have a connection with a lot of social phenomena, they are influenced and they influence a range of social processes and structures, as far as the social stratification, change of social relations, social exclusion, or changes in urban spatial patterns is concerned [37]. Although this is not the main scope of the research, we want to stretch out the factor of the psychosocial barriers of public transport especial with the disabled and the elderly [38]. Furthermore, the COVID-19 pandemic has played a key role in the continuing change of commuting trends, as there is a significant proportion of people that are moving towards micromobility options or even considering not commuting at all as they have the option of working remotely [39].
2.2. Evolutionary Algorithms
In computer science, evolutionary computation is a family of algorithms for global optimization inspired by biological evolution, and the subfield of artificial intelligence and soft computing studying these algorithms. Such algorithms include genetic algorithms, genetic programming, evolutionary programming, which can be adjusted to address single-objective or multi-objective problems. In most cases, as seen previously, the TRNDFSP is handled as a multi-objective problem.
According to recent research in the field, notable optimization of multi-objective problems can be accomplished with a learning-based algorithm that includes learning automation, and later adjusting the evolutionary strategies of the algorithm to adapt to the problem characteristics, according to the feedback information during the optimizing procedure [40]. In another study, a new adaptive island evolutionary algorithm was proposed for the berth scheduling problem, aiming to minimize the total weighted service cost of vessels. The optimality gap of the algorithm is relatively low and the proposed solution algorithm exhibits statistically significant improvements in terms of the objective function values when compared to state-of-the-art metaheuristic algorithms [41]. Furthermore, a research that developed the AnD algorithm (angle-based selection strategy and a shift-based density estimation strategy), showed that it can achieve highly competitive performance when compared to other state-of-the-art many-objective evolutionary algorithms on a variety of benchmark test problems with up to 15 objectives. AnD has a simple structure, few parameters, and no complicated operators [42]. Furthermore, in the field of bioinformatics the use of machine learning-based methodologies show high performance in the distinction of fatal bacterial meningitis from viral meningitis, achieving 100% of sensitivity in detecting the former [43].
As for the transportation sector, a research was conducted to address the vehicle routing problem, by developing an optimization model and solution algorithms which utilizes a mixed-integer linear programming model and employs four metaheuristic algorithms, including the evolutionary algorithm, variable neighborhood search, tabu search, and simulated annealing to solve the model for large-scale problem instances [44].
Lastly, it is important to mention the significance of data classification in the process of optimizing a multi-objective problem. According to research, the use of swan algorithms, and specifically the Salp swam algorithm in standard classification measures over considered benchmark datasets shows supremacy in results as compared with other evolutionary algorithm based multilayer perceptron, such as genetic algorithm (GA), particle swarm optimization (PSO), differential evolution (DE), grey wolf optimization (GWO), etc [45].
3. Problem Description
The bus network design is formulated as a non-convex, NP-hard optimization problem dealing with the minimization of all resources and costs related to a public transport system with fixed demand [29]. Common problem inputs are the distribution of trip generation within an area, its topology along with a set of objectives and constraints [46]. The objectives that appear more frequently in relevant literature can be summarized as follows [21,47]:
- (1)
- User benefit maximization
- (2)
- Operator cost minimization
- (3)
- Maximization of total system welfare
- (4)
- Maximization of network capacity
- (5)
- Energy conservation
- (6)
- Parameter-focused optimization
From all the above, recent literature has aimed at improving overall system welfare, as it encompasses both user and operator costs [26,48].
Regarding the problem formulation, a plethora of authors [18,22,23,25,27,31,49] have described the problem in, each time, slightly different language. The formulation that is presented in the following paragraphs aims to unify the problem description under a common, mathematical formulation. It draws from graph theory and problem descriptions of previous papers to present a complete formulation of the transportation network design and frequency setting problem.
The road network that is studied can be modelled as an undirected planar graph (flow network) consisting of a set of vertices, , and a set of edges, , along with their respective flows (. This way, we can mathematically describe the OD matrix, containing the passenger flows from each vertex (i.e., bus stop, centroid) of the matrix to any other vertex along with the way that these are linked; with null values between vertices that are not directly linked [50,51]. Additionally, the necessary time matrix for the design of the transportation network is included in the mathematical description:
where is a set of edges :
so that:
where , ith edge of the edge set; , start vertex of the i-th edge; , end vertex of the i-th edge; , weight of the edge, that represented the travel distance; , the length of the edge; , edge passengers travelling from to ; , identifies the edge among other edges; , vertex notation.
Additionally, we consider the family of sets of routes between the vertices that fulfill a set of constraints described in a following section. These are denoted as follows:
where , is the n-th set of routes; , vector of vertices that belong in the bus route; , vector of route passenger load for every vertex of the route; , route fleet; , headway between two vehicles of the route fleet; , the n-th family of sets of routes; , the set of all possible routes between the graph vertices.
Given the above we consider two objective functions that represent the interests of the passengers as well as the interests of the operator. The passenger cost is represented through the generalized user cost equation, while the operator cost is represented through the fleet that is necessary for the network to operate. The objective equations and the overall goal are as follows:
where , is the total passenger cost; , is the weight associated with the time users spend waiting at a bus stop; , the total time users spend waiting at a bus stop; , is the total time users spend in a vehicle; , are the total time penalties associated with users needing to transfer routes once or twice respectively; , is the time penalty for unsatisfied demand by users; , is the total operator cost, measured in vehicles; , is the total vehicle fleet required for the selected route set .
Therefore, our aim is to find a set of Pareto-optimal network solutions (i.e., route sets) between these two conflicting objectives.
Constraints
, , minimum and maximum time-length of a route; , the time-length of the i-th route in the n-th route set; , passenger load observed in the i-th route of the n-th route set; , fleet size the i-th route of the n-th route set; , vehicle passenger capacity for the i-th route of the n-th route set; , maximum load factor set by the operator; ,, minimum and maximum headway of a route; , the headway of the i-th route in the n-th route set; , , maximum number of routes allowed in a route set:
4. Solution Approach–Methodology
The Transportation Network Design and Frequency Setting problem is well known to be non-convex and computationally NP-hard. In the scope of this study, a heuristic and meta-heuristic approach leading to a novel, alternating-objective, genetic algorithm has been chosen. Its goal is to produce a wide array of feasible network solutions that satisfy the demands of both the transportation network user as well as its operator while attempting to find near-optimal solutions. These solutions are known as Pareto Optimal solutions, as they describe the edge situation where each party’s interests cannot be further improved without compromising the interests of the other party.
The proposed solution can be broken down into two distinct parts:
- (1)
- Route database & population generation
- (2)
- Alternating-objective genetic algorithm with elitism
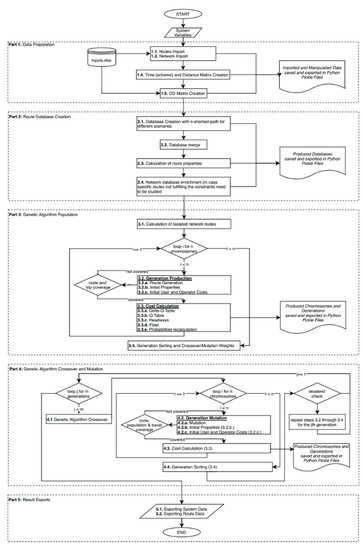
The first part utilizes heuristics-mainly Yen’s k-shortest path [52] and Dijkstra’s algorithm [53]—to create a vast database of routes connecting any two nodes of the OD matrix. Consequently, the population algorithm attempts to create feasible (i.e., fulfilling the constraints) network solutions by selecting routes generated in the preceding step. Each new feasible solution is called a “chromosome” while the set of solutions generated is called a “generation”. In the second part, a modified genetic algorithm cycles between finding the best (i.e., lowest cost) solutions in the generation for the users and the best for the operator. The best solutions are kept, while new ones are created for the next generation. By the end of the algorithm, a Pareto frontier has been created, outlining a set of near-optimal solutions for both the users and the operator. A flowchart of the algorithm is presented in Figure 1.
Figure 1.
Alternating-Objective Genetic Algorithm flowchart.
4.1. Input Data
The GA requires a set of data matching the concepts developed under the problem formulation section. Therefore, the following data are required for the algorithm to run:
- (1)
- A symmetrical Origin-Destination matrix
- (2)
- A symmetrical time-distance matrix between network vertices
- (3)
- Constraint parameters
- (a)
- Maximum route detour factor (i.e., percentage that a route time can vary from the minimum shortest route)
- (b)
- Minimum/Maximum route time
- (c)
- Minimum/Maximum route vehicle headway
- (d)
- Minimum/Maximum number of routes in each route set (i.e., chromosome)
- (e)
- Minimum percentage of direct route coverage between OD vertices
- (4)
- Genetic algorithm parameters
- (a)
- Total number of chromosomes per generation
- (b)
- Total number of generations
- (c)
- Crossover probability
- (d)
- Mutation probability
- (e)
- Similarity factor of results required for reinitialization
- (f)
- Percentage of continuous observed similarity
- (g)
- Cost calculation loops
It should be noted that, while, the list of parameters and variables is extensive, the ones that define the robustness of the results are the OD and time matrices. The rest are merely tools that allow for the fine-tuning of the results and assist in drastically reducing the time required for such a resource-intensive algorithm to run. It is possible for all the parameters (i.e., 3a to 4g) to be defined as variables and produce a wider variety of results in exponentially more time.
4.2. Route Database & Population Generation
This first stage of the algorithm aims to create a wide range of routes connecting OD nodes, from which feasible solutions can be created. Naturally, the greater the size and variety within the pool, the greater the algorithm’s ability to approach optimality. At the same time, a large pool size can significantly lower computational performance.
The initial routes are generated through Yen’s k-shortest path algorithm and are subject to the constraints that have been described. The benefit of the k-shortest approach is that it allows for “k-1” shortest routes between two nodes to be created. An increase in the value of “k” is reflected by an increase in the influence of lines generated as, by varying from the shortest path, they cover more nodes.
Consequently, the “population” algorithm looks to bundle together routes in such a way that the transportation network constraints are met. This process involves randomly selecting routes from the route database so that a pre-set percentage of nodes are covered. Next, given the network created, the passenger loads outlined in the OD matrix are assigned to the routes (including 1- and 2-transfer routes should the OD pair not be covered directly) that service their destinations. These routes start off with pre-set headways and frequencies. Should more than one route service the same OD set, the following equation is used to calculate the possibility of passengers selecting each one:
where , is the possibility of passengers selecting the ith solution of the route set.
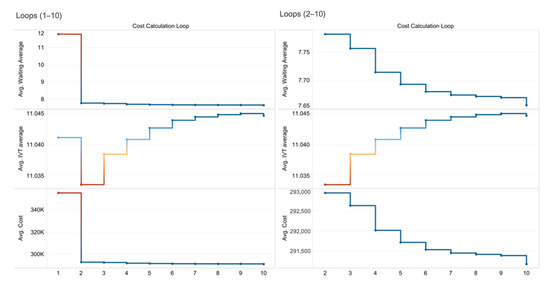
Following passenger assignment, new headways are calculated that, more accurately, service passenger demand. Given these new headways, user costs are recalculated (mainly waiting cost) and so are the route choice probabilities. This loop can continue perpetually, as each route choice is further optimized to match demand. In Figure 2, the average difference that each subsequent loop makes for each chromosome are shown, as tested on 1000 different chromosomes.
Figure 2.
Differences observed after each calculation loop.
Lastly, in case any of the constrains and checks are violated, the route set is discarded and a new one is created. This process continues until the amount of feasible route sets created reaches the specified “chromosome number per generation” that the user has provided as input.
4.3. Alternating Objective Genetic Algorithm with Elitism
The alternating-objective genetic algorithm with elitism (AOGAE) is built to find optimal Pareto-efficient solutions within the pool generated during the previous step. This is achieved through iterative comparisons spanning different sets (“generations”) of solutions and scripts that allow the best solutions to move onto later generations (elitism), thus gradually augmenting the median performance of each solution set. The process of the best solutions “surviving” while the rest are discarded has been inspired by Darwin’s evolutionary theory and modern genetic processes; it is the reason that this algorithmic approach is called a “genetic algorithm”.
In the scope of this paper, the algorithm was modified so that it alternates between minimizing user cost and minimizing operator cost. This allowed the methodology to retain only the solutions that minimized both costs at once and, finally, produce efficient networks. In the following paragraphs, the way the algorithm works will be outlined and points that allowed us to produce efficient results will be outlined.
The first step of the AOGAE algorithm is chromosome crossover. It aims to improve chromosome solutions by changing a route from one chromosome with a route from another from the same generation. Initially, each generation’s chromosomes are sorted based on the current optimization objective. Each chromosome is assigned a probability of being the participating in a crossover instance. This serves to incentivize more radical changes in chromosomes with subpar performance.
Should a pair of chromosomes be selected, the segments connecting a random OD pair that is present in both chromosomes are interchanged in what is called a two-point crossover. To guarantee that the new chromosome remains within the boundaries set by the initial constraints, an edge recombination operator is used.
Another method used by the AOGAE to avoid local minima, is called “mutation”. This process imitates the way that parts of genetic code randomly mutate to form the basis of evolutionary theory. This process is controlled by a global mutation probability for all chromosomes in each generation and a mutation probability related to the fitness of each chromosome. The worse the chromosome the more likely it is to undergo large scale mutations. Chromosomes selected for the mutation process exchange one of their routes with another from the route pool. Consequently, all the initial constraints are checked and, in the case that one is violated, the exchange is discarded and the process restarts.
Lastly, the AOGAE method implements a final way forcing the algorithm out of local minima by constantly monitoring the similarity of the results between consecutive generations. Should the similarity limit be exceeded, the algorithm discards the entirety of the generation and looks to create new chromosomes from the route pool. It should be noted that the maximum amount of consequent generations exhibiting increased similarity, heavily impacts algorithm results. This occurs, as discarding generations too early prevents them from reaching optimality, while discarding them too late may lead to results focused on local minima.
We suggest, relating max similarity occurrences with the number of generations that each instance of the algorithm will go through. All the processes described in this section alternate between minimizing user cost and minimizing operator cost. At the end of the algorithm, a wide array of solutions is presented that service different user/operator needs at performance levels that appear more robust than current literature.
5. Results
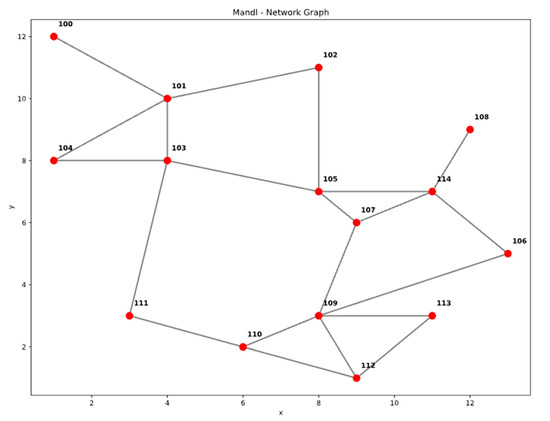
The AOGAE algorithm was tested on Mandl’s benchmark network (Figure 3), consisting of 15 vertices and 21 bidirectional links with no capacity constraint. The network was based on the locations and roads between 15 swiss towns. Mandl’s network was selected as it is the most used network for testing and benchmarking new approaches to the existing state of the art. By running the AOGAE algorithm on this network the authors benchmarked their results as presented in Table 1 The algorithm was tested on an Intel i5 7300HQ processor, 10 times with each run taking 10 min to complete. This reflects the potential of the algorithm to be integrated into widely adopted personal computer processors and therefore speaks to its potential ease of adoption from colleagues around the world. The results from the best run are presented in the following tables and figures.
Figure 3.
Mandl network graph.

Table 1.
Comparison of AOGAE results with similar methodologies.
The variables in Table 2 were used as inputs for the algorithm.
Table 2.
Algorithm Inputs.
The results of the AOGAE algorithm are compared with similar methodologies [12,22,27,31,34,35,49,54,55,56] in Table 1. It should be noted that, while a host of research teams have benchmarked algorithms in the Mandl network, results are, more often than not, presented in different formats. An option to circumvent this divide would be to try and reproduce research results based on the route sets provided by the research teams. However, even in that case, considerable assumptions would have to be made about other characteristics of their networks (e.g., headways, maximum route detour factors etc.). Therefore, we chose to only present the results that were reported by our colleagues.
The comparison is performed using the following measures:
- (1)
- Fleet size—commonly the most significant measure of operator cost
- (2)
- D0, D1, D2, Dun—Percentage of demand that is serviced directly (D0), with one transfer (D1), with two transfers (D2) and demand that is left unsatisfied (Dun)
- (3)
- User Cost—the total cost of user time spent using the network, including the weight of different activities (e.g., waiting time weight)
- (4)
- AIVT—Average in-vehicle time (lower is usually better)
- (5)
- ATT—Average time travelling (a sum of waiting time, in-vehicle time and walking time without weights)
- (6)
- ARH—Average route headway (lower means more frequent routes)
- (7)
- MRH—Maximum route headway (a measure of route timing variance)
The results presented in Table 3, show improved solutions in regards to user cost, direct percentage and fleet size. The differences in average and maximum headway in comparison with preceding literature show that more optimal solutions can be found when the majority of network capacity is utilized.
Table 3.
Pareto Optimal Solutions.
Additionally, the data visualization software package Tableau Public (Tableau Software, Seattle, WA, USA, 2017) was utilized as a method of enabling a more concise, appealing and interactive presentation of results. All such Figures can be found at the link provided at the Supplementary Materials Section.
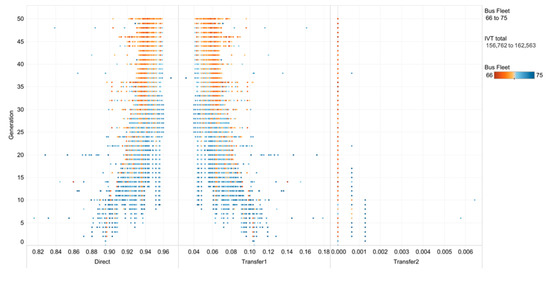
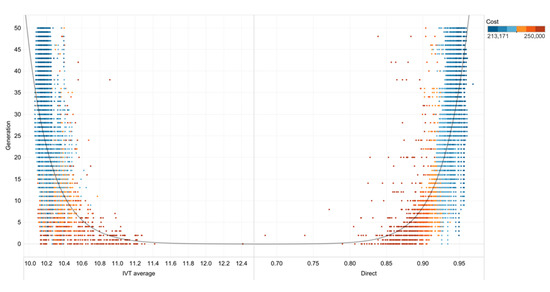
Figure 4 presents the observed improvement in direct network service that can be achieved through the AOGAE method while reducing fleet size. Naturally, very few chromosomes have second transfer percentages, and no chromosomes leave demand unsatisfied as the network is small in size; for larger networks it is considerably more likely to observe unsatisfied demand and increased percentages of 2-transfer trips. Other factors contributing to the distribution of trip service are the initial constraints regarding the minimum node coverage of each chromosome, the limits set on the number and time of routes and the penalties relating to transfers that each trip requires.
Figure 4.
Direct, 1-transfer and 2-transfer percentages per chromosome per generation (color signifies bus fleet size).
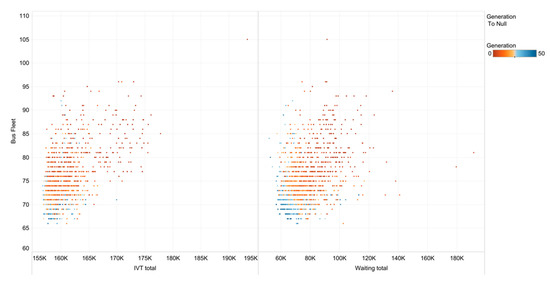
Figure 5 presents the decrease in both in-vehicle time and waiting time that is achieved; a decrease in waiting time is particularly important as it is weighed unfavorably in comparison to in-vehicle time in order to reflect differences in passenger time perception.
Figure 5.
In-vehicle & Waiting times per solution per generation (color signifies generation).
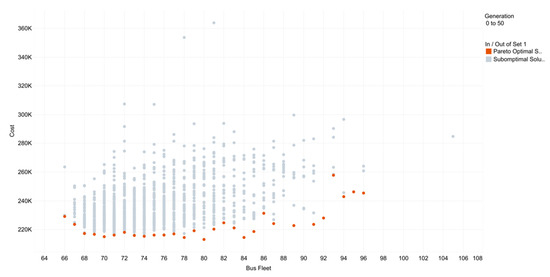
Figure 6 presents the set of Pareto-optimal solutions that were generated via the AOGAE method. As the non-convex nature of the problem prohibits single global optimal solutions, here Pareto-efficient solutions for different fleet sizes are demonstrated. Larger (>84 vehicles) and smaller (<67 vehicles) fleet sizes have few or no solutions as they do not fit the greater Pareto optimality objective of the algorithm. A trend emerging from the results which should be highlighted is the diminishing, user cost, returns that an increase in fleet size provides. This can be attributed to the nearly complete (approx. 95%) direct coverage of the network. It also explains why results converge in a small part of potential fleet sizes, as shown in Figure 7.
Figure 6.
Pareto Optimal solutions for different bus fleets (red dots).
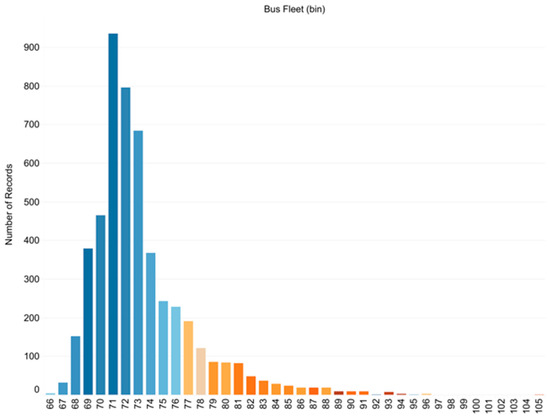
Figure 7.
Histogram of number of chromosomes per fleet size (color notes user cost, with blue and red marking low and high user costs respectively).
Figure 7 also highlights the fact that the algorithm converges to a few different fleet sizes.
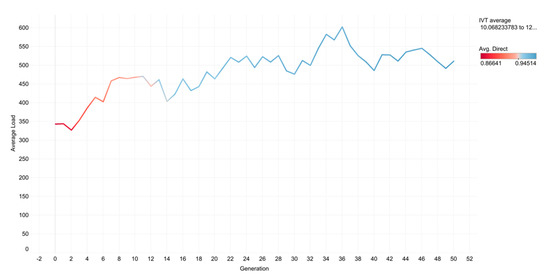
Figure 8 presents the average passenger load per vehicle per generation, with color marking the percentage of trips covered by direct routes. It is shown that the algorithm favors higher-density, direct routes as a method of optimizing the network. This result is based on the assumption that passenger satisfaction does not vary with changes in the vehicle’s level of service.
Figure 8.
Average load per vehicle per generation (color signifies direct route percentage).
Figure 9 demonstrates the improvement of in-vehicle time in comparison with direct percentage per generation with colour marking the user cost. It is shown that the common pitfall of optimizing for direct service while increasing user cost is avoided.
Figure 9.
In-vehicle time and direct percentage optimization (color is user cost).
The most common fleet size being 71 shows that a fleet size of 71 is more likely to lead to Pareto-optimal solutions. This is also demonstrated in the user costs relative to fleet size that are represented by the color of each bar, with higher cost being marked by red. The reason that solutions with high fleet sizes may also have high user costs is that they are mostly generated in the first generations of the algorithm and then quickly discarded as they do not reflect Pareto optimality on the operator side.
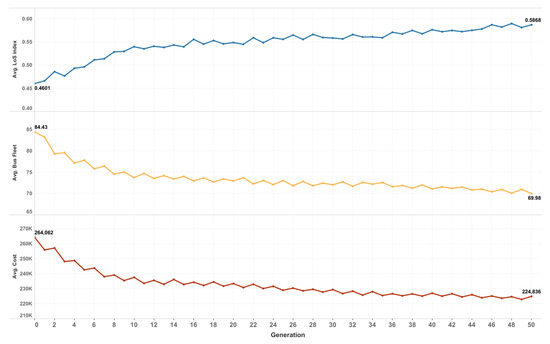
Figure 10 is illustrating how more Pareto-optimal solutions come hand-in-hand with vehicles being more crowded; this is reflected by the Level of Service (LoS) index in Figure 10, which reflects the amount of crowding in each bus with a maximum of 1.25 times capacity as described in Table 2. The fluctuation in the line graphs is attributed to the algorithm cycling optimization objectives with each new generation.
Figure 10.
User Cost, Operator Cost (fleet) & average vehicle LoS index (total passenger load/total fleet capacity).
6. Policy Implications
Despite its very promising results, implementing the algorithm to real-world scenarios remains a challenge as many of the assumptions that have been made would need to be re-evaluated. The main ones being the following:
- (1)
- Same operational speed in all network links
- (2)
- All links are bidirectional
- (3)
- Symmetrical OD-matrix
- (4)
- Bus is the single mode of public transport
- (5)
- No walking time to/from network nodes
Additionally, any real-world application would need to be implemented in collaboration with a plethora of authorities responsible for various parts of the transportation network, including the city’s administration, its transportation authority, and national/state representatives. They would provide, inform, and curate the algorithm’s input data in order to improve the quality and applicability of results generated.
Nevertheless, transportation networks that have seen few changes over the decades, stand to gain greatly from applying state-of-the-art methods to their planning, both in terms of quality-of-service and in terms of minimizing stakeholder costs. As our comparisons show, networks designed through analytic approaches (e.g., Mandl’s) are significantly less efficient in comparisons to more modern methods. Similar studies [7,29] that applied their methods to real-world scenarios have shown improvements ranging up to 30% in network performance metrics.
7. Discussion and Conclusions
In this paper, we propose an alternating-objective genetic algorithm that employs heuristics to calculate Pareto optimal solutions for the transportation network design and frequency setting problem. The first part of the algorithm deals with generating a wide pool of feasible solutions while the second part deals with finding the Pareto frontier within this pool. We showed that the algorithm provides high quality results within reasonable computational times and, consequently, compared them to recent literature. Lastly, the route to applying the algorithm to real-world applications and its benefits was analyzed and the parts in need of re-evaluation were pinpointed.
Despite its promising results, the research presented in this paper has a number of limitations that extend to its immediate applicability to real cities. The transportation network that is considered is simplified in its structure (i.e., same operational speed on all network links, all links are bidirectional, symmetrical OD-matrix) and properties (i.e., only bus as a mode of public transportation, no walking time to and from nodes) while multiple intrinsic characteristics of both passengers and operators and not considered in this study (e.g., walking time, operational costs other than fleet). Nevertheless, the results presented in this paper provide an easily applicable and computationally inexpensive tool to integrate in future research.
Future research should focus on including multiple modes of public transport and their interactions, deeper modelling of passenger behaviour and integrating transport econometrics into the operator cost functions. Additionally, while some existing approaches can be run on office computers, thus reducing the necessity of costly servers, additional research should focus on aligning existing computational transportation research with the state-of the-art of Information Technology practices, such as edge computing and containers.
The field of public transportation planning is lacking in both multimodal approaches and real-life applications. As inputs increase, a host of unpredicted variables could significantly skew results. Therefore, in the future, we aim to modify the methodology that has been described to effectively plan for n-mode choice networks (e.g., bus-metro-tram-funicular) and apply it to larger, more complex networks. Additionally, we intend to include vehicle level-of-service in the generalized user cost objective function, to better reflect changes in user perception as buses get increasingly crowded.
Lastly, a next step of this study would be to perform a case study for the city of Thessaloniki, Greece to test the algorithm and its hypotheses. Thessaloniki is a prime candidate for the AOGAE algorithm as it is in the midst of building new metro lines throughout the city while the restoration of tram transport is an ever-persistent discussion in city planning groups.
Supplementary Materials
Figures are freely accessible at https://public.tableau.com/profile/theocharis1592#!/vizhome/DraftFigures/DraftFigures.
Author Contributions
Conceptualization, T.V., K.G. and I.P.; methodology, T.V., K.G..; software, K.G.; validation, T.V., K.G., I.P. and G.G.; formal analysis, T.V., K.G.; investigation, T.V., K.G. and I.P.; resources, I.P.; data curation, T.V., K.G. and G.G.; writing—original draft preparation, T.V., K.G.; writing—review and editing, T.V., K.G. and I.P.; visualization, T.V., K.G.; supervision, I.P. and G.G.; project administration, T.V., K.G. and I.P.; funding acquisition, T.V., K.G., I.P. and G.G. All authors have read and agreed to the published version of the manuscript.
Funding
This research received no external funding.
Institutional Review Board Statement
Not applicable.
Informed Consent Statement
Not applicable.
Conflicts of Interest
The authors declare no conflict of interest.
References
- Gogola, D.I.M.; Sitanyiová, D.M.D.; Černický, I.L.; Veterník, I.M. “New Demand Pattern for Public Transport Due to Demographic Change” 2018. Available online: www.interreg-central.eu/Content.Node/working-paper--New-demand-patterns-for-public-transport-due-.pdf (accessed on 30 March 2021).
- Hickman, R.; Seaborn, C.; Headicar, P.; Banister, D. Planning for Sustainable Travel. Summary Guide; Halcrow and CfIT: London, UK, 2009. [Google Scholar]
- European Commission. “Transport in the European Union: Current Trends and Issues” 2018. Available online: https://ec.europa.eu/transport/sites/default/files/2018-transport-in-the-eu-current-trends-and-issues.pdf (accessed on 12 February 2021).
- Santos, G.; Maoh, H.; Potoglou, D.; von Brunn, T. Factors Influencing Modal Split of Commuting Journeys in Medium-Size European Cities. J. Transp. Geogr. 2013, 30, 127–137. [Google Scholar] [CrossRef]
- Szeto, W.; Jiang, Y. Transit Route and Frequency Design: Bi-Level Modeling and Hybrid Artificial Bee Colony Algorithm Approach. Transp. Res. Part B Methodol. 2014, 67, 235–263. [Google Scholar] [CrossRef] [Green Version]
- Farahani, R.Z.; Miandoabchi, E.; Szeto, W.; Rashidi, H. A Review of Urban Transportation Network Design Problems. Eur. J. Oper. Res. 2013, 229, 281–302. [Google Scholar] [CrossRef] [Green Version]
- Yu, B.; Yang, Z.-Z.; Jin, P.-H.; Wu, S.-H.; Yao, B.-Z. Transit Route Network Design-Maximizing Direct and Transfer Demand Density. Transp. Res. Part C Emerg. Technol. 2012, 22, 58–75. [Google Scholar] [CrossRef]
- Australian Government “Estimating Urban Traffic and Congestion Cost Trends for Australian Cities” 2007. Available online: https://www.bitre.gov.au/sites/default/files/wp_071.pdf (accessed on 22 March 2021).
- Kueper, D. The Context-Sensitive State Design Manual. Inst. Transp. Eng. Annu. Meet. Exhib. 2009, 2, 779–790. [Google Scholar]
- Rea, J. Designing Urban Transit Systems: An Approach to the Route-Technology Selection Problem. 1972. Available online: onlinepubs.trb.org/Onlinepubs/hrr/1972/417/417-005.pdf (accessed on 30 January 2021).
- Byrne, B.F. Cost Minimizing Positions, Lengths and Headways for Parallel Public Transit Lines Having Different Speeds. Transp. Res. 1976, 10, 209–214. [Google Scholar] [CrossRef]
- Mandl, C.E. Evaluation and Optimization of Urban Public Transportation Networks. Eur. J. Oper. Res. 1980, 5, 396–404. [Google Scholar] [CrossRef]
- Ceder, A.; Wilson, N.H. Bus Network Design. Transp. Res. Part B Methodol. 1986, 20, 331–344. [Google Scholar] [CrossRef]
- Chang, S.K.; Schonfeld, P.M. Multiple Period Optimization of Bus Transit Systems. Transp. Res. Part B Methodol. 1991, 25, 453–478. [Google Scholar] [CrossRef]
- Holland, J. Adaptation in Natural and Artificial Systems: An Introductory Analysis with Applications to Biology, Control, and Artificial Intelligence; MIT Press: Cambridge, MA, USA, 1992. [Google Scholar]
- Kirkpatrick, S.; Gelatt, C.D.; Vecchi, M.P. Optimization by Simulated Annealing. Science 1983, 220, 671–680. [Google Scholar] [CrossRef] [PubMed]
- Glover, F. Future Paths for Integer Programming and Links to Artificial Intelligence. Comput. Oper. Res. 1986, 13, 533–549. [Google Scholar] [CrossRef]
- Xiong, Y. “Optimization of Transportation Network Design Problems Using a Cumulative Genetic Algorithm and Neural Networks” 1992. Available online: trid.trb.org/view/371480 (accessed on 25 January 2021).
- Pattnaik, S.B.; Mohan, S.; Tom, V.M. Urban Bus Transit Route Network Design Using Genetic Algorithm. J. Transp. Eng. 1998, 124, 368–375. [Google Scholar] [CrossRef]
- Ceder, A. Operational Objective Functions in Designing Public Transport Routes. J. Adv. Transp. 2001, 35, 125–144. [Google Scholar] [CrossRef]
- Kepaptsoglou, K.; Karlaftis, M. Transit Route Network Design Problem: Review. J. Transp. Eng. 2009, 135, 491–505. [Google Scholar] [CrossRef]
- Chakroborty, P. Genetic Algorithms for Optimal Urban Transit Network Design. Comput. Civ. Infrastruct. Eng. 2003, 18, 184–200. [Google Scholar] [CrossRef]
- Bagloee, S.A.; Ceder, A. (Avi) Transit-Network Design Methodology for Actual-Size Road Networks. Transp. Res. Part B Methodol. 2011, 45, 1787–1804. [Google Scholar] [CrossRef]
- Hu, Y.; Zhang, Q.; Wang, W. A Model Layout Region Optimization for Feeder Buses of Rail Transit. Procedia Soc. Behav. Sci. 2012, 43, 773–780. [Google Scholar] [CrossRef] [Green Version]
- Chakroborty, P.; Wivedi, T. Optimal Route Network Design for Transit Systems Using Genetic Algorithms. Eng. Optim. 2002, 34, 83–100. [Google Scholar] [CrossRef]
- Pternea, M.; Kepaptsoglou, K.; Karlaftis, M.G. Sustainable Urban Transit Network Design. Transp. Res. Part A Policy Pr. 2015, 77, 276–291. [Google Scholar] [CrossRef]
- Nayeem, M.A.; Rahman, K.; Rahman, M.S. Transit Network Design by Genetic Algorithm with Elitism. Transp. Res. Part C Emerg. Technol. 2014, 46, 30–45. [Google Scholar] [CrossRef]
- Cipriani, E.; Gori, S.; Petrelli, M. Transit Network Design: A Procedure and an Application to a Large Urban Area. Transp. Res. Part C Emerg. Technol. 2012, 20, 3–14. [Google Scholar] [CrossRef]
- Ciaffi, F.; Cipriani, E.; Petrelli, M. Feeder Bus Network Design Problem: A New Metaheuristic Procedure and Real Size Applications. Procedia Soc. Behav. Sci. 2012, 54, 798–807. [Google Scholar] [CrossRef]
- Bielli, M.; Caramia, M.; Carotenuto, P. Genetic Algorithms in Bus Network Optimization. Transp. Res. Part C Emerg. Technol. 2002, 10, 19–34. [Google Scholar] [CrossRef]
- Arbex, R.O.; da Cunha, C.B. Efficient Transit Network Design and Frequencies Setting Multi-Objective Optimization by Alternating Objective Genetic Algorithm. Transp. Res. Part B Methodol. 2015, 81, 355–376. [Google Scholar] [CrossRef]
- Dorigo, M.; Di Caro, G. Ant Colony Optimization: A New Meta-Heuristic. In Proceedings of the 1999 Congress on Evolutionary Computation-CEC99 (Cat. No. 99TH8406), Washington, DC, USA, 6–9 July 1999; IEEE: New York, NY, USA, 2003; Volume 2, pp. 1470–1477. [Google Scholar]
- Karaboga, D.; Basturk, B. A Powerful and Efficient Algorithm for Numerical Function Optimization: Artificial Bee Colony (ABC) Algorithm. J. Glob. Optim. 2007, 39, 459–471. [Google Scholar] [CrossRef]
- Nikolić, M.; Teodorović, D. Transit Network Design by Bee Colony Optimization. Expert Syst. Appl. 2013, 40, 5945–5955. [Google Scholar] [CrossRef]
- Nikolić, M.; Teodorović, D. A Simultaneous Transit Network Design and Frequency Setting: Computing with Bees. Expert Syst. Appl. 2014, 41, 7200–7209. [Google Scholar] [CrossRef]
- López-Ramos, F. Integrating Network Design and Frequency Setting in Public Transportation Networks: A Survey. Sort Stat. Oper. Res. Trans. 2014, 38, 181–214. [Google Scholar]
- Daňková, A.; Dostál, I. The Social Aspects of Transport. Trans. Transp. Sci. 2011, 4, 81–90. [Google Scholar] [CrossRef] [Green Version]
- Al-Rashid, M.A.; Goh, H.C.; Harumain, Y.A.S.; Ali, Z.; Campisi, T.; Mahmood, T. Psychosocial Barriers of Public Transport Use and Social Exclusion among Older Adults: Empirical Evidence from Lahore, Pakistan. Int. J. Environ. Res. Public Health 2020, 18, 185. [Google Scholar] [CrossRef]
- Campisi, T.; Basbas, S.; Skoufas, A.; Akgün, N.; Ticali, D.; Tesoriere, G. The Impact of COVID-19 Pandemic on the Resilience of Sustainable Mobility in Sicily. Sustainability 2020, 12, 8829. [Google Scholar] [CrossRef]
- Zhao, H.; Zhang, C. An Online-Learning-Based Evolutionary Many-Objective Algorithm. Inf. Sci. 2020, 509, 1–21. [Google Scholar] [CrossRef]
- Dulebenets, M.A. An Adaptive Island Evolutionary Algorithm for the Berth Scheduling Problem. Memetic. Comput. 2020, 12, 51–72. [Google Scholar] [CrossRef]
- Liu, Z.-Z.; Wang, Y.; Huang, P.-Q. AnD: A Many-Objective Evolutionary Algorithm with Angle-Based Selection and Shift-Based Density Estimation. Inf. Sci. 2020, 509, 400–419. [Google Scholar] [CrossRef] [Green Version]
- D’Angelo, G.; Pilla, R.; Tascini, C.; Rampone, S. A Proposal for Distinguishing between Bacterial and Viral Meningitis Using Genetic Programming and Decision Trees. Soft Comput. 2019, 23, 11775–11791. [Google Scholar] [CrossRef]
- Pasha, J.; Dulebenets, M.A.; Kavoosi, M.; Abioye, O.F.; Wang, H.; Guo, W. An Optimization Model and Solution Algorithms for the Vehicle Routing Problem with a “Factory-in-a-Box”. IEEE Access 2020, 8, 134743–134763. [Google Scholar] [CrossRef]
- Panda, N.; Majhi, S.K. How Effective is the Salp Swarm Algorithm in Data Classification. In Advances in Human Factors, Business Management, Training and Education; Das, A., Nayak, J., Naik, B., Pati, S., Pelusi, D., Eds.; Springer: Singapore, 2020; Volume 999. [Google Scholar]
- Guihaire, V.; Hao, J.-K. Transit Network Design and Scheduling: A Global Review. Transp. Res. Part A Policy Pr. 2008, 42, 1251–1273. [Google Scholar] [CrossRef] [Green Version]
- Van Oudheusden, D.L.; Ranjithan, S.; Singh, K.N. The Design of Bus Route Systems—An Interactive Location-Allocation Approach. Transportation 1987, 14, 253–270. [Google Scholar] [CrossRef]
- Beltran, B.; Carrese, S.; Cipriani, E.; Petrelli, M. Transit Network Design with Allocation of Green Vehicles: A Genetic Algorithm Approach. Transp. Res. Part C Emerg. Technol. 2009, 17, 475–483. [Google Scholar] [CrossRef]
- Chew, J.S.C.; Lee, L.S.; Seow, H.-V. Genetic Algorithm for Biobjective Urban Transit Routing Problem. J. Appl. Math. 2013, 2013, 1–15. [Google Scholar] [CrossRef] [Green Version]
- Diestel, R.; Schrijver, A.; Seymour, P. Graph Theory. Oberwolfach Rep. 2010, 7, 521–580. [Google Scholar] [CrossRef]
- Voloshin, V.I. Introduction to Graph Theory; Nova Science Publishers, Inc.: New York, NY, USA, 2009. [Google Scholar]
- Yen, J.Y. Finding the KShortest Loopless Paths in a Network. Manag. Sci. 1971, 17, 712–716. [Google Scholar] [CrossRef]
- Dijkstra, E.W. A Note on Two Problems in Connexion with Graphs. Numer. Math. 1959, 1, 269–271. [Google Scholar] [CrossRef] [Green Version]
- Kidwai, F.; Marwah, B.; Deb, K.; Karim, M. A Genetic Algorithm Based Bus Scheduling Model for Transit Network. Proc. East. Asia Soc. Transp. Stud. 2005, 5, 477–489. [Google Scholar]
- Fan, W.; Machemehl, R.B. Tabu Search Strategies for the Public Transportation Network Optimizations with Variable Transit Demand. Comput. Civ. Infrastruct. Eng. 2008, 23, 502–520. [Google Scholar] [CrossRef]
- Mumford, C. New Heuristic and Evolutionary Operators for the Multi-Objective Urban Transit Routing Problem. In Proceedings of the 2013 IEEE Congress on Evolutionary Computatio, Cancun, Mexico, 20–23 June 2013; IEEE: New York, NY, USA, 2013; pp. 939–946. [Google Scholar]
Publisher’s Note: MDPI stays neutral with regard to jurisdictional claims in published maps and institutional affiliations. |
© 2021 by the authors. Licensee MDPI, Basel, Switzerland. This article is an open access article distributed under the terms and conditions of the Creative Commons Attribution (CC BY) license (https://creativecommons.org/licenses/by/4.0/).