Simple Summary
Technological advances now enable circulating tumor DNA (ctDNA) analysis to guide precision oncology as a critical minimal residual disease (MRD) indicator. Despite this progress, low ctDNA levels, coupled with low-frequency driver mutations from healthy tissues—compounded by variable tumor shedding and sequencing technical noise—remain a fundamental MRD challenge across solid tumors. OncoMRD BREAST is developed to address the limitations of tumor-specific, mutation-only approaches by interrogating broader and deeper tumor cell signals. Better situational awareness and leveraging of tumor activity-based monitoring systems are key advantages that could better counter the threat of residual disease. OncoMRD BREAST works across tumor, microenvironment, and immune interaction domains, employing patient-unique gene signatures from multi-spectral biomarkers to provide detection, identification, quantification, and tracking of MRD. To the best of our knowledge, this study defines the first personalized gene signature for MRD in breast cancer.
Abstract
Background: Many patients harbor minimal residual disease (MRD)—small clusters of residual tumor cells that survive therapy and evade conventional detection but drive recurrence. Although advances in molecular and computational methods have improved circulating tumor DNA (ctDNA)-based MRD detection, these approaches face challenges: ctDNA shedding fluctuates widely across tumor types, disease stages, and histological features. Additionally, low levels of driver mutations originating from healthy tissues can create background noise, complicating the accurate identification of bona fide tumor-specific signals. These limitations underscore the need for refined technologies to further enhance MRD detection beyond DNA sequences in solid malignancies. Methods: Profiling circulating cell-free mRNA (cfmRNA), which is hyperactive in tumor and non-tumor microenvironments, could address these limitations to inform postoperative surveillance and treatment strategies. This study reported the development of OncoMRD BREAST, a customized, gene signature-informed cfmRNA assay for residual disease monitoring in breast cancer. OncoMRD BREAST introduces several advanced technologies that distinguish it from the existing ctDNA-MRD tests. It builds on the patient-derived gene signature for capturing tumor activities while introducing significant upgrades to its liquid biopsy transcriptomic profiling, digital scoring systems, and tracking capabilities. Results: The OncoMRD BREAST test processes inputs from multiple cutting-edge biomarkers—tumor and non-tumor microenvironment—to provide enhanced awareness of tumor activities in real time. By fusing data from these diverse intra- and inter-cellular networks, OncoMRD BREAST significantly improves the sensitivity and reliability of MRD detection and prognosis analysis, even under challenging and complex conditions. In a proof-of-concept real-world pilot trial, OncoMRD BREAST’s rapid quantification of potential tumor activity helped reduce the risk of incorrect treatment strategies, while advanced predictive analytics contributed to the overall benefits and improved outcomes of patients. Conclusions: By tailoring the assay to individual tumor profiles, we aimed to enhance early identification of residual disease and optimize therapeutic decision-making. OncoMRD BREAST is the world’s first and only gene signature-powered test for monitoring residual disease in solid tumors.
1. Introduction
Breast cancer persists as the most prevalent malignancy in women globally and ranks as the second-leading cause of cancer-related mortality among U.S. women, with over 40,000 fatalities projected in 2023 [1]. Early-stage breast cancer comprises more than 90% of diagnoses. While therapeutic advancements have improved outcomes, approximately 30% of early-stage patients develop recurrence, driven by undetected micrometastases (minimal or measurable or molecular residual disease, MRD) that evade systemic treatment [2]. Most relapses occur within 5 years and correlate with aggressive tumor subtypes [3]. However, hormone receptor-positive (HR+) tumors demonstrate a unique propensity for late recurrence, emerging decades after initial diagnosis [2,4]. Detecting MRD post-curative therapy could transform relapse risk assessment and guide personalized interventions. Current strategies reliant on clinical exams and imaging remain inadequate due to poor sensitivity [5], underscoring the urgent need for advanced MRD detection technologies. Liquid biopsy is emerging as a promising solution to address this gap, offering a minimally invasive method for detecting tumor-derived biomarkers—such as circulating tumor DNA (ctDNA) and circulating tumor cells (CTCs)—that reflect residual or recurrent disease [3]. Cell-free ctDNA, the most widely utilized liquid biopsy biomarker, detects tumor-derived genetic alterations in blood, defining MRD. In contrast, CTCs offer a complementary approach by identifying and quantifying intact tumor cells in circulation. Both analyses could provide insights into the genotypic and phenotypic characteristics of residual disease, enabling applications such as predicting tumor relapse, identifying actionable biomarkers for therapy selection, and elucidating mechanisms underlying metastatic progression.
Most commercially available assays target advanced-stage tumors, where ctDNA levels are elevated but lack the sensitivity required for MRD detection in early-stage or post-surgical settings, where ctDNA concentrations are markedly lower [6]. This limitation has driven substantial investment in ultrasensitive detection technologies tailored for MRD monitoring in early-stage contexts [7,8,9]. Current ctDNA detection methods fall into two paradigms: tumor-agnostic and tumor-informed approaches, distinguished by their genomic targeting strategies. Tumor-agnostic methods require no prior tumor genomic data. Instead, they screen for recurrent biomarkers such as hotspot mutations, chromosomal abnormalities, or epigenetic signatures. Tumor-informed techniques, by contrast, analyze sequenced tumor tissue to create patient-specific assays tracking individualized mutations. Selection between these strategies depends on clinical objectives, with tumor-informed methods offering higher specificity for relapse surveillance and tumor-agnostic approaches enabling broader biomarker discovery [10].
Current clinical MRD assays predominantly rely on whole-exome/genome sequencing (WES/WGS) due to their potential for a broader mutation detection spectrum. Some targeted NGS assays focus on predefined genomic regions to maximize sensitivity, whereas others analyze DNA methylation patterns, which are less heterogeneous than somatic mutations, potentially improving detection accuracy in low-ctDNA scenarios [11]. This methodological divide underscores the need to balance breadth of analysis with precision, particularly in MRD monitoring. Despite technical benefits, their clinical adoption is challenged by lower sensitivity (attributable to shallow sequencing depth) and increased false positives from non-tumor mutations, such as clonal hematopoiesis of indeterminate potential and low-frequency somatic driver mutations from healthy normal tissues [12,13,14].
Advancing precision oncology in breast cancer demands more robust methods for MRD assessment, including the discovery of tumor-specific biomarkers (e.g., gene signatures) that complement traditional genomic profiling. However, the field faces unresolved controversy over which molecular markers or platforms (e.g., genomics, transcriptomics, or multi-omics assays) offer optimal reliability for clinical deployment, with debates centering on technical reproducibility, tumor heterogeneity, and real-world predictive validity [15]. To address these gaps, future efforts must prioritize biomarker standardization and cross-platform validation, ensuring MRD-driven strategies can meaningfully guide therapeutic escalation or de-escalation beyond current empirical approaches.
Gene expression profiling has become a cornerstone of precision oncology, enabling systematic interrogation of transcriptional programs that drive tumor behavior and inform clinical decision-making. This technology quantifies tumor-specific messenger RNA (mRNA) levels—dynamic molecular signatures reflecting the activation state of genes governing hallmark oncogenic processes (proliferation, invasion, immune evasion, angiogenesis). This approach deciphers the functional “activity map” of tumors, identifying dysregulated pathways that may serve as biomarkers for risk stratification, therapeutic targeting, or monitoring [16,17]. Prioritizing functional genomic analysis of breast cancer-specific genes—particularly those hyperactive ones as quantified through MRD scoring—could enable the development of a dynamic, tumor-derived signature for breast cancer, offering improved resolution reflective of tumor activities compared to static DNA sequences.
This study sought to functionally characterize tumor-associated overactive biomarkers driving pathway dysregulation in breast cancer, with the dual goal of identifying an actionable MRD panel and prognostic classifiers. Leveraging a plasma transcriptomic profiling framework, we systematically correlated tumor tissue with liquid biopsy profiles and clinical parameters to pinpoint critical drivers for MRD monitoring. Our stepwise methodology harmonized (i) circulating cell-free mRNA (cfmRNA) profiling, (ii) patient-derived gene signatures, and (iii) computational pipelines to dissect molecular disparities of MRD between high- versus low-activity breast cancer subtypes.
The biomarkers in the newly discovered OncoMRD BREAST panel demonstrated significant predictive power for MRD status and represent tractable targets for dual diagnostic–therapeutic exploitation. By linking transcriptional activity to malignant phenotypes, the OncoMRD BREAST assay bridges gene signatures and clinical practice, offering a path forward for personalized diagnostic and therapeutic strategies.
2. Materials and Methods
2.1. Sample Processing and RNA Extraction
The matched tissue and blood specimens were obtained from commercial suppliers, including iSpecimen (Lexington, MA, USA), Discovery Life Sciences (Huntsville, AL, USA), and Precision for Medicine (Carlsbad, CA, USA). Details of the paired tissue and blood specimens were reported previously [18,19,20,21]. Peripheral blood (10 mL/patient) collected in EDTA tubes underwent centrifugation (1100× g, 10 min) within 1 h of collection to separate the cell-free portion (i.e., plasma). Plasma aliquots were then double-centrifuged (16,000× g, 10 min) and cryopreserved at −80 °C. Cell-free mRNA was extracted from 400 μL of plasma (single freeze–thaw cycle) using MagMAX™ Viral/Pathogen Nucleic Acid Isolation Kit (Thermo Fisher Scientific, Waltham, MA, USA). Formalin-fixed, paraffin-embedded (FFPE) tumor tissues (median tumor content: 77.5%; all >50% tumor nuclei confirmed by pathology) were sectioned at 10 μm of thickness. FFPE-derived RNA was isolated from five consecutive sections using MagMAX™ FFPE DNA/RNA Ultra Kit (Thermo Fisher Scientific, Waltham, MA, USA). All extractions utilized the KingFisher™ Duo Prime Purification System (Thermo Fisher Scientific, Waltham, MA, USA). RNA quantification employed Qubit™ RNA HS Assay Kit on Qubit™ 2.0 Fluorometer (Thermo Fisher Scientific, Waltham, MA, USA). Quality control of fragment size distribution analysis was performed on Agilent 2100 Bioanalyzer using RNA 6000 Pico kit (Agilent Technologies, Santa Clara, CA, USA) with DV200 reported as percentage of fragments > 200 bp.
2.2. Overexpressed Biomarker Identification and Validation
Double-stranded cDNA was synthesized from 1 μg of total RNA using NEBNext First/Second Strand Synthesis Kit (New England Biolabs, Ipswich, MA, USA). Targeted plasma transcriptomics employed nine TaqMan arrays covering 750 cancer-associated genes across key pathways, which was performed as described previously [18,19]. Breast cancer-specific hyperactive genes were selected as the core OncoMRD BREAST biomarkers. Hierarchical clustering analysis was used to group The Cancer Genome Atlas (TCGA) breast cancer cohort into differential expression patterns. The cut-off criterion for statistically significant overexpressed genes was determined as |log2FC| > 1 and p value < 0.05. The top up-regulated genes were drawn using the heatmap package. TCGA breast invasive carcinoma cohort was used for the validation of selected OncoMRD BREAST biomarkers. Patients were classified into the altered or unaltered groups according to the expression levels of OncoMRD BREAST biomarkers. The clinicopathological metrics of each patient in the TCGA cohort were then statistically evaluated in these two groups. The same analyses were conducted to validate the utility and validity of the novel OncoMRD BREAST gene signature, including microsatellite instability (MSI), fraction of altered genome, tumor break load, and hypoxia, as well as clinically relevant genomic alterations.
2.3. Functional Enrichment GO and KEGG Analysis
Functional enrichment analysis of OncoMRD BREAST biomarkers was performed using ShinyGO, a graphical gene-set enrichment tool for gene annotation and pathway discovery [22]. Gene Ontology (GO) defined biological attributes of high-throughput genomic data, while Kyoto Encyclopedia of Genes and Genomes (KEGG) identified functional pathways. Statistical significance required p < 0.05 and a false discovery rate (FDR) of <0.05. The protein–protein interaction networks of selected OncoMRD BREAST biomarkers were analyzed using STRING 12.5 database (http://string-db.org; accessed on 8 November 2024). Hub genes were identified via the Network Analyzer plugin based on node degree connectivity. Molecular complexes were detected using MCODE (score > 10 threshold), with the highest-scoring module selected for pathway enrichment. p < 0.05 and FDR < 0.05 were considered statistically significant.
2.4. Correlation of Gene Expression
Gene expression correlation analysis was performed using GEPIA2 [23], a web portal leveraging TCGA and GTEx tumor/normal transcriptomic data. GEPIA2 expands expression analysis to 198,619 isoforms across 84 cancer subtypes, enabling transcript-level quantification and subtype-specific comparisons in gene-to-gene and signature-to-signature modes. It incorporates single-cell-inspired gene signature scoring and supports custom RNA sequencing data integration with TCGA/GTEx references. Pearson, Spearman, or Kendall correlation can be selected for analysis. A p-value of <0.05 threshold suggests that the correlation is statistically significant.
2.5. The OncoMRD BREAST Scoring Algorithm
OncoMRD BREAST is built on a panel of hyperactive biomarkers in breast cancer to generate a personalized OncoMRD BREAST score for MRD monitoring. The system employs crucial biomarkers in major cancer pathways, such as DNA repair, cell surface markers, transcription factors, and tumorigenesis, among others. Gene expression data from all biomarkers are collected and processed by proprietary analytics, which normalizes and calculates the OncoMRD BREAST score, based upon counts of the detected biomarkers, gene expression levels, and the relevance weight of these biomarkers. A score of 0–10 indicates undetected MRD, whereas scores of >15 represent positive MRD. The scores in between suggest insignificant MRD.
2.6. The Proof-of-Concept Clinical Study
A total of six patients were selected for MRD analysis. The median age of the patients in this study was 48 years (range, 18–60). Four patients have early-stage disease, and two patients are in advanced stage of breast cancer. Somatic mutation status was established at baseline using NGS on FFPE tissues. Longitudinal blood samples were collected and processed for targeted sequencing, CTC enumeration, and CA 15-3 measurement, in addition to OncoMRD BREAST testing. Standard therapeutic response was evaluated 12 weeks post-surgery by PET/CT imaging and categorized into Complete Response (CR), Partial Response (PR), Stable Disease (SD), and Progressive Disease (PD) based on the RECIST (Response Evaluation Criteria in Solid Tumors) system.
Targeted sequencing of frequently mutated genes of high clinical relevance in breast cancer was performed on a 68-gene panel, as reported previously [20]. Briefly, targeted regions were enriched through two cycles of hybridization capture. Following enrichment, libraries were PCR amplified, purified using sample purification beads, and quantified via Qubit fluorometry and TapeStation electrophoresis (D1000 Screen Tape). Bead-based normalization was applied to the enriched libraries before pooling to ensure equimolar representation. Finally, pooled libraries were sequenced on an Illumina NextSeq (San Diego, CA, USA) employing a high-output 300-cycle kit according to the manufacturer’s instructions.
Blood collection and CTC quantification followed the FDA-cleared CellSearch protocol [24]. Patient CTC status (negative/positive) was determined using the cutoff of ≥5 CTCs for metastatic disease. CA 15-3 test and PET/CT imaging were part of routine laboratory and radiology assessment in patients with metastatic breast cancer.
3. Results
3.1. Identification and Validation of Hyperactive OncoMRD BREAST Biomarkers
We have previously conducted comprehensive plasma transcriptomic profiling to identify cancer-type-specific cell-free mRNA (cfmRNA) biomarkers, characterized by functional clustering of cfmRNA species, differential transcript abundance, global cfmRNA expression patterns, and unique cfmRNA signatures distinguishing different cancers [18,19]. The liquid biopsy approach could transform patient-derived gene expression data—including cancer type, pathway activity, and biomarker levels—into actionable MRD insights, empowering clinicians to make data-driven treatment decisions with greater efficiency and confidence. In this study, we aimed to apply breast cancer-specific cfmRNA biomarkers to individual patients to establish personalized gene overexpression profiles for residual disease monitoring as the OncoMRD BREAST assay.
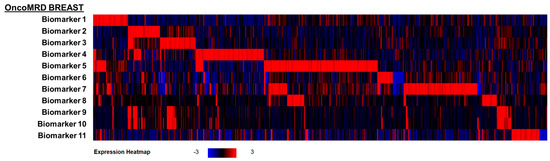
To independently validate the OncoMRD BREAST biomarkers, we first applied these biomarkers to the largest gene expression dataset of the invasive breast carcinoma cohort in the TCGA PanCancer Atlas (n = 1082; Figure 1). A differential gene expression analysis revealed excellent breast cancer patient classification powers by these OncoMRD BREAST biomarkers, in which all biomarkers were highly enriched in this cohort. The findings here not only bridge the gap from liquid biopsy to tumor tissues but also confirm the clinical validity of these OncoMRD BREAST biomarkers.
Figure 1.
Heatmap visualization of differential expression profiles of the OncoMRD BREAST biomarkers in 1082 invasive breast carcinoma patients from TCGA PanCancer Atlas. Log2-transformed changes in gene expression levels were calibrated to normal diploid controls. The red brackets signify biomarkers that showed overexpression in the corresponding breast cancer patients.
3.2. Association of OncoMRD BREAST Gene Signature with Tumor Activity
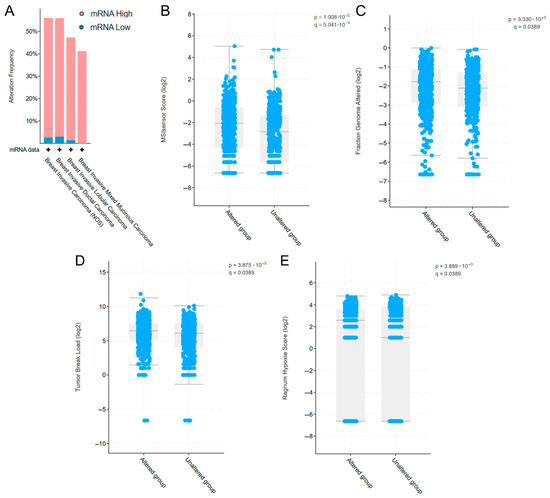
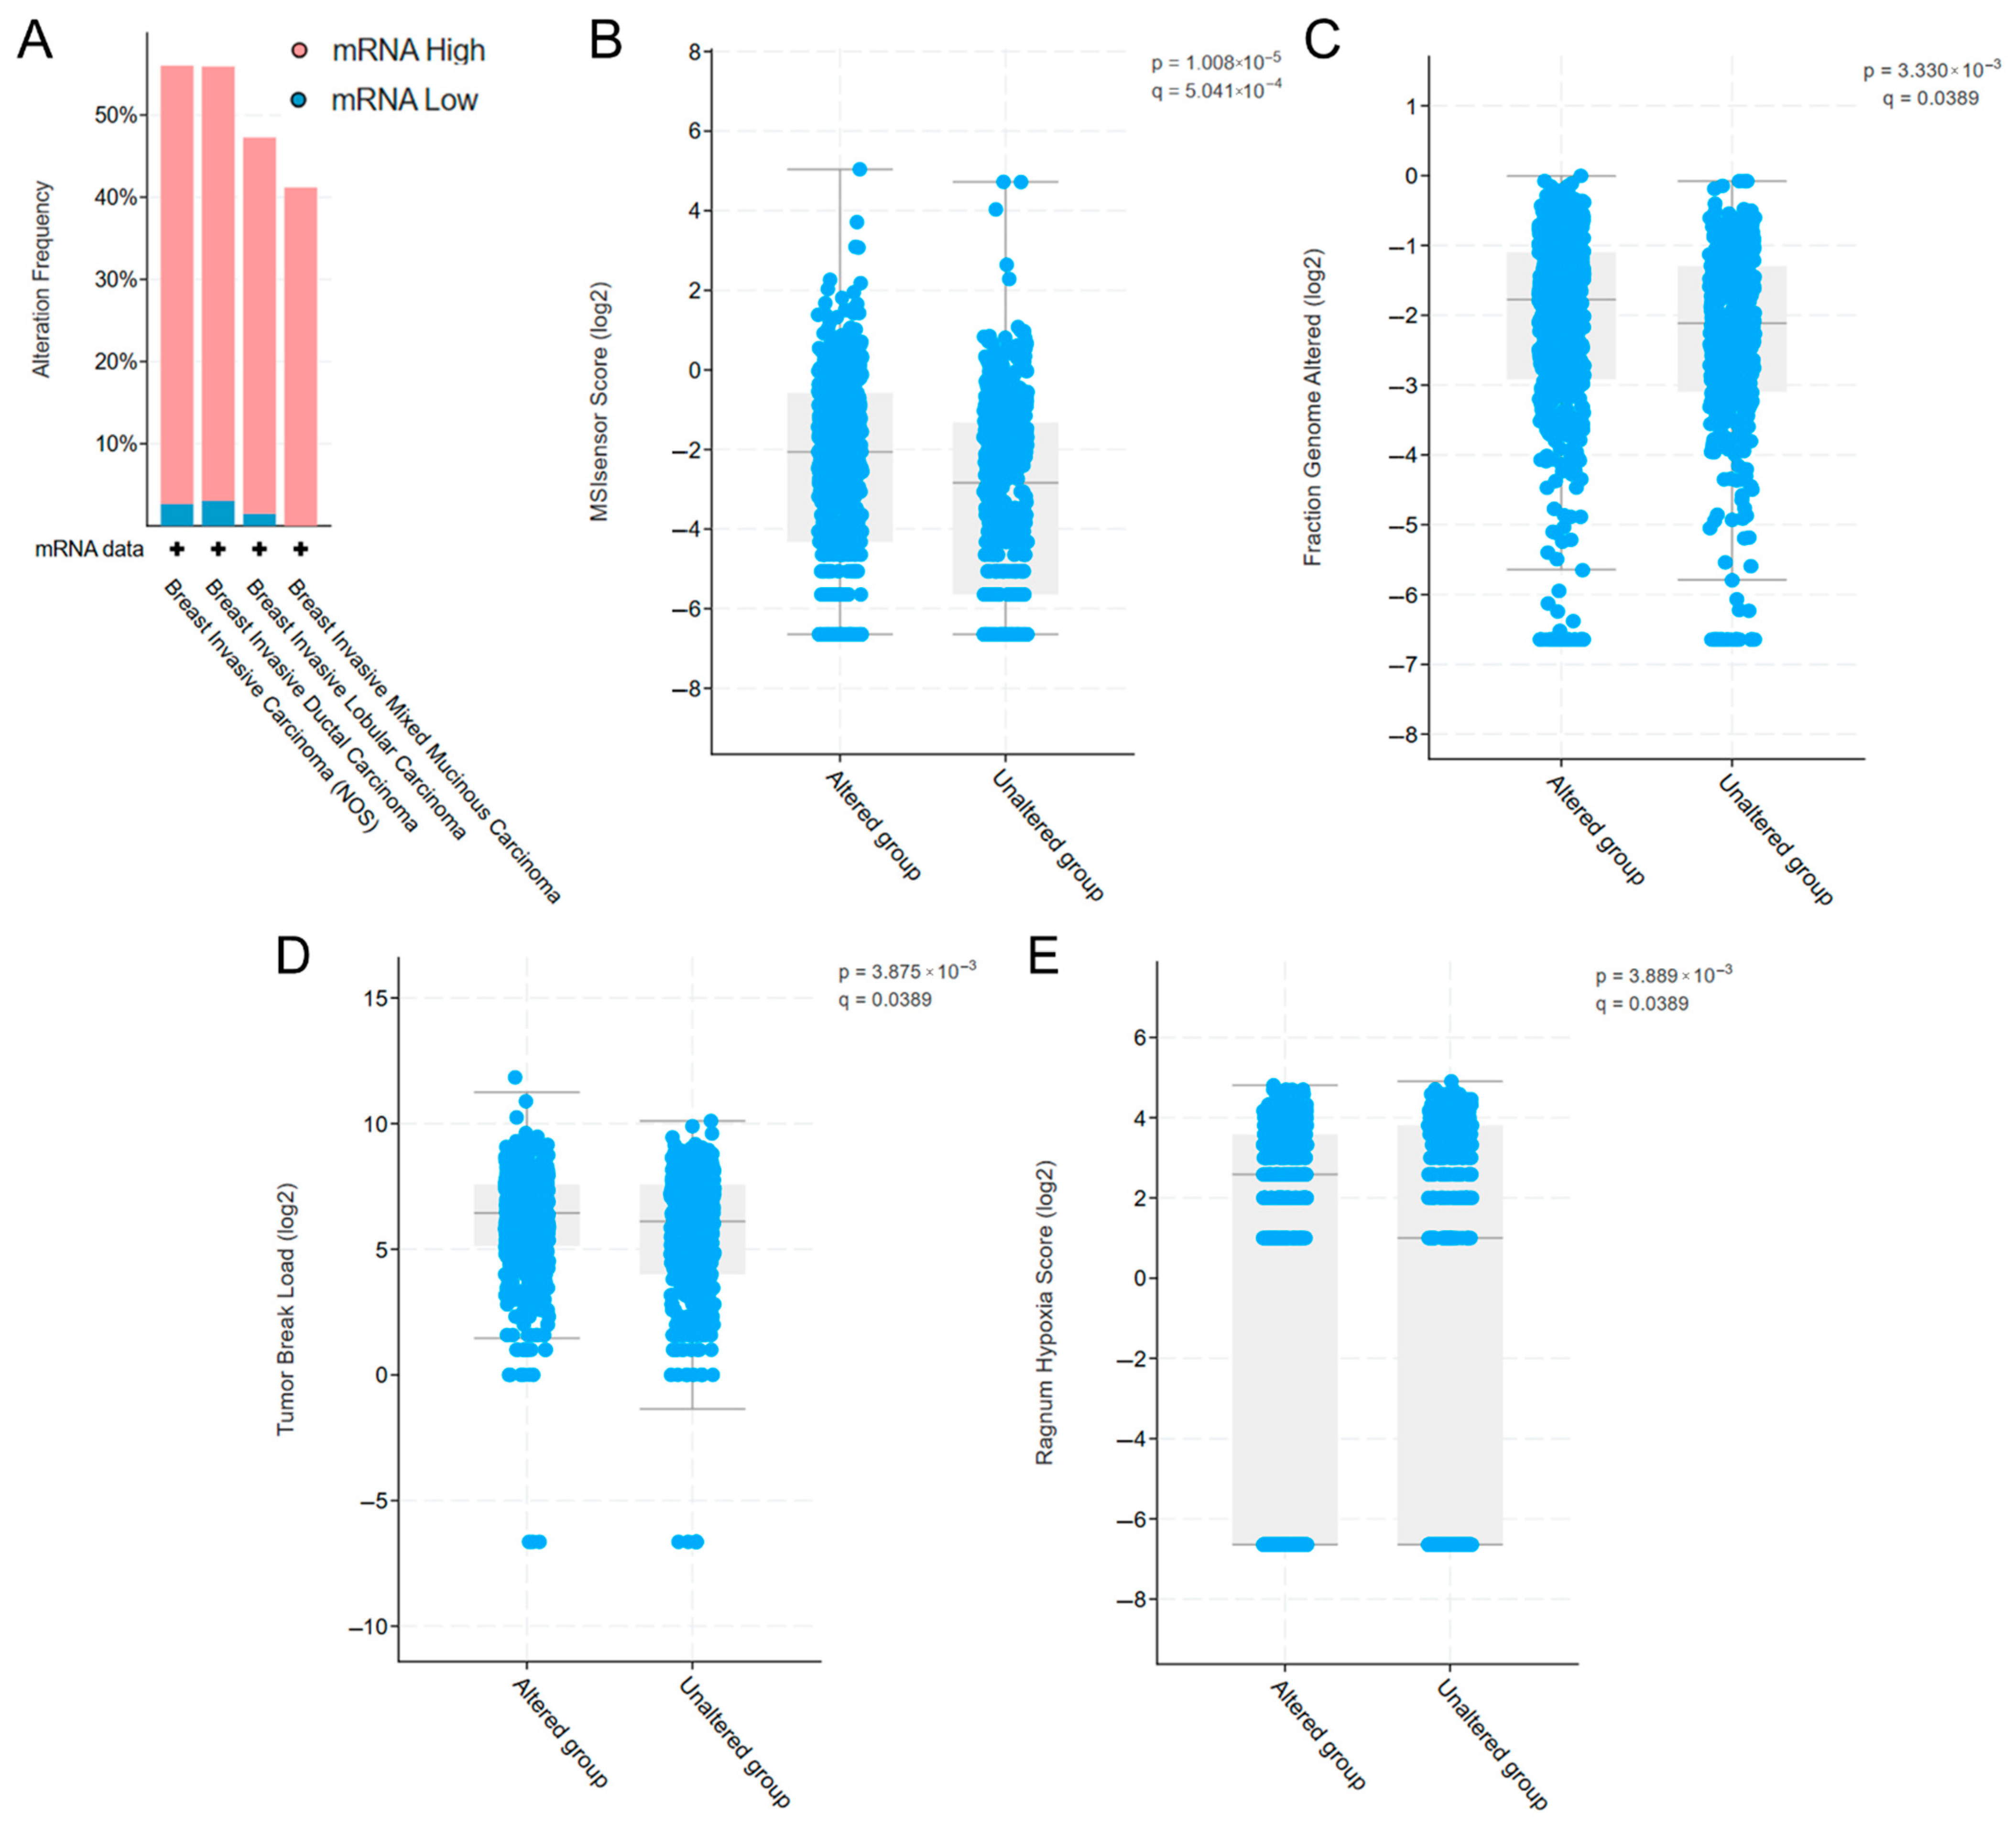
The OncoMRD BREAST panel employs crucial biomarkers in major cancer pathways, such as DNA repair, cell surface markers, transcription factors, and tumorigenesis, among others. We thus assessed OncoMRD BREAST biomarkers by analyzing their expression patterns in tumor samples from the TCGA database. Consistent with expectations, the OncoMRD BREAST gene signature was overexpressed in 40–60% of tumors from 1082 breast cancer patients in TCGA (Figure 2A). Further analysis within the same patient cohort revealed statistically significant correlations between biomarker overexpression and four key tumor features: microsatellite instability (MSI) score (p < 0.001; Figure 2B), fraction of altered genome (p = 0.0033; Figure 2C), tumor break load (p = 0.0039; Figure 2D) and hypoxia score (p = 0.0039; Figure 2E). The association with tumor activities suggested that the OncoMRD BREAST gene signature may capture overactive signals from both tumor and non-tumor microenvironment, enhancing detection sensitivity and specificity—a critical feature for MRD measurement in clinical settings.
Figure 2.
Validation of the OncoMRD BREAST gene signature for residual tumor monitoring. (A) The overexpression frequency of OncoMRD BREAST biomarkers in breast cancer subtypes from the TCGA database (1082 samples). Significant association of the OncoMRD BREAST gene signature with MSI score (B), fraction of altered genome (C), tumor break load (D), and hypoxia score (E) in the TCGA PanCancer database (1082 breast cancer patients).
3.3. Strong Correlation Between OncoMRD BREAST Gene Signature and Genomic Alterations
The DNA-based next-generation sequencing (NGS)-powered WGS, widely used by the industry, is an MRD platform designed for capturing tumor-specific somatic mutations. Somatic mutations within protein-coding sequences disrupt not only the function of the encoded protein but also propagate perturbations across interconnected networks of genes and cellular pathways. These cascading effects enable a more nuanced understanding of genotype–phenotype relationships than analyses limited to isolated molecular layers. We reasoned that mutations exert systemic transcriptional influence, imprinting detectable expression changes in functionally linked genes that could hold clinical relevance. To explore this, we sought to evaluate the relationship of the OncoMRD BREAST gene signature with key somatic driver mutations in breast cancer to further demonstrate the clinical utility of OncoMRD BREAST for residual disease follow-up.
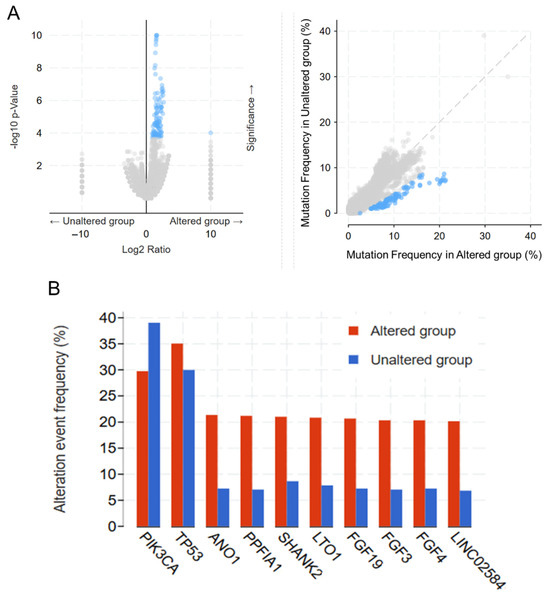
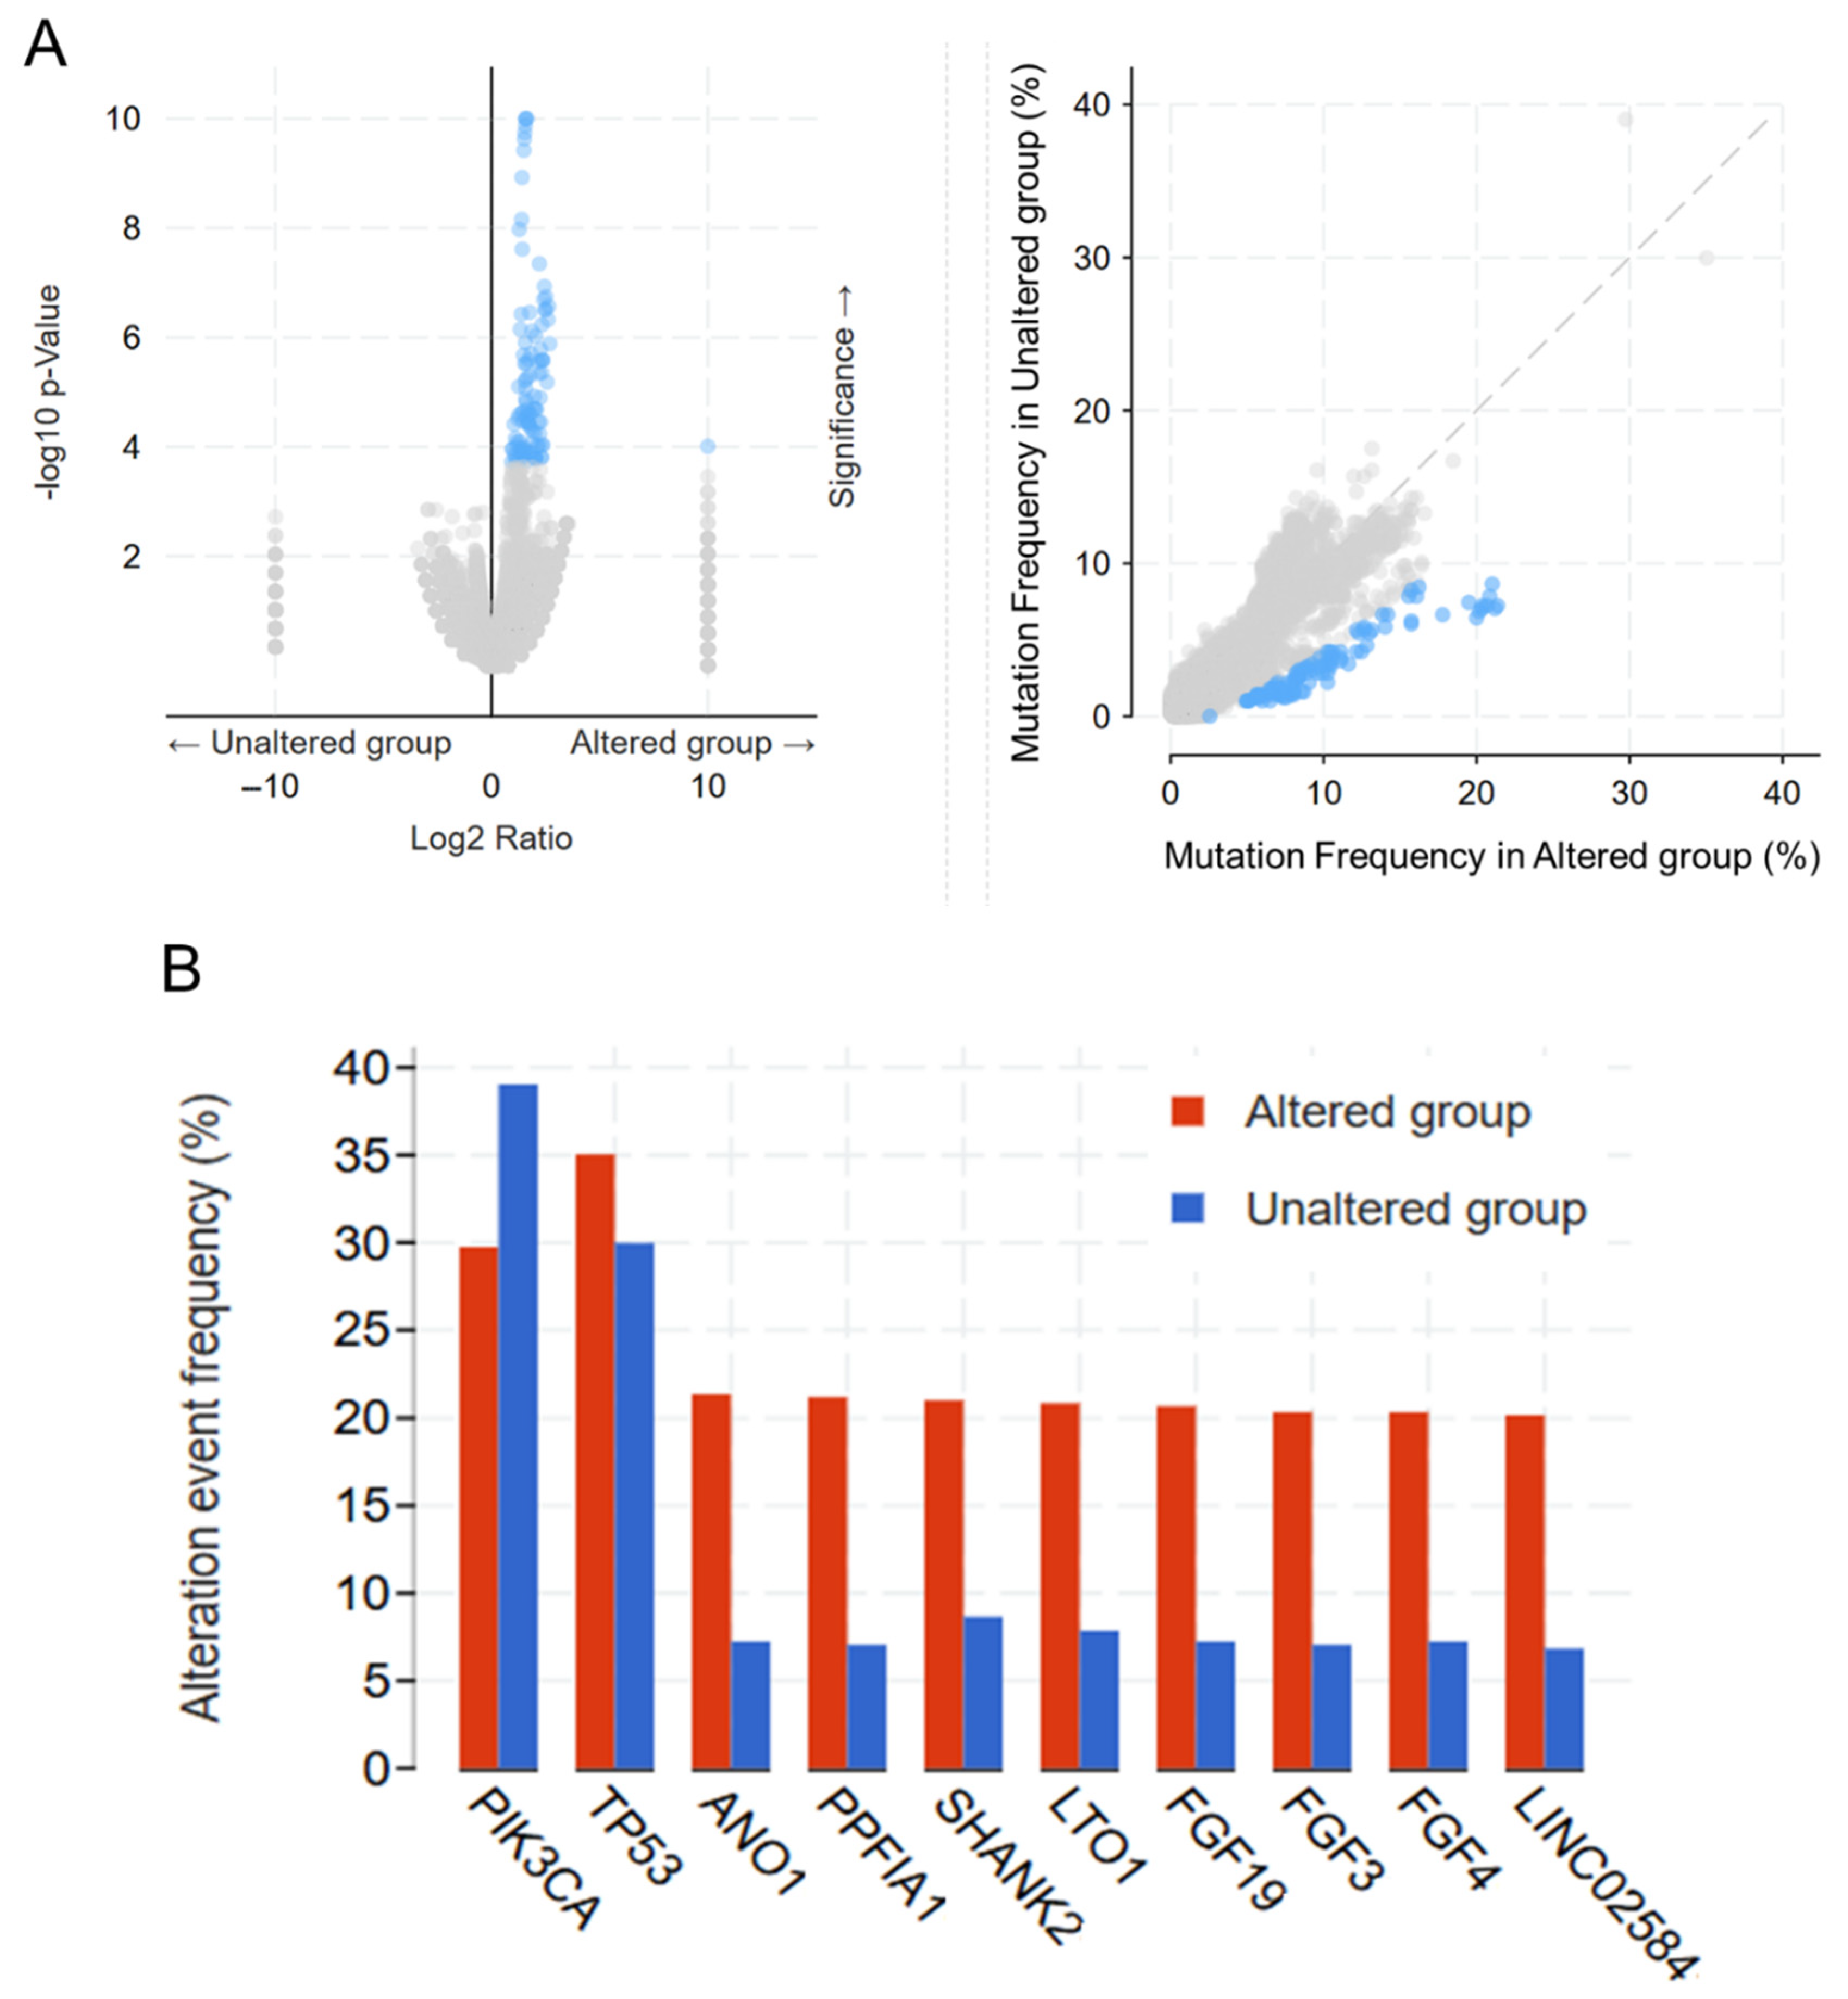
Based on the transcriptomic and tumorigenic properties of the OncoMRD BREAST gene signature, we next evaluated the correlation between somatic alterations and the signature in the TCGA cohort. When the mutation frequencies of the most frequently mutated genes in breast cancer were compared between the unaltered (diploid control) and altered groups (OncoMRD BREAST gene overexpression), we found that the OncoMRD BREAST gene signature significantly associated with higher mutation frequencies across various mutation types, including missense, nonsense, frameshift, deletion, insertion, structure variants, and copy number alterations (Figure 3A,B). In breast cancer, PIK3CA and TP53 rank among the most commonly mutated genes, with their alterations strongly linked to aggressive tumor behavior and adverse clinical outcomes [25]. Concurrently, recurrent genomic amplification and overexpression of ANO1, PPFIA1, SHANK2, LTO1, and LINC02584 are frequently observed in breast tumors; these aberrations are implicated in disease progression and serve as independent predictors of poor prognosis [26,27,28,29,30]. Additionally, dysregulation of the fibroblast growth factor (FGF)/FGF receptor signaling axis—a hallmark of estrogen receptor-positive (ER+) breast cancer subtypes—drives tumor evolution, fosters therapy resistance, and correlates with diminished survival [31]. By analyzing gene expression and mutation data, we have identified the OncoMRD BREAST gene signature reflecting the best characteristics of breast cancer-associated somatic mutations in multiple TCGA cohorts. The OncoMRD BREAST gene signature is, therefore, clinically relevant in MRD surveillance.
Figure 3.
Association between the OncoMRD BREAST gene signature and the frequency of key somatic mutations in breast cancer. A significant correlation was illustrated by a volcano, a scatter plots (A), and a bar graph (B).
3.4. Gene Expression Correlation Between OncoMRD BREAST Biomarkers and Key Breast Cancer-Associated Genes
Gene co-expression analysis offers a powerful strategy for inferring gene function, leveraging the principle that genes participating in shared biological processes are often transcriptionally coordinated. To gain insight into the biochemical mechanisms by which OncoMRD BREAST gene signature faithfully represents tumor activity, we further examined the co-expression relationship of OncoMRD BREAST biomarkers and several key genes associated with breast cancer using tumor samples from the TCGA and the GTEx databases. The analysis results revealed significant positive co-expression correlations between the two gene sets, as displayed by a pair of gene-wide correlation values (Pearson’s R and associated p-value; Table 1).
Table 1.
Gene expression correlation between seven representative OncoMRD BREAST biomarkers and clinically relevant breast cancer genes.
Interestingly, this analysis revealed the top co-expressed genes are BRCA1, BRCA2, ATM, ESR1, and PIK3CA, genes which are often mutated in breast cancer and which play a role in breast cancer development, pathology, and progression. BRCA1 and BRCA2, critical guardians of genomic stability through DNA repair mechanisms, correlate with distinct breast cancer subtypes and clinical outcomes. ATM is a master regulator of DNA damage response, and PIK3CA acts as a central kinase driving oncogenic PI3K-AKT-mTOR signaling. ESR1—the cornerstone of hormone-driven breast malignancies—encodes the estrogen receptor, with acquired mutations in this gene frequently undermining therapeutic efficacy by conferring resistance to endocrine therapies [32]. Although fewer OncoMRD BREAST biomarkers were positively correlated with ERBB2 and CDK4 expression, overall, the OncoMRD BREAST gene signature displayed a good representation of breast cancer pathogenesis, involving both tumor and non-tumor microenvironment. In this respect, the OncoMRD BREAST assay is well-suited to employ patient-unique gene signatures from multi-spectral biomarkers to provide sensitive detection, identification, quantification, and tracking of MRD.
3.5. Correlation Between Tumor Clinicopathological Parameters and Expression of OncoMRD BREAST Biomarkers
In this study, we further evaluated the relationship of 10 representative OncoMRD BREAST biomarkers with clinicopathological features of breast cancer in the TGCA cohorts (n = 1082; Table 2). In the analysis of mutation count and tumor mutational burden (TMB), we found that expression of the same seven (7/10) biomarkers was highly correlated with both parameters (p < 0.0001). The association with hypoxia and MSI scores was also similarly high in 7/10 biomarkers of distinct classes (p < 0.0001). Tumor break load, progression-free, and overall survival were found to be each correlated with five OncoMRD BREAST biomarkers (p < 0.05). Interestingly, the same set of biomarkers was detected with the highest correlation with patient survival. Across the board, each representative biomarker correlated strongly with at least one clinicopathological feature of breast cancer, demonstrating the OncoMRD BREAST’s clinical validity. It is worth mentioning that 8/10 representative biomarkers (80%) displayed significant correlation with at least four clinicopathological characteristics of the tumor. Overall, we believe that breast cancer activities could be faithfully represented and recapitulated by the OncoMRD BREAST assay.
Table 2.
Correlation between tumor clinicopathological parameters and expression of 10 representative OncoMRD BREAST biomarkers.
3.6. Gene Ontology Term Enrichment and Kyoto Encyclopedia of Genes and Genomes (KEGG) Pathway Analyses of OncoMRD BREAST Gene Signature
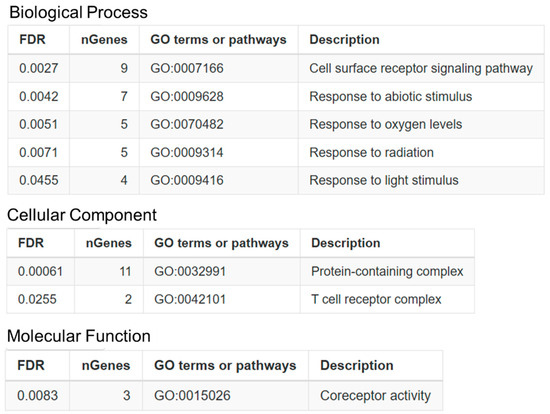
To further unravel the function of the OncoMRD BREAST gene signature, it was investigated through gene ontology (GO) enrichment analyses and Kyoto Encyclopedia of Genes and Genomes (KEGG) pathway analyses. GO and KEGG analyses of OncoMRD BREAST genes were performed by using ShinyGO v.0.82, a graphical gene-set enrichment tool [22]. The OncoMRD BREAST gene panel was classified into biological processes, cellular components, and molecular functions. The top GO enrichment analysis results are shown in Figure 4. These genes were mainly enriched in the cell surface receptor-signaling pathway and responders to abiotic, oxygen, radiation, and light stimuli. The cellular component analysis demonstrated that the gene signature was significantly enriched in protein-containing complexes and T cell receptor complexes. In addition, molecular function classification showed that the panel genes were enriched in coreceptor activity.
Figure 4.
Gene ontology analysis of OncoMRD BREAST gene signature. Functional enrichment analyses of biological process, cellular component, and molecular function were performed using STRING pathway database. FDR, False Discovery Rate; GO, Gene Ontology.
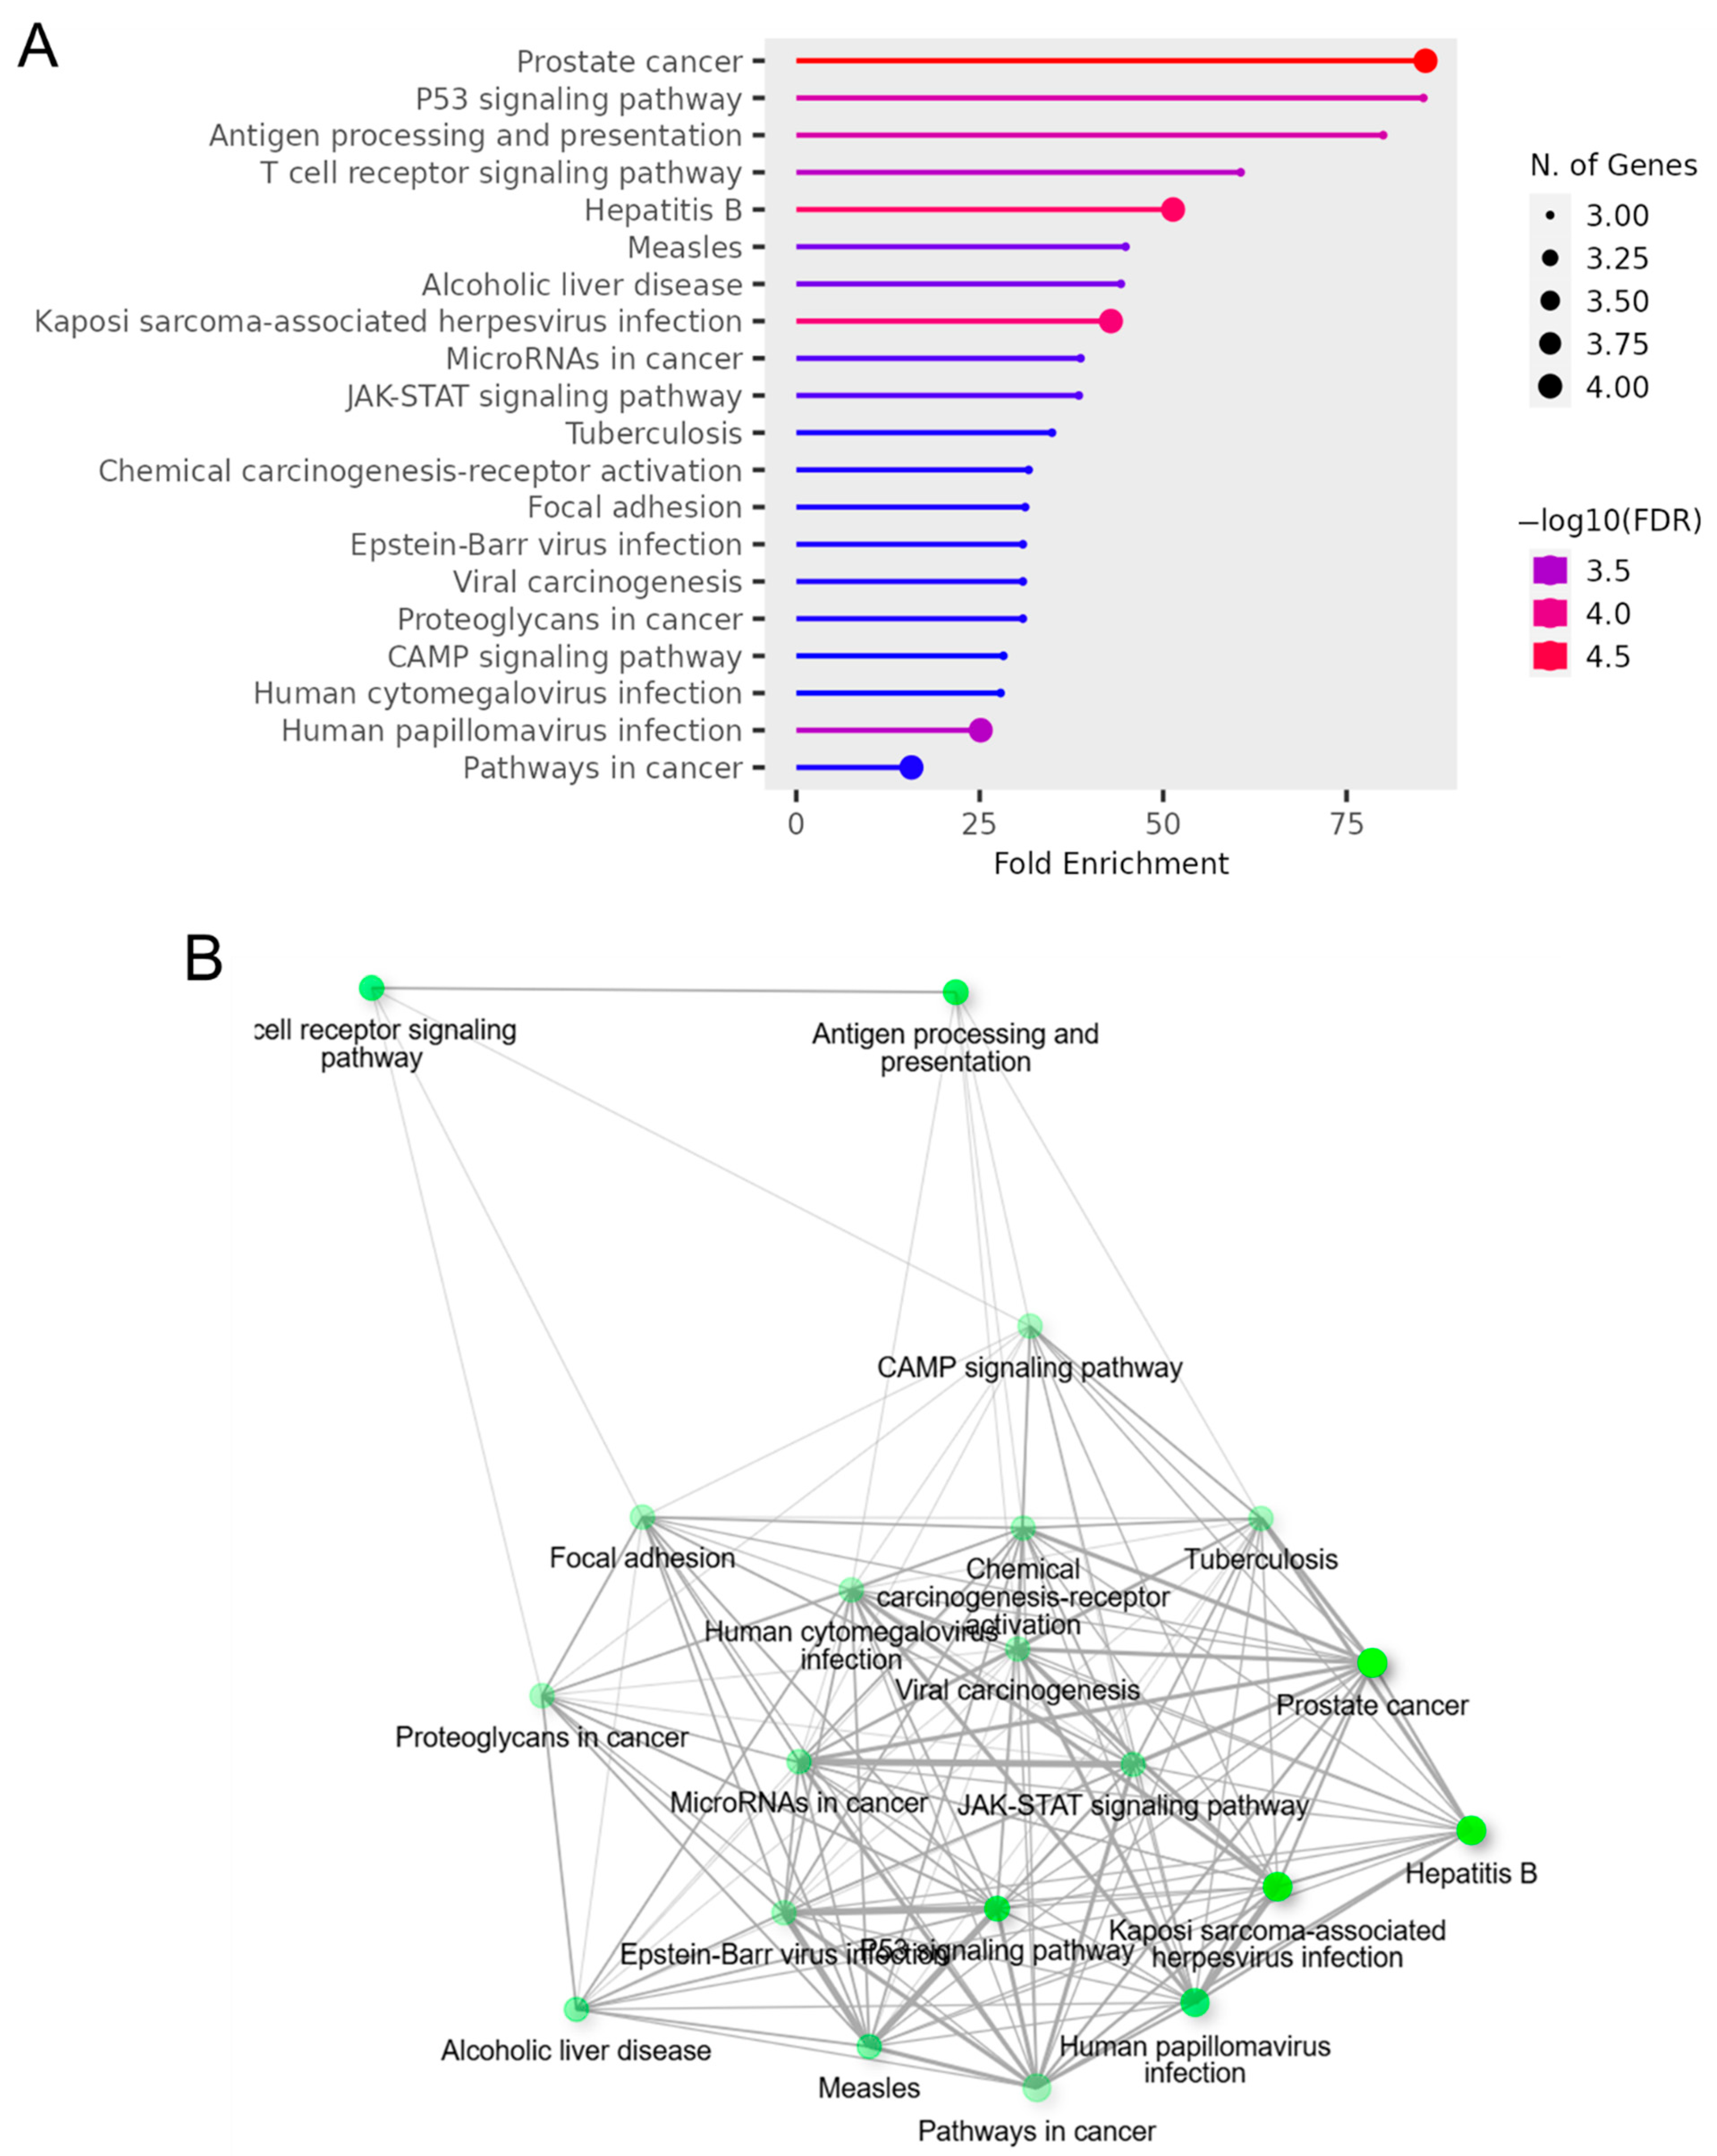
Figure 5 shows the significant enrichment pathways of the OncoMRD BREAST gene signature analyzed by KEGG. The panel was significantly enriched in prostate cancer, the TP53-signaling pathway, antigen processing and presentation, and the T cell receptor-signaling pathway. From the perspective of the KEGG pathways, the gene signature was closely associated with cancer immune response and viral signaling events, indicative of tumor and non-tumor microenvironment activities. Breast cancer, one of the most aggressive malignancies affecting women, is a highly heterogeneous disease with distinct molecular subtypes. Each subtype exhibits unique biological features and clinical behaviors. The OncoMRD BREAST gene signature tightly corresponds to the broad and dynamic activity of breast cancer, which could serve as a novel, unprecedented, and invaluable tool for MRD.
Figure 5.
KEGG pathway enrichment analysis of OncoMRD BREAST gene signature. (A) The x-axis represents fold enrichment, and y-axis represents KEGG terms. The size of circle represents biomarker count. Different colors of circles represent different adjusted p-values. KEGG, Kyoto Encyclopedia of Genes and Genomes. (B) The interactive network plot shows the relationship between enriched pathways. Two pathways (nodes) are connected if they share more than 20% of genes. Darker nodes are more significantly enriched gene sets. Bigger nodes represent larger gene sets. Thicker lines represent more overlapped genes.
3.7. OncoMRD BREAST Minimal Residual Disease Detection and Treatment Monitoring of Breast Cancer Patients
The current MRD detection landscape is approaching a consistent sensitivity threshold, with method selection heavily influenced by laboratory capabilities. Next-generation sequencing (NGS) provides a critical advantage: direct identification of pathological tumor mutations within sequencing data, enhancing sensitivity and specificity. CTC measurement by flow cytometry and the standard CA 15-3 test excel in facilities with established infrastructure, standardized instruments, and trained personnel, offering rapid “vein-to-brain” turnaround (hours). Collectively, these techniques offer complementary value—molecular biomarkers circumvent therapy-induced tumor destruction.
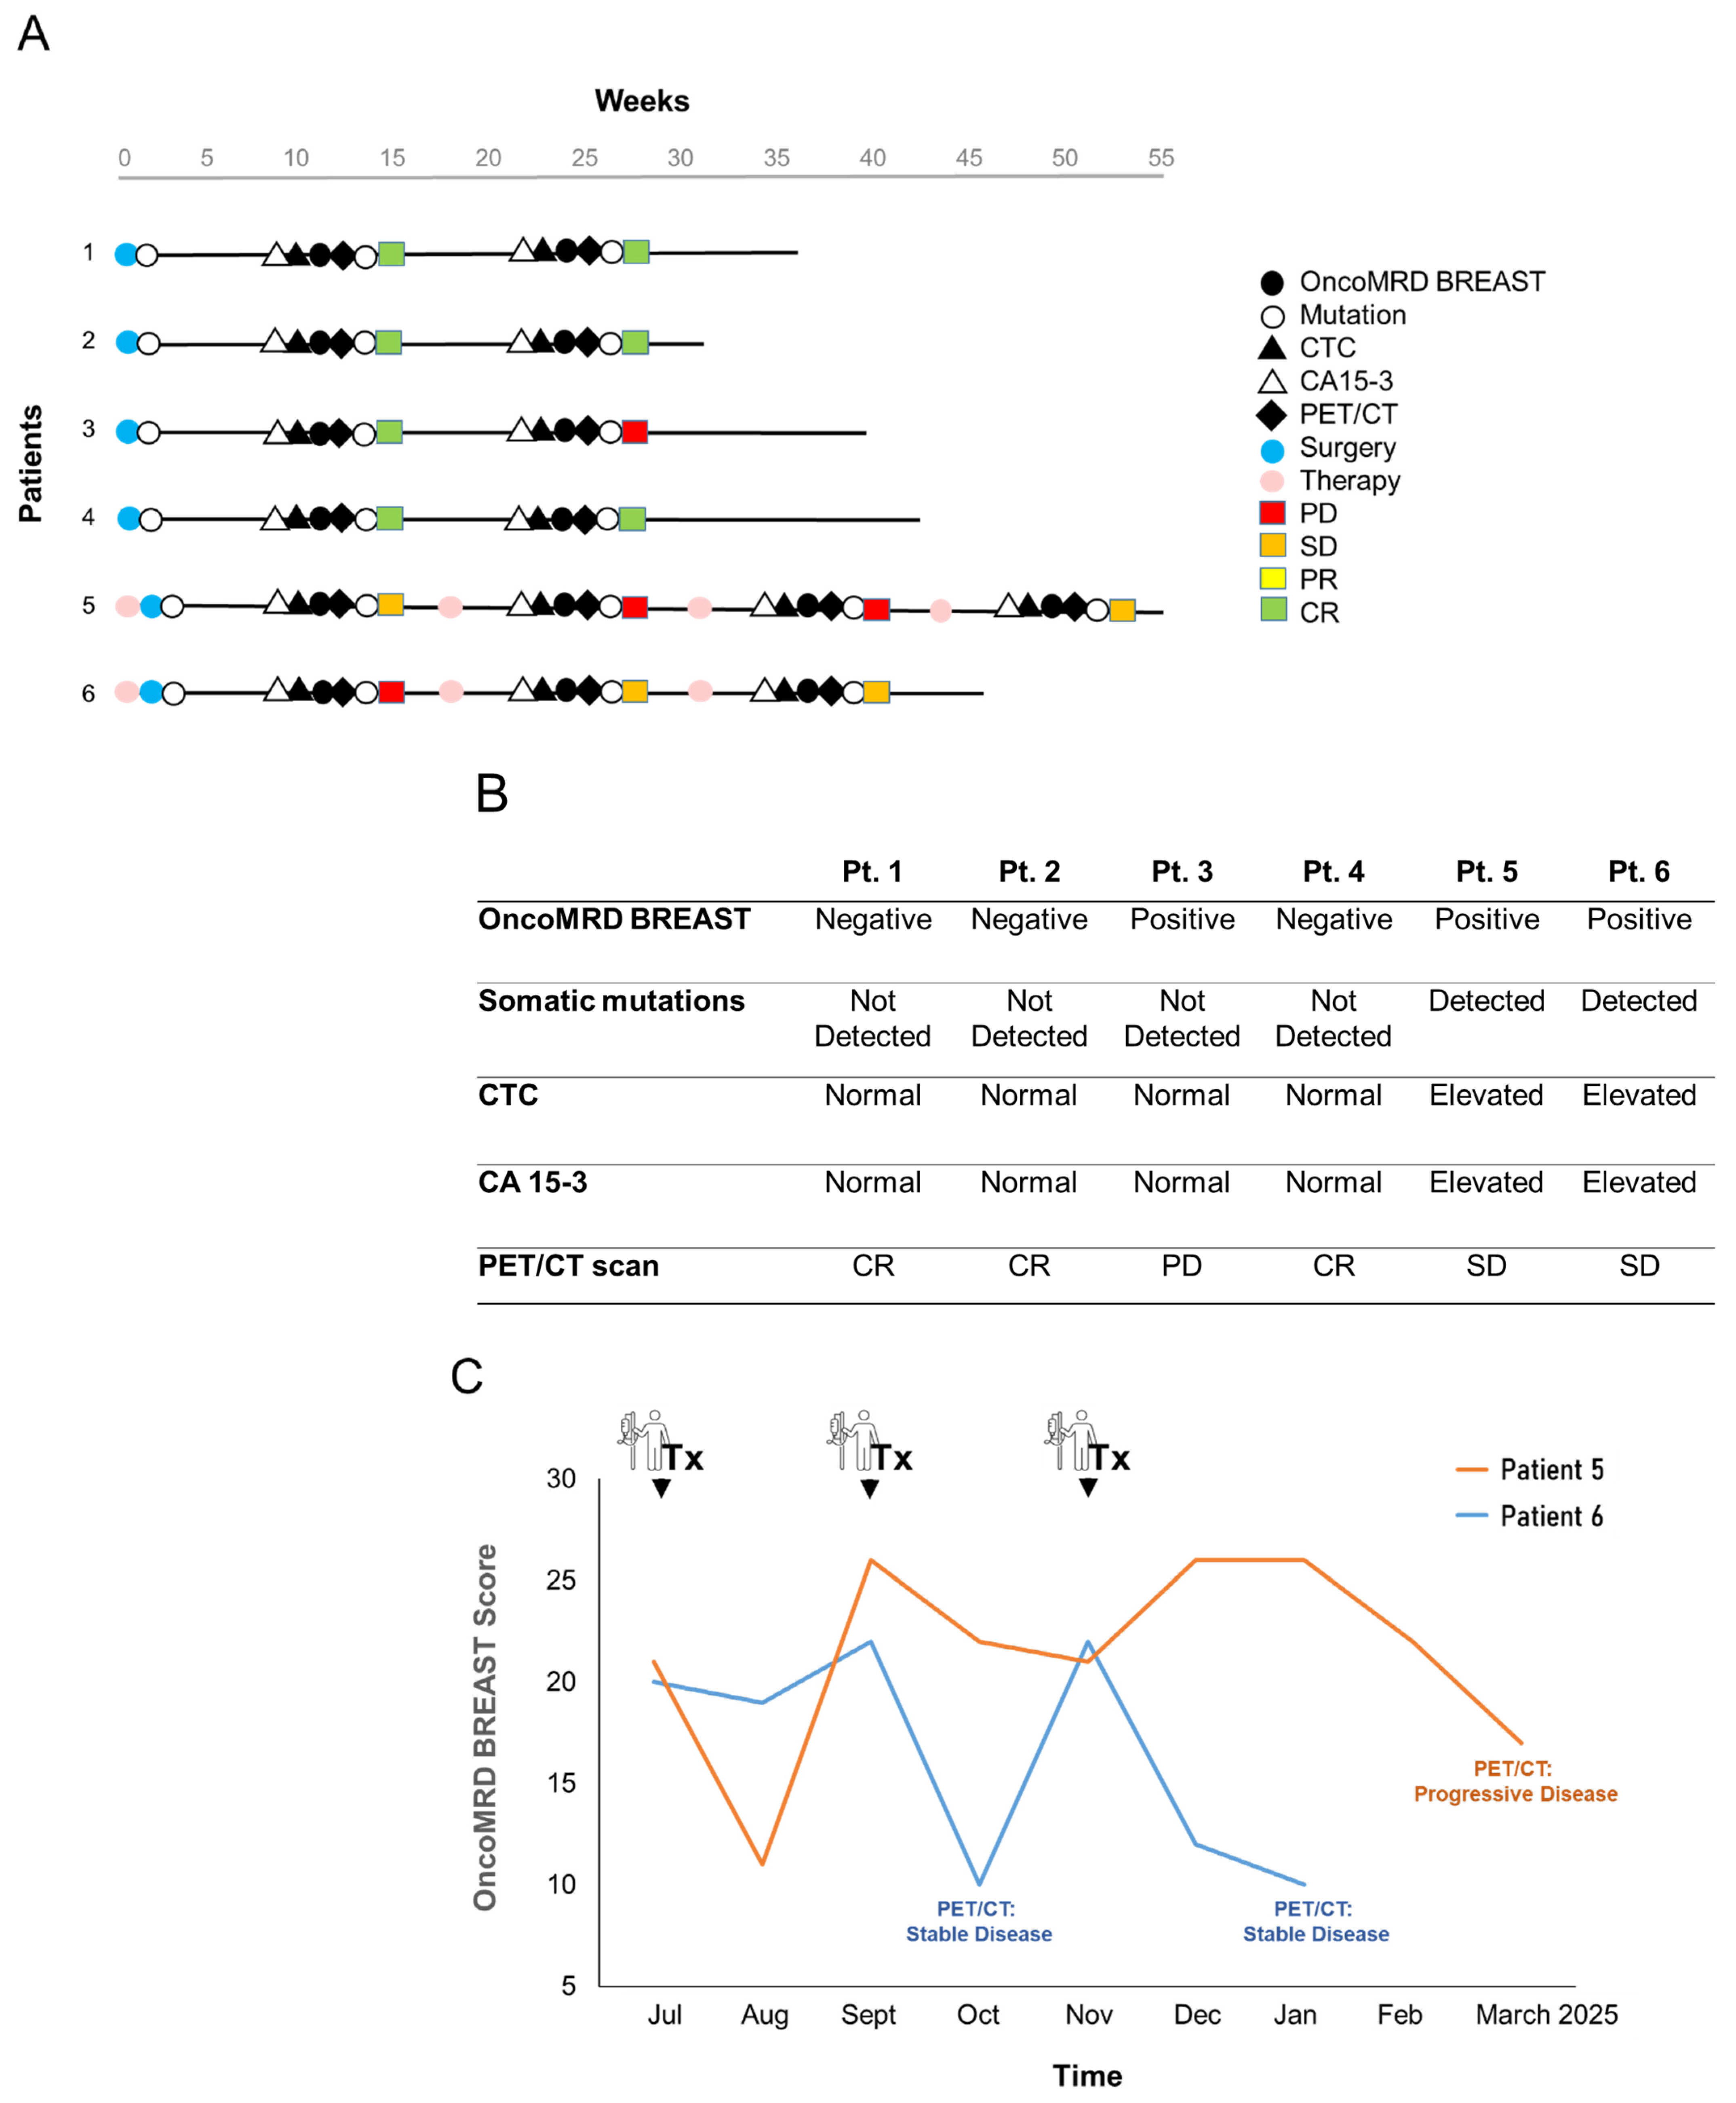
We next evaluated the performance of the OncoMRD BREAST test for MRD detection in six post-surgical breast cancer patients. The breast cancer patients were at diverse clinical stages (three at stage I, one at stage II, and two at stage IV with multiple metastases) and received radical surgery. Formalin-fixed paraffin-embedded (FFPE) tissues were available from all patients and were used to identify actionable tumor-specific mutations. Patient blood samples were also collected for CA 15-3 and CTC measurement. We did not detect actionable mutations in these patients, except for an ESR1 mutation in one patient at baseline. Positron Emission Tomography (PET)/Computed Tomography (CT) imaging was performed 12 weeks after surgery (Figure 6A).
Figure 6.
OncoMRD BREAST minimal residual disease detection and treatment monitoring in breast cancer patients. (A) Swimmer plot of six breast cancer patients. All patients received curative surgery. Patient blood samples were collected longitudinally post-surgery for measurement of OncoMRD BREAST scores, actionable mutations, CTC, and CA 15-3. Standard therapeutic response was categorized into Complete Response (CR), Partial Response (PR), Stable Disease (SD), and Progressive Disease (PD) based on the RECIST (Response Evaluation Criteria in Solid Tumors) system. (B) Comparison of different test performances in all six breast cancer patients. (C) Trending curves employing OncoMRD BREAST scores for the two advanced-stage breast cancer patients were shown. Blood-based OncoMRD BREAST test demonstrated comparable power to PET/CT for monitoring therapeutic responses.
While all tests yielded similar results for this cohort of patients, differences became apparent in a patient with a breast lumpectomy (patient # 3). NGS, CTC, and CA 15-3 testing did not yield any abnormality. In contrast, OncoMRD BREAST was found to be most sensitive, displaying an MRD positivity that later matched with PET/CT findings, and was particularly valuable for measuring samples of early-stage tumors. A total of 15 PET/CT scans from six patients were available within ±7 days of OncoMRD BREAST testing. The OncoMRD BREAST results were totally in agreement with the imaging interpretation (15/15; 100%) (Figure 6B). Overall, OncoMRD BREAST’s high sensitivity made it possible to accurately evaluate MRD for more patients than would have been possible with ctDNA sequencing alone. As a result, the study proposed guidelines on using OncoMRD BREAST in MRD monitoring to evaluate breast cancer patients, enabling doctors to make better-informed treatment decisions.
While most solid tumors are surgically resectable at primary diagnosis, a significant proportion of patients could eventually progress to radiographically evident metastases. Despite the advances in precision medicine, metastatic disease remains incurable and ultimately fatal for most patients. We further evaluated the OncoMRD BREAST assay as a therapeutic response tool by analyzing longitudinal samples from two metastatic breast cancer patients. This assay demonstrated a high concordance when compared with the standard PET/CT imaging in these two cases (Figure 6C). Since PET/CT is the current gold standard clinical method evaluated to demonstrate statistical association with treatment outcome in metastatic disease, our data support the feasibility and potential clinical utility of the OncoMRD BREAST assay to predict patient outcomes following adjuvant and maintenance therapy in breast cancer.
Overall, our results here substantiated the emerging role of OncoMRD BREAST as a valuable tool for the detection of MRD in patients with breast cancer. This proof-of-concept trial pioneered a paradigm shift toward OncoMRD BREAST test-driven precision therapy, tailoring interventions to a patient’s molecular response depth rather than mutational characteristics alone. Beyond evaluating the efficacy of single-agent and combination therapies, it critically demonstrated how OncoMRD BREAST assessment actively guides therapeutic decision-making, signaling the test’s imminent transition from research tool to routine clinical implementation for personalized treatment management.
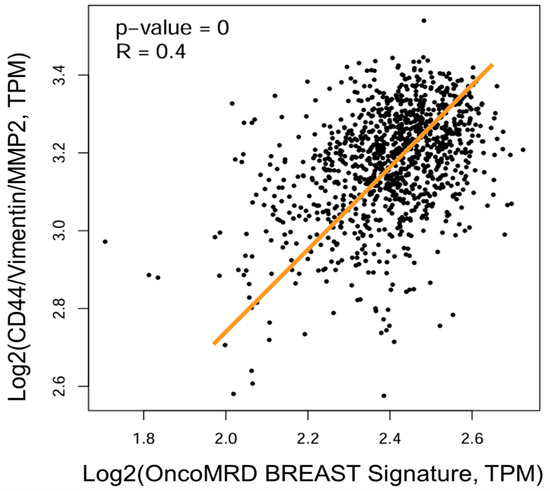
3.8. Strong Correlation of OncoMRD BREAST Gene Signature with a Key Gene Signature Associated with Residual Breast Tumors After Treatment
It has been demonstrated that residual breast cancer cells surviving targeted therapy enter a state of therapy-induced dormancy at local and distant sites, independent of angiogenic constraints or adaptive immunity. These dormant tumor-initiating cells (TIC) exhibit a conserved transcriptional signature distinct from primary/recurrent tumors—consistent across oncogene-driven breast cancer models and microenvironment-induced dormancy systems [33]. We further assessed the relationship between the OncoMRD BREAST gene signature and the residual breast cancer TIC gene signature. Using gene set vs. gene-set mode, we found a strong positive correlation between these two gene sets (Figure 7), demonstrating again the excellent predictive power of the OncoMRD BREAST gene signature in MRD surveillance. In comparing OncoMRD BREAST with existing ctDNA-based tools, we find that it is a significant improvement over current methods. Not only does it offer a novel approach representing “dynamic” tumor activity (other than the “static” DNA mutations), but it also provides residual cell functionality insights not found in other tools.
Figure 7.
Scatter plot showing the correlation of gene expression between OncoMRD BREAST gene signature and the residual breast cancer 3-gene signature. Data were presented as the log2-transformed RNA sequencing expression of TPM (Transcripts Per Million). The best-fit linear regression line was shown together with the R and p-values derived from Pearson correlation coefficient analysis.
The OncoMRD BREAST assay extends the range of residual tumor monitoring and tracking, enabling it to engage targets beyond tumor genome with greater precision. This capability positions OncoMRD BREAST as a key element in residual disease-centric surveillance, where cancer biomarkers, personalized gene signatures, and analytical computation work together to deliver a comprehensive post-therapeutic picture. In this context, the OncoMRD BREAST test acts as a force multiplier, boosting the MRD monitoring capabilities in complex and dynamic situations.
4. Discussion
Biomarkers play a crucial role in assessing prognosis and treatment response in breast cancer patients. Serum biomarkers present a practical alternative to tissue-based markers, particularly for tracking disease recurrence, evaluating treatment efficacy, and identifying targetable mutations. While traditional markers like CA15-3, CA27-29, CEA, and HER2 exhibit limited sensitivity in early-stage disease, they remain valuable in metastatic settings for monitoring therapeutic response through serial measurements.
Liquid biopsy has emerged as a promising field in biomarker research. CTCs are the most established, offering prognostic and predictive insights, though further evidence is needed before widespread adoption. Plasma ctDNA has diverse applications, from aiding diagnosis to guiding treatment selection to MRD monitoring. Similarly, circulating microRNA panels show potential in breast cancer prognosis and treatment prediction but require additional validation for clinical use.
Ongoing trials are comparing biomarker-guided monitoring—using both conventional markers (CEA, CA15-3, CA27-29) and liquid biopsy components (CTCs, ctDNA, miRNA, mRNA, extracellular vesicles)—against standard-of-care imaging-based approaches. These studies aim to clarify the clinical utility of circulating biomarkers and could ultimately transform response assessment in solid tumor management (Table 3).
Table 3.
A characteristic comparison of different MRD biomarkers in breast cancer.
Two types of MRD assays have been developed and are used in oncology—tumor-informed and tumor-naive (also called tumor-agnostic). Tumor-informed assays offer a highly sensitive and personalized approach to detecting MRD by targeting specific mutations present in a patient’s tumor, enabling the identification of even trace amounts of cancer cells. Since these assays are tailored to an individual’s unique tumor profile, they provide more accurate and reliable results compared to standard methods. However, their use requires a tumor tissue sample, which may not always be accessible or feasible to obtain. Additionally, the process of sequencing the tumor and developing a customized assay can take several weeks, leading to longer turnaround times. Another limitation is that these assays may miss newly emerging therapy-relevant mutations caused by tumor heterogeneity or clonal evolution. Furthermore, the personalized nature of tumor-informed testing often results in higher costs compared to other MRD detection methods.
On the other hand, tumor-agnostic assays offer broad applicability by using pre-defined panels that target common mutations in a specific cancer type, making them suitable for a wide range of patients. These assays also provide faster turnaround times since they do not require tumor tissue sequencing, enabling quicker clinical decision-making. Additionally, their larger panel size may improve the detection of evolving tumor variants, which can be crucial for monitoring disease progression. However, they tend to have lower sensitivity compared to tumor-informed assays, particularly in identifying very low levels of minimal residual disease. Another drawback is the higher risk of false positives, as the broader panels may detect background noise or clonal hematopoiesis rather than true MRD. Furthermore, because these assays are not tailored to individual patients, they may miss patient-specific mutations, potentially reducing their accuracy in certain cases.
NGS-based ctDNA analysis has emerged as a pivotal noninvasive tool for MRD detection. However, current fixed-panel assays predominantly target common somatic genomic alterations—single-nucleotide variants (SNV), copy-number variants (CNV), and structural variants—overlooking the diverse biological information embedded in ctDNA. Emerging multi-analyte approaches now aim to integrate complementary features, such as circulating cell-free mRNA (cfmRNA) gene signatures [8,9], ctDNA fragment size profiles [34], nucleosome positioning signatures (fragmentome) [35], and histone modification markers [36]. These features collectively enhance detection accuracy by addressing limitations of conventional mutation-centric assays, including tumor heterogeneity and low ctDNA abundance, while offering novel insights into tumor biology. While ctDNA analysis has become a cornerstone in managing advanced-stage cancers, supported by robust clinical evidence, its utility in early-stage or post-treatment surveillance remains limited. Conventional assays optimized for high ctDNA levels in advanced disease fail to detect trace residual tumor DNA in settings like post-curative therapy or early-stage monitoring. This critical sensitivity gap has spurred rapid innovation in ultra-sensitive technologies, such as tumor-informed sequencing, epigenetic and transcriptomic profiling, to address the unmet demand for reliable MRD detection in lower-burden clinical scenarios.
The sensitivity and specificity of MRD testing methods—such as flow cytometry, PCR, and NGS—vary significantly. While NGS offers high sensitivity, it can yield false positives by detecting rare aberrant cells that may not be clinically significant. Sampling errors also pose a challenge. Additionally, sample contamination during collection, processing, or analysis can lead to false-positive results. The selection of biomarkers is another critical factor; if they are not entirely cancer-specific, normal cells may be misclassified as malignant. Stochastic effects also introduce uncertainty, as some detected cancer cells may never lead to relapse despite being identified by MRD tests. Clonal hematopoiesis, as well as the low frequency of somatic driver mutations from healthy tissues, can also interfere, as mutations in normal cells may be misread as residual disease. Finally, an antigen shift—where cancer cells alter their surface markers during therapy—may lead to false negatives if assays fail to adapt. Conversely, if new markers overlap with those on normal cells, false positives can occur. Together, these factors highlight the complexities of MRD testing and the need for careful interpretation of results.
Over the past 26 years, since the inaugural gene expression profiling study of breast tumors [37], transcriptomic assays have transitioned from research tools to clinical assets, now recognized as indispensable for refining prognostic stratification and therapeutic algorithms within the precision oncology paradigm. The robustness of these platforms is epitomized by the concept of “molecular portraits”—a term originating from the striking transcriptional homogeneity observed across spatially distinct tumor regions (intratumoral heterogeneity) and between primary tumors and their metastatic derivatives. Hierarchical clustering, an unsupervised machine learning framework, systematically groups these samples based on shared expression patterns, revealing evolutionarily conserved oncogenic programs that persist through disease progression [38]. This transcriptional taxonomy underscores why gene expression signatures outperform genomic mutation metrics in predicting tumor behavior, providing a molecular rationale for their integration into MRD diagnostic workflows.
For molecular diagnostics to reliably inform precision oncology strategies, they must meet stringent standards of analytical rigor and technical reproducibility—ensuring that the genomic or transcriptomic signature of each tumor is faithfully mirrored in clinically interpretable data, thereby minimizing interassay variability and maximizing confidence in MRD monitoring. To develop and clinically validate a cfmRNA gene expression assay compatible with tumor tissue samples, we implemented a systematic, four-phase approach. First, we optimized a high-throughput plasma-based transcriptomic profiling technique to reliably quantify gene expression. Second, we identified a dozen breast cancer-specific hyperactive genes through a comprehensive review of profiled datasets conducted on other cancer types and healthy cohorts. Third, we evaluated these biomarkers by analyzing clinical data from the TCGA database (1082 patients) to validate their association with genetic and clinicopathological characteristics of breast cancer. Fourth, based on these findings, we then developed an OncoMRD BREAST score algorithm derived from their expression profiles. The OncoMRD BREAST assay was analytically validated to account for inherent biological heterogeneity, ensuring that such diversity is naturally reflected in the OncoMRD BREAST score used to predict an individual patient’s response to therapeutic intervention and the risk of relapse.
The OncoMRD BREAST assay generates a gene signature for individual patients from the reference-normalized tumor expression level of multiple cancer-associated biomarkers. These breast cancer-specific biomarkers were selected through plasma transcriptomic profiling of ~750 key cancer-related genes [19]. Among these OncoMRD BREAST genes, seven major cancer pathways are represented: immune response, cell surface markers, transcription factors, DNA repair, DNA methylation, TP53 signaling, and MAP kinases.
Integrating gene expression profiles enables researchers to map the functional impact of genetic alterations in cancer. For instance, copy number changes in tumor genomes exert a direct, dose-dependent effect on transcription levels, as amplified or deleted genes are correspondingly over- or under-expressed. Cancer-associated molecular pathways—comprising multiple interacting genes—exhibit heterogeneous mutational landscapes across tumors, where distinct genetic alterations (e.g., point mutations, indels, copy number changes) may disrupt different nodes within the same pathway. Despite this variability, downstream transcriptional gene expression patterns often converge, reflecting shared regulatory outputs of pathway dysregulation. Our results showed significant associations between the OncoMRD BREAST gene signature and multiple clinical parameters, including MSI and hypoxia scores, fraction of altered genome, and tumor break load, indicating a strong correlation of these OncoMRD BREAST biomarkers with tumor behavior and the dependence of the assay on tumor activity. These results were further supported by the findings that the OncoMRD BREAST gene signature significantly increased mutation frequencies of SNV, CNV, and structural variants, including those frequently mutated genes in breast cancer, such as TP53, BRCA2, CDKN2A/B, and FGFR1. The molecular and clinical evidence here profoundly demonstrated that OncoMRD BREAST could be used to determine tumor activity and guide MRD decision-making in breast cancer.
Expression genetics offers a paradigm shift in precision oncology, diverging from conventional mutation-centric approaches by focusing on downstream transcriptional consequences of oncogenic processes rather than primary DNA sequence changes. Traditional cancer genetics has largely prioritized cataloging genomic aberrations, overlooking the mechanistic insights offered by differential expression profiling of tumor genes. This gap underscores the value of expression genetics: by analyzing transcriptional cascades triggered by oncogenic perturbations, this approach bridges the chasm between initiating mutations and their phenotypic manifestations, revealing critical biomarkers of MRD that evade detection through mutational analysis alone. This study aimed to identify overexpressed breast cancer biomarkers functioning as bona fide oncogenic drivers, tumor dependencies, and MRD targets. Our analysis revealed positive gene expression correlations between OncoMRD BREAST biomarkers and key driver genes in breast cancer, such as BRCA1/2, ATM, PIK3CA, ESR1, CDK4, and HER2, in which most breast cancer mutations also occur. The strong association of gene co-expression confirmed the clinical relevance of OncoMRD BREAST biomarkers for breast cancer MRD.
By applying a patient-derived gene expression signature and an OncoMRD BREAST score algorithm, we successfully detected and quantified MRD in a small cohort of patients. The analysis revealed a striking and statistically significant disparity in MRD between patient groups, comparable to PET/CT imaging. Notably, the OncoMRD BREAST score’s ability to function as a continuous indicator enables precise, individualized residual tumor monitoring, offering clinicians a robust tool for tailoring patient care. Precision in risk stratification and adjuvant therapy decision-making is critical for improving cancer outcomes. OncoMRD BREAST analysis offers a transformative approach to post-therapy MRD detection, enabling clinicians to identify patients most likely to benefit from adjuvant chemotherapy while sparing others from unnecessary overtreatment. Additionally, dynamically adjusting adjuvant therapy duration based on OncoMRD BREAST scores—monitoring tumor activity over time—could mitigate treatment-related toxicity.
While early studies demonstrated OncoMRD BREAST’s potential in MRD-guided oncology, the evidence remains preliminary. Large-scale, prospective validation is essential to address two pivotal questions: (1) Does intervening on elevated post-treatment OncoMRD BREAST scores improve survival or recurrence rates? (2) Can OncoMRD BREAST scores refine adjuvant or maintenance therapy precision—for example, by de-escalating treatment in patients with sustained MRD negativity?
To the best of our knowledge, this study defines the first personalized gene signature for MRD in breast cancer. We integrated TCGA tumor clinicopathological characteristics, GTEx gene co-expression correlation, gene ontology, and KEGG analyses to evaluate OncoMRD BREAST biomarker potential. Our analysis establishes OncoMRD BREAST as an emerging predictive gene signature with significant implications for breast cancer MRD detection, tracking, recurrence risk, and prognosis assessment.
5. Conclusions
MRD detection is reshaping oncology by informing decisions across the cancer care continuum—from early screening and adjuvant therapy guidance to relapse prediction, treatment response monitoring, and resistance profiling. Liquid biopsy, particularly circulating cfmRNA gene signature analysis, provides a rapid, noninvasive alternative to invasive tissue biopsies and costly WGS/WES sequencing, overcoming challenges like tumor inaccessibility or time-sensitive clinical scenarios.
OncoMRD BREAST strives to address the limitations of the current tumor-informed NGS-based MRD tests by prioritizing situational awareness via integrating hyperactive biomarkers and leveraging gene signatures to analyze broader and deeper signals of “tumor activities” beyond the tumor genome. OncoMRD BREAST’s gene signature could help clinicians find and identify cancer threats earlier and take steps to address those threats quicker than the current generation of MRD assays.
This study demonstrated that plasma-based, personalized gene signature-informed OncoMRD BREAST achieved MRD detection better than other molecular approaches. Critically, integrating “tumor activity” biomarkers with digital scoring computation enhanced detection sensitivity, yielding superior performance. The OncoMRD BREAST assay is being deployed to assess cfmRNA-guided adjuvant therapy impact. Ongoing interventional studies will further validate its utility for MRD detection and treatment decision support.
To solidify OncoMRD BREAST’s role in routine practice, rigorously designed intervention trials are urgently needed. These studies must establish whether cfmRNA gene signature-guided therapy adjustment—such as escalating treatment for MRD persistence or de-escalating upon sustained clearance—translates to improved survival outcomes. Only through such evidence can OncoMRD BREAST monitoring evolve from a prognostic tool into a driver of personalized, dynamic treatment strategies that maximize patient survival while minimizing unnecessary toxicity.
Author Contributions
Conceptualization, C.Y.; data curation, H.-C.L. and S.-T.L.; formal analysis, C.Y. and H.-C.L.; funding acquisition, C.Y.; investigation, C.Y., H.-C.L., N.G., X.W. and S.-T.L.; methodology, C.Y.; project administration, S.-T.L.; resources, C.Y.; software, S.-T.L.; supervision, C.Y. and H.-C.L.; validation, N.G., X.W. and S.-T.L.; visualization, C.Y.; writing—original draft, C.Y. and H.-C.L.; writing—review and editing, C.Y., H.-C.L., N.G., X.W. and S.-T.L. All authors have read and agreed to the published version of the manuscript.
Funding
This work was supported by OncoDxRx under the project Onco-cfmrna 00363521.
Institutional Review Board Statement
The study was conducted according to the guidelines of the International Council for Harmonisation of Technical Requirements for Pharmaceuticals for Human Use Guideline for Good Clinical Practice (ICH-GCP) and approved on 4 August, 2024, by the Institutional Research Board of Shin Kong Wu Ho-Su Memorial Hospital, Taipei, Taiwan, IRB 20180804Rv2.
Informed Consent Statement
Written informed consent was obtained from all the subjects involved in the study for the use and publication of data (28 August, 2018, version 2). All the experiments were carried out in accordance with the ICH-GCP in its last revised version.
Data Availability Statement
The data presented in this study are available within the article.
Acknowledgments
We would like to thank Daniel Lin and Sharon Yeh for their project management, experimental, and logistic support.
Conflicts of Interest
Authors Chen Yeh, Nathan Grabbe, Xavier Willett, and Shu-Ti Lin were employed by the company OncoDxRx. The remaining authors declare that the research was conducted in the absence of any commercial or financial relationships that could be construed as a potential conflict of interest.
References
- Siegel, R.L.; Miller, K.D.; Wagle, N.S.; Jemal, A. Cancer statistics. CA A Cancer J. Clin. 2023, 73, 17–48. [Google Scholar] [CrossRef] [PubMed]
- Colleoni, M.; Sun, Z.; Price, K.N.; Karlsson, P.; Forbes, J.F.; Thürlimann, B.; Gianni, L.; Castiglione, M.; Gelber, R.D.; Coates, A.S.; et al. Annual Hazard Rates of Recurrence for Breast Cancer During 24 Years of Follow-Up: Results From the International Breast Cancer Study Group Trials I to V. J. Clin. Oncol. 2016, 34, 927–935. [Google Scholar] [CrossRef]
- Stergiopoulou, D.; Markou, A.; Strati, A.; Zavridou, M.; Tzanikou, E.; Mastoraki, S.; Kallergi, G.; Georgoulias, V.; Lianidou, E. Comprehensive liquid biopsy analysis as a tool for the early detection of minimal residual disease in breast cancer. Sci. Rep. 2023, 13, 1258. [Google Scholar] [CrossRef] [PubMed]
- Pedersen, R.N.; Esen, B.Ö.; Mellemkjær, L.; Christiansen, P.; Ejlertsen, B.; Lash, T.L.; Nørgaard, M.; Cronin-Fenton, D. The Incidence of Breast Cancer Recurrence 10–32 Years After Primary Diagnosis. J. Natl. Cancer Inst. 2022, 114, 391–399. [Google Scholar] [CrossRef] [PubMed]
- Tachtsidis, A.; McInnes, L.M.; Jacobsen, N.; Thompson, E.W.; Saunders, C.M. Minimal residual disease in breast cancer: An overview of circulating and disseminated tumour cells. Clin. Exp. Metastasis 2016, 33, 521–550. [Google Scholar] [CrossRef]
- Chen, H.; Zhou, Q. Detecting liquid remnants of solid tumors treated with curative intent: Circulating tumor DNA as a biomarker of minimal residual disease (Review). Oncol. Rep. 2023, 49, 106. [Google Scholar] [CrossRef]
- Hasenleithner, S.O.; Speicher, M.R. A clinician’s handbook for using ctDNA throughout the patient journey. Mol. Cancer 2022, 21, 81. [Google Scholar] [CrossRef]
- Yeh, J.-S.; Lin, S.-T. Minimal Residual Disease in Solid Tumors: Shifting the Focus from Cell-Free DNA to Cell-Free RNA. J. Oncogenom. Oncotarget 2022, 1, 1–9. [Google Scholar] [CrossRef]
- Ahn, S.-J.; Yuguang, C. Therapeutic Response Monitoring: Minimal Residual Disease Testing in Cancer Management. Amer. J. Physiol. Biochem. Pharmacol. 2024, 14, 1–4. [Google Scholar] [CrossRef]
- Werner, S.; Heidrich, I.; Pantel, K. Clinical management and biology of tumor dormancy in breast cancer. Semin. Cancer Biol. 2022, 78, 49–62. [Google Scholar] [CrossRef]
- Zheng, J.; Qin, C.; Wang, Q.; Tian, D.; Chen, Z. Circulating tumour DNA-Based molecular residual disease detection in resectable cancers: A systematic review and meta-analysis. EBioMedicine 2024, 103, 105–109. [Google Scholar] [CrossRef] [PubMed]
- Chin, R.-I.; Chen, K.; Usmani, A.; Chua, C.; Harris, P.K.; Binkley, M.S.; Azad, T.D.; Dudley, J.C.; Chaudhuri, A.A. Detection of Solid Tumor Molecular Residual Disease (MRD) Using Circulating Tumor DNA (ctDNA). Mol. Diagn. Ther. 2019, 23, 311–331. [Google Scholar] [CrossRef] [PubMed]
- Rahal, Z.; Scheet, P.; Kadara, H. Somatic Mutations in Normal Tissues: Calm before the Storm. Cancer Discov. 2024, 14, 605–609. [Google Scholar] [CrossRef]
- Yeh, C.H.; Ford, A.; Brown, C. Somatic Mutations in Cancer-Free Individuals: A Liquid Biopsy Connection. Open Access J. Oncol. Med. 2018, 1, 1–4. [Google Scholar] [CrossRef]
- Yates, L.; Seoane, J.; Le Tourneau, C.; Siu, L.; Marais, R.; Michiels, S.; Soria, J.; Campbell, P.; Normanno, N.; Scarpa, A.; et al. The European Society for Medical Oncology (ESMO) Precision Medicine Glossary. Ann. Oncol. 2017, 29, 30–35. [Google Scholar] [CrossRef]
- Malone, E.R.; Oliva, M.; Sabatini, P.J.B.; Stockley, T.L.; Siu, L.L. Molecular profiling for precision cancer therapies. Genome Med. 2020, 12, 8. [Google Scholar] [CrossRef]
- Seifert, S.; Gundlach, S.; Junge, O.; Szymczak, S.; Martelli, L. Integrating biological knowledge and gene expression data using pathway-guided random forests: A benchmarking study. Bioinformatics 2020, 36, 4301–4308. [Google Scholar] [CrossRef]
- Yeh, C. Circulating cell-free transcriptomics in cancer. J. Lung Pulm Respir. Res. 2023, 10, 23–25. [Google Scholar] [CrossRef]
- Yeh, C.; Lin, S.-T.; Lai, H.-C. A Transformative Technology Linking Patient’s mRNA Expression Profile to Anticancer Drug Efficacy. Onco 2024, 4, 143–162. [Google Scholar] [CrossRef]
- Lin, S.; Lai, H.; Yeh, C. Single-tube two-pronged approach using both cell-free DNA and RNA for multimodal biomarker tests at the time of biopsy. Precis. Med. Sci. 2023, 12, 233–241. [Google Scholar] [CrossRef]
- Lin, S.T.; Yip, C.H. Harnessing the Power of CpG Methylation Biomarkers for Early Cancer Detection. J. Mol. Genet. Med. 2022, 16, 537. [Google Scholar]
- Ge, S.X.; Jung, D.; Yao, R. ShinyGO: A graphical gene-set enrichment tool for animals and plants. Bioinformatics 2020, 36, 2628–2629. [Google Scholar] [CrossRef] [PubMed]
- Tang, Z.; Kang, B.; Li, C.; Chen, T.; Zhang, Z. GEPIA2: An enhanced web server for large-scale expression profiling and interactive analysis. Nucleic Acids Res. 2019, 47, W556–W560. [Google Scholar] [CrossRef] [PubMed]
- Schramm, A.; Friedl, T.W.P.; Schochter, F.; Scholz, C.; de Gregorio, N.; Huober, J.; Rack, B.; Trapp, E.; Alunni-Fabbroni, M.; Müller, V.; et al. Therapeutic intervention based on circulating tumor cell phenotype in metastatic breast cancer: Concept of the DETECT study program. Arch. Gynecol. Obstet. 2015, 293, 271–281. [Google Scholar] [CrossRef]
- Kostecka, A.; Nowikiewicz, T.; Olszewski, P.; Koczkowska, M.; Horbacz, M.; Heinzl, M.; Andreou, M.; Salazar, R.; Mair, T.; Madanecki, P.; et al. High prevalence of somatic PIK3CA and TP53 pathogenic variants in the normal mammary gland tissue of sporadic breast cancer patients revealed by duplex sequencing. npj Breast Cancer 2022, 8, 76. [Google Scholar] [CrossRef]
- Britschgi, A.; Bill, A.; Brinkhaus, H.; Rothwell, C.; Clay, I.; Duss, S.; Rebhan, M.; Raman, P.; Guy, C.T.; Wetzel, K.; et al. Calcium-activated chloride channel ANO1 promotes breast cancer progression by activating EGFR and CAMK signaling. Proc. Natl. Acad. Sci. USA 2013, 110, 1026–1034. [Google Scholar] [CrossRef]
- Dancau, A.; Wuth, L.; Waschow, M.; Holst, F.; Krohn, A.; Choschzick, M.; Terracciano, L.; Politis, S.; Kurtz, S.; Lebeau, A.; et al. PPFIA1 and CCND1 are frequently coamplified in breast cancer. Genes Chromosom Cancer 2009, 49, 1–8. [Google Scholar] [CrossRef]
- Xu, L.; Li, P.; Hao, X.; Lu, Y.; Liu, M.; Song, W.; Shan, L.; Yu, J.; Ding, H.; Chen, S.; et al. SHANK2 is a frequently amplified oncogene with evolutionarily conserved roles in regulating Hippo signaling. Protein Cell 2020, 12, 174–193. [Google Scholar] [CrossRef]
- Zhou, R.; Zhu, X.; Peng, Y.; Zhong, L.; Peng, L.; Yang, B.; Meng, Y.; Chen, X.; Lu, Y. Clinical Impact of 11q13.3 Amplification on Immune Cell Infiltration and Prognosis in Breast Cancer. Int. J. Gen. Med. 2022, 15, 4037–4052. [Google Scholar] [CrossRef]
- Guo, Z.-H.; Yao, L.-T.; Guo, A.-Y. Clinical and biological impact of LINC02544 expression in breast cancer after neoadjuvant chemotherapy. Eur. Rev. Med. Pharmacol. Sci. 2020, 24, 10573–10585. [Google Scholar] [CrossRef]
- Santolla, M.F.; Maggiolini, M. The FGF/FGFR System in Breast Cancer: Oncogenic Features and Therapeutic Perspectives. Cancers 2020, 12, 3029. [Google Scholar] [CrossRef] [PubMed]
- Lopez-Gonzalez, L.; Cendra, A.S.; Cendra, C.S.; Cervantes, E.D.R.; Espinosa, J.C.; Pekarek, T.; Fraile-Martinez, O.; García-Montero, C.; Rodriguez-Slocker, A.M.; Jiménez-Álvarez, L.; et al. Exploring Biomarkers in Breast Cancer: Hallmarks of Diagnosis, Treatment, and Follow-Up in Clinical Practice. Medicina 2024, 60, 168. [Google Scholar] [CrossRef] [PubMed]
- Ruth, J.R.; Pant, D.K.; Pan, T.C.; Seidel, H.E.; Baksh, S.C.; Keister, B.A.; Singh, R.; Sterner, C.J.; Bakewell, S.J.; Moody, S.E.; et al. Cellular dormancy in minimal residual disease following targeted therapy. Breast Cancer Res. 2021, 23, 63. [Google Scholar] [CrossRef] [PubMed]
- Mouliere, F.; Chandrananda, D.; Piskorz, A.M.; Moore, E.K.; Morris, J.; Ahlborn, L.B.; Mair, R.; Goranova, T.; Marass, F.; Heider, K.; et al. Enhanced detection of circulating tumor DNA by fragment size analysis. Sci. Transl. Med. 2018, 10, 466. [Google Scholar] [CrossRef]
- Mathios, D.; Johansen, J.S.; Cristiano, S.; Medina, J.E.; Phallen, J.; Larsen, K.R.; Bruhm, D.C.; Niknafs, N.; Ferreira, L.; Adleff, V.; et al. Detection and characterization of lung cancer using cell-free DNA fragmentomes. Nat. Commun. 2021, 12, 5060. [Google Scholar] [CrossRef]
- Sadeh, R.; Sharkia, I.; Fialkoff, G.; Rahat, A.; Gutin, J.; Chappleboim, A.; Nitzan, M.; Fox-Fisher, I.; Neiman, D.; Meler, G.; et al. ChIP-seq of plasma cell-free nucleosomes identifies gene expression programs of the cells of origin. Nat. Biotechnol. 2021, 39, 586–598. [Google Scholar] [CrossRef]
- Perou, C.M.; Jeffrey, S.S.; van de Rijn, M.; Rees, C.A.; Eisen, M.B.; Ross, D.T.; Pergamenschikov, A.; Williams, C.F.; Zhu, S.X.; Lee, J.C.F.; et al. Distinctive gene expression patterns in human mammary epithelial cells and breast cancers. Proc. Natl. Acad. Sci. USA 1999, 96, 9212–9217. [Google Scholar] [CrossRef]
- Hu, Z.; Fan, C.; Oh, D.S.; Marron, J.; He, X.; Qaqish, B.F.; Livasy, C.; Carey, L.A.; Reynolds, E.; Dressler, L.; et al. The molecular portraits of breast tumors are conserved across microarray platforms. BMC Genom. 2006, 7, 96. [Google Scholar] [CrossRef]


Disclaimer/Publisher’s Note: The statements, opinions and data contained in all publications are solely those of the individual author(s) and contributor(s) and not of MDPI and/or the editor(s). MDPI and/or the editor(s) disclaim responsibility for any injury to people or property resulting from any ideas, methods, instructions or products referred to in the content. |
© 2025 by the authors. Licensee MDPI, Basel, Switzerland. This article is an open access article distributed under the terms and conditions of the Creative Commons Attribution (CC BY) license (https://creativecommons.org/licenses/by/4.0/).