

Imaging of Liver Metastases from GEP-NETs: A Narrative Review

 , ,
, , 
Simple Summary
Abstract
1. Introduction
1.1. Clinical Manifestation
1.2. Grading and Diagnostic Implications of Liver Metastases
2. Diagnosis
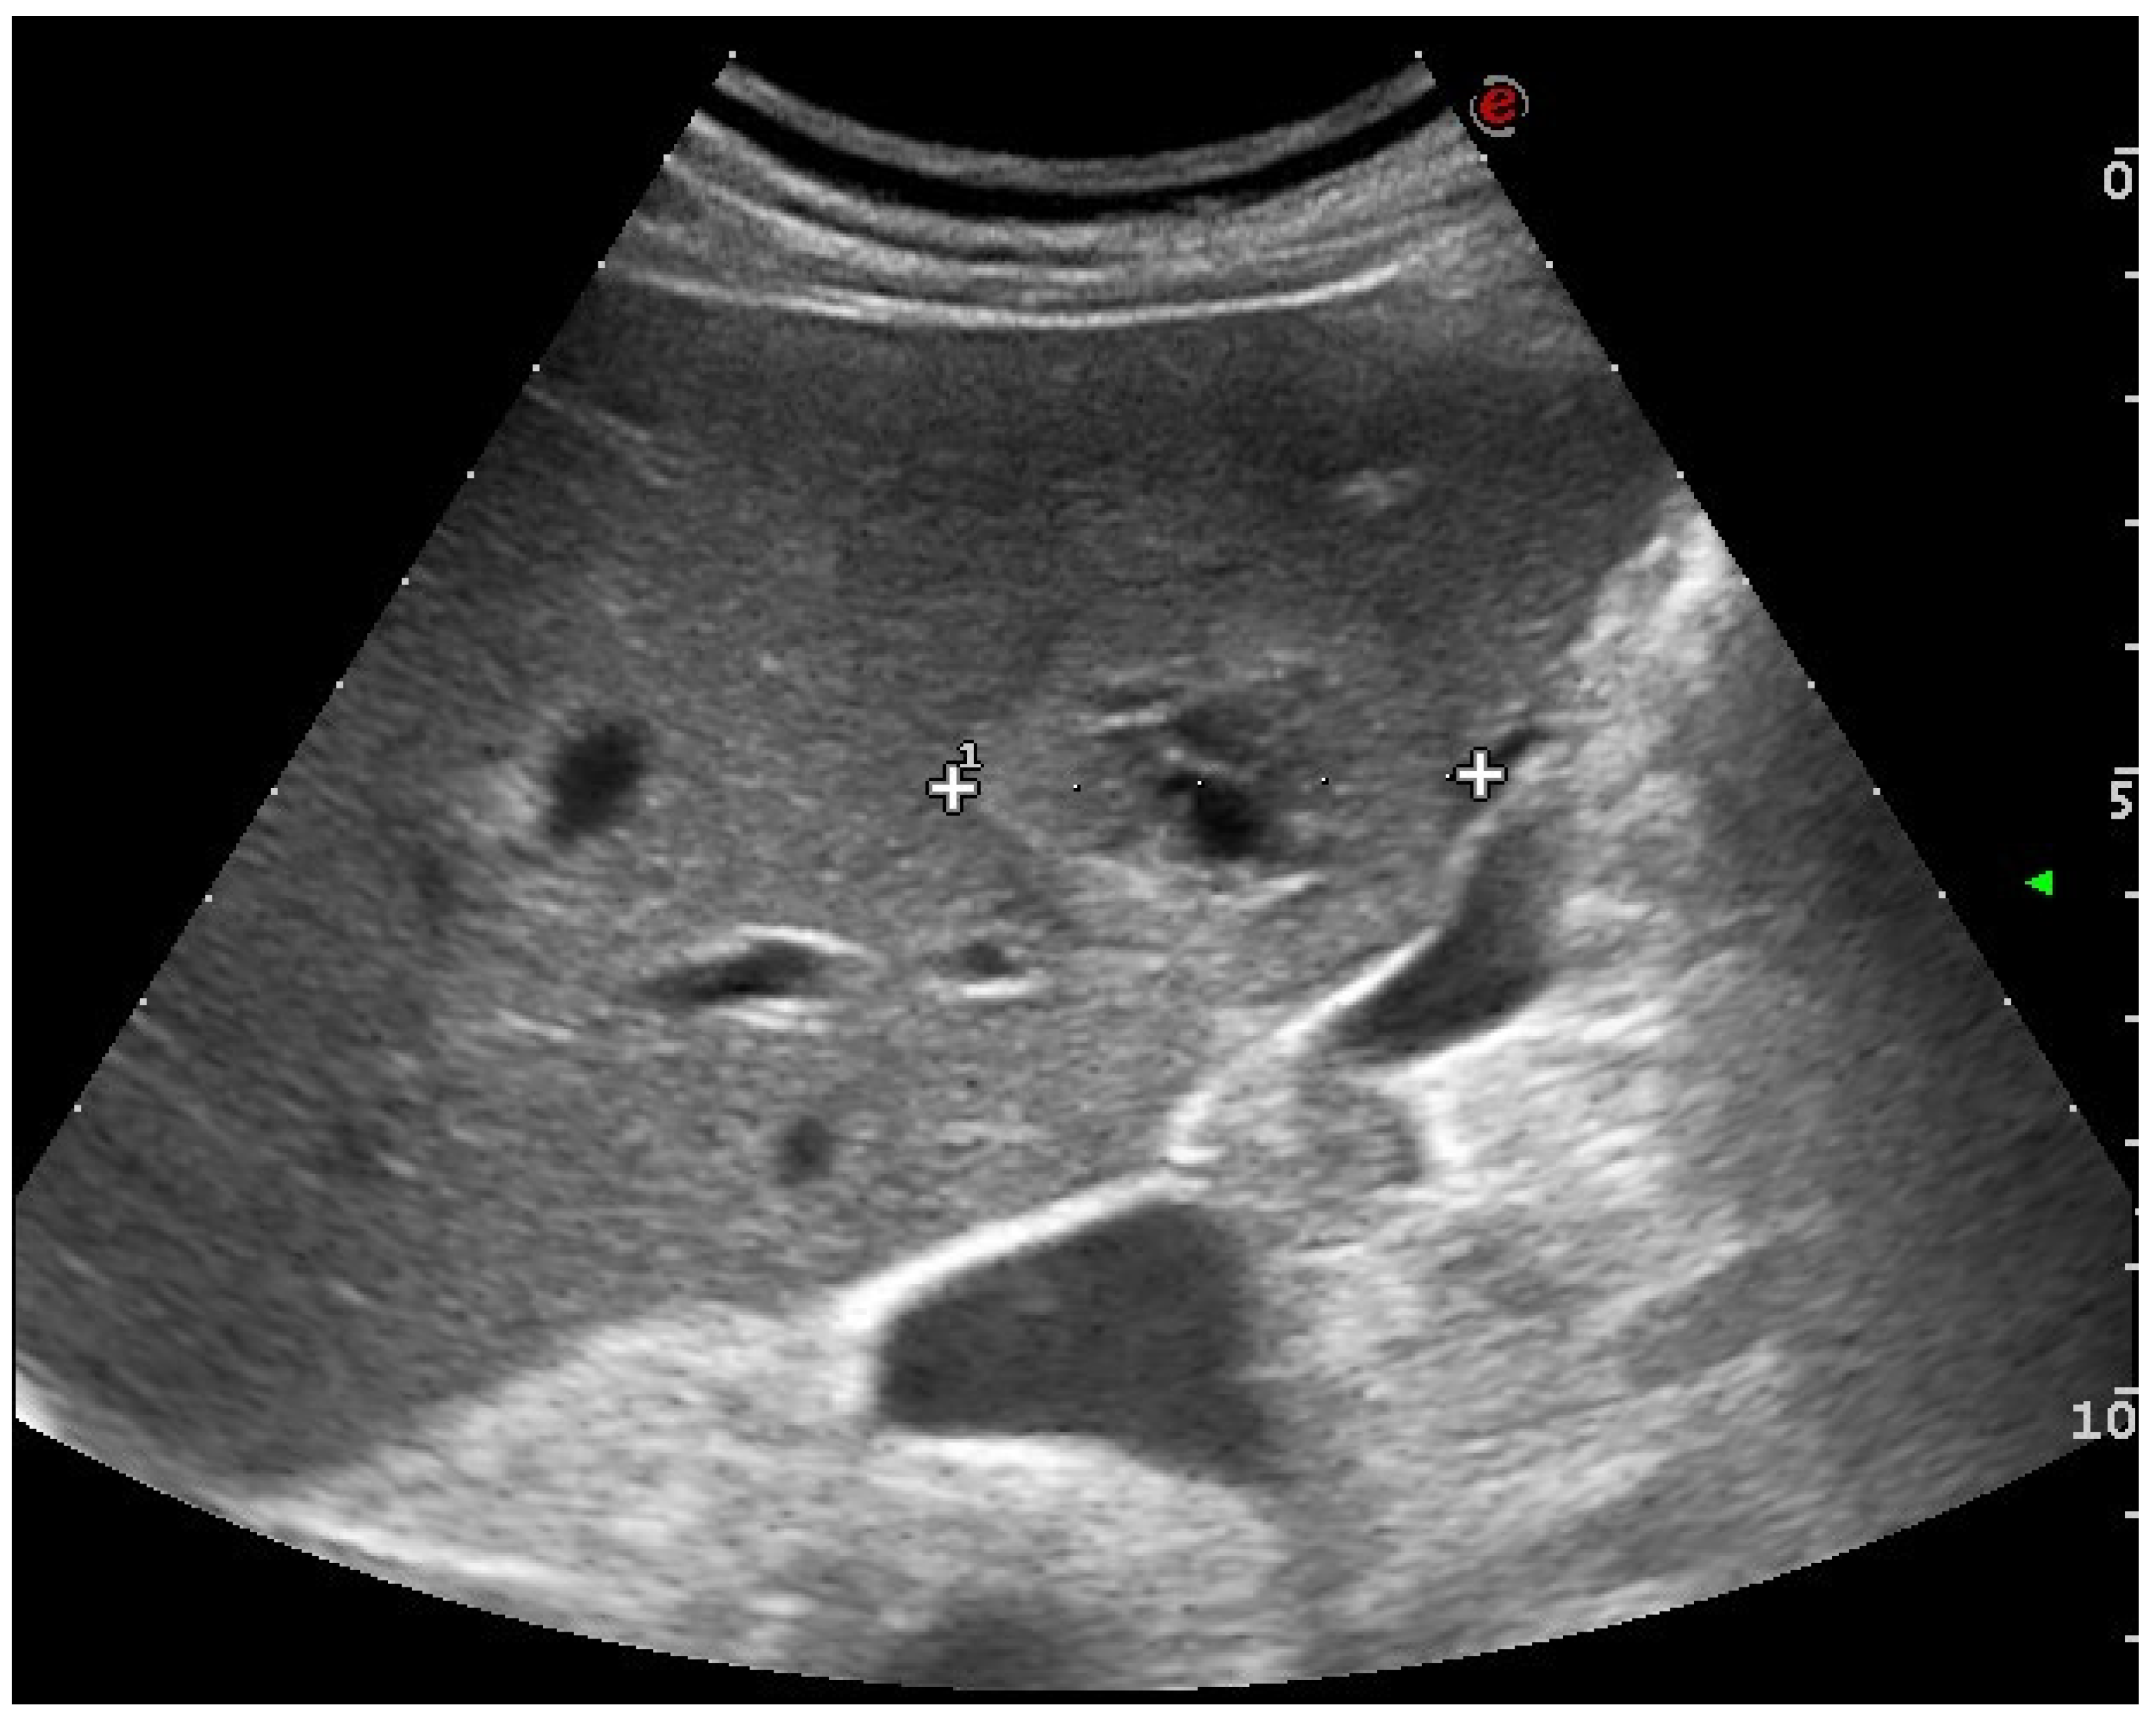
2.1. US and CEUS
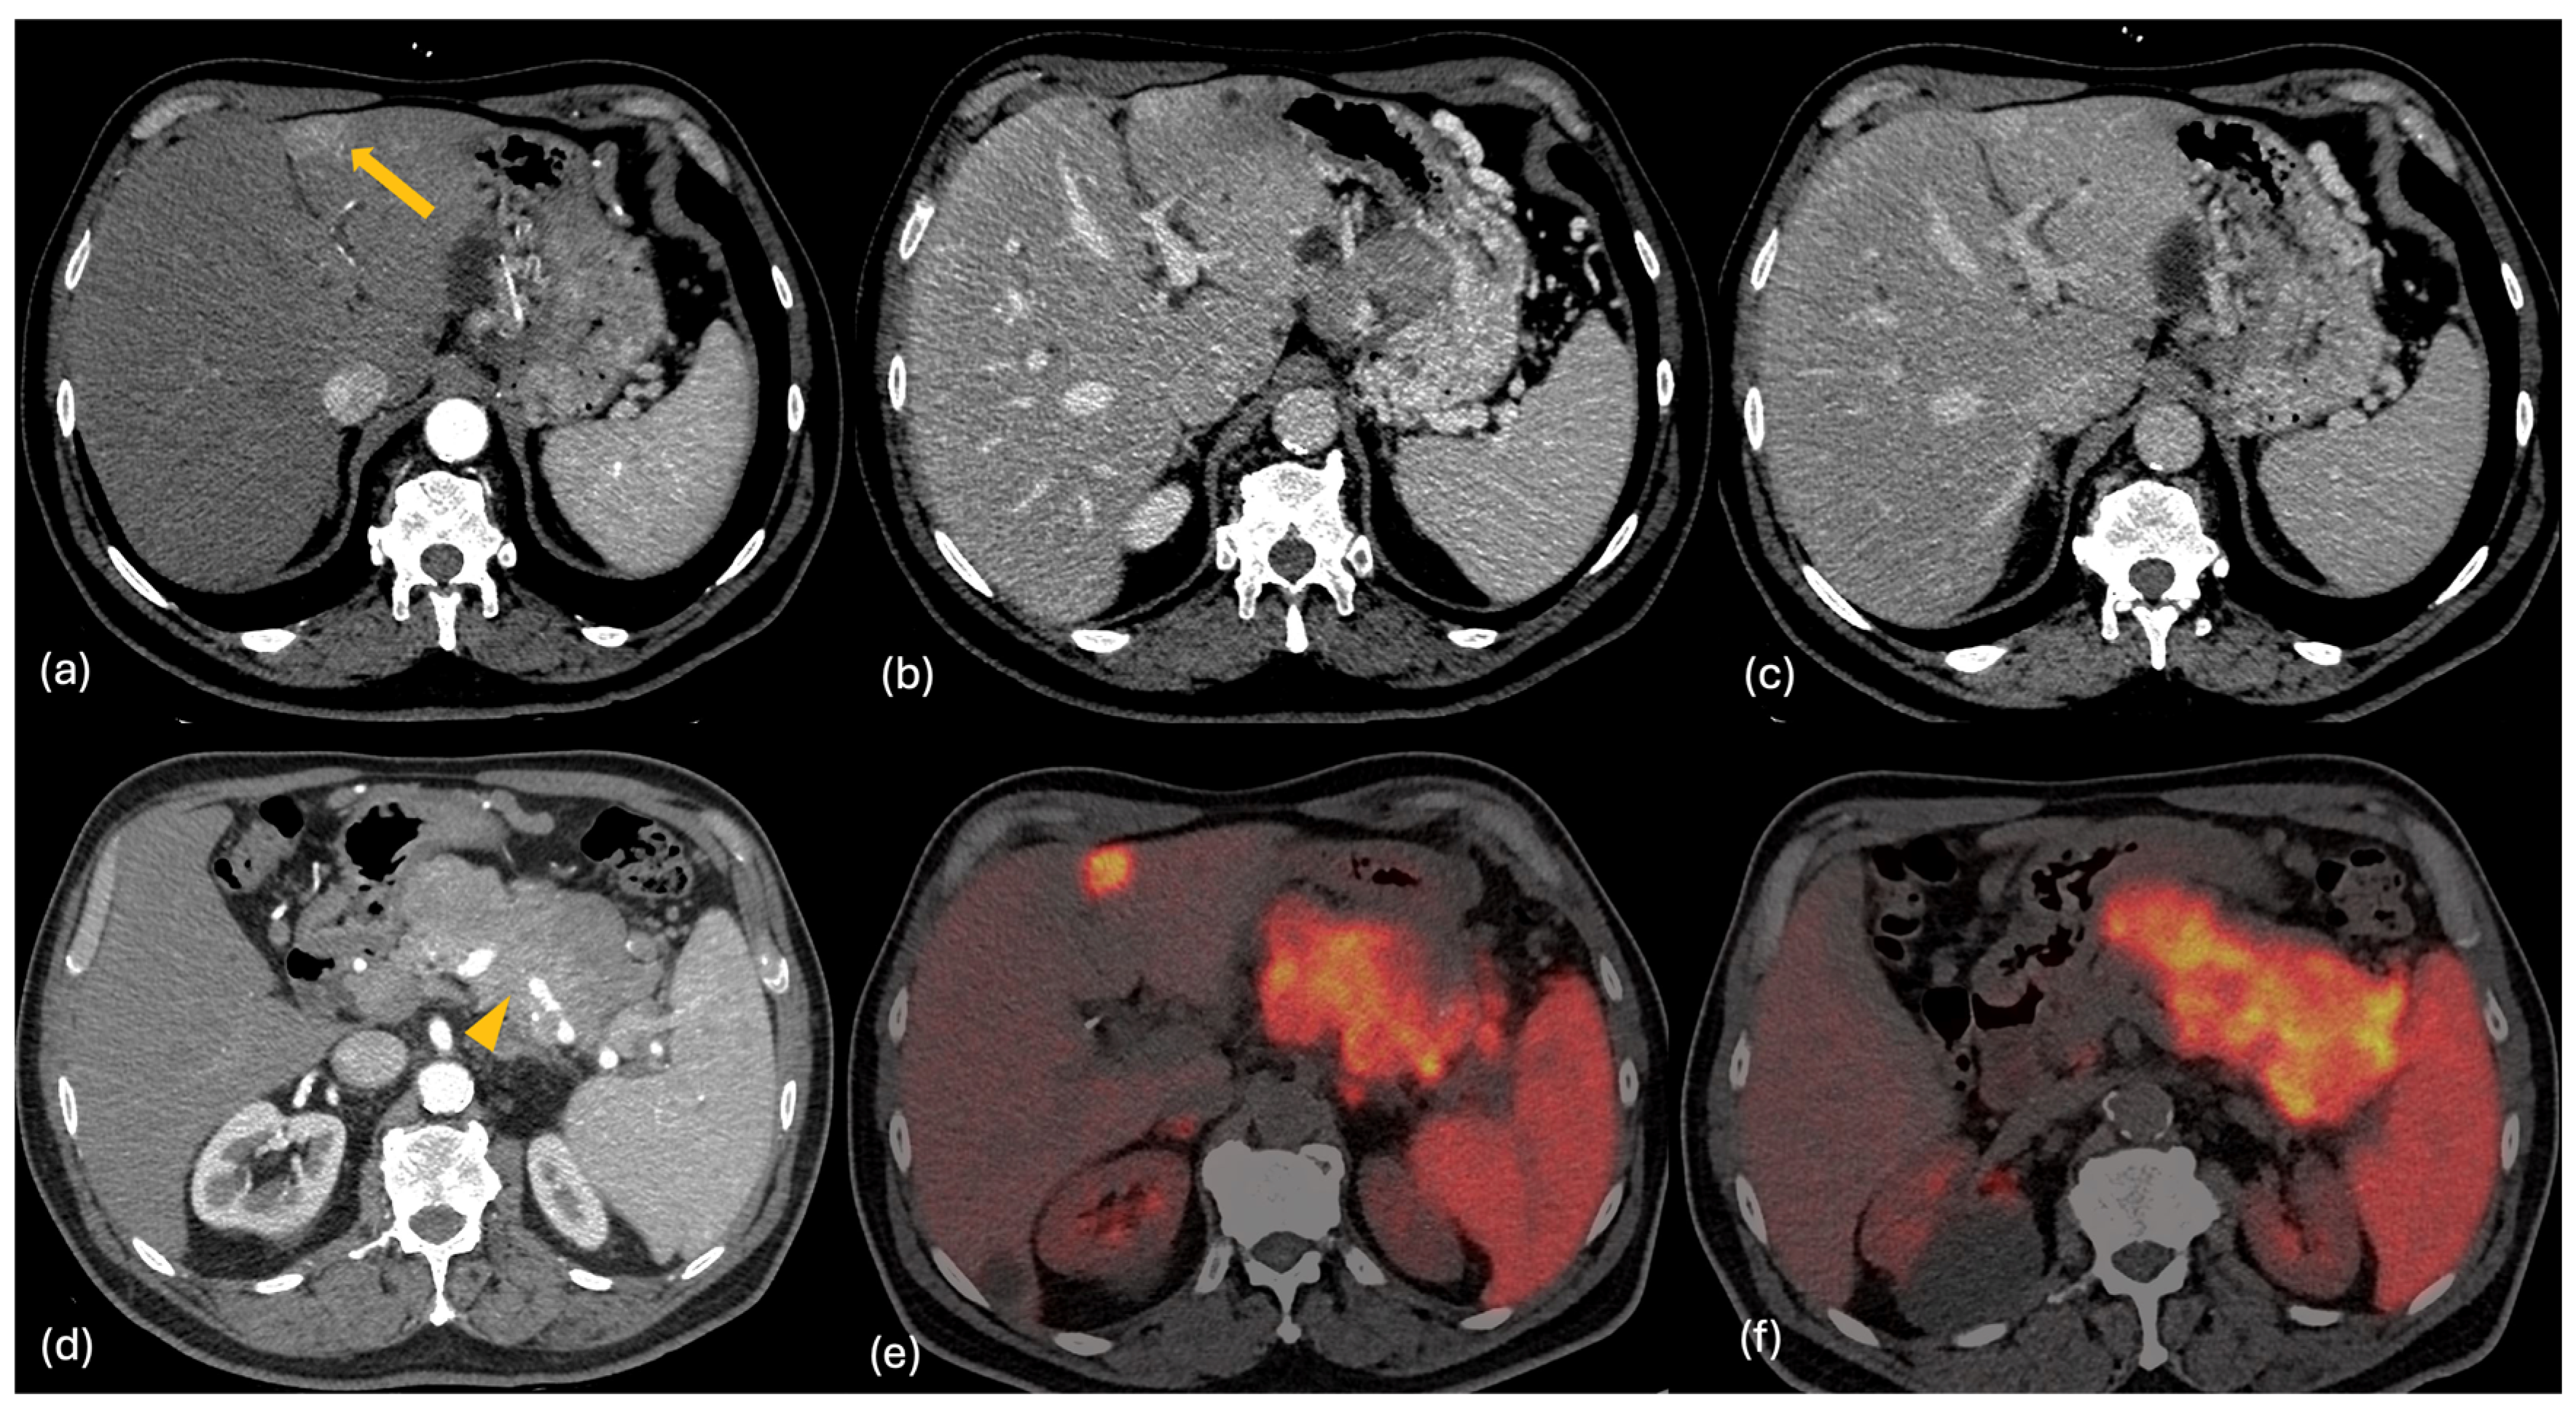
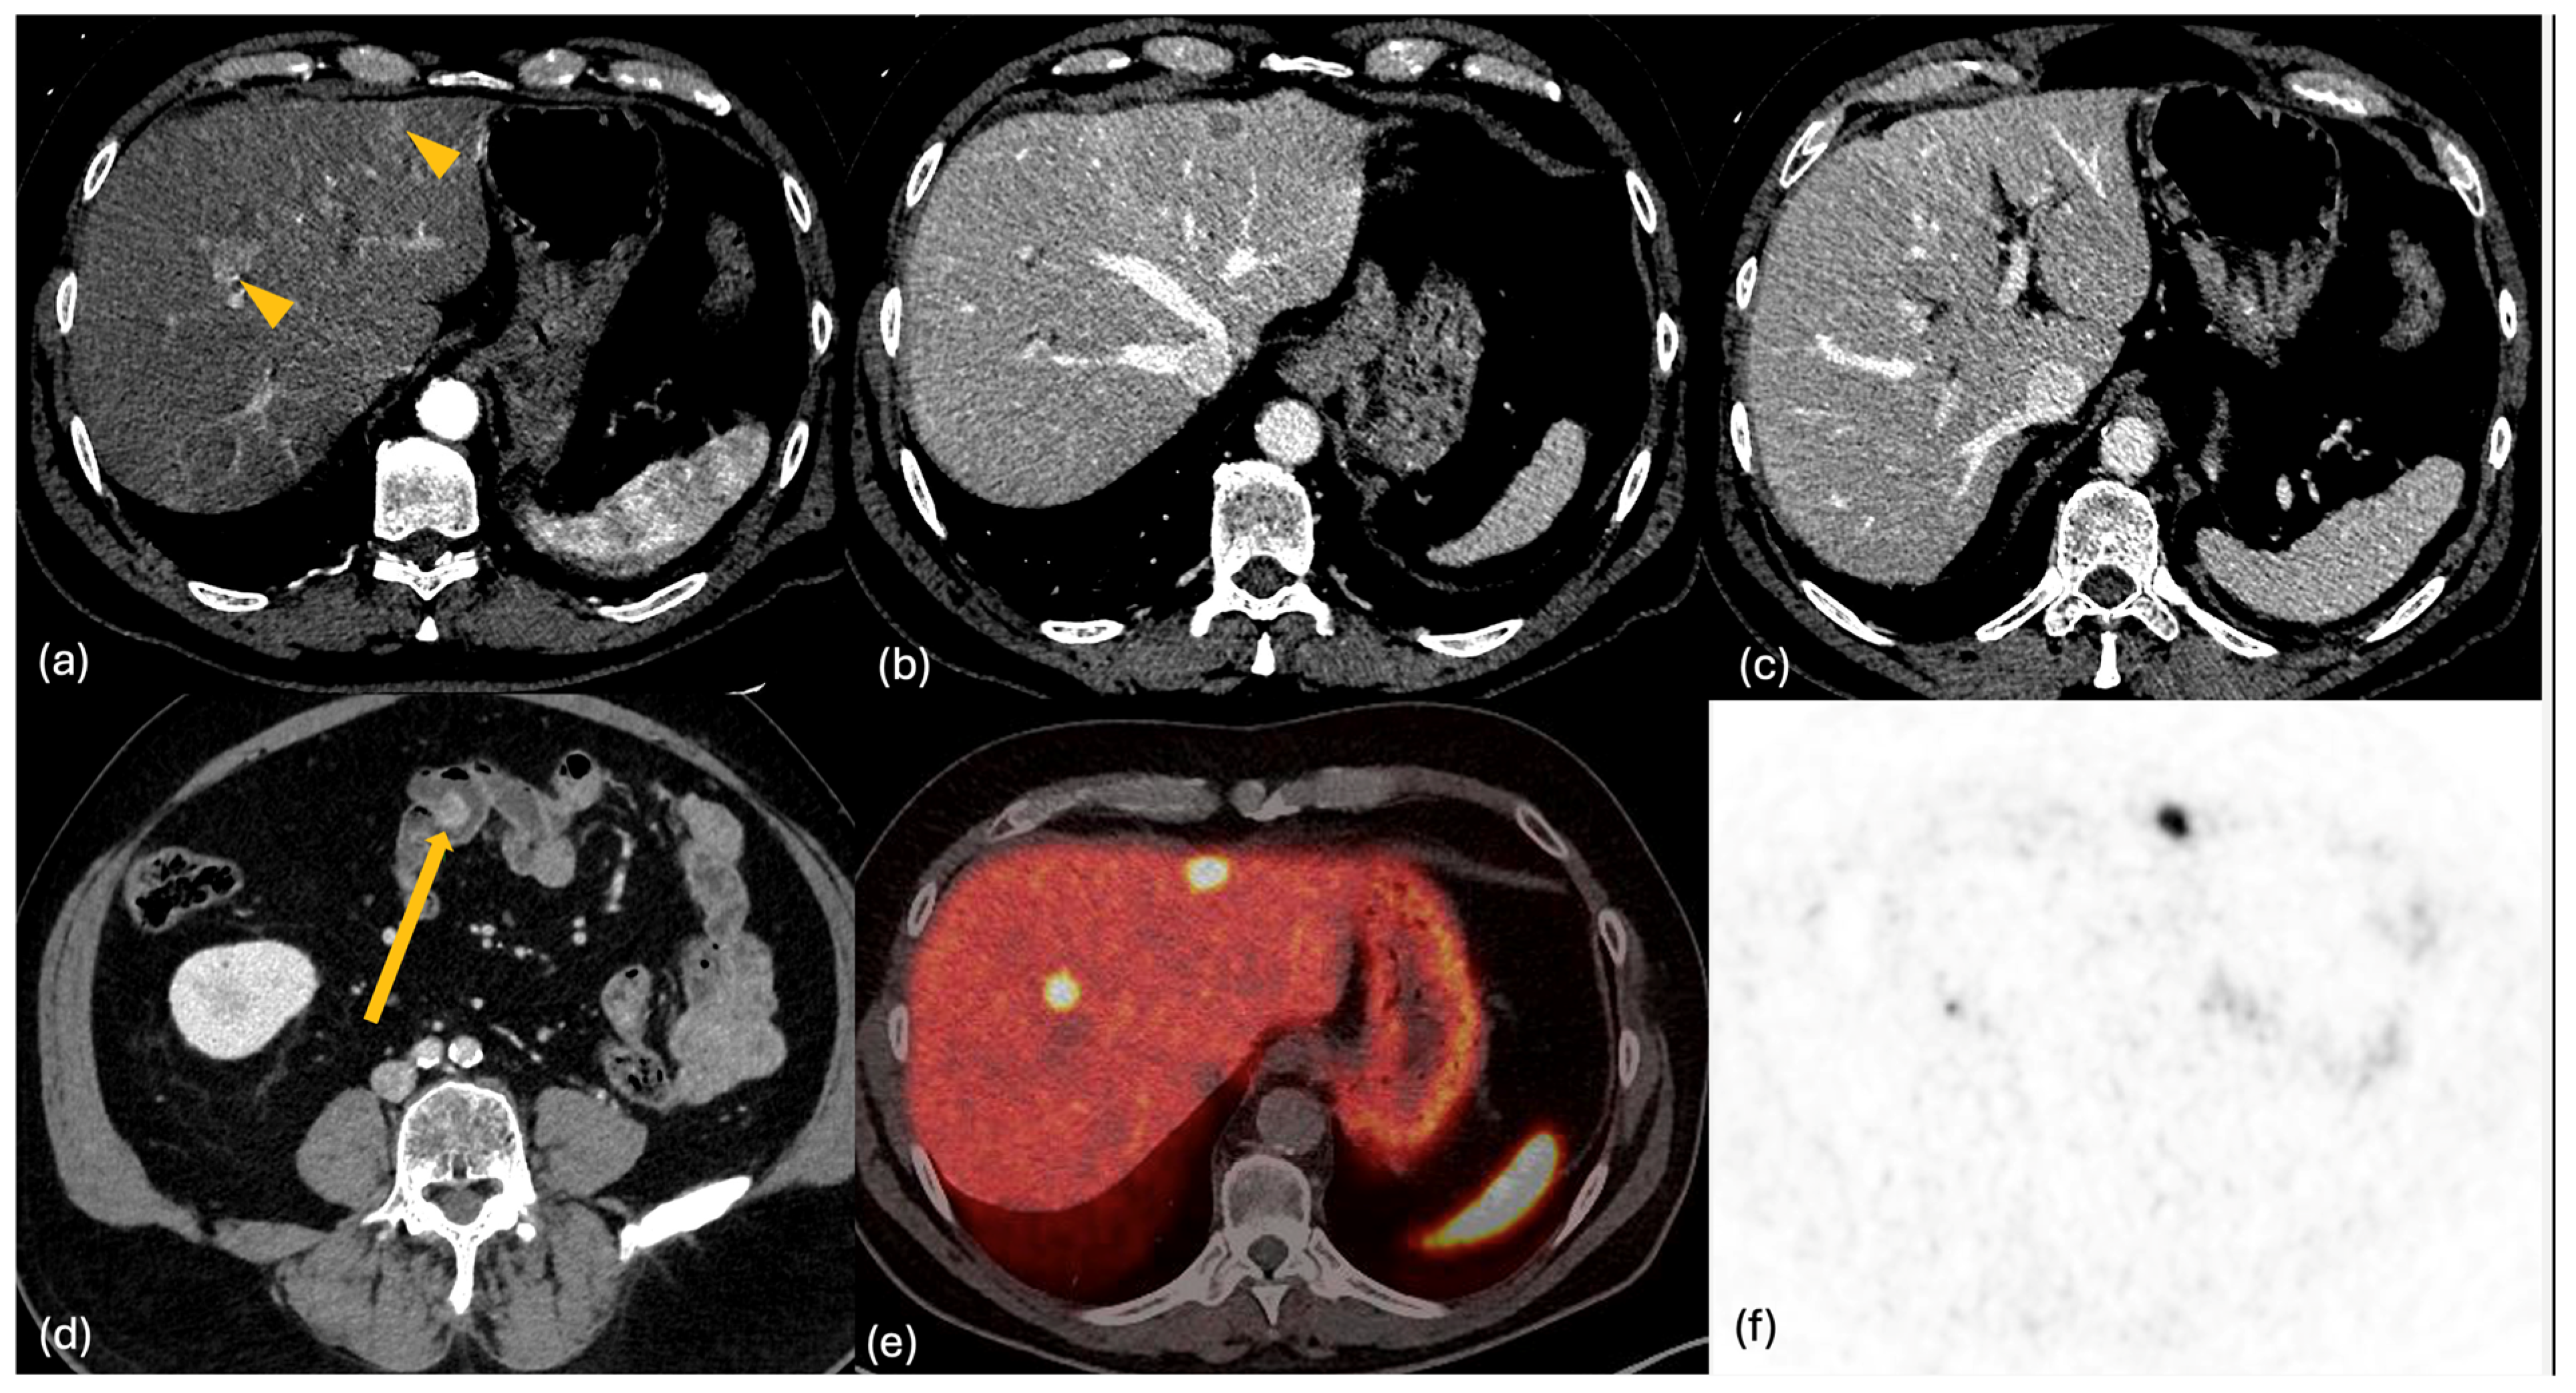
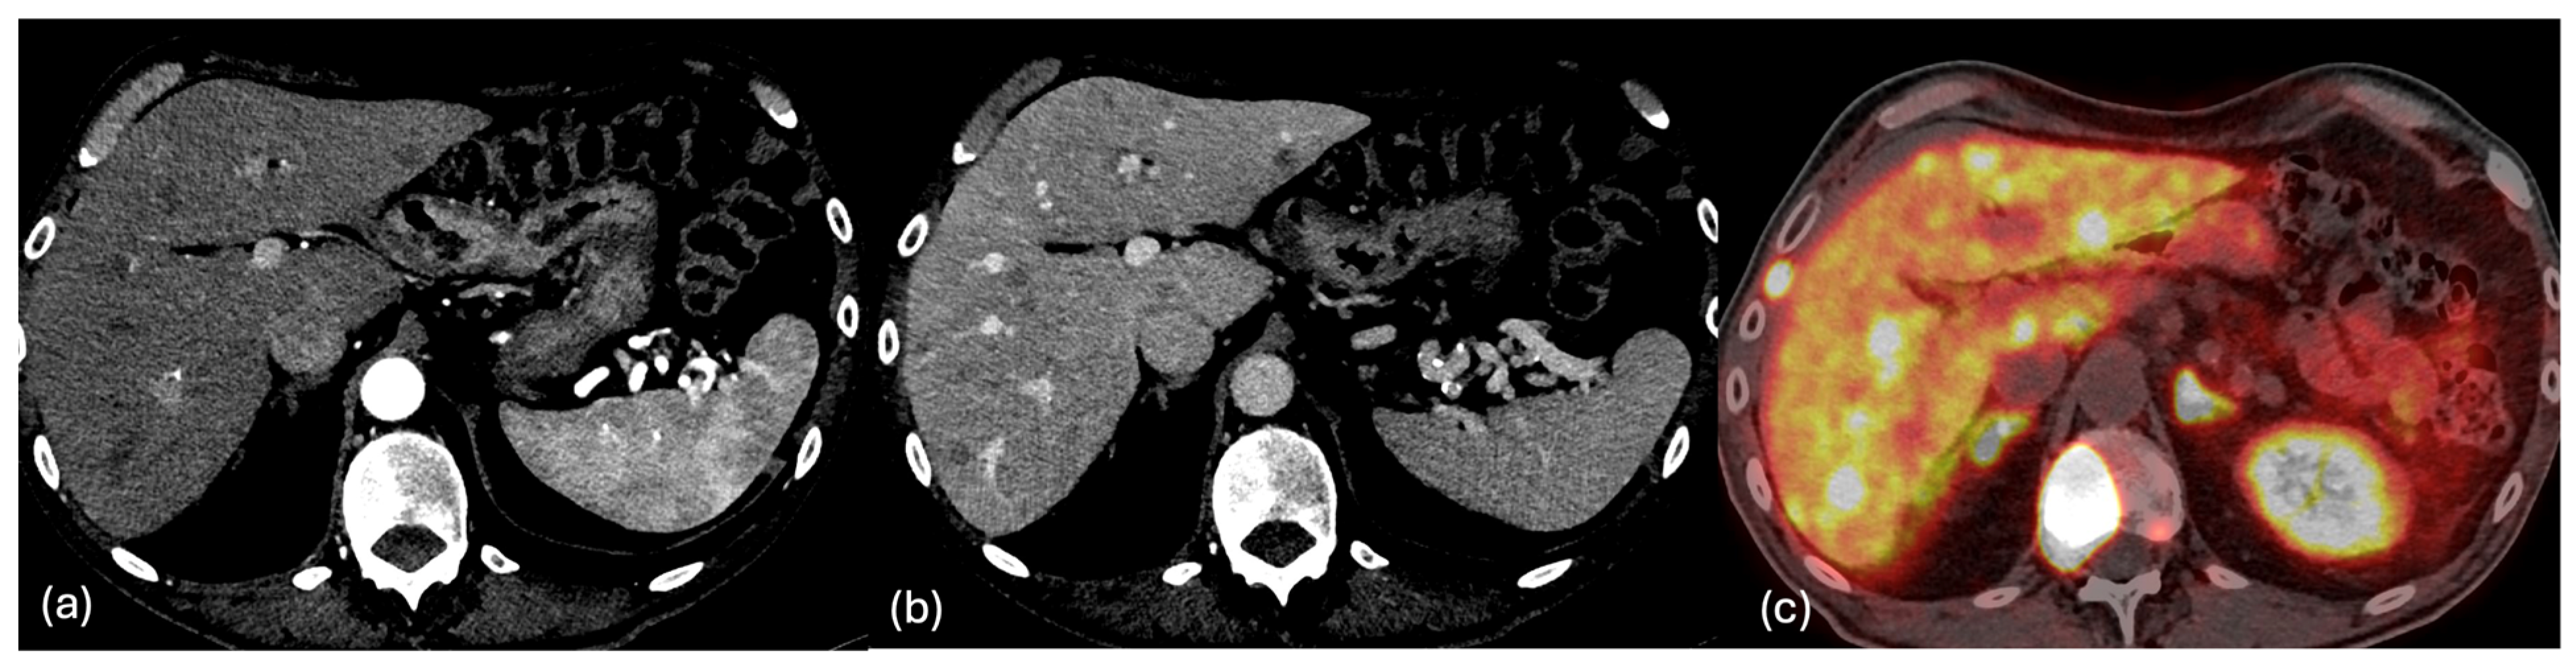
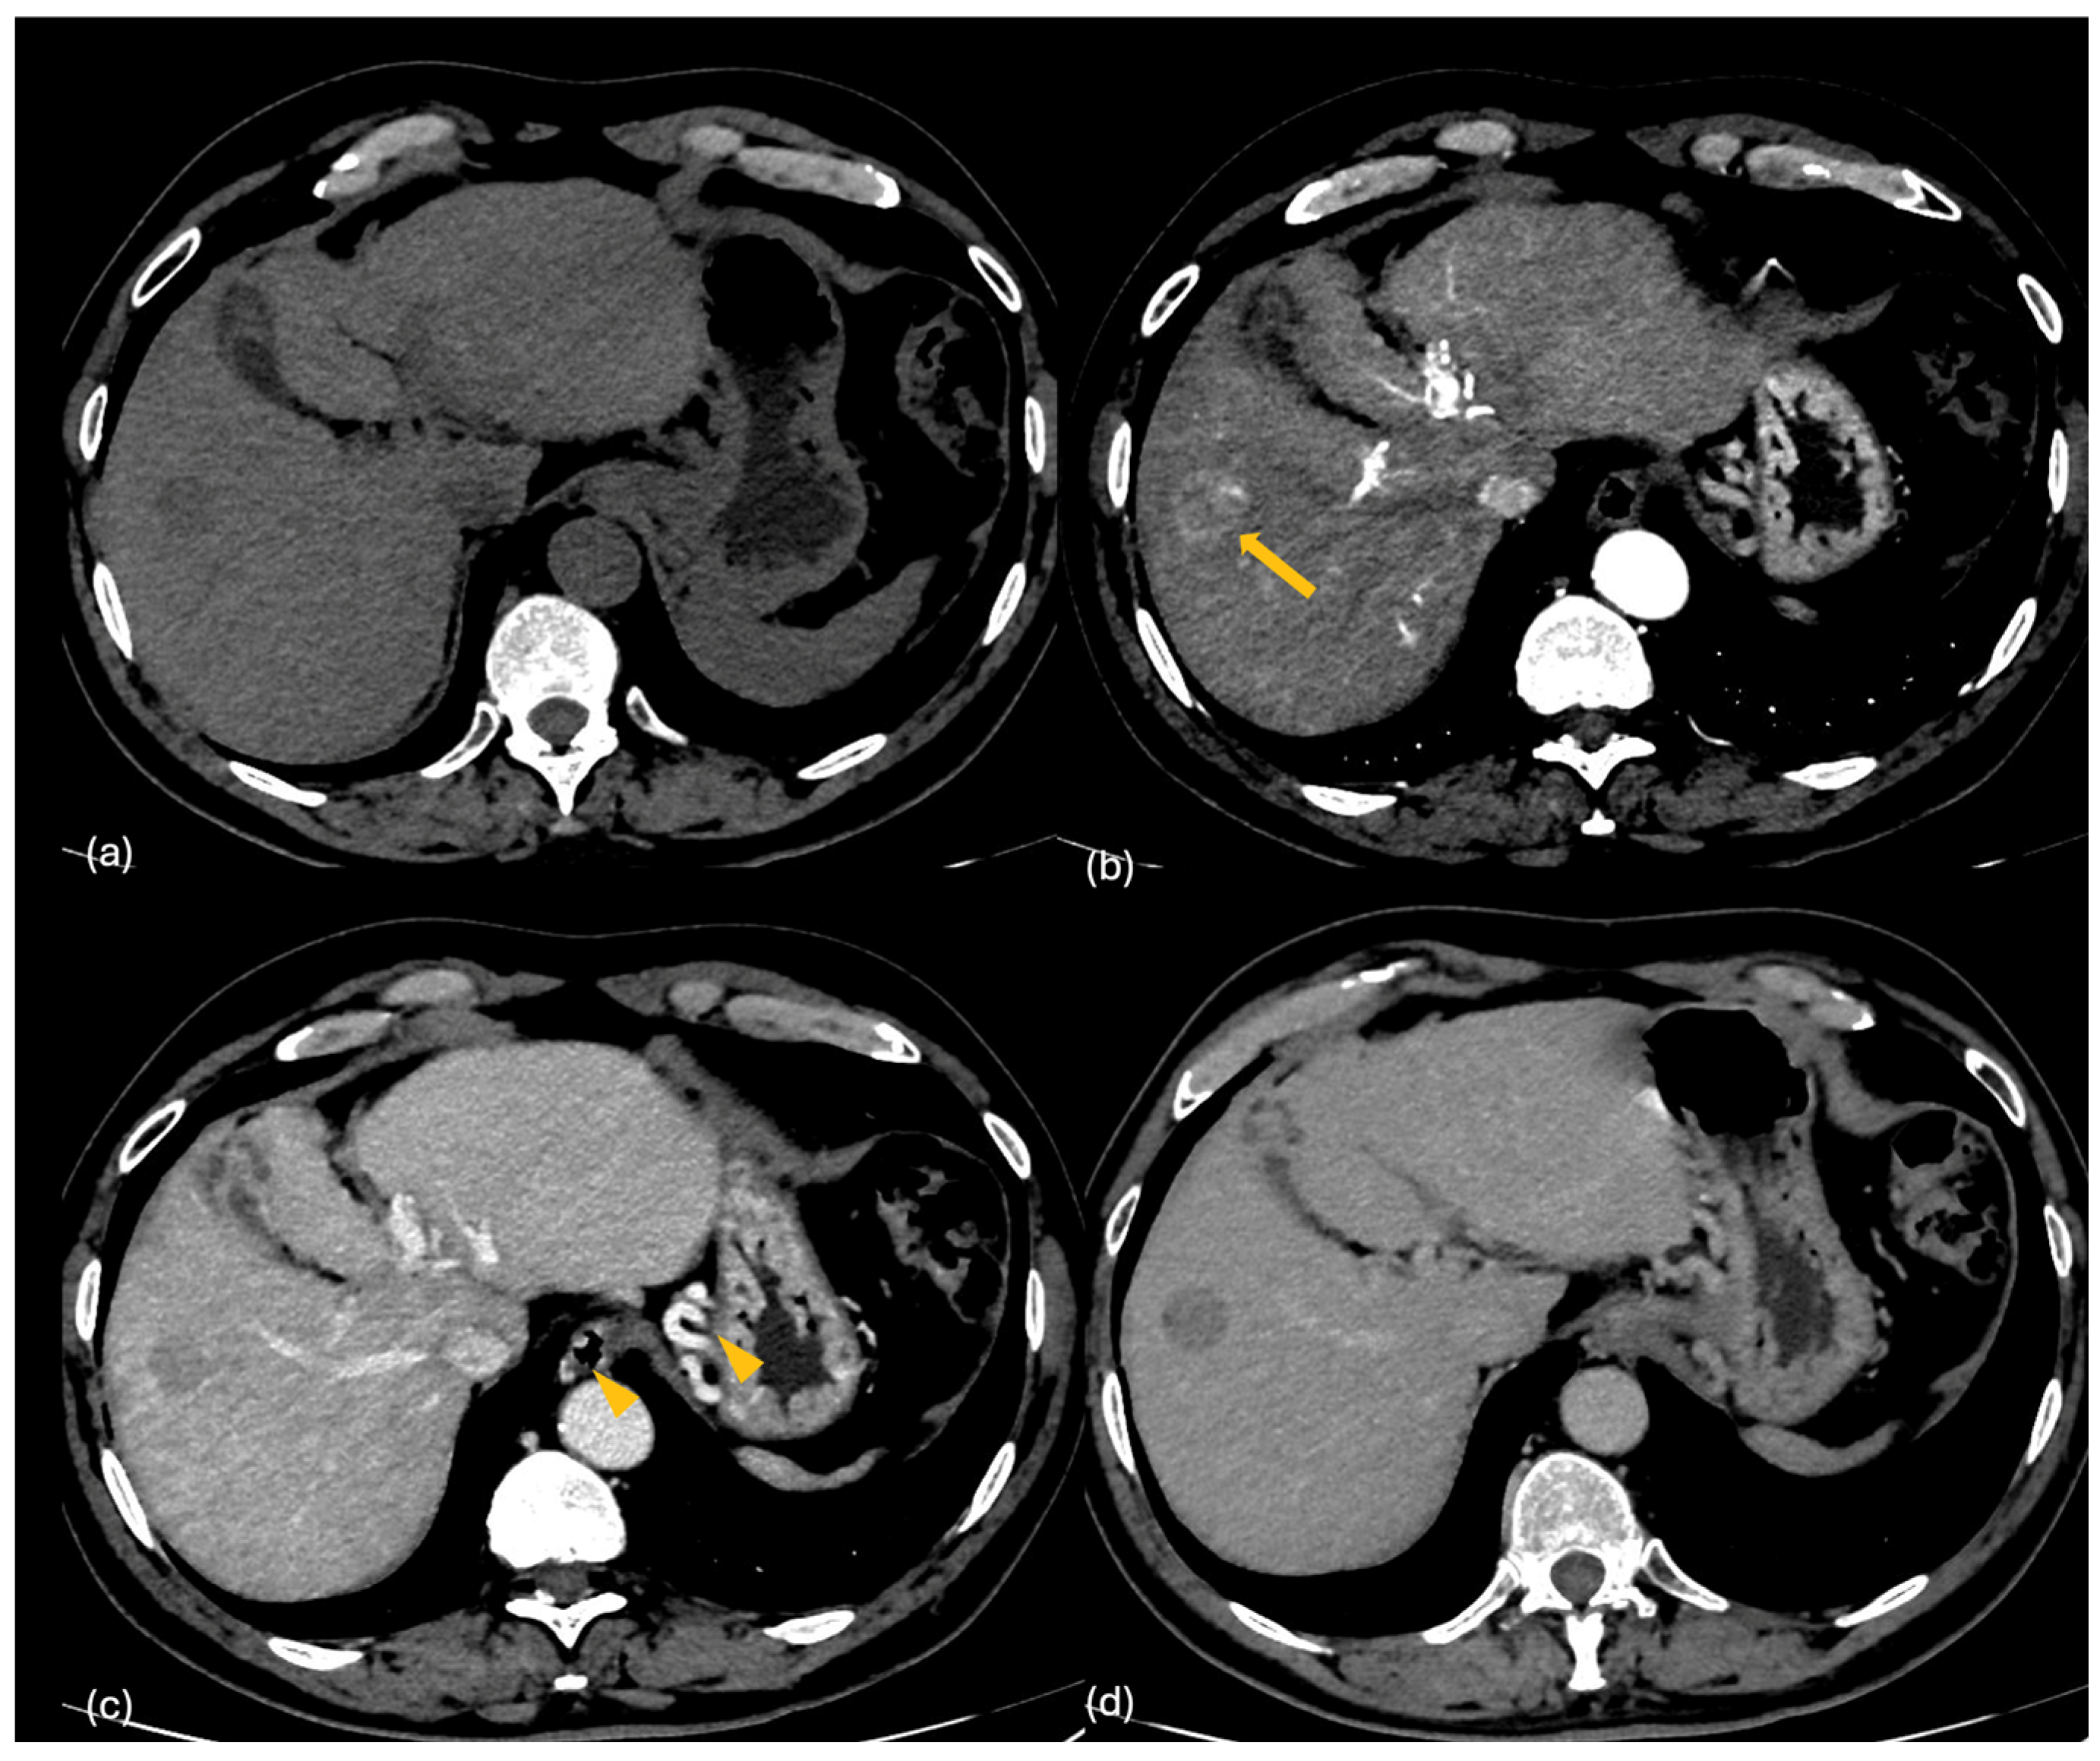
2.2. CT
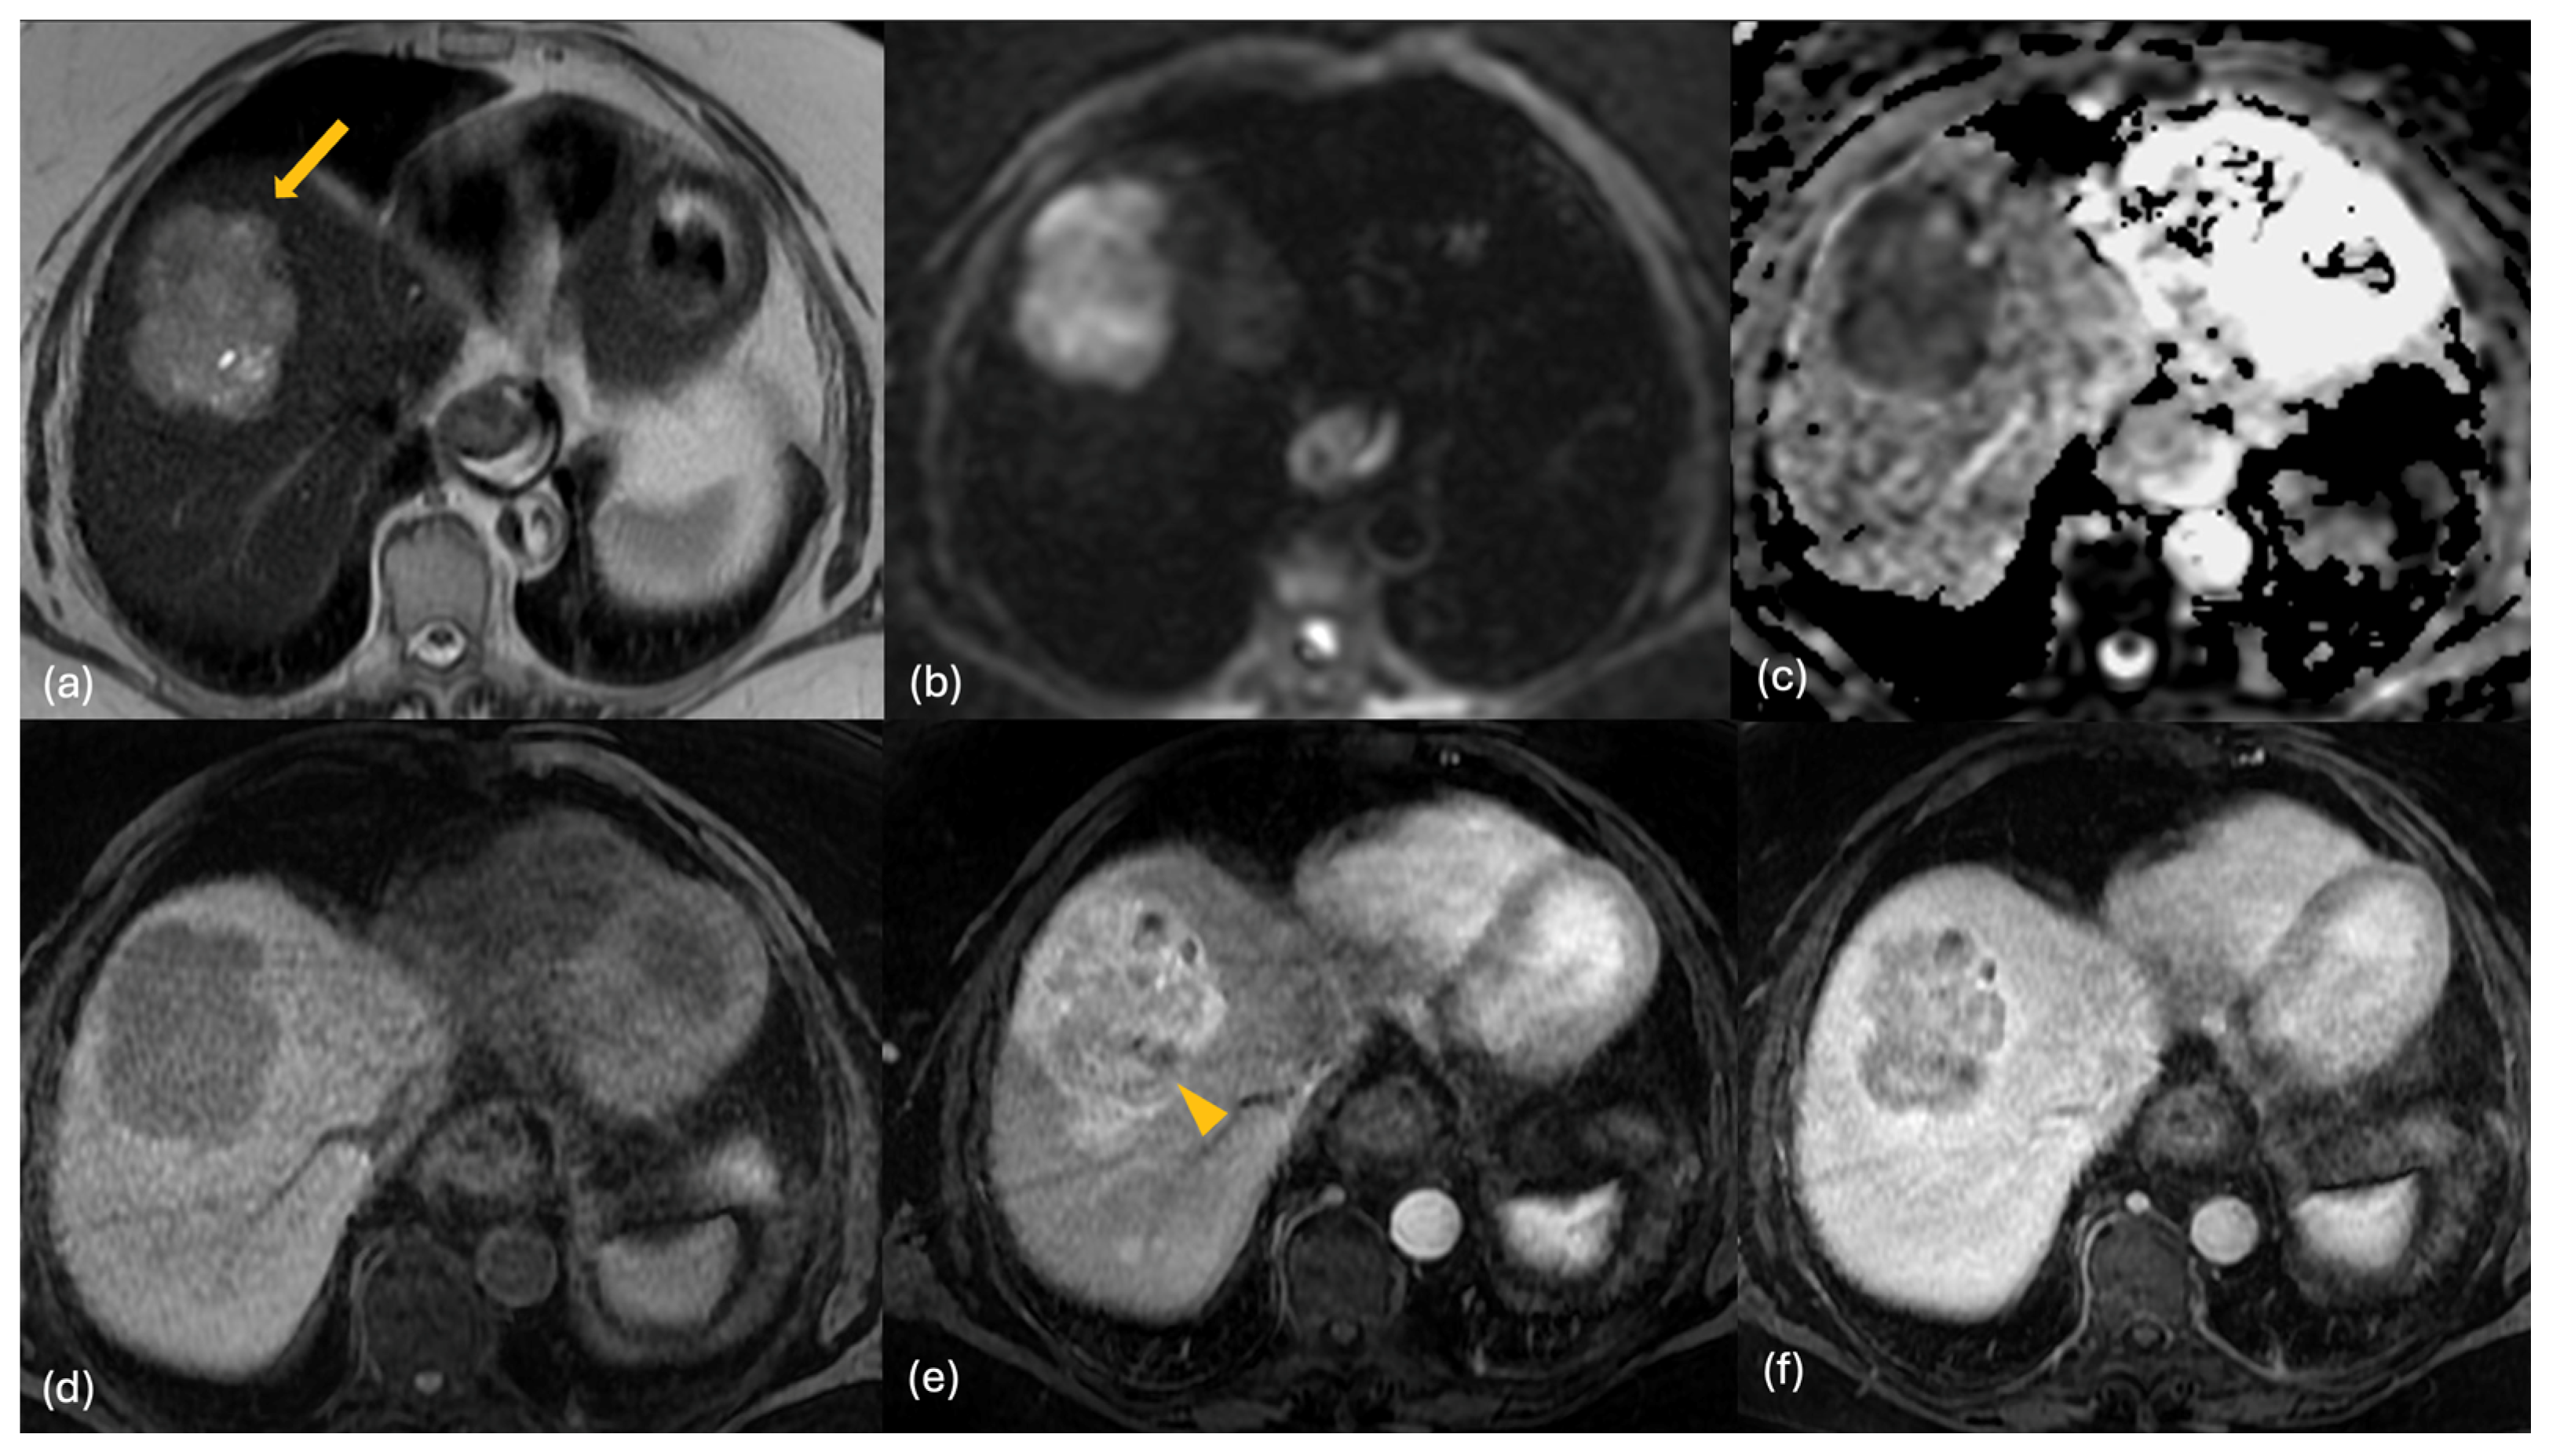
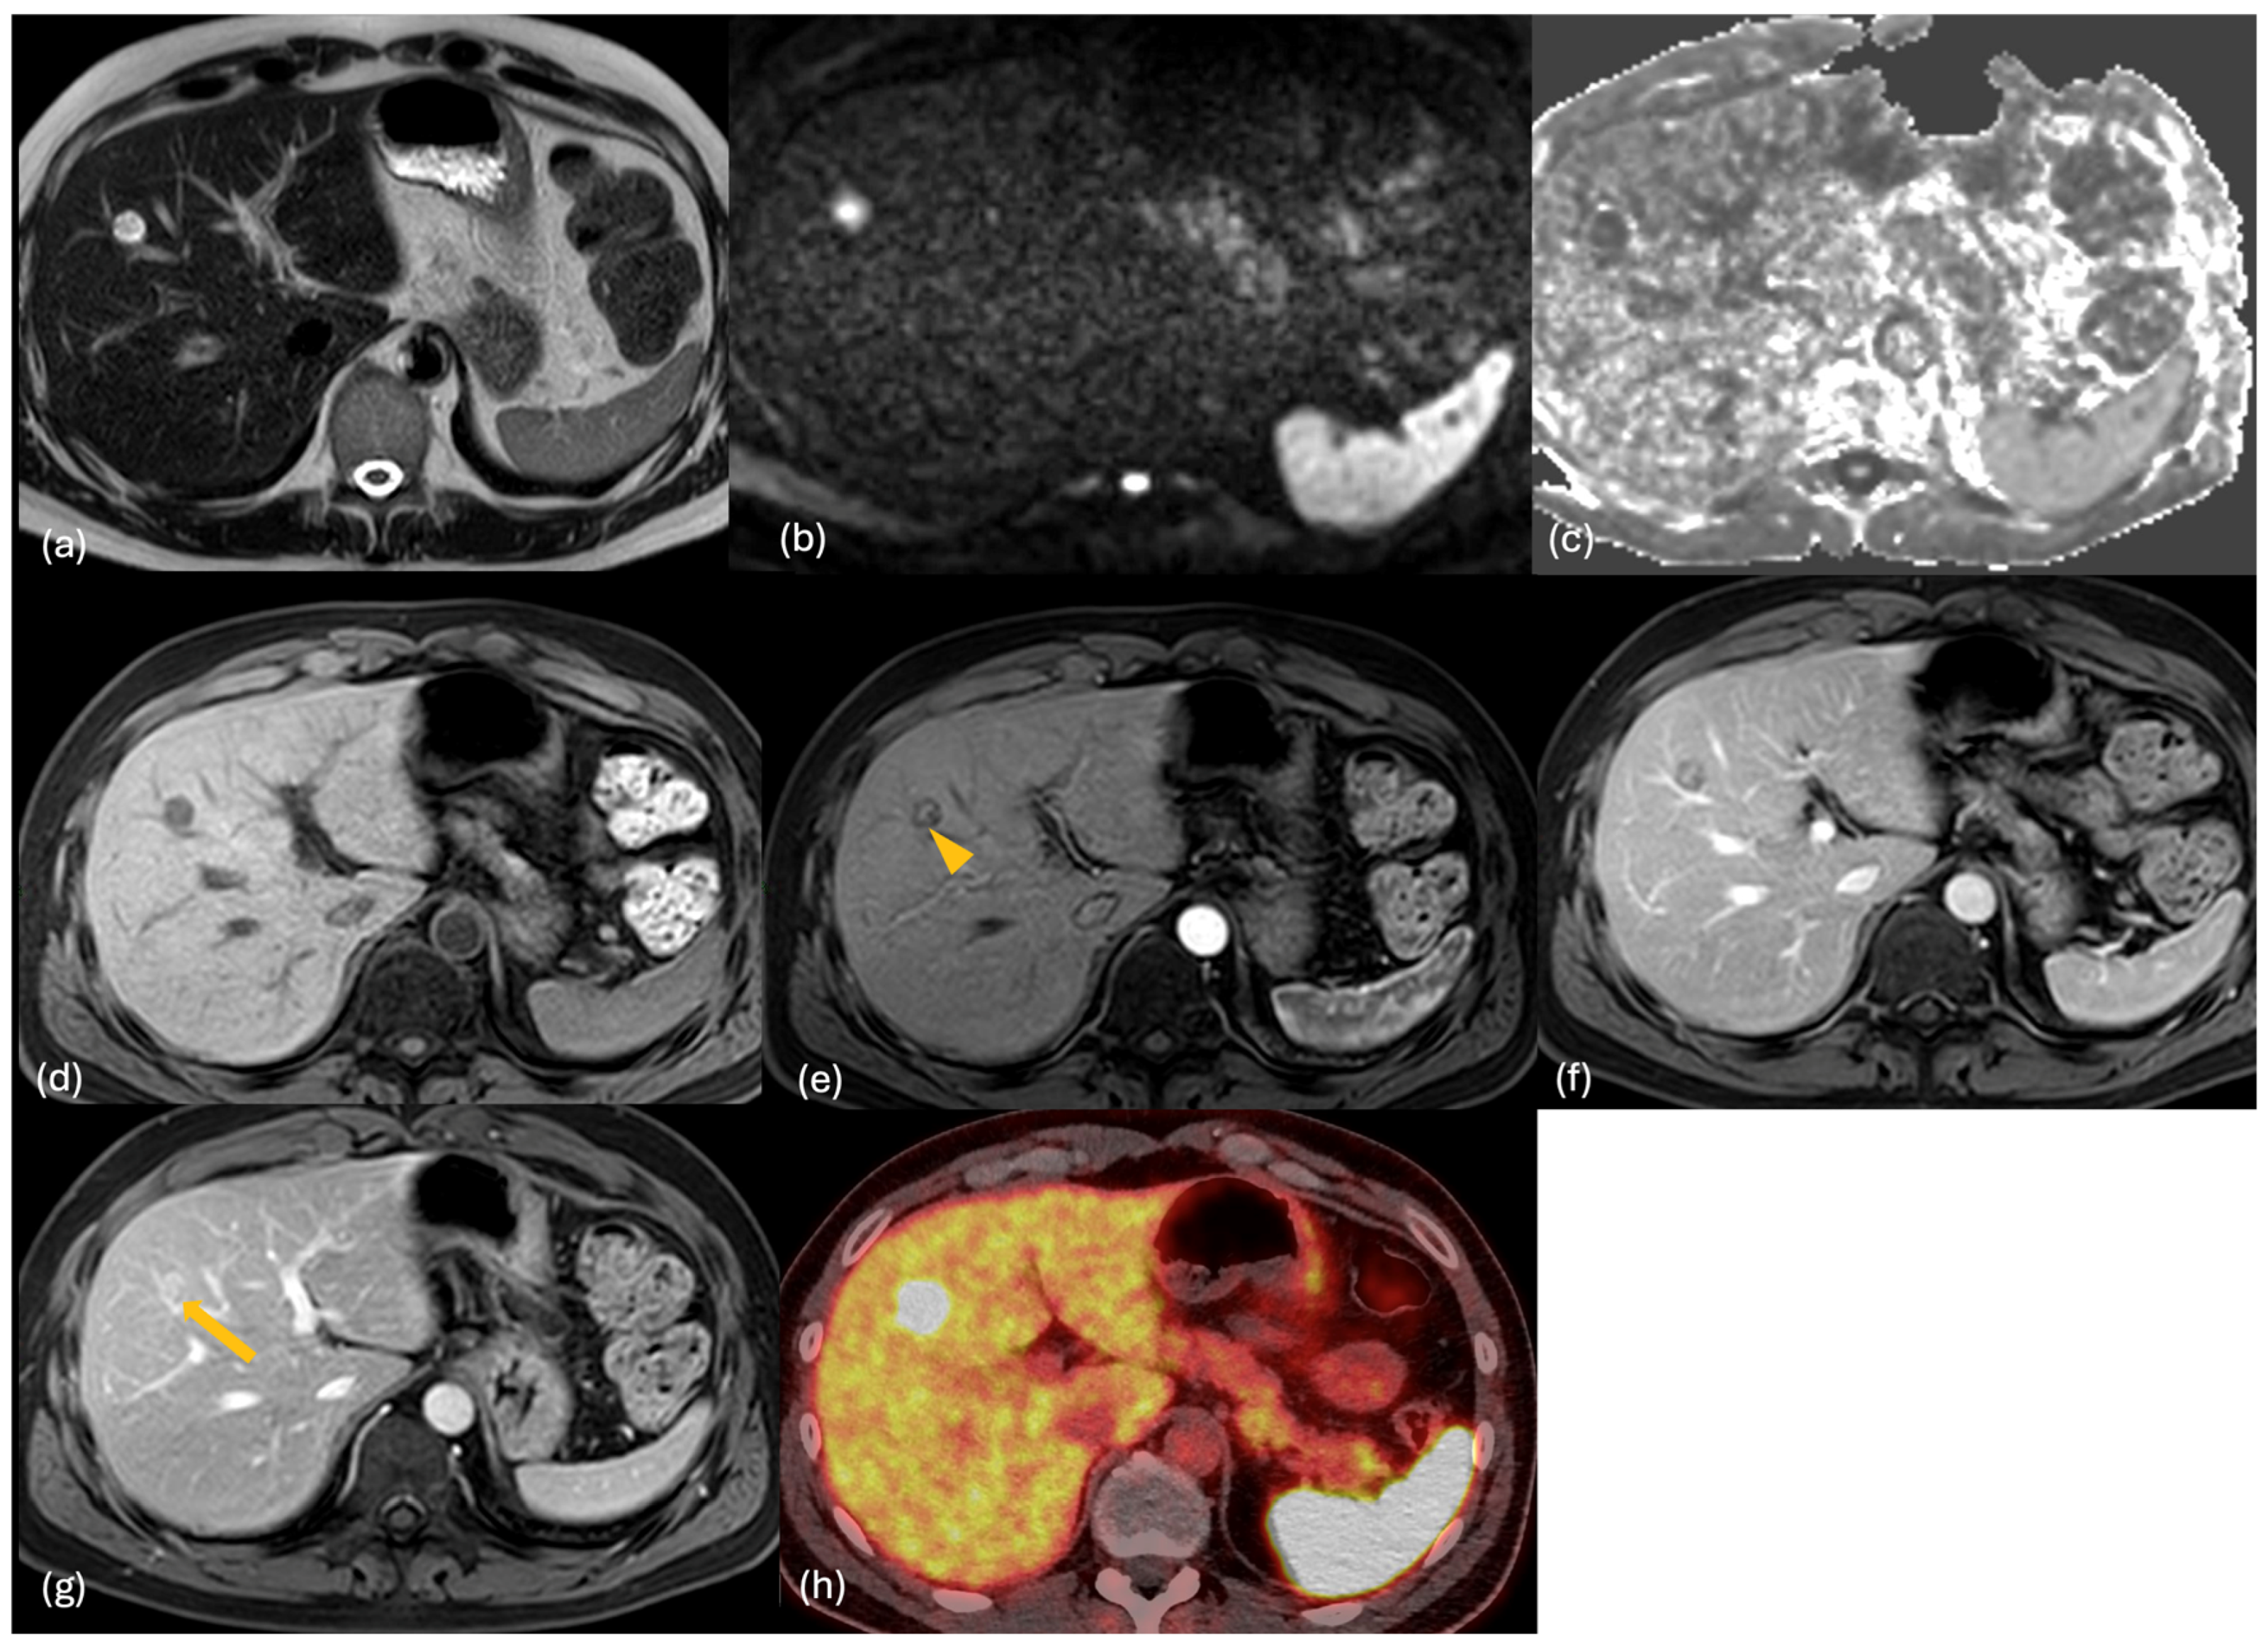
2.3. MRI
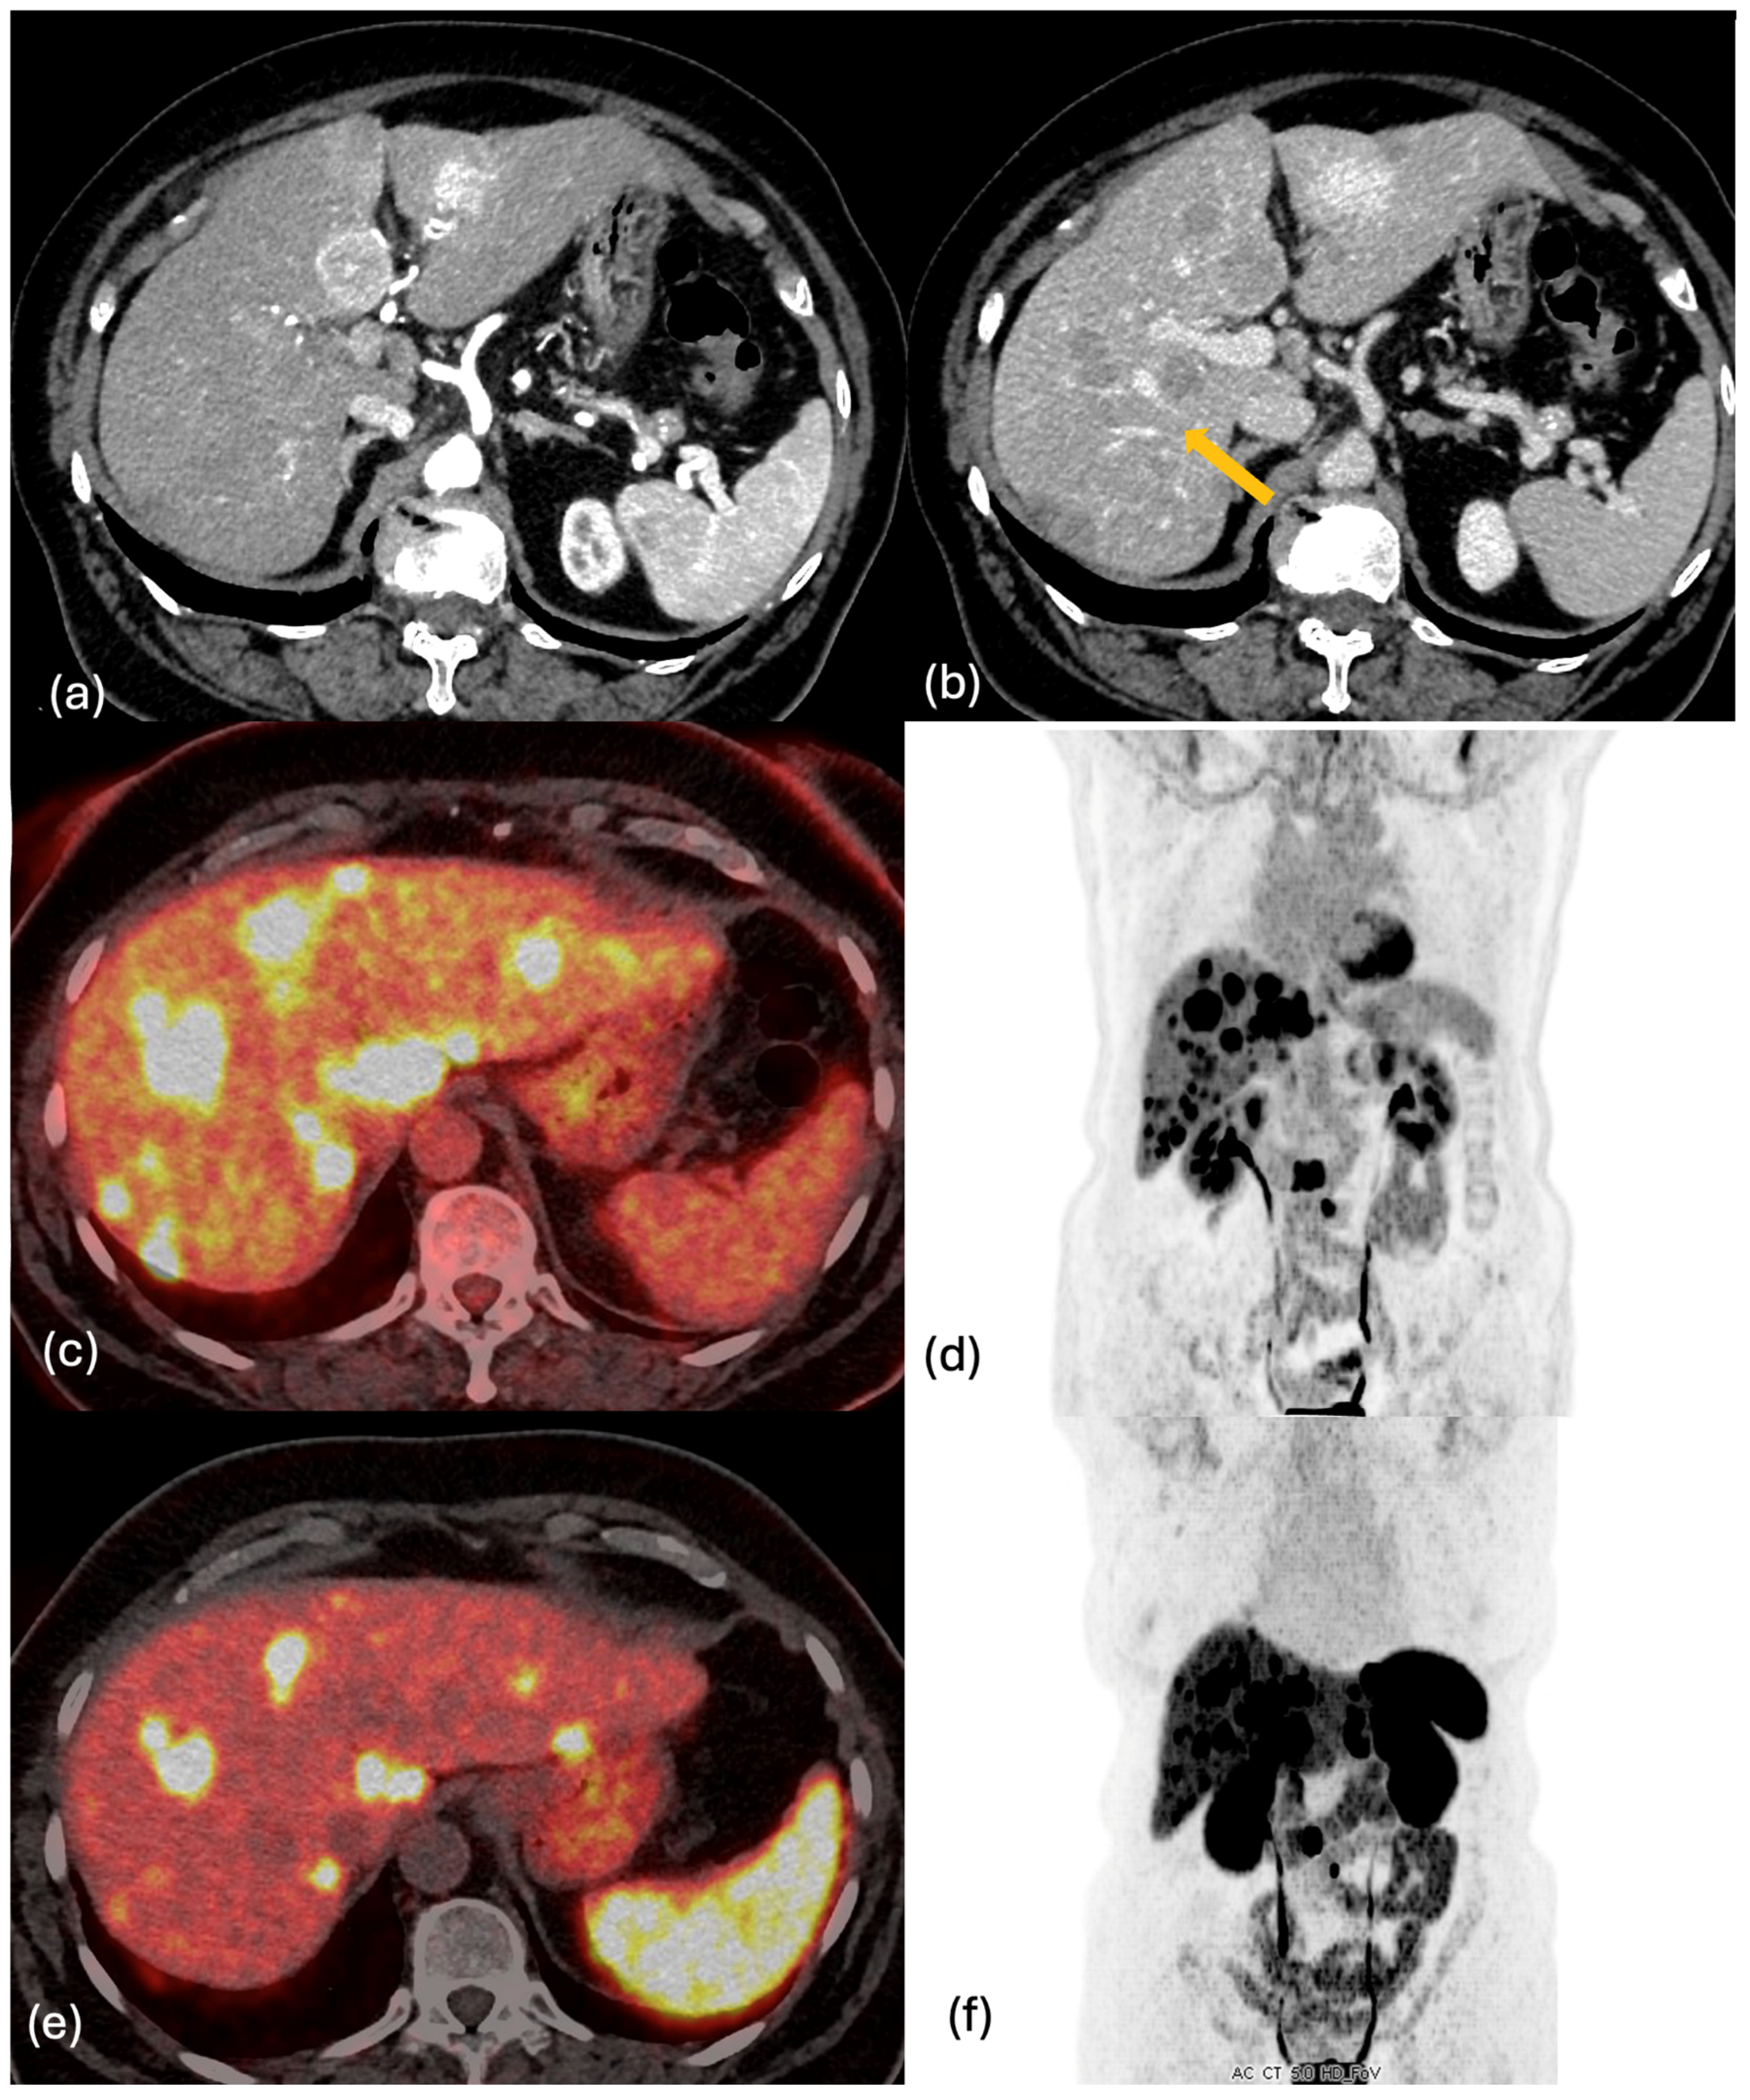
2.4. PET-CT
3. Differential Diagnosis
4. Conclusions
Author Contributions
Funding
Institutional Review Board Statement
Informed Consent Statement
Data Availability Statement
Conflicts of Interest
Abbreviations
| NETs | Neuroendocrine tumors |
| GEP | Gastro-entero-pancreatic |
| WHO | World Health Organization |
| P-NETs | Pancreatic NETs |
| ENETS | European Neuroendocrine Tumor Society |
| HPF | High-Power Field |
| NEC | Neuroendocrine Carcinoma |
| US | Ultrasound |
| CT | Computed Tomography |
| MRI | Magnetic Resonance Imaging |
| PET | Positron Emission Tomography |
| GE-NETs | Gastro-Enteric NETs |
| ESGAR | European Society of Gastrointestinal and Abdominal Radiology |
| DWI | Diffusion Weighted Imaging |
| ADC | Apparent Diffusion Coefficient |
| Gd-BOPTA | Gadobenate dimeglumine |
| Gd-EOB-DTPA | Gadoxetic acid |
| CEUS | Contrast-Enhanced Ultrasound |
| FDG | Fluorodeoxyglucose |
| PRRT | Peptide Receptor Radionuclide Therapy |
| NCCN | National Comprehensive Cancer Network |
| SSTR | Somatostatin Receptor |
| FNH | Focal Nodular Hyperplasia |
| HCC | Hepatocellular Carcinoma |
| GIST | Gastrointestinal Stromal Tumor |
| TSH | Thyroid-Stimulating Hormone |
| AFP | Alpha-Fetoprotein |
| DECT | Dual-Energy CT |
| ICC | Intrahepatic Cholangiocarcinoma |
References
- Fraenkel, M.; Faggiano, A.; Valk, G.D. Epidemiology of Neuroendocrine Tumors. Front. Horm. Res. 2015, 44, 1–23. [Google Scholar] [CrossRef] [PubMed]
- Sahani, D.V.; Bonaffini, P.A.; Fernández-Del Castillo, C.; Blake, M.A. Gastroenteropancreatic neuroendocrine tumors: Role of imaging in diagnosis and management. Radiology 2013, 266, 38–61. [Google Scholar] [CrossRef] [PubMed]
- Öberg, K.E. Gastrointestinal neuroendocrine tumors. Ann. Oncol. 2010, 21, 72–80. [Google Scholar] [CrossRef] [PubMed]
- Kos-Kudła, B.; Blicharz-Dorniak, J.; Strzelczyk, J.; Bałdys-Waligórska, A.; Bednarczuk, T.; Bolanowski, M.; Boratyn-Nowicka, A.; Borowska, M.; Cichocki, A.; Ćwikła, J.B.; et al. Diagnostic and therapeutic guidelines for gastro-entero-pancreatic neuroendocrine neoplasms (recommended by the Polish Network of Neuroendocrine Tumours). Endokrynol. Pol. 2017, 68, 79–110. [Google Scholar] [CrossRef] [PubMed]
- Niederle, M.B.; Hackl, M.; Kaserer, K.; Niederle, B. Gastroenteropancreatic neuroendocrine tumours: The current incidence and staging based on the WHO and European Neuroendocrine Tumour Society classification: An analysis based on prospectively collected parameters. Endocr. Relat. Cancer 2010, 17, 909–918. [Google Scholar] [CrossRef] [PubMed]
- Couvelard, A.; Cazes, A.; Cros, J. Updates in histopathological classification and tissue biomarkers of digestive neuroendocrine neoplasms: What the clinician should know. Best Pract. Res. Clin. Endocrinol. Metab. 2023, 37, 101795. [Google Scholar] [CrossRef] [PubMed]
- Geurts, J.L. Inherited syndromes involving pancreatic neuroendocrine tumors. J. Gastrointest. Oncol. 2020, 11, 559–566. [Google Scholar] [CrossRef] [PubMed]
- Yalcin, S.; Bayram, F.; Erdamar, S.; Kucuk, O.; Oruc, N.; Coker, A. Gastroenteropancreatic neuroendocrine tumors: Recommendations of Turkish multidisciplinary neuroendocrine tumor study group on diagnosis, treatment and follow-up. Arch. Med. Sci. 2017, 13, 271–282. [Google Scholar] [CrossRef] [PubMed]
- Dillon, J.S. Workup of Gastroenteropancreatic Neuroendocrine Tumors. Surg. Oncol. Clin. N. Am. 2020, 29, 165–183. [Google Scholar] [CrossRef] [PubMed]
- Ma, Z.; Cai, H.; Cui, Y. Progress in the treatment of esophageal neuroendocrine carcinoma. Tumour Biol. 2017, 39, 1010428317711313. [Google Scholar] [CrossRef] [PubMed]
- Wu, J.; Sun, C.; Li, E.; Wang, J.; He, X.; Yuan, R.; Yi, C.; Liao, W.; Wu, L. Non-functional pancreatic neuroendocrine tumours: Emerging trends in incidence and mortality. BMC Cancer 2019, 19, 334. [Google Scholar] [CrossRef] [PubMed]
- Regolo, M.; Cardaci, N.; Salmeri, C.; Laudani, A.; Colaci, M.; Ippolito, M.; Motta, F.; Magrì, S.; Parisi, S.; Torcitto, A.G.; et al. Pancreatic Neuroendocrine Tumor (Pan-NET) Presented by Abdominal Pain: A Case Report and Literature Review. J. Clin. Med. 2023, 12, 6617. [Google Scholar] [CrossRef] [PubMed]
- Fang, J.M.; Shi, J. A Clinicopathologic and Molecular Update of Pancreatic Neuroendocrine Neoplasms with a Focus on the New World Health Organization Classification. Arch. Pathol. Lab. Med. 2019, 143, 1317–1326. [Google Scholar] [CrossRef] [PubMed]
- Sprague, J.E.; Arbeláez, A.M. Glucose counterregulatory responses to hypoglycemia. Pediatr. Endocrinol. Rev. 2011, 9, 463–473, quiz 474–475. [Google Scholar] [PubMed]
- Epelboym, I.; Mazeh, H. Zollinger-Ellison syndrome: Classical considerations and current controversies. Oncologist 2014, 19, 44–50. [Google Scholar] [CrossRef] [PubMed]
- Song, X.; Zheng, S.; Yang, G.; Xiong, G.; Cao, Z.; Feng, M.; Zhang, T.; Zhao, Y. Glucagonoma and the glucagonoma syndrome. Oncol. Lett. 2018, 15, 2749–2755. [Google Scholar] [CrossRef] [PubMed]
- Oronsky, B.; Ma, P.C.; Morgensztern, D.; Carter, C.A. Nothing but NET: A Review of Neuroendocrine Tumors and Carcinomas. Neoplasia 2017, 19, 991–1002. [Google Scholar] [CrossRef] [PubMed]
- Ito, T.; Lee, L.; Jensen, R.T. Carcinoid-syndrome: Recent advances, current status and controversies. Curr. Opin. Endocrinol. Diabetes Obes. 2018, 25, 22–35. [Google Scholar] [CrossRef] [PubMed]
- Yoon, S.N.; Yu, C.S.; Shin, U.S.; Kim, C.W.; Lim, S.B.; Kim, J.C. Clinicopathological characteristics of rectal carcinoids. Int. J. Color. Dis. 2010, 25, 1087–1092. [Google Scholar] [CrossRef] [PubMed]
- Klöppel, G.; Couvelard, A.; Perren, A.; Komminoth, P.; McNicol, A.M.; Nilsson, O.; Scarpa, A.; Scoazec, J.Y.; Wiedenmann, B.; Papotti, M.; et al. ENETS Consensus Guidelines for the Standards of Care in Neuroendocrine Tumors: Towards a Standardized Approach to the Diagnosis of Gastroenteropancreatic Neuroendocrine Tumors and Their Prognostic Stratification. Neuroendocrinology 2009, 90, 162–166, Erratum in: Neuroendocrinology 2009, 90, 432. Erratum in: Neuroendocrinology 2010, 92, 197. Erratum in: Neuroendocrinology 2010, 92, 251. [Google Scholar] [CrossRef] [PubMed]
- Pavel, M.; Baudin, E.; Couvelard, A.; Krenning, E.; Öberg, K.; Steinmüller, T.; Anlauf, M.; Wiedenmann, B.; Salazar, R.; Barcelona Consensus Conference participants. ENETS Consensus Guidelines for the Management of Patients with Liver and Other Distant Metastases from Neuroendocrine Neoplasms of Foregut, Midgut, Hindgut, and Unknown Primary. Neuroendocrinology 2012, 95, 157–176. [Google Scholar] [CrossRef] [PubMed]
- Mayo, S.C.; de Jong, M.C.; Pulitano, C.; Clary, B.M.; Reddy, S.K.; Gamblin, T.C.; Celinksi, S.A.; Kooby, D.A.; Staley, C.A.; Stokes, J.B.; et al. Surgical management of hepatic neuroendocrine tumor metastasis: Results from an international multi-institutional analysis. Ann. Surg. Oncol. 2010, 17, 3129–3136. [Google Scholar] [CrossRef] [PubMed]
- Durante, C.; Boukheris, H.; Dromain, C.; Duvillard, P.; Leboulleux, S.; Elias, D.; de Baere, T.; Malka, D.; Lumbroso, J.; Guigay, J.; et al. Prognostic factors influencing survival from metastatic (stage IV) gastroenteropancreatic well-differentiated endocrine carcinoma. Endocr. Relat. Cancer 2009, 16, 585–597. [Google Scholar] [CrossRef] [PubMed]
- Kitajima, K.; Shiomi, H.; Kihara, T.; Hirono, S.; Nakano, R.; Okamoto, T.; Yagi, C.; Eda, H.; Matsuda, K.; Hatano, M.; et al. Detection of Abdominal Lymph Node Metastasis from Pancreatic Neuroendocrine Tumor by Somatostatin Receptor Scintigraphy: Comparison with Somatostatin Receptor Type 2 Immunostaining. Case Rep. Oncol. 2023, 16, 537–543. [Google Scholar] [CrossRef] [PubMed]
- Garrou, F.; Sacchetti, G.M.; Leva, L.; Andreatta, P.; Brambilla, M.; Morbelli, S.; Carriero, A. Transarterial radioembolization in neuroendocrine liver metastases 25 years later: A systematic review. Crit. Rev. Oncol. Hematol. 2025, 210, 104697. [Google Scholar] [CrossRef] [PubMed]
- Dromain, C.; Déandréis, D.; Scoazec, J.Y.; Goere, D.; Ducreux, M.; Baudin, E.; Tselikas, L. Imaging of neuroendocrine tumors of the pancreas. Diagn. Interv. Imaging 2016, 97, 1241–1257. [Google Scholar] [CrossRef] [PubMed]
- D’Onofrio, M.; Mansueto, G.; Falconi, M.; Procacci, C. Neuroendocrine pancreatic tumor: Value of contrast enhanced ultrasonography. Abdom. Imaging 2004, 29, 246–258. [Google Scholar] [CrossRef] [PubMed]
- Cui, Y.; Li, X.; Gao, S.; Li, Z.; Li, Y.; Lu, M.; Sun, Y. Utility of CT in differentiating liver metastases of well-differentiated gastroenteropancreatic neuroendocrine neoplasms from poorly-differentiated neuroendocrine neoplasms. Chin. J. Cancer Res. 2018, 30, 31–39. [Google Scholar] [CrossRef] [PubMed]
- Hoeffel, C.; Job, L.; Ladam-Marcus, V.; Vitry, F.; Cadiot, G.; Marcus, C. Detection of hepatic metastases from carcinoid tumor: Prospective evaluation of contrast-enhanced ultrasonography. Dig. Dis. Sci. 2009, 54, 2040–2046. [Google Scholar] [CrossRef] [PubMed]
- Dörffel, Y.; Wermke, W. Neuroendocrine tumors: Characterization with contrast-enhanced ultrasonography. Ultraschall Der Med. Eur. J. Ultrasound 2008, 29, 506–514. [Google Scholar] [CrossRef] [PubMed]
- Massironi, S.; Conte, D.; Sciola, V.; Pirola, L.; Paggi, S.; Fraquelli, M.; Ciafardini, C.; Spampatti, M.P.; Peracchi, M. Contrast-enhanced ultrasonography in evaluating hepatic metastases from neuroendocrine tumours. Dig. Liver Dis. 2010, 42, 635–641. [Google Scholar] [CrossRef] [PubMed]
- Gulpinar, B.; Peker, E.; Kul, M.; Elhan, A.H.; Haliloglu, N. Liver metastases of neuroendocrine tumors: Is it possible to diagnose different histologic subtypes depending on multiphasic CT features? Abdom. Radiol. 2019, 44, 2147–2155. [Google Scholar] [CrossRef] [PubMed]
- Ronot, M.; Cuccioli, F.; Dioguardi Burgio, M.; Vullierme, M.P.; Hentic, O.; Ruszniewski, P.; d’Assignies, G.; Vilgrain, V. Neuroendocrine liver metastases: Vascular patterns on triple-phase MDCT are indicative of primary tumour location. Eur. J. Radiol. 2017, 89, 156–162. [Google Scholar] [CrossRef] [PubMed]
- Foley, W.D.; Mallisee, T.A.; Hohenwalter, M.D.; Wilson, C.R.; Quiroz, F.A.; Taylor, A.J. Multiphase hepatic CT with a multirow detector CT scanner. AJR Am. J. Roentgenol. 2000, 175, 679–685. [Google Scholar] [CrossRef] [PubMed]
- Ronot, M.; Clift, A.K.; Baum, R.P.; Singh, A.; Kulkarni, H.R.; Frilling, A.; Vilgrain, V. Morphological and Functional Imaging for Detecting and Assessing the Resectability of Neuroendocrine Liver Metastases. Neuroendocrinology 2018, 106, 74–88. [Google Scholar] [CrossRef] [PubMed]
- Dromain, C.; de Baere, T.; Baudin, E.; Galline, J.; Ducreux, M.; Boige, V.; Duvillard, P.; Laplanche, A.; Caillet, H.; Lasser, P.; et al. MR imaging of hepatic metastases caused by neuroendocrine tumors: Comparing four techniques. AJR Am. J. Roentgenol. 2003, 180, 121–128. [Google Scholar] [CrossRef] [PubMed]
- Khanna, L.; Prasad, S.R.; Sunnapwar, A.; Kondapaneni, S.; Dasyam, A.; Tammisetti, V.S.; Salman, U.; Nazarullah, A.; Katabathina, V.S. Pancreatic Neuroendocrine Neoplasms: 2020 Update on Pathologic and Imaging Findings and Classification. Radiographics 2020, 40, 1240–1262. [Google Scholar] [CrossRef] [PubMed]
- Neri, E.; Bali, M.A.; Ba-Ssalamah, A.; Boraschi, P.; Brancatelli, G.; Alves, F.C.; Grazioli, L.; Helmberger, T.; Lee, J.M.; Manfredi, R.; et al. ESGAR consensus statement on liver MR imaging and clinical use of liver-specific contrast agents. Eur. Radiol. 2016, 26, 921–931. [Google Scholar] [CrossRef] [PubMed]
- Hayoz, R.; Vietti-Violi, N.; Duran, R.; Knebel, J.F.; Ledoux, J.B.; Dromain, C. The combination of hepatobiliary phase with Gd-EOB-DTPA and DWI is highly accurate for the detection and characterization of liver metastases from neuroendocrine tumor. Eur. Radiol. 2020, 30, 6593–6602. [Google Scholar] [CrossRef] [PubMed]
- Maino, C.; Vernuccio, F.; Cannella, R.; Cortese, F.; Franco, P.N.; Gaetani, C.; Giannini, V.; Inchingolo, R.; Ippolito, D.; Defeudis, A.; et al. Liver metastases: The role of magnetic resonance imaging. World J. Gastroenterol. 2023, 29, 5180–5197. [Google Scholar] [CrossRef] [PubMed]
- Sharma, A.; Muralitharan, M.; Ramage, J.; Clement, D.; Menon, K.; Srinivasan, P.; Elmasry, M.; Reed, N.; Seager, M.; Srirajaskanthan, R. Current Management of Neuroendocrine Tumour Liver Metastases. Curr. Oncol. Rep. 2024, 26, 1070–1084. [Google Scholar] [CrossRef] [PubMed]
- Karaosmanoglu, A.D.; Onur, M.R.; Ozmen, M.N.; Akata, D.; Karcaaltincaba, M. Magnetic Resonance Imaging of Liver Metastasis. Semin. Ultrasound CT MR 2016, 37, 533–548. [Google Scholar] [CrossRef] [PubMed]
- d’Assignies, G.; Fina, P.; Bruno, O.; Vullierme, M.P.; Tubach, F.; Paradis, V.; Sauvanet, A.; Ruszniewski, P.; Vilgrain, V. High sensitivity of diffusion-weighted MR imaging for the detection of liver metastases from neuroendocrine tumors: Comparison with T2-weighted and dynamic gadolinium-enhanced MR imaging. Radiology 2013, 268, 390–399. [Google Scholar] [CrossRef] [PubMed]
- Lestra, T.; Kanagaratnam, L.; Mulé, S.; Janvier, A.; Brixi, H.; Cadiot, G.; Dohan, A.; Hoeffel, C. Measurement variability of liver metastases from neuroendocrine tumors on different magnetic resonance imaging sequences. Diagn. Interv. Imaging 2018, 99, 73–81. [Google Scholar] [CrossRef] [PubMed]
- Karademir, I.; Ward, E.; Peng, Y.; Wise, L.; Buckle, C.; Kunnavakkam, R.; Oto, A. Measurements of Hepatic Metastasis on MR Imaging: Assessment of Interobserver and Intersequence Variability. Acad. Radiol. 2016, 23, 132–143. [Google Scholar] [CrossRef] [PubMed]
- Grazzini, G.; Danti, G.; Cozzi, D.; Lanzetta, M.M.; Addeo, G.; Falchini, M.; Masserelli, A.; Pradella, S.; Miele, V. Diagnostic imaging of gastrointestinal neuroendocrine tumours (GI-NETs): Relationship between MDCT features and 2010 WHO classification. Radiol. Med. 2019, 124, 94–102. [Google Scholar] [CrossRef] [PubMed]
- Poeppel, T.D.; Binse, I.; Petersenn, S.; Lahner, H.; Schott, M.; Antoch, G.; Brandau, W.; Bockisch, A.; Boy, C. 68Ga-DOTATOC versus 68Ga-DOTATATE PET/CT in functional imaging of neuroendocrine tumors. J. Nucl. Med. 2011, 52, 1864–1870. [Google Scholar] [CrossRef] [PubMed]
- Haug, A.R.; Auernhammer, C.J.; Wängler, B.; Schmidt, G.P.; Uebleis, C.; Göke, B.; Cumming, P.; Bartenstein, P.; Tiling, R.; Hacker, M. 68Ga-DOTATATE PET/CT for the early prediction of response to somatostatin receptor-mediated radionuclide therapy in patients with well-differentiated neuroendocrine tumors. J. Nucl. Med. 2010, 51, 1349–1356. [Google Scholar] [CrossRef] [PubMed]
- Sanli, Y.; Garg, I.; Kandathil, A.; Kendi, T.; Zanetti, M.J.B.; Kuyumcu, S.; Subramaniam, R.M. Neuroendocrine Tumor Diagnosis and Management: 68Ga-DOTATATE PET/CT. AJR Am. J. Roentgenol. 2018, 211, 267–277. [Google Scholar] [CrossRef] [PubMed]
- Fabritius, M.P.; Soltani, V.; Cyran, C.C.; Ricke, J.; Bartenstein, P.; Auernhammer, C.J.; Spitzweg, C.; Schnitzer, M.L.; Ebner, R.; Mansournia, S.; et al. Diagnostic accuracy of SSR-PET/CT compared to histopathology in the identification of liver metastases from well-differentiated neuroendocrine tumors. Cancer Imaging 2023, 23, 92. [Google Scholar] [CrossRef] [PubMed]
- Krenning, E.P.; Valkema, R.; Kwekkeboom, D.J.; de Herder, W.W.; van Eijck, C.H.; de Jong, M.; Pauwels, S.; Reubi, J.C. Molecular imaging as in vivo molecular pathology for gastroenteropancreatic neuroendocrine tumors: Implications for follow-up after therapy. J. Nucl. Med. 2005, 46, 76S–82S. [Google Scholar] [PubMed]
- Kayani, I.; Bomanji, J.B.; Groves, A.; Conway, G.; Gacinovic, S.; Win, T.; Dickson, J.; Caplin, M.; Ell, P.J. Functional imaging of neuroendocrine tumors with combined PET/CT using 68Ga-DOTATATE (DOTA-DPhe1, Tyr3-octreotate) and 18F-FDG. Cancer 2008, 112, 2447–2455. [Google Scholar] [CrossRef] [PubMed]
- Binderup, T.; Knigge, U.; Loft, A.; Federspiel, B.; Kjaer, A. 18F-fluorodeoxyglucose positron emission tomography predicts survival of patients with neuroendocrine tumors. Clin. Cancer Res. 2010, 16, 978–985. [Google Scholar] [CrossRef] [PubMed]
- Fortunati, E.; Argalia, G.; Zanoni, L.; Fanti, S.; Ambrosini, V. New PET Radiotracers for the Imaging of Neuroendocrine Neoplasms. Curr. Treat. Options Oncol. 2022, 23, 703–720. [Google Scholar] [CrossRef] [PubMed]
- Stiegler, C.; Schießl, C.; Schäfer, C. Liver metastases in renal cell carcinoma: The vascularization pattern and the wash out phenomenon. J. Clin. Ultrasound 2023, 51, 1112–1114. [Google Scholar] [CrossRef] [PubMed]
- Lyu, Q.; Lin, D.; Tang, M.; Liu, D.; Zhang, J.; Wang, Y.; Shelat, V.G.; Raissi, D.; Ostwal, V.; Chen, X.; et al. 18F-FDG PET/CT and MR imaging features of liver metastases in gastrointestinal stromal tumors: A cross-sectional analysis. Ann. Transl. Med. 2022, 10, 1220. [Google Scholar] [CrossRef] [PubMed]
- Sadigh, G.; Applegate, K.E.; Baumgarten, D.A. Comparative accuracy of intravenous contrast-enhanced CT versus noncontrast CT plus intravenous contrast-enhanced CT in the detection and characterization of patients with hypervascular liver metastases: A critically appraised topic. Acad. Radiol. 2014, 21, 113–125. [Google Scholar] [CrossRef] [PubMed]
- Namasivayam, S.; Salman, K.; Mittal, P.K.; Martin, D.; Small, W.C. Hypervascular hepatic focal lesions: Spectrum of imaging features. Curr. Probl. Diagn. Radiol. 2007, 36, 107–123. [Google Scholar] [CrossRef] [PubMed]
- Terayama, N.; Matsui, O.; Ueda, K.; Kobayashi, S.; Sanada, J.; Gabata, T.; Kawamori, Y.; Kadoya, M. Peritumoral rim enhancement of liver metastasis: Hemodynamics observed on single-level dynamic CT during hepatic arteriography and histopathologic correlation. J. Comput. Assist. Tomogr. 2002, 26, 975–980. [Google Scholar] [CrossRef] [PubMed]
- Bai, X.; Wu, L.; Dai, J.; Wang, K.; Shi, H.; Lu, Z.; Ji, G.; Yu, J.; Xu, Q. Rim Enhancement and Peripancreatic Fat Stranding in Preoperative MDCT as Predictors for Occult Metastasis in PDAC Patients. Acad. Radiol. 2023, 30, 2954–2961. [Google Scholar] [CrossRef] [PubMed]
- Vernuccio, F.; Porrello, G.; Cannella, R.; Vernuccio, L.; Midiri, M.; Giannitrapani, L.; Soresi, M.; Brancatelli, G. Benign and malignant mimickers of infiltrative hepatocellular carcinoma: Tips and tricks for differential diagnosis on CT and MRI. Clin. Imaging 2021, 70, 33–45. [Google Scholar] [CrossRef] [PubMed]
- Kaltenbach, B.; Wichmann, J.L.; Pfeifer, S.; Albrecht, M.H.; Booz, C.; Lenga, L.; Hammerstingl, R.; D’Angelo, T.; Vogl, T.J.; Martin, S.S. Iodine quantification to distinguish hepatic neuroendocrine tumor metastasis from hepatocellular carcinoma at dual-source dual-energy liver CT. Eur. J. Radiol. 2018, 105, 20–24. [Google Scholar] [CrossRef] [PubMed]
- Sano, S.; Yamamoto, Y.; Sugiura, T.; Okamura, Y.; Ito, T.; Ashida, R.; Ohgi, K.; Aramaki, T.; Nakanuma, Y.; Uesaka, K. The Radiological Differentiation of Hypervascular Intrahepatic Cholangiocarcinoma from Hepatocellular Carcinoma with a Focus on the CT Value on Multi-Phase Enhanced CT. Anticancer Res. 2018, 38, 5505–5512. [Google Scholar] [CrossRef] [PubMed]
- Lee, J.E.; Kim, S.H.; Lee, S.; Choi, S.Y.; Hwang, J.A.; Woo, S.Y. Differentiating metastatic mucinous colorectal adenocarcinomas from simple cysts of the liver using contrast-enhanced and diffusion-weighted MRI. Br. J. Radiol. 2018, 91, 20180303. [Google Scholar] [CrossRef] [PubMed]
- Chung, H.J.; Seo, N.; Han, K.; Bae, H.; Chung, Y.E.; Jung, M.; Park, M.S. Gadoxetic acid-enhanced MRI for the detection of liver metastases from melanoma. PLoS ONE 2024, 19, e0313212. [Google Scholar] [CrossRef] [PubMed]
- Braga, L.; Semelka, R.C.; Pietrobon, R.; Martin, D.; de Barros, N.; Guller, U. Does hypervascularity of liver metastases as detected on MRI predict disease progression in breast cancer patients? AJR Am. J. Roentgenol. 2004, 182, 1207–1213. [Google Scholar] [CrossRef] [PubMed]
- Reizine, E.; Mulé, S.; Luciani, A. Focal Benign Liver Lesions and Their Diagnostic Pitfalls. Radiol. Clin. N. Am. 2022, 60, 755–773. [Google Scholar] [CrossRef] [PubMed]
- Prasad, S.R.; Wang, H.; Rosas, H.; Menias, C.O.; Narra, V.R.; Middleton, W.D.; Heiken, J.P. Fat-containing lesions of the liver: Radiologic-pathologic correlation. Radiographics 2005, 25, 321–331. [Google Scholar] [CrossRef] [PubMed]
- Gultekin, M.A.; Turk, H.M.; Yurtsever, I.; Cesme, D.H.; Seker, M.; Besiroglu, M.; Alkan, A. Apparent Diffusion Coefficient Values for Neuroendocrine Liver Metastases. Acad. Radiol. 2021, 28, S81–S86. [Google Scholar] [CrossRef] [PubMed]
- Parsai, A.; Miquel, M.E.; Jan, H.; Kastler, A.; Szyszko, T.; Zerizer, I. Improving liver lesion characterisation using retrospective fusion of FDG PET/CT and MRI. Clin. Imaging 2019, 55, 23–28. [Google Scholar] [CrossRef] [PubMed]
- Kurtaran, A.; Becherer, A.; Pfeffel, F.; Müller, C.; Traub, T.; Schmaljohann, J.; Kaserer, K.; Raderer, M.; Schima, W.; Dudczak, R.; et al. 18F-fluorodeoxyglucose (FDG)-PET features of focal nodular hyperplasia (FNH) of the liver. Liver 2000, 20, 487–490. [Google Scholar] [CrossRef] [PubMed]
- Şahin, O.E.; Uslu-Beşli, L.; Asa, S.; Sağer, S.; Sönmezoğlu, K. The role of 68Ga-DOTATATE PET/CT and 18F-FDG PET/CT in the follow-up of patients with medullary thyroid cancer. Hell. J. Nucl. Med. 2020, 23, 321–329. [Google Scholar] [CrossRef] [PubMed]
- Lund, M.; Bjerre, T.A.; Grønbæk, H.; Mortensen, F.V.; Andersen, P.K. CEUS compared with CECT, MRI, and FDG-PET/CT for diagnosing CRC liver metastases: A diagnostic test accuracy systematic review and meta-analysis. Expert. Rev. Gastroenterol. Hepatol. 2024, 18, 541–549. [Google Scholar] [CrossRef] [PubMed]


| Lesion | CT | MRI | 18F-FDG PET-CT | Features |
|---|---|---|---|---|
| Differentiated thyroid carcinoma metastasis | Hypervascular, possible wash-out | T1: hypo T2: hyper CM: arterial enhancement | Variable uptake | Less frequent than NETs |
| Clear cell renal carcinoma metastasis | Hypervascular, portal-phase wash-out | T1: hypo T2: heterogeneous DWI: restriction | Variable uptake | Irregular vascularization, heterogeneous lesion |
| Melanoma metastasis | Hypervascular, often multiple | T1: hyper T2: hypo/heterogeneous | High uptake | Hyperintense in T1 due to melanin or blood |
| Breast cancer metastasis | Some histotypes can be hypervascular | T1: usually hypo T2: heterogeneous | Good uptake | Usually multiple lesions |
| Liver hemangioma | Peripheral globular enhancement with progressive fill-in | T1: hypo T2: highly hyper | No uptake | Typical globular centripetal enhancement |
| Liver adenoma | Hypervascular, possible wash-out | T1: variable T2: variable | No uptake | Usually a single lesion, can contain fat or blood |
| Focal nodular hyperplasia (FNH) | Hypervascular, iso or hypodense in the delayed phase | T2: hypercentral scar CM: progressive enhancement | No uptake | Central scar, hepatobiliary enhancement after hepatospecific contrast medium |
| Angiomyolipoma | Hypervascular due to angioid component | T1 IN/OUT: foci of macroscopic fat CM: hyper | No uptake | Angioid and fat content |
| Hepatocellular carcinoma (HCC) | Hypervascular, delayed wash-out | T1: hypo T2: variable | Variable uptake | Often in a cirrhotic liver |
| Hypervascular intrahepatic cholangiocarcinoma | Hypervascular in the arterial phase | T1: hypo T2: hyper CM: arterial enhancement | Usually good uptake | Association with bile duct enlargement |
| Hypovascular intrahepatic cholangiocarcinoma | Hypovascular, progressive peripheral enhancement | T1: hypo T2: hyper CM: progressive enhancement | Usually good uptake | Association with bile duct enlargement |
Disclaimer/Publisher’s Note: The statements, opinions and data contained in all publications are solely those of the individual author(s) and contributor(s) and not of MDPI and/or the editor(s). MDPI and/or the editor(s) disclaim responsibility for any injury to people or property resulting from any ideas, methods, instructions or products referred to in the content. |
© 2025 by the authors. Licensee MDPI, Basel, Switzerland. This article is an open access article distributed under the terms and conditions of the Creative Commons Attribution (CC BY) license (https://creativecommons.org/licenses/by/4.0/).
Share and Cite
Posa, A.; Genco, E.; Barbieri, P.; Ariano, M.; Lippi, M.; Maresca, A.; Iezzi, R. Imaging of Liver Metastases from GEP-NETs: A Narrative Review. Onco 2025, 5, 36. https://doi.org/10.3390/onco5030036
Posa A, Genco E, Barbieri P, Ariano M, Lippi M, Maresca A, Iezzi R. Imaging of Liver Metastases from GEP-NETs: A Narrative Review. Onco. 2025; 5(3):36. https://doi.org/10.3390/onco5030036
Chicago/Turabian StylePosa, Alessandro, Enza Genco, Pierluigi Barbieri, Mario Ariano, Marcello Lippi, Alessandro Maresca, and Roberto Iezzi. 2025. "Imaging of Liver Metastases from GEP-NETs: A Narrative Review" Onco 5, no. 3: 36. https://doi.org/10.3390/onco5030036
APA StylePosa, A., Genco, E., Barbieri, P., Ariano, M., Lippi, M., Maresca, A., & Iezzi, R. (2025). Imaging of Liver Metastases from GEP-NETs: A Narrative Review. Onco, 5(3), 36. https://doi.org/10.3390/onco5030036