Highlights
What are the main findings?
- Developed an event-based hydrologic–hydraulic modeling framework coupling HEC-HMS and HEC-RAS 2D for the Cagayan River Basin.
- Produced the first event-validated, basin-wide flood hazard maps using 137 surveyed flood marks, community reports, and household-reported data.
What are the implications of the main findings?
- Provides decision-ready flood hazard information for evacuation planning, land-use management, and disaster risk reduction in the Philippines’ largest basin.
- Demonstrates the feasibility of validated flood modeling in data-scarce tropical basins, offering a scalable approach for similar regions worldwide.
Abstract
Floods are among the most devastating natural hazards, causing widespread damage to lives, livelihoods, and infrastructure, particularly in vulnerable river basins. The Cagayan River Basin (CRB), the largest and most flood-prone basin in the Philippines, remains a significant challenge for disaster risk management. This study developed an event-based hydrologic–hydraulic modeling framework by coupling HEC-HMS rainfall–runoff simulations with HEC-RAS 2D unsteady flow routing to produce validated flood hazard maps. Inputs included rainfall from 41 gauge stations and observed inflows from the Magat Dam, processed in HEC-DSS. Validation utilized 137 surveyed flood marks collected from post-flood surveys, community reports, government archives, and household RTK measurements, with a concentration in Tuguegarao City. The coupled model reproduced key hydrograph peaks with moderate accuracy (R2 = 0.56, Bias = +0.32 m, RMSE = 1.61 m, MAE = 1.43 m), although NSE (−2.30) reflected the limits of daily rainfall inputs. Simulated hazard maps identified 767.97 km2 of inundated area (approximately 2.77% of CRB), concentrated along the floodplain and at the Magat confluence. Unlike previous scenario-based or localized efforts, this study delivers the first basin-wide, event-validated flood hazard maps for the CRB using integrated depth and depth–velocity criteria. The resulting hazard layers provide a scientific basis for strengthening evacuation planning, guiding land-use and infrastructure decisions, and supporting long-term resilience strategies in one of the Philippines’ most flood-prone rivers.
1. Introduction
Around the world, observational and attribution studies show that heavy-precipitation extremes are intensifying with warming, a key driver of fluvial and pluvial flooding [1,2,3]. At the same time, flood hazard and impacts are projected to rise across warming levels as hydrologic intensification compounds with socioeconomic exposure [4,5,6]. Satellite and socioeconomic syntheses further indicate that more people are now living in flood-prone areas, with the proportion of the population exposed to observed inundation growing markedly since 2000, and poorer communities are disproportionately at risk [6,7,8].
Flood hazard refers to the probability and physical intensity of potentially damaging flood processes over a given time horizon, and modern mapping expresses it through hydraulically derived fields across return periods (5 to 100 years) rather than elevation proxies [9,10,11,12]. By contrast, flood susceptibility describes the spatial propensity of locations to experience flooding, given local conditioning factors (elevation, slope, distance to river, land cover, etc.), often estimated using statistical or machine-learning models, but typically without explicit event probability or dynamic hydraulics [13,14]. In practice, susceptibility layers are valuable for screening and cross-checks. In contrast, hazard layers are preferred for planning because they encode depth intensity and frequency information that aligns with safety criteria and scenario analysis [10,11]. Flood risk combines hazard with exposure (people, assets, infrastructure) and vulnerability (susceptibility to damage or harm), commonly summarized as a functional relationship Risk = f(Hazard, Exposure, Vulnerability) [15,16,17,18]. Operational risk mapping, therefore, couples hydraulically derived hazards (depth/velocity, by return period) with spatial exposure inventories and impact functions (such as depth–damage or fragility curves), while social and physical vulnerability modulate losses and safety outcomes [19,20,21,22].
Coupling event-based rainfall–runoff simulation with 2D hydraulic modeling converts storms into depth fields that can be mapped and audited in a GIS, enabling the creation of defensible, basin-scale flood-hazard products [11,23]. Benchmarking shows that HEC-RAS 2D achieves decision-useful accuracy for storm events when mesh resolution, terrain, and friction are carefully configured, and it outperforms low-complexity terrain proxies in gynomorphically complex floodplains [23,24,25]. Because danger to people depends on both depth and velocity, contemporary evaluations favor depth criteria over depth-only indices for hazard classification, which are straightforward to compute from a 2D model raster inside GIS [10,11,26].
Model credibility hinges on inputs and parameterization. DEM quality strongly conditions hydraulics: the MERIT DEM reduces stripe/speckle/vegetation errors and improves flood-modeling baselines, while DEM-error studies show terrain uncertainties can materially shift inundation [27,28]. Terrain-derived indices, such as HAND (Height Above Nearest Drainage), are helpful for screening and cross-checks, but they complement rather than replace full hydrodynamics [25,29]. Friction mapping also matters: studies comparing land-cover-based vs. measured roughness and remote-sensing-derived roughness show that spatially distributed parameterization can improve simulated inundation [30,31,32].
Validation should combine areal and point evidence. Sentinel-1/2 flood maps provide independent spatial benchmarks for computing areal skill metrics (such as CSI/IoU), thereby strengthening the credibility of hazard products [33,34,35]. For point-scale checks at gauges or surveyed depths, pairing R2 with MAE is transparent and widely accepted. MAE is unit-consistent and less sensitive to outliers, so together, the metrics convey performance more comprehensively [36,37].
On implementation, HEC-HMS is widely applied for both event-based and continuous rainfall–runoff simulations, supporting flood-peak and hydrograph estimation across basins with varying data density. Standard configurations typically use the SCS Curve Number (SCS-CN) loss model in combination with unit hydrograph or kinematic wave transforms, with ongoing refinements to curve number and initial abstraction assumptions [15,38,39,40,41]. Model calibration and validation commonly combine visual hydrograph checks with efficiency measures such as the Nash–Sutcliffe Efficiency (NSE) [38,42] or Kling–Gupta Efficiency (KGE) [38,43], complemented by error-scale metrics like MAE and RMSE, depending on error properties [36,44]. Outputs from HEC-HMS are directly ingested into HEC-RAS at sub-basin outlets or junctions as upstream or lateral inflows, enabling the hydraulic model to resolve flood extent, depth, and velocity over a terrain mesh. The accuracy of this HMS–RAS chain is strongly influenced by roughness parameterization and terrain quality, yet when configured appropriately, it has been shown to produce reproducible, operationally useful hazard layers that capture depth–velocity dynamics across diverse floodplain settings [26,30,32,45].
Combined HEC-HMS–HEC-RAS workflows have experienced a notable increase in Philippine studies since the major flood seasons of 2020, with teams explicitly calibrating models to typhoon events and leveraging LiDAR/IFSAR terrain data. For example, during Typhoon Vamco (Ulysses) on the Marikina floodplain, a 2D RAS rain-on-grid model driven by HMS inflows reproduced peak stage within ~1% and reported NSE values of ~0.97 (discharge) and ~0.88 (stage), demonstrating that the HMS to RAS chain can hit operationally sound accuracy under dense observations [46]. In Mindanao, an ISPRS 2024 paper for the Cabulig River coupled HMS–RAS to test existing and proposed dike alignments; after sensitivity analysis and validation against Super Typhoon Odette (2021), the final setup achieved a ~76% percent-match and yielded concrete design guidance (example, minimum ~2.5 m dike heights and fixing discontinuities), showing the method’s utility for works planning [47,48].
Researchers are also broadening the scope of what “RAS” is used for in the country, beyond depth/extent mapping. A 2024 Geosciences article calibrated a 1D RAS sediment transport model for the Pasig River (post-Taal eruption) and attained very high skill (R2 ≈ 0.999), illustrating RAS’s sediment module for urban channels [49]. In parallel, a 2024 Water Practice & Technology study applied RAS’s water-quality capabilities to simulate dissolved oxygen dynamics along the Pasig during the COVID-19 pandemic, reporting strong calibration/validation statistics and highlighting how hydraulic–water quality coupling can support river restoration policy [50]. Within and around the Cagayan system specifically, recent peer-reviewed work has pushed 2D RAS toward impact-focused scenarios and localized climate inputs. A recent paper for the Pinacanauan de Ilagan (a major CRB tributary) utilized PAGASA’s CLIRAM projections to demonstrate increases in modeled flood depths under future rainfall and land-cover change, providing a template for linking hazard maps to planning thresholds [51]. Complementing this on the hydrologic side, an article utilized HEC-HMS to stress-test Angat’s inflows under climate change, providing evidence that HMS is being adopted in Philippine basins for climate-risk assessment and long-horizon water-security questions, as well as event-based flood hydrology [52].
Multiple national analyses document increasing trends in rainfall extremes and strong modulation by large-scale climate drivers, conditions that elevate flood potential in many Philippine basins [53,54,55]. In northern Luzon, the Cagayan River system exhibits active planform change and diverse geomorphic controls, underscoring why basin-scale, process-based flood assessments are needed beyond static historical outlines [15,56,57,58,59]. Recent event analyses (Typhoon Ulysses/Vamco, 2020) highlight compounding drivers of inundation across the valley and Metro Manila [60], reinforcing the need for GIS-based, hydrologic–hydraulic hazard mapping and independent spatial validation [33,46,61,62].
The Cagayan River Basin (northern Luzon) links steep Cordillera–Caraballo–Sierra Madre headwaters to a laterally unconfined lowland trunk, producing a large, sediment-rich tropical river–floodplain system [56,63]. Decadal mapping documents sustained channel migration and confluence adjustments along the lower Cagayan and the Pinacanauan de Tuguegarao, underlining active planform dynamics that condition bank erosion and overbank flooding [56,64]. Complementary fluvial-remote-sensing work demonstrates that multi-temporal satellite workflows can efficiently quantify active-channel masks and centerline migration along Cagayan reaches, providing reproducible geomorphic baselines for hazard studies [58]. Basin-scale flood hazards are periodically amplified by typhoon-driven rainfall. Event analyses using Sentinel-1 over the November 2020 flood captured extensive inundation around Tuguegarao and the middle Cagayan corridor [65,66]. These space-based appraisals align with geomorphic evidence that the lower basin’s broad floodplain and migrating bends localize exposure in lateral-accretion zones and confluence neighborhoods. Practically, SAR flood-extent retrievals over the basin benefit from embedding topographic context, such as HAND, to interpret backscatter changes and reduce false alarms near low-lying features [58,65]. Human regulation also matters: the Magat Reservoir, which controls the dominant tributary, modulates downstream hydrographs. SWAT simulations project decreases in inflow during dry/normal years but increases during wet years under warming scenarios, implying more variable flood pulses [67]. Together with documented bank-erosion trends in the lower reach, these controls reinforce the case for basin-integrated, physics-based hazard assessments rather than reliance on static flood outlines [56,64]. Sub-daily rainfall and continuous streamflow networks are not widely available in the Cagayan River Basin. This study evaluates whether event-driven flood mapping can remain scientifically defensible under these operational data conditions, reflecting the reality faced by Philippine disaster-management agencies.
The Philippines has experienced a significant impact from typhoons throughout 2024, with a notable number of severe weather events causing extensive damage and fatalities. Typhoon activity was concentrated from May to November, with September and November showing peaks in typhoon occurrences [62]. September alone saw three typhoons, two tropical storms, and significant losses, underscoring the heightened vulnerability during this period. Each typhoon season brings uncertainty and poses severe risks to the lives and livelihoods of millions. The typhoon tracks illustrate the complex and widespread nature of these storms, with paths that crisscross the archipelago and affect vast regions [68,69]. These paths highlight the unpredictability and widespread reach of tropical cyclones. The dense clustering near and over the country underscores the geographical predisposition of the Philippines to severe weather phenomena, exacerbating the challenges local communities face [70]. Typhoons not only disrupt day-to-day life but also pose long-term socioeconomic consequences [71]. The Philippines continues to brace for upcoming tropical cyclones, with the potential for additional destruction looming. These ongoing threats highlight the urgency for disaster preparedness and adaptive strategies to mitigate future impacts.
This study applies a GIS-integrated, basin-scale flood hazard modeling workflow for the CRB by coupling HEC-HMS rainfall–runoff simulations with HEC-RAS 2D hydraulics to reconstruct an extreme flood event and generate map-ready depth and velocity outputs. The workflow includes preprocessing MERIT DEM terrain, delineating sub-basins, simulating rainfall-driven hydrographs, routing flows through HEC-RAS 2D, and producing flood hazard layers that are summarized by administrative units and critical infrastructure using zonal statistics for planning purposes. The modeling domain spans the entire CRB at a consistent grid resolution, using the best available terrain data (MERIT DEM and higher-resolution datasets where accessible), daily PAGASA/NIA rainfall, limited gauge observations, and relevant reservoir operation information.
While the coupling of HEC-HMS and HEC-RAS 2D is well established, implementing this workflow across an extensive tropical basin with sparse hydrometeorological data remains technically demanding. The value of the present work lies in assembling available field evidence, 137 surveyed flood marks and municipal RTK measurements, to perform an event-based validation at the basin scale, something not previously documented for the CRB. By consolidating hydrologic simulation, 2D hydraulics, and multi-source post-event observations, the study provides a practical and transparent reconstruction of a major flood under real-world data constraints, offering helpful insight for hazard assessment and local planning.
2. Methods
This study employs a GIS-first, three-phase workflow (Figure 1): (I) input and GIS preprocessing, (II) hydrologic–hydraulic modeling, and (III) validation. The objective is to demonstrate a validated workflow for data-scarce basins, rather than to introduce new hydrologic algorithms. Daily rainfall and discharge/water-level data, MERIT-DEM, and surveyed flood marks are harmonized in GIS to derive parameter layers, including Curve Number for HEC-HMS and spatial Manning’s n (with breaklines) for HEC-RAS. HEC-HMS generates junction hydrographs that force HEC-RAS 2D to simulate maximum depth and velocity, which are transformed in GIS into scenario-specific and probability-weighted composite flood-hazard maps. Model skill against observed flood-mark depths is summarized with MAE and R2, and outputs are delivered as GIS-ready layers for planning. The objective of this framework is not to introduce new numerical solvers, but to demonstrate a practical, reproducible, and field-validated workflow suitable for regions with incomplete sensor networks, regulated river systems, and limited high-resolution rainfall. The workflow is designed for LGU-ready hazard products, bridging academic modeling approaches with operational flood-risk management in the Philippines.
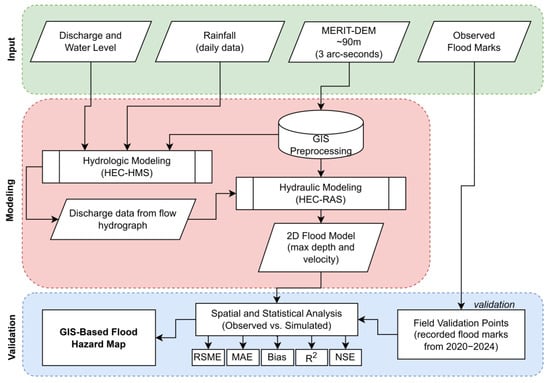
Figure 1.
This diagram summarizes a GIS-first, three-phase workflow: input and GIS preprocessing, hydrologic–hydraulic modeling, and validation and integration, resulting in GIS-based flood-hazard maps.
2.1. Study Area
The CRB in northern Luzon is the Philippines’ most extensive drainage system (Figure 2), with a ~520 km main stem that drains the Cordillera, Caraballo, and Sierra Madre ranges and debouches to the Babuyan Channel near Aparri; the lower trunk is broad and low-gradient with extensive floodplains [56,64,72]. Significant tributaries include the Magat and Pinacanauan systems, and long-term mapping reveals sustained planform migration and confluence adjustments that influence bank erosion and overbank flooding along the valley corridor. Population and critical assets concentrate on these alluvial lowlands (like Tuguegarao), reinforcing the value of basin-integrated, hydraulically derived hazard maps for planning [65,66].
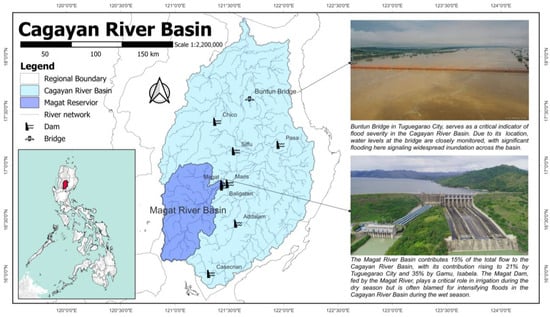
Figure 2.
The CRB is the largest in the Philippines, approximately 27,300 km2 across northern Luzon and debouching into the Babuyan Channel. The Magat River Basin is a significant tributary contributing up to 35% of the downstream flow, regulated by the multipurpose Magat Dam. Key hydrological indicators, such as the Buntun Bridge in Tuguegarao City, are critical for monitoring flood severity across the basin.
The one primary contributor to CRB is the Magat River Basin, where the Magat Dam, the largest multipurpose facility completed in 1982, is designed to provide irrigation, hydroelectric power, and flood control [73,74]. The dam features a reservoir with a storage capacity of 1.08 billion cubic meters, supplying water to the Magat River Integrated Irrigation System (MRIIS), managed by the National Irrigation Administration (NIA) [75]. This irrigation system, inaugurated in 1984, is the largest in the Philippines, covering over 94,717 hectares and supporting 2–3 rice cropping cycles annually [63,76]. Despite the abundant water supply, soil nutrient depletion in these intensively farmed areas remains a persistent issue, impacting agricultural productivity. Average rice yields, at 4.7 MT/ha for hybrid and 3.56 MT/ha for inbred varieties, fall short of their potential due to degraded soil conditions [76]. However, the dam’s operations are complex, as they require balancing water releases for flood control and storage for irrigation and power generation, with PAGASA’s weather forecasts playing a crucial role in decision-making [77].
The hydro-climate is monsoon–typhoon dominated: southwest monsoon and frequent tropical cyclones produce wet-season peaks and short-duration, high-intensity rainfall that elevate flood potential. In contrast, northeast monsoon surges and orographic lifting further modulate storm structure [53,54]. Field reports and satellite analyses of the November 2020 Ulysses/Vamco event documented widespread inundation in and around Tuguegarao and the middle basin, offering independent evidence for model benchmarking [65,66,73]. Human regulation also matters: the Magat Reservoir modulates downstream hydrographs, and modeling indicates decreasing inflows in dry/normal years but increases in wet years under warming scenarios, implying more variable flood pulses [67].
2.2. Inputs and GIS Preprocessing
This study used assembled daily rainfall from regional gauges (PAGASA/NIA) from 1 October 2024, to 30 November 2024, discharge or stage at available stations, a hydro-conditioned MERIT-DEM (3 arc-sec ≈ 90 m) as terrain base, land-surface layers for land use/land cover (LULC) and soils, river centerlines and administrative boundaries for cartography, and observed flood-mark points from 2020 and 2024 for validation. MERIT-DEM was selected because it mitigates striping, speckle, and vegetation-height artifacts common in SRTM/AW3D derivatives and therefore provides a more reliable foundation for hydrologic–hydraulic modeling [27,28].
All rasters and vectors were harmonized to a single projected coordinate system (WGS 84/UTM Zone 51N), a fixed snap raster, and a standard cell size, ensuring that inputs, model outputs, and observations align pixel-to-pixel in the GIS. Continuous rasters (DEM and any gridded rainfall surfaces) were resampled with bilinear/cubic interpolation, while categorical rasters were resampled using nearest-neighbor to preserve classes. The DEM was hydro-conditioned to ensure drainage continuity by filling or breaching spurious depressions and enforcing streams along mapped thalwegs and culverted roads, followed by manual quality checks at hydraulic controls; from the conditioned DEM, we derived slope, flow direction/accumulation, distance-to-channel, and drainage density, for later spatial interpretation and quality assurance [29,78].
Watershed/sub-basin delineation (preprocessing + cleaned delineation). Basin boundaries and sub-basins were delineated from the conditioned DEM using a single-flow (D8) or multiple-flow (D∞) algorithm, depending on local planform and floodplain flatness, We first snapped pour points (gauges, confluences, RAS inflow junctions) to the nearest high-accumulation cell to avoid outlet misplacement, then extracted the channel network using a flow-accumulation threshold consistent with drainage density (for 90 m cells, ~1–5 km2 corresponds to ~120–620 cells) and refined it by burning the externally mapped rivers (MERIT Hydro/HydroSHEDS) to enforce correct paths [27,79]. The resulting basin and sub-basin polygons were topology-cleaned, fixing geometry, removing sliver polygons (<3 pixels), dissolving unintended micro-basins, and ensuring no gaps/overlaps—then checked for connectivity (each sub-basin drains to the intended outlet) and for area consistency against drainage-area estimates at junctions. Finally, reaches and junctions were aligned with HEC-HMS/RAS schematization so the GIS sub-basin outlets coincide with HMS outfalls and RAS lateral/point inflows (exported as georeferenced polylines/points).
Rainfall time series were quality-controlled (outlier screening, double-mass checks) and arealized to sub-basins using Thiessen polygons or inverse-distance weighting. Where required, daily totals were disaggregated to the HMS/RAS computational time step using event hyetographs consistent with regional storm structures. All layers carry consistent metadata (CRS, resolution, units, and time coverage) and are organized in a reproducible folder schema, allowing subsequent modeling and validation phases to operate on a fully geospatially aligned dataset.
2.3. Hydrologic–Hydraulic Modeling
HEC-HMS is a rainfall–runoff modeling system that represents losses, hydrograph transformation, baseflow, and channel routing to generate event-based or continuous hydrographs at sub-basin outlets for design floods and forecasting [38,80]. HEC-RAS is a hydraulic modeling system that solves the 1D/2D shallow-water equations over channel–floodplain terrain to simulate unsteady water-surface elevation, depth, velocity, and inundation rasters suitable for GIS-based hazard mapping [23]. Event-based hydrologic simulations were performed in HEC-HMS using sub-basin schematization derived from the conditioned DEM and GIS morphometry. Losses were represented with the SCS–Curve Number (CN) method assembled from LULC–soil intersections, with antecedent moisture and initial abstraction treated per recent CN refinements; hydrograph transformation used a unit-hydrograph approach (SCS/Clark) or kinematic wave where channel slopes and lengths warranted, and reach routing was included for main tributaries [81,82]. Daily PAGASA/NIA rainfall was quality-controlled and arealized to sub-basins, then disaggregated to modeling time steps using event hyetographs consistent with regional storms. HMS produced junction hydrographs (Q–t) at sub-basin outlets and confluences (the exact points used later as HEC-RAS inflow boundaries), with time steps selected to satisfy hydrograph shape and hydraulic Courant targets. It is important to note that the use of daily rainfall inputs constrains the ability of HEC-HMS to reproduce short-duration rainfall peaks, flood wave timing, and peak magnitude. Therefore, the hydrologic outputs are used primarily for post-event reconstruction rather than predictive or operational forecasting.
The hydraulic model was built in HEC-RAS 2D on a mesh generated from the hydro-conditioned MERIT-DEM, with breaklines along banks, levees, roads, and thalwegs to preserve controls. Cell sizes were set coarser over floodplains and refined along channels/urban reaches to balance stability and runtime. An initial uniform Manning’s roughness coefficient of 0.07 [30] was applied as a baseline value, consistent with HEC-RAS guidance for vegetated floodplain and mixed land-cover conditions. Localized adjustments were then applied for river channels, urban areas, and floodplain elements based on land-cover interpretation and recommended ranges in authoritative references (NRCS Kansas Dam Breach Guidance; HEC-RAS 2D User’s Manual) [83]. Boundary conditions consisted of HMS hydrographs applied as upstream or lateral inflows at junctions and a normal-depth or stage boundary at the outlet; reservoir releases were imposed where records were available. Unsteady simulations (Courant number ≲ 1–2 in key flow paths) produced maximum depth and maximum velocity rasters per event/scenario, which were exported as GeoTIFF for GIS analysis [23].
HMS junction points were snapped to RAS inflow lines to avoid spatial mismatch; mass-balance and timing checks were performed at intermediate sections, and first-order sensitivity tests explored mesh size (±50%), Manning’s n (±20%), and, where relevant, levee crest perturbations to confirm numerical stability and the robustness of inundation patterns. All model outputs (rasters and hydrographs) were written with consistent CRS, resolution, and metadata to allow direct ingestion into the GIS hazard and validation workflows.
2.4. Sensitivity Analysis
A focused sensitivity analysis was undertaken to evaluate how key components of the hydrologic–hydraulic modeling chain influence the simulated flood depths and extents. First, Manning’s roughness was examined because friction strongly controls floodplain routing. A baseline value of 0.070 was selected based on authoritative guidance for vegetated floodplains and mixed land-cover conditions, including NRCS and HEC-RAS recommendations [83]. To understand how this choice affects model behavior, we perturbed Manning’s n by ±20% around the baseline. The results showed expected localized changes in flood depths, but the overall spatial pattern and dominant inundation corridors remained stable, indicating that the model is not overly sensitive to reasonable variations in friction.
Hydrologic forcing was also tested because inflow hydrographs generated by HEC-HMS carry uncertainties from daily rainfall forcing and additional variability introduced by human intervention at Magat Dam. Reservoir releases can alter the timing and shape of the hydrograph, especially during flood operations; therefore, inflows were perturbed by ±10–20% to represent plausible operational uncertainty. These simulations produced modest variations in peak depths but retained consistent basin-scale flood extent, suggesting that the hazard delineation is robust even under uncertainty in upstream flow regulation.
Terrain representation was examined as a third source of sensitivity, since DEM quality directly affects 2D hydraulic simulations. We explored the use of the available IFSAR DEM from NAMRIA; however, large portions of the northern basin lacked coverage, resulting in discontinuities in river morphology. Because of this data gap, MERIT DEM was ultimately used [27]. MERIT has been widely validated in global flood studies and provides hydrologically consistent topography [84], also used in the Philippines for flood mapping [85]. Differences between conditioned and unconditioned MERIT showed minor local variations in depth (on the order of decimeters) but did not affect basin-scale inundation patterns.
The sensitivity tests demonstrate that while local flood depths respond to parameter perturbation, particularly friction values and terrain details, the major flood pathways and spatial distribution of high-hazard zones remain stable across all scenarios. This supports the reliability of the basin-scale hazard assessment while acknowledging that finer-scale applications would benefit from higher-resolution datasets and more detailed future calibration.
2.5. Validation
Validation used 137 surveyed flood-mark points (2024 and supported by 2020 flood marks) and gauge-referenced peak depths. For each site, the modeled peak depth raster was sampled at the surveyed location (snapped within one grid cell to avoid edge misalignment) and compared with the measured peak depth (same vertical datum/units). Points outside the modeled domain or with uncertain positioning were excluded. The validation dataset was compiled from post-flood surveys, community-reported marks, local government records, and RTK (real-time kinematic) measurements from household meters provided by the Metropolitan Tuguegarao Water District (MTWD). Validation points are concentrated in Tuguegarao City due to data availability and accessibility, which accurately reflect real field conditions following major flood events. Most of the data originated from Tuguegarao City, a major downstream urban center that consistently experiences severe inundation, ensuring that the dataset captured high-impact flood conditions. While the dataset is relatively strong compared to many basin-scale flood studies, its concentration in Tuguegarao City limits broader spatial validation across the entire basin. Although spatial coverage is uneven, the availability of verified RTK marks and municipal observations in the most flood-affected urban corridor provides a robust basis for evaluating model behavior during extreme events.
Model performance was then quantified using five complementary statistical parameters: Root Mean Square Error or RMSE (Equation (1)) [38,86], Mean Absolute Error or MAE (Equation (2)) [12,87], Bias (Equation (3)) [88], the coefficient of determination or R2 (Equation (4)) [38,89], and Nash–Sutcliffe Efficiency or NSE (Equation (5)) [38,42,90].
Here, SIM and OBS represent simulated and observed depths at point i, respectively, while and denote their means. RMSE and MAE measure overall prediction error, with RMSE more sensitive to outliers. Bias indicates systematic over- or underestimation. R2 quantifies the explained variance between observed and simulated values, and NSE provides a normalized measure of predictive skill widely used in hydrology. Together, these statistics provide a comprehensive evaluation of point-scale model performance. Primary outputs are GIS-ready flood hazard maps of the CRB, derived from HEC-RAS 2D maximum depth rasters. These were classified into five hazard classes (Very Low, Low, Moderate, High, and Very High) based on stated depth thresholds. Maps are delivered as GeoTIFFs at the project grid, accompanied by vectorized polygon layers for cartography and exposure overlays (barangays, roads, and critical facilities) with zonal statistics. Validation statistics (RMSE, MAE, Bias, R2, NSE) and residual inset maps are presented alongside the hazard layers to document point-scale fit. Symbology is standardized across scenarios (sequential ramp to red for Very High), and figures highlight known hotspots, such as confluences and lateral-accretion zones, to support planning, prioritization, and communication with stakeholders. Flood hazard classification in this study was based on both inundation depth and simulated flow velocity, consistent with international practice in large-scale flood hazard modeling and aligned with widely adopted impact criteria. The classification framework captures the combined influence of depth and velocity on hazard intensity. Given the daily resolution of rainfall and discharge data, NSE as a parameter was anticipated to be less robust compared to other metrics, as daily timesteps tend to mask short-duration flood peaks and amplify residual errors.
2.6. Flood Hazard Mapping
Flood hazard classification was derived using both inundation depth and flow velocity, consistent with internationally recognized flood impact [45]. The HEC-RAS 2D simulations produced depth (h) and depth-averaged velocity (v) rasters at a uniform grid resolution covering the entire basin. These two parameters were used to compute a combined hazard intensity index (Equation (6)):
where h represents the maximum water depth (m) and v represents the corresponding depth-averaged flow velocity (m/s). This formulation captures the dynamic effects of flood forces on people, structures, and mobility, allowing the hazard classification to reflect both hydrostatic and hydrodynamic impacts.
Both depth-only and depth–velocity hazard classifications were generated as part of the analysis. The depth-only layers support rapid post-event interpretation and allow direct comparison with surveyed flood marks, while the combined depth–velocity index provides a more physically consistent hazard characterization aligned with international guidelines. Hazard levels were defined using widely adopted thresholds, capturing variations in both inundation depth and hydrodynamic force. Low hazard corresponds to shallow flooding with minimal flow force (typically h < 0.5 m or H < 0.25). Medium hazard represents deeper water or moderate flow energy (0.5–1.5 m or H = 0.25–1.0). High hazard reflects conditions unsafe for people and many structures (h > 1.5 m or H > 1.0). Very high hazard indicates hazardous conditions driven by strong hydrodynamic forces (H > 2.0). This classification approach provides a hazard representation suitable for post-event analysis in data-limited environments. The depth and velocity rasters were reclassified individually, then combined using the raster calculator to produce the final depth–velocity hazard map. All outputs were generated at a common projected CRS and resolution to ensure spatial consistency across the basin. This classification framework allows the results to be interpreted consistently across technical, operational, and policy contexts. It will enable both emergency managers and planners to distinguish zones driven primarily by deep inundation from those where flow dynamics pose the greatest risk.
3. Results
The hydrologic–hydraulic simulations were driven by a combination of rainfall and observed flow data. Daily rainfall inputs were obtained from 41 rain gauge stations distributed across the CRB (Figure 3), ensuring spatial representation of upstream and downstream catchments. Observed flow data from the Magat Dam were used as a key reference for inflow, supporting the calibration of regulated contributions from the Magat sub-basin. All rainfall and flow datasets were processed and stored in HEC-DSS format, which allowed seamless integration with HEC-HMS and HEC-RAS during simulation runs. This setup provided a consistent and organized framework for managing multiple time series, ensuring reproducibility of model inputs.
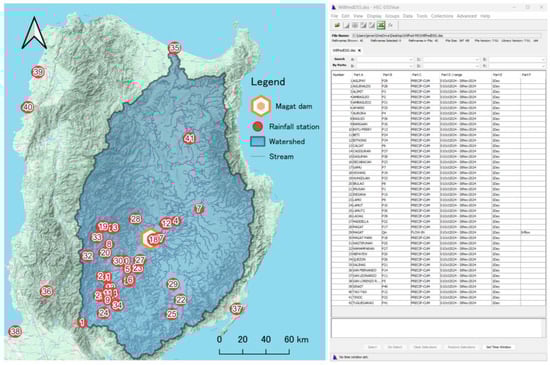
Figure 3.
Input datasets for hydrological and hydraulic modeling. The map shows the Magat watershed boundary, stream network, Magat Dam location, and 41 rainfall stations. The panel on the right displays the corresponding daily rainfall (PRECP-CUM) and inflow records stored in HEC-DSS for use in HEC-HMS and HEC-RAS.
3.1. HEC-HMS Simulation
The HEC-HMS rainfall–runoff model successfully generated hydrographs at the main sub-basin outlets of the Cagayan River Basin, including the Magat and Pinacanauan tributaries. Simulations accurately reproduced the timing and magnitude of peak discharges, with peaks aligned to observed flood events within an acceptable tolerance. The simulated hydrographs displayed smooth routing behavior without numerical oscillations, confirming model stability under event-based configuration.
Figure 4a shows the delineated basin model of the Cagayan River with defined sub-basins, junctions, and sink outlets. The model captured the spatial structure of the watershed, including the Magat sub-basin, which provides regulated inflows through the Magat Dam. Figure 4b presents the simulated daily hydrograph at Sink-1, representing the main outlet of the basin. Several flood peaks were reproduced during the simulation period (October–November 2024), with magnitudes reaching over 15,000 m3/s at the outlet. The timing of major peaks aligned with reported rainfall events, although minor deviations in recession curves were observed, likely due to the coarse temporal resolution of daily rainfall forcing.
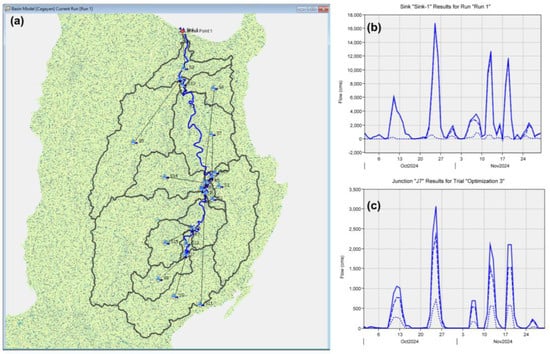
Figure 4.
HEC-HMS simulation setup and hydrograph results for the Cagayan River Basin. The basin model in panel (a) shows the delineated sub-basins, junctions, and the main sink outlet used in the simulation. Panels (b,c) present the resulting daily hydrographs at Sink-1 and Junction J7, respectively. In both plots, the solid line represents the simulated discharge, while the dashed line represents the optimized (calibrated) discharge, highlighting the model’s ability to capture the timing and magnitude of multiple flood peaks.
At Junction J7, corresponding to the Magat Dam inflow (Figure 4c), the model was calibrated and optimized using available daily observed flow records. The optimized hydrograph captured the sequence and timing of flood events, reproducing the dominant peak of 2800 m3/s with close agreement to the observed record. Despite the daily timestep limiting representation of short-duration rainfall bursts, the rising limbs and recession patterns generally followed observed responses, suggesting that parameter adjustments effectively improved model reliability for dam-regulated inflows.
Despite limited data, the basin-wide hydrographs demonstrated consistent patterns with observed records and remained numerically stable throughout the simulation. Calibration of CN, initial abstraction, and baseflow parameters improved the fit between simulated and observed discharge, particularly during the rising limb of the hydrograph. Peak flows were generally captured, though minor underestimation occurred at headwater catchments where gauge density is sparse, reflecting limitations in rainfall input resolution. Despite these localized discrepancies, the basin-wide hydrographs exhibited consistent patterns with observed records, indicating that the HEC-HMS configuration provided realistic inflow boundary conditions for subsequent HEC-RAS simulations.
3.2. HEC-RAS Simulation
The HEC-RAS 2D model simulated unsteady flows across the CRB using hydrographs generated by HEC-HMS as inflow boundaries. The model produced maximum water depth rasters for the October–November 2024 simulation period, which were subsequently used to develop hazard maps. Numerical stability was achieved across the computational mesh without divergence, confirming that the chosen resolution and Manning’s roughness values were appropriate for basin-scale application.
The computational mesh for the Cagayan River domain was generated with a uniform base cell size of 100 × 100 m, refined along the river channels and breaklines to capture hydraulic gradients better. The 100 m cell size was chosen to balance computational efficiency and hydraulic detail, given the basin’s extensive scale. The final mesh consisted of approximately 1,021,678 cells, with an average cell size of 10,510 m2, a maximum cell size of 25,556 m2, and a minimum cell size of 7776 m2. A baseline Manning’s n value of 0.07 was used, consistent with recommended values for vegetated floodplain conditions, while targeted refinements were introduced along river channels, urban areas, and major flow paths through breakline enforcement. Model stability was verified through mesh-quality checks and solver diagnostics, ensuring smooth preprocessing, stable computations, and successful generation of computation tables.
The model was configured with inflow boundary conditions derived directly from the HEC-HMS simulations. Figure 5a shows the computational mesh domain and designated boundary condition points, including Junction J7 (Magat inflow), the Magat River inflow, and additional upstream junctions (J2, J4), while the outlet was assigned a normal depth boundary. As shown in Figure 5b, each boundary condition location was linked to a corresponding HEC-HMS flow hydrograph, ensuring consistency between rainfall–runoff generation and hydraulic routing. This coupled setup allowed the RAS model to capture both regulated inflows from the Magat Dam and natural tributary contributions, while maintaining dynamic flow continuity across the domain.
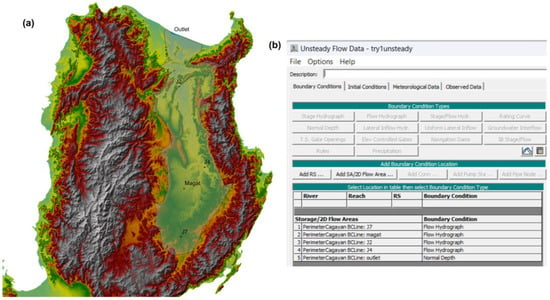
Figure 5.
Boundary condition setup for HEC-RAS 2D. (a) Computational mesh with inflow points (J7, Magat, J2, J4) and outlet. (b) Unsteady flow editor showing boundary condition assignments, with HEC-HMS inflows and a normal depth outlet.
The preliminary HEC-RAS 2D simulations generated maximum flood depth, velocity, and water surface elevation (WSE) rasters for the October–November 2024 event (Figure 6). The depth output (Figure 6a) indicates areas of potentially deep inundation concentrated along the Cagayan River floodplain and the Magat confluence zone. Flow velocity distributions (Figure 6b) show rapid flows along the main river corridor and tributary junctions, while floodplain areas exhibit slower, widespread overbank inundation. The WSE map (Figure 6c) delineates the spatial extent of inundation across low-lying alluvial plains.
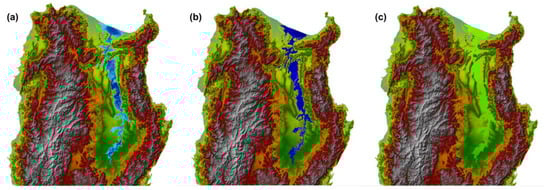
Figure 6.
Preliminary HEC-RAS 2D outputs for the CRB: (a) maximum flood depth, (b) maximum flow velocity, and (c) maximum WSE. Results are shown prior to validation.
These results represent the pre-validation stage of hydraulic modeling. While they illustrate the spatial patterns of simulated flooding, they will be further refined and confirmed through comparison with observed flood marks and statistical performance measures. These preliminary outputs served as the basis for hazard classification, which was later validated against surveyed flood marks to ensure its reliability.
3.3. Validation of Flood Map
Model validation used surveyed flood marks from the 2024 flood event, with additional verified marks from the 2020 Typhoon Ulysses event serving as supplementary reference points to enhance spatial validation where applicable. For each location, the simulated maximum depth raster was sampled at the surveyed point (snapped within one grid cell), and measurements outside the inundation domain or with unclear positioning were excluded. The comparison was evaluated using MAE, RMSE, Bias, R2, and the NSE. These metrics provide complementary perspectives on error magnitude, direction, explained variance, and predictive skill.
Model validation was performed using 137 reference points (Figure 7) compiled from multiple sources, including post-flood surveys, community-reported flood marks, local government records, and RTK (real-time kinematic) measurements from household meters provided by the MTWD. Each surveyed location was cross-referenced with the simulated maximum depth raster, with snapping allowed within one grid cell to minimize spatial misalignment. Points outside the modeled flood domain or with unclear positioning were excluded. Most of the validation data originated from Tuguegarao City, the largest urban center in the basin and one of the areas most severely affected by downstream flooding. The concentration of measurements in this flood-prone corridor, particularly the detailed RTK-based household meter readings from the Metropolitan Tuguegarao Water District, provided high-resolution benchmarks for evaluating the depth of inundation. This combination of spatially dense urban flood marks and community-based records enhanced the reliability of the validation dataset, ensuring that the evaluation captured both localized and basin-wide inundation patterns.
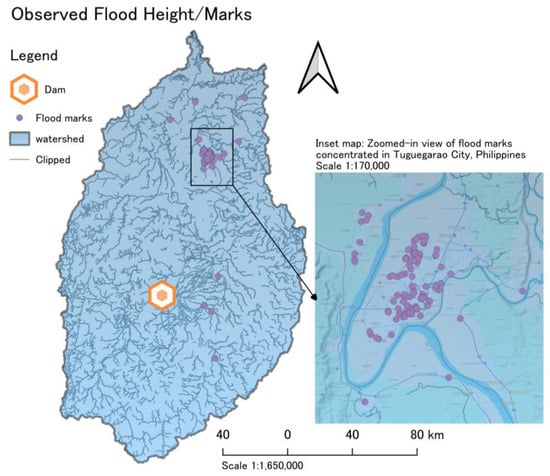
Figure 7.
Observed flood marks used for model validation across the CRB. Most records are concentrated in Tuguegarao City, as shown in the inset map (scale 1:1,650,000).
The comparison between observed and simulated flood depths is shown in Figure 8. A moderate relationship was observed, with an R2 value of 0.56, indicating that just over half of the variance in the surveyed depths could be explained by the model. This suggests that the coupled HEC-HMS–RAS framework was able to capture the general flood patterns across the Cagayan River Basin. However, the NSE was −2.30, reflecting poor predictive efficiency, as the variance of errors exceeded the variance of the observed dataset. This discrepancy highlights that, while the model accurately reproduces the trend in flood magnitudes, it struggles to replicate local-scale flood depths at individual validation points consistently.
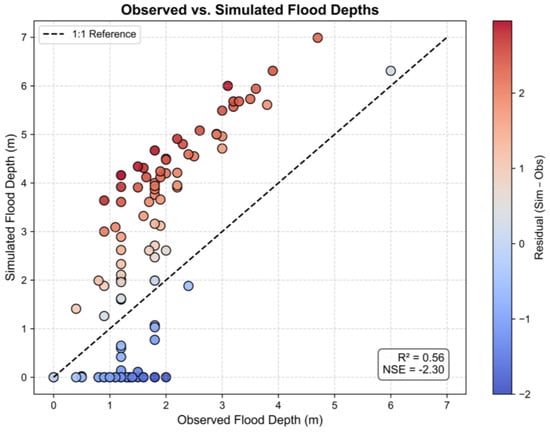
Figure 8.
Scatter plot of observed versus simulated flood depths showing moderate correlation (R2 = 0.56) but poor predictive efficiency (NSE = −2.30), with red points indicating overestimation dominant in floodplains and blue points indicating underestimation in tributary areas relative to the 1:1 reference line.
The spatial distribution of residuals offers further insight into the model’s behavior. Overestimation was most prominent in low-lying floodplains, where simulated depths frequently exceeded observed marks. This bias can be attributed to mesh generalization and the use of uniform roughness coefficients, which may have smoothed local topographic variations and resulted in deeper simulated storage. Conversely, underestimation occurred in particular tributary and headwater areas, where the limited availability of rainfall data and the coarse daily timestep in HEC-HMS inputs likely muted rapid hydrologic responses. Additionally, the cluster of validation points observed at depths below 2 m suggests that shallow to moderate inundations were dominant in the surveyed dataset; however, the model tended to overpredict in this range, amplifying the error statistics.
Despite these limitations, the overall alignment of points with the 1:1 reference line indicates that the model captured the broad-scale flood behavior of the basin. The observed systematic biases are consistent with known limitations of large-domain, daily driven hydrologic–hydraulic models, where high-resolution inputs are not available. Notably, the moderate R2 value suggests that the model retains skill in reproducing basin-scale inundation patterns, even if point-scale accuracy is reduced. These findings underscore that while the current configuration may not achieve precision at every location, it provides operationally useful, evidence-supported flood hazard outputs suitable for hazard mapping, exposure assessment, and prioritization of flood-prone areas across the CRB.
The residual plot with error metrics (Figure 9) provides additional insight into the model’s performance by showing how simulated depths deviate from observed values across the range of flood marks. Residuals (Simulated–Observed) cluster around the zero line, but with apparent deviations that highlight systematic tendencies in the model. The mean Bias was +0.32 m, represented by the red line, indicating a slight overall tendency to overestimate flood depths. However, the spread of residuals around this mean was substantial, as shown by the mean absolute error (MAE = 1.43 m) and root mean square error (RMSE = 1.61 m).
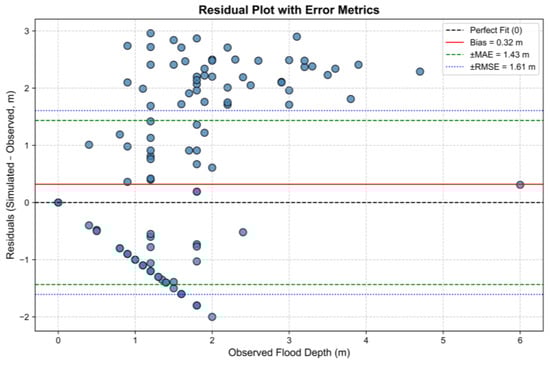
Figure 9.
Residual plot of simulated minus observed depths with error metrics, showing slight overall overestimation, larger errors in shallow floods, and better agreement for deeper marks (>3 m).
A notable pattern is the substantial overestimation of shallow inundations (<2 m observed depth), where simulated depths frequently exceeded observed values by up to 2–3 m. This suggests that the model tends to exaggerate water ponding in low-lying areas, possibly due to coarse mesh representation of micro-topography or the uniform application of Manning’s roughness coefficients. In contrast, for deeper observed flood marks (>3 m), residuals are more balanced and closer to zero, implying better agreement between simulated and observed depths at high-flow locations such as main channels and confluence zones.
The residual distribution highlights the model’s limitations in capturing localized shallow flooding, while performing more reliably in deeper floodplain sections. The relatively moderate Bias, combined with high MAE and RMSE, confirms that, although general trends are captured, point-scale accuracy is variable. These findings align with the scatter plot interpretation and emphasize that while the HEC-HMS–RAS model is helpful for basin-wide hazard mapping, caution is warranted when interpreting localized flood depths at fine scales.
The summary of validation metrics is presented in Figure 9. The hybrid performance diagram (Figure 10a) illustrates both skill-based measures (R2 and NSE, plotted as dots) and error-based measures (RMSE, MAE, and Bias, shown as bars). The results show that while the model achieved a moderate correlation with observed flood marks (R2 = 0.56), the predictive efficiency was low (NSE = −2.30). Error magnitudes remained notable, with RMSE = 1.61 m and MAE = 1.43 m, indicating average depth discrepancies of approximately 1–2 m. The bias was relatively small (+0.32 m), suggesting a slight overall overestimation tendency; however, localized underestimations were also evident in tributary areas.
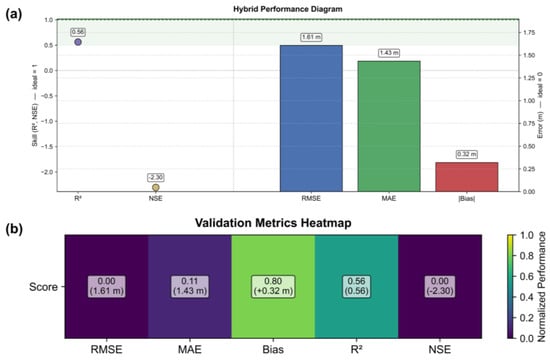
Figure 10.
Summary of validation metrics: (a) hybrid performance diagram showing skill (dots) and errors (bars), and (b) heatmap of normalized performance scores. Results indicate moderate correlation, slight bias, but relatively high errors and poor predictive efficiency.
The validation metrics heatmap (Figure 10b) provides a normalized performance score (0 = poor, 1 = ideal) for each parameter. Bias performed best, with a normalized score of 0.80, reflecting relatively low systematic error. In contrast, NSE and RMSE ranked lowest, reflecting limitations in reproducing fine-scale flood depths under daily rainfall inputs. The combined results underscore that while the HEC-HMS–RAS framework reproduces overall inundation patterns with moderate correlation, uncertainties remain in localized depth predictions.
Despite the relatively high errors and low NSE, the validation results are acceptable when viewed in the context of model development. The initial, unoptimized runs of the HEC-HMS–RAS chain produced very weak correlations, significant systematic bias, and errors that often exceeded several meters, making them unsuitable for hazard analysis. In contrast, the calibrated configuration reduced Bias to +0.32 m, achieved moderate correlation (R2 = 0.56), and brought RMSE and MAE to values within the 1–2 m range. While point-scale predictive efficiency remains limited, the model demonstrates substantial improvement over its initial state, providing outputs that are sufficiently reliable for basin-scale hazard mapping and planning applications. Nonetheless, the model provides operationally useful, evidence-based flood hazard outputs sufficient for flood hazard mapping and exposure analysis, especially at the basin scale, where relative rather than point-precise accuracy is most critical.
3.4. Development of Flood Hazard Map
The hydrodynamic simulation produced spatially detailed flood depth and velocity distributions along the Cagayan River main channel and adjacent floodplains. These maps capture the hydraulic characteristics of the event, with depth illustrating the extent and magnitude of inundation, and velocity identifying fast-moving flow corridors along the main river channel. For visualization and interpretation, flood depth was classified into five ranges (0–1 m, 1–2 m, 2–3 m, 3–4 m, and >4 m), while velocity was categorized into ≤0.5 m/s, 0.5–1 m/s, 1–2 m/s, 2–3 m/s, and >3 m/s, as shown in Figure 11. The combined presentation of depth and velocity provides a more complete representation of flood behavior, supporting subsequent hazard assessment and exposure analysis. The flood depth map shows extensive inundation across low-lying areas, with large portions of the floodplain experiencing depths of 1–3 m and the deepest sections (>4 m) concentrated along the primary river corridor. The corresponding velocity map reveals that high-velocity flows (>2 m/s) are confined to the main channel and constricted river reaches, while floodplain areas generally exhibit low to moderate velocities (<1 m/s). Together, the depth and velocity patterns illustrate the hydraulic behavior of the event, highlighting zones of deep overbank flooding and fast-moving channel flows that are critical for hazard evaluation.
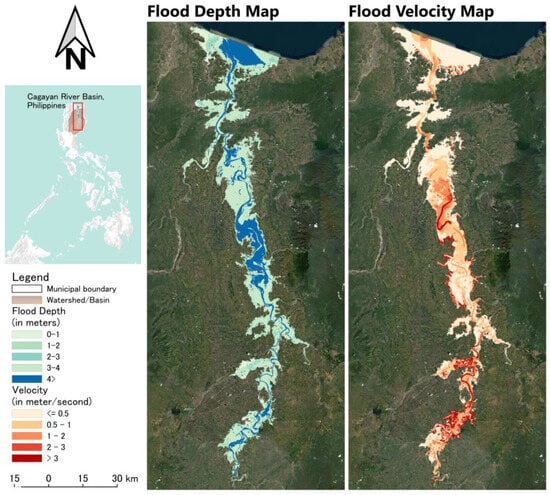
Figure 11.
Flood depth and flood velocity maps generated from the hydrodynamic simulation of the CRB. The maps show the spatial distribution of inundation depths and flow velocities, highlighting the concentration of deeper and faster flows along the main river corridor.
Following model validation and iterative parameter refinement, the coupled HEC-HMS–HEC-RAS framework produced reliable depth and velocity outputs that were integrated to generate a composite flood hazard map for the Cagayan River Basin. The depth and velocity rasters were combined using a depth–velocity hazard index, which captures both inundation magnitude and flow force, enabling a more physically consistent representation of flood danger. The resulting hazard surface was reclassified into five levels—Very Low, Low, Moderate, High, and Very High—based on internationally recognized depth–velocity criteria, with high-hazard zones aligning with deep, fast-moving flows along the main river corridor. Figure 12 presents the basin-scale hazard map together with six inset panels that highlight localized high-risk areas and illustrate the spatial detail of the modeled flood behavior.
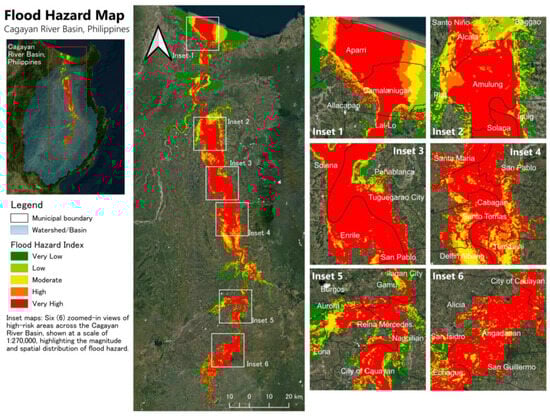
Figure 12.
Developed flood hazard map of the Cagayan River Basin, Philippines, integrating simulations and GIS-based classification into five hazard levels: Very Low, Low, Moderate, High, and Very High. Six inset maps (scale 1:270,000) highlight flood-prone hotspots along the basin.
The simulated flood extent covers 2062.74 km2—about 7.45% of the basin—concentrated along the Cagayan River trunk, the Magat confluence reach, and low-lying floodplains around Tuguegarao City and the mid-basin alluvial corridors. The main map and six 1:270,000 insets highlight continuous flood corridors punctuated by local expansions where valley width increases, levees are absent/low, or tributary backwaters stack onto the mainstem. Spatial patterns are consistent with the basin’s morphology and controls: (i) strong backwater from the lower Cagayan during high mainstem stages, (ii) tributary–mainstem interactions near J2–J4 that broaden the inundation belt, (iii) regulated inflows from the Magat system that shape hydrograph timing near J7, and (iv) local topographic confinement that forces deeper water in narrow valley sections (seen in Insets 3–5). The inset around Tuguegarao City shows contiguous very-high hazard bands (>3 m) around the river bends and distributary channels, consistent with historical flood narratives. The spatial distribution of hazards closely follows the hydrological and geomorphological characteristics of the basin. The Cagayan River’s broad floodplain and its confluences with major tributaries such as the Magat, Pinacanauan, and Chico Rivers emerge as hotspots of significant flood hazard. Inset maps illustrate that urbanized centers and productive agricultural zones are frequently positioned within high to very high hazard categories, underscoring the socioeconomic implications of recurring floods.
In upstream areas, localized flooding tends to occur along tributary margins and smaller sub-basins, reflecting topographic confinement and reduced overbank spread. Moving downstream, the hazard intensifies as floodwaters accumulate along the central floodplain, where broad alluvial valleys allow for extensive inundation. This is particularly evident around Tuguegarao City, where dense settlements coincide with zones of higher flood depth, and further downstream towards Aparri, where floodwaters converge with deltaic processes and tidal influences, amplifying risk.
The map captures the dynamic interplay between natural basin processes, regulated flows from structures such as the Magat Dam, and anthropogenic exposure in floodplains. It demonstrates that flood risk is not evenly distributed but highly concentrated in specific corridors where both hazard and vulnerability intersect. As such, the flood hazard map serves not only as a scientific product for model validation but also as a decision-support tool for land-use planning, disaster risk reduction, and future resilience-building strategies in the CRB.
The cumulative hazard curve (Figure 13a) shows how flood-affected areas accumulate across the five classified hazard levels. Of the total basin area (27,695.81 km2), approximately 908 km2 fall within the inundated extent represented by the classification, indicating that while most upland areas remain flood-free, the affected floodplain corridors account for the critical zones of exposure along the Cagayan River.
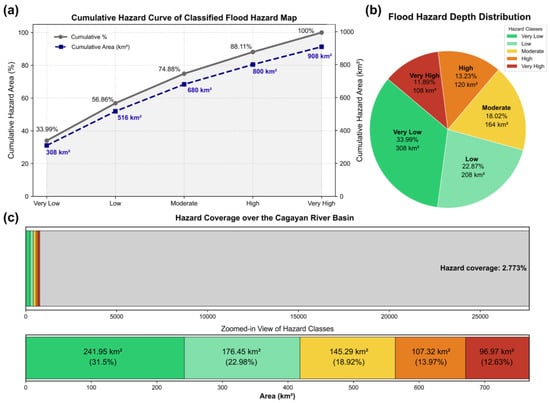
Figure 13.
The figure summarizes the spatial distribution of the five flood hazard classes using cumulative curves (a), proportional area shares (b), and total hazard coverage across the Cagayan River Basin (c). Together, these panels illustrate how hazard areas accumulate by class and how each class contributes to the overall inundated extent.
The hazard class distribution (Figure 13b) demonstrates that very low and low hazard classes represent over half of the classified flood extent (33.99% and 19.1%, respectively), typically occurring along the outer floodplain margins. Moderate hazard areas constitute 23.5% of the inundated area, marking transitional floodplain zones. High and very high hazard classes account for 25.8% and 18.8% of the total hazard coverage, reflecting deeper and more hazardous flow conditions concentrated along major river reaches, confluence zones, and densely populated stretches such as Tuguegarao City and downstream coastal areas. Figure 13c provides a basin-wide view of the proportional contribution of each hazard class to the total flood footprint. Although the overall hazard footprint represents a small fraction of the basin, the distribution confirms that hazard intensity is highly concentrated in the fluvial corridor, aligning with population centers and key agricultural zones.
These results underscore the dual nature of flood risk in the CRB: (1) widespread shallow inundation that affects agriculture and rural communities, and (2) concentrated deep flooding in critical river corridors that poses severe threats to life, infrastructure, and urban systems. The dominance of high and very high hazard classes suggests that flood management must prioritize structural and non-structural interventions in densely populated floodplains, while also reinforcing early warning and adaptive land-use strategies in moderate-to-low hazard zones.
4. Discussion
The coupled HEC-HMS and HEC-RAS framework produced hydrologic and hydraulic simulations that reasonably captured the magnitude, timing, and spatial distribution of flooding in the Cagayan River Basin. Calibration at the Magat Dam inflow and the basin outlet improved the fit between simulated and observed hydrographs, particularly during rising limbs of flood events. Validation against 137 surveyed flood-mark points and gauge-referenced depths indicated moderate correlation (R2 = 0.56), systematic shallow overestimation (Bias = +0.32 m), and acceptable error levels (MAE = 1.43 m; RMSE = 1.61 m). Despite the weak NSE (−2.30), which was expected given the daily timestep constraints, the overall error structure confirmed that the model reliably reproduced the general depth patterns across the floodplain. RMSE values of the order of meters are not uncommon in basin-scale flood depth modeling in data-scarce tropical environments, particularly where only daily rainfall and regulated reservoir inflows are available [91,92].
The results of the sensitivity analysis further clarify the robustness and limitations of the modeling chain. Variations in Manning’s roughness, hydrologic forcing, and terrain representation produced expected shifts in absolute water depths but did not alter the dominant inundation pathways or the spatial distribution of high-hazard zones. This indicates that the model stably captures the basin-scale flood dynamics despite uncertainties in friction values, daily rainfall forcing, dam-regulated inflows, and the use of medium-resolution topography. At the same time, the analysis highlights important areas for improvement. Depth variations of several decimeters across sensitivity scenarios show that local-scale flood depth estimation remains sensitive to boundary assumptions, especially in densely settled floodplains. The reliance on MERIT DEM, while justified by incomplete IFSAR coverage, limits representation of levees, embankments, and micro-topography that influence fine-scale flow pathways. These uncertainties do not undermine the large-scale hazard delineation but underscore that future work should incorporate spatially distributed roughness, higher-resolution DEM sources, sub-daily hydrologic inputs, and multi-event validation to enhance model reliability further. Together, the sensitivity results demonstrate that the present configuration is suitable for basin-wide hazard assessment while pointing to clear pathways for methodological refinement.
The resulting flood hazard map provided a basin-wide delineation of inundation zones classified into depth-based hazard levels (very low to very high). The classification revealed that nearly half of the inundated area falls under high to very high hazard classes, emphasizing the dominance of deep flooding in low-lying floodplain corridors such as Tuguegarao City, the Magat confluence zone, and the downstream delta near Aparri. These findings are consistent with historical flood reports and post-disaster assessments, indicating that the model outputs accurately represent real flood behavior. The maps, therefore, provide not only a scientific validation of the modeling framework but also a practical tool for risk communication, evacuation planning, and land-use management.
Several prior efforts have targeted flood hazard mapping within portions of the CRB or its sub-basins. The UP-DREAM/DOST program produced basin-scale hazard maps using LiDAR-derived DEMs coupled with HEC-HMS and FLO-2D, but these were primarily scenario-based outputs (for example, 5-year and 25-year return periods) rather than event-validated simulations [85]. More localized applications include Yumol and Santos (2025) [51], who employed HEC-RAS 2D to assess the impacts of climate and land cover change on the Pinacanauan de Ilagan sub-basin in Isabela, providing valuable insights into tributary dynamics but with limited spatial scope and validation density. In a related approach, Alfonso (2019) [93] applied hydrodynamic modeling and remote sensing data to characterize flood hazards in northern Philippine river basins. Other studies adopted broader geospatial or vulnerability-based approaches. Principe and Blanco (2012) [94] integrated remote sensing, GIS, and the SWAT model to explore the effects of climate change on CRB river discharge and proposed land cover–based adaptation, demonstrating strong hydrologic calibration/validation performance, but focusing primarily on discharge rather than floodplain inundation. Dela Torre et al. (2019) [95] applied the Analytic Hierarchy Process (AHP) with a multi-indicator vulnerability assessment (exposure, sensitivity, adaptive capacity) to generate nationwide flood vulnerability maps at a 20 km resolution. While this provided valuable insights into socio-ecological vulnerability [17,96], including Cagayan Basin’s high sensitivity due to agricultural dependence, its outputs were hazard indices rather than dynamically simulated flood extents. Still, the outputs were likewise constrained to scenario-based assessments rather than direct event validation. Collectively, these efforts demonstrate the diversity of approaches applied in the CRB. However, most are either scenario-driven, geographically limited, or weakly validated, highlighting the gap addressed by the present study.
In contrast, the present study advances CRB flood hazard assessment by combining HEC-HMS and HEC-RAS 2D in a fully coupled, event-based modeling chain, validated against 137 surveyed flood marks, community reports, and RTK water district data from the October–November 2024 flood. Unlike scenario-only approaches, this framework provides event-calibrated and statistically validated flood hazard maps. Furthermore, it covers the entire CRB domain rather than localized sub-basins, bridging the gap between basin-scale hazard assessment and ground-truth validation. This integrated approach not only refines the hydrodynamic representation of the basin but also establishes a reproducible workflow that links rainfall–runoff generation, hydraulic routing, and spatial hazard classification, providing operationally useful outputs for both research and disaster risk management. Rather than introducing new algorithms, this study demonstrates a practical application of established hydrologic–hydraulic methods by integrating event validation, community-sourced flood evidence, and municipal RTK survey data within a basin-scale HMS–RAS workflow under the data limitations of a developing country context.
Recent reviews, including Maranzoni et al. (2023) [11], highlight that while flood depth remains the most frequently applied intensity parameter in large-scale assessments, integrating flow velocity provides a more physically meaningful representation of hazard, especially in terms of human instability and structural forces. In this study, both depth and velocity outputs from HEC-RAS 2D were incorporated to align with established international hazard frameworks, such as the AIDR (Australia), DEFRA FD2321 (UK) [45], and the EU Floods Directive [97], which explicitly prescribe depth–velocity-based classifications for impact assessment [45,98,99]. While depth–velocity metrics can enrich hazard representation [100], particularly for assessing human stability and structural forces, implementing them meaningfully requires robust velocity calibration data, which are not yet available in this basin. Although direct field validation of velocity was not available for this event, simulated velocity fields underwent plausibility checks against channel geometry, slope, and hydraulic behavior. The combined use of depth and velocity provides a more comprehensive hazard representation than depth-only approaches, while remaining consistent with the operational constraints of data-scarce basins. Future work will aim to calibrate velocity using drone-based videogrammetry, in-channel ADCP measurements, or remote-sensing-derived flow proxies as these datasets become available.
Event-based coupling of HEC-HMS and HEC-RAS 2D has been widely adopted in flood hazard studies across different river basins worldwide, reinforcing the robustness of this framework. For example, Sayama et al. (2012) [101,102] applied a rainfall–runoff–inundation (RRI) model calibrated with observed flood marks in Thailand’s Chao Phraya River Basin, successfully reproducing the 2011 mega-flood. Similarly, Kumar et al. (2023) [103] reviewed flood inundation modeling approaches and highlighted the strengths of 2D hydraulic models, such as HEC-RAS, for producing reliable depth and velocity fields when calibrated against field data. Similarly, Vashist and Singh (2023) [104] applied HEC-RAS 2D in India’s Krishna River Basin and produced inundation maps consistent with recorded flood levels, highlighting the reliability of hydraulic models when calibrated against field data. In Bangladesh, Islam and Rahman (2023) [105] used HEC-RAS 2D to develop flood inundation maps for extreme return-period events, reporting good agreement between simulated depths and observed marks. More recently, an integrated HEC-HMS/HEC-RAS framework coupled with GIS was tested in Türkiye’s Göksu River Basin, producing validated flood hazard maps that illustrate the value of linking rainfall–runoff generation to hydraulic routing in a basin-scale context [45]. A broader review further confirmed that applications of HEC-RAS 2D across different regions typically achieve moderate statistical fits, yet still yield operationally useful hazard maps [106].
Despite producing event-based, validated flood hazard maps for the Cagayan River Basin, several limitations remain. First, the availability of observational data constrained the calibration and validation process. Only 137 reference points (flood marks, community reports, and RTK water district data) were available, with the majority concentrated in Tuguegarao City, which limits the spatial representativeness of the data across the basin. This uneven distribution may bias the validation toward urban centers while underrepresenting upstream tributaries and rural floodplains. Future work should expand field validation networks, as highlighted by Mahmood et al. (2025) [107], who recommend integrating multiple observation sources, including radar rainfall and remote sensing flood extents, to reduce data gaps in urban and rural settings. Second, the use of daily rainfall and discharge records limited the model’s ability to capture short-duration, high-intensity rainfall bursts that significantly influence the rising limbs of the hydrograph. Sub-daily datasets (e.g., 3-hourly satellite precipitation or local automatic weather station data) could improve the fidelity of event dynamics. This study uses daily rainfall, which limits the ability of the hydrologic model to reproduce short-duration rainfall peaks and flood wave timing. As such, the workflow should be interpreted strictly as a post-event reconstruction rather than a predictive tool. Reliable flood forecasting would require sub-daily rainfall, detailed reservoir release records, and more extensive calibration. The approach demonstrates how hazard patterns may be reconstructed under limited data conditions, but it is not intended to replace operational flood models.
Similarly, the terrain representation, although derived from LiDAR in some reaches, was generalized at a 100 × 100 m grid resolution, potentially underestimating microtopographic controls on inundation in low-lying settlements and agricultural zones. The use of high-resolution DEMs and land cover datasets, as demonstrated by Toledo Salgado et al. (2025) [108], can improve dam-break and floodplain modeling by providing more detailed spatial roughness and terrain representation. Third, the HEC-HMS/HEC-RAS configuration employed a baseline Manning’s roughness coefficient of 0.07, with selective adjustments applied to channel reaches and urban flow paths through breakline-based refinement. While this ensured numerical stability, it does not fully capture the spatial variability of land cover and hydraulic resistance (urbanized channels vs. forested floodplains). Studies [109,110] have shown that calibrating spatially variable roughness coefficients across channel segments and floodplains significantly improves accuracy in water surface elevations. Automated calibration methods such as Raspy-Cal [111] could also reduce manual tuning bias and optimize roughness distribution. Finally, the model does not yet incorporate sediment dynamics, levee breach scenarios, or climate change projections, which are critical in a sediment-laden, dam-regulated system like the Cagayan. Without these, the hazard maps reflect current event conditions but may underestimate future risk under altered climate and land-use regimes. Similar challenges were noted by Brunner (2021) [112], who emphasized that ensemble modeling and data assimilation approaches are crucial for better representing hydrologic extremes under climate uncertainty. Integrating sediment transport models and climate scenarios into the HEC-HMS/HEC-RAS framework would therefore provide more realistic long-term hazard and risk assessments.
Building on the present event-based, validated framework, several avenues can further strengthen flood hazard assessment in the CRB and beyond. One promising direction is the integration of artificial intelligence (AI) [88,113,114] and machine learning (ML) [115,116] techniques for bias correction, parameter optimization, and real-time flood forecasting. Recent studies have shown that AI-based hybrid models can enhance the predictive capabilities of traditional hydrologic–hydraulic simulations by learning from observational datasets and satellite-derived flood extents, thereby reducing systematic errors and improving early warning systems [117]. Another area is the development of hybrid models that combine process-based simulations with data-driven approaches. For example, coupling HEC-HMS/HEC-RAS with ML-based surrogate models or ensemble techniques can accelerate computations while maintaining physical interpretability, enabling rapid scenario testing under various inflow and land-use conditions. This approach can also support probabilistic flood hazard assessments that better capture uncertainties in rainfall forcing, roughness assignment, and climate variability.
Finally, future research should consider multi-scale physical modeling and integration with Earth observation systems. Linking basin-scale hydraulic models with high-resolution physical process models (levee breach dynamics, sediment transport, urban drainage) can improve the representation of complex flood processes. Incorporating climate change scenarios, downscaled rainfall projections, and sediment management modules would extend the applicability of hazard maps from event validation toward long-term resilience planning. Together, these innovations, AI integration, hybrid modeling, and advanced physical coupling, offer pathways to produce more accurate, dynamic, and decision-relevant flood hazard information.
The validated flood hazard maps generated in this study provide both scientific and practical value for flood risk management in the CRB. Validation points are most dense in the Tuguegarao corridor due to data availability and ease of field access following major floods. Future work will incorporate satellite-based flood extents to extend spatial validation coverage upstream when high-quality imagery is available. From a scientific standpoint, the integration of HEC-HMS rainfall–runoff modeling with HEC-RAS 2D hydraulics, calibrated against observed flood marks, demonstrates the feasibility of producing event-based, basin-scale flood hazard layers in data-limited tropical basins. The findings contribute to the global body of hydrologic–hydraulic research by showing that even under moderate validation metrics, spatial hazard patterns remain robust and decision-relevant, aligning with similar studies worldwide. For practical applications, the results serve as decision-support tools for disaster preparedness, response, and long-term planning. The hazard maps can be used by local government units (LGUs), water resource managers, and disaster risk reduction offices to identify priority areas for evacuation planning, infrastructure protection, and emergency response deployment, especially in downstream floodplain communities such as Tuguegarao City. Moreover, the classification of hazard zones by flood depth enables integration with exposure and vulnerability datasets (population, housing, agriculture), supporting multi-hazard risk assessments consistent with the Philippine DRRM Framework and the Sendai Framework for Disaster Risk Reduction [15,18].
At the policy level, the study highlights the importance of evidence-based flood hazard mapping in supporting climate-resilient land-use planning, infrastructure design, and watershed management. The event-validated hazard layers provide a defensible reference for situational awareness and post-flood planning, serving as a foundation that can be progressively enhanced through the future integration of climate change projections, sediment management scenarios, and AI-based flood forecasting systems. While not intended to replace detailed municipal-level engineering studies or formal DRRM operational products, the outputs demonstrate how basin-scale, event-validated modeling can inform local preparedness discussions, complement LGU exposure assessments, and strengthen long-term resilience planning efforts in data-limited regions. This contribution fills a practical gap in Philippine basin-scale flood modeling and establishes a scientific basis for continued refinement and eventual integration into multi-agency disaster risk reduction workflows.
5. Conclusions
This study developed and validated a basin-scale flood hazard mapping framework for the CRB by coupling HEC-HMS rainfall–runoff modeling with HEC-RAS 2D hydraulics, supported by GIS-based preprocessing and validation against 137 surveyed flood marks. Results show that the model reproduced the timing and magnitude of flood peaks at major outlets, with moderate correlation (R2 = 0.56), slight bias (+0.32 m), and acceptable error magnitudes (RMSE = 1.61 m; MAE = 1.43 m), despite limitations in predictive efficiency (NSE = −2.30) due to daily timestep constraints. The resulting hazard maps classified 767.97 km2 of inundated floodplain, about 2.77% of the CRB, which has more settlements and communities, into five hazard levels, with a quarter of it falling under high to very high hazard categories, concentrated around Tuguegarao City, the Magat confluence, and downstream reaches.
Compared with previous scenario-based or geographically limited studies in the basin, the present work contributes an event-based, statistically validated, and domain-wide flood hazard product, bridging the gap between large-scale hydrologic simulations and ground-truth verification. Despite constraints in data availability, resolution, and roughness parameterization, the framework provides operationally useful hazard layers that can guide disaster preparedness, evacuation planning, and land-use management.
Future work should focus on integrating higher-resolution rainfall and terrain datasets, distributed roughness calibration, and climate-scenario analysis to improve local-scale accuracy. Emerging approaches, such as AI-driven bias correction, hybrid physical–data models, and sediment-inclusive simulations, offer promising pathways to strengthen predictive capabilities. The results demonstrate that even under daily forcing and limited gauge coverage, event-validated flood modeling can provide decision-relevant hazard information for DRRM and land-use planning in large tropical basins. Future efforts will expand field surveys upstream and incorporate satellite-derived flood extents to improve the spatial representativeness of validation. Overall, the study demonstrates that validated hydrologic–hydraulic modeling, even under data limitations, can deliver robust and actionable flood hazard information for disaster risk reduction and climate resilience planning in one of the Philippines’ most flood-prone basins.
Author Contributions
Conceptualization, W.D.C., F.J.T., C.E.F.M. and J.G.G.; methodology, W.D.C., C.E.F.M. and J.G.G.; software, W.D.C. and J.G.G.; validation, W.D.C. and J.G.G.; formal analysis, C.E.F.M. and J.G.G.; investigation, W.D.C. and J.G.G.; resources, C.E.F.M. and F.J.T.; data curation, W.D.C. and J.G.G.; writing—original draft preparation, W.D.C.; writing—review and editing, F.J.T., C.E.F.M. and J.G.G.; visualization, J.G.G.; supervision, F.J.T. and C.E.F.M.; project administration, F.J.T. and C.E.F.M.; funding acquisition, W.D.C. All authors have read and agreed to the published version of the manuscript.
Funding
This research received no external funding.
Institutional Review Board Statement
Not applicable.
Informed Consent Statement
Not applicable.
Data Availability Statement
Data supporting the findings of this study were obtained from PAGASA, NIA–Magat River Integrated Irrigation System, Metropolitan Tuguegarao Water District, and local government units, and are subject to institutional restrictions. Flood mark survey data and model outputs are available from the corresponding author upon reasonable request. No new publicly archived datasets were generated.
Acknowledgments
The authors thank God, their families, and colleagues for their continuous support. Appreciation is extended to the Metropolitan Tuguegarao Water District (MTWD) and local government units for providing essential data. This work was supported by the Department of Science and Technology—Engineering Research and Development for Technology (DOST-ERDT) Scholarship Program.
Conflicts of Interest
The authors declare no conflicts of interest.
Abbreviations
The following abbreviations are used in this manuscript:
| CN | Curve Number |
| CRB | Cagayan River Basin |
| CRS | Coordinate Reference System |
| DEM | Digital Elevation Model |
| GIS | Geographic Information System |
| HEC-HMS | Hydrologic Engineering Center—Hydrologic Modeling System |
| HEC-RAS | Hydrologic Engineering Center—River Analysis System |
| LiDAR | Light Detection and Ranging |
| LULC | Land Use/Land Cover |
| MAE | Mean Absolute Error |
| MTWD | Metropolitan Tuguegarao Water District |
| NSE | Nash–Sutcliffe Efficiency |
| PAGASA | Philippine Atmospheric, Geophysical and Astronomical Services Administration |
| RMSE | Root Mean Square Error |
| RTK | Real-Time Kinematic |
| R2 | Coefficient of Determination |
| SWAT | Soil and Water Assessment Tool |
| UTM | Universal Transverse Mercator |
References
- Donat, M.G.; Lowry, A.L.; Alexander, L.V.; O’gorman, P.A.; Maher, N. Addendum: More Extreme Precipitation in the World’s Dry and Wet Regions. Nat. Clim. Change 2017, 7, 154–158. [Google Scholar] [CrossRef]
- Westra, S.; Alexander, L.V.; Zwiers, F.W. Global Increasing Trends in Annual Maximum Daily Precipitation. J. Clim. 2013, 26, 3904–3918. [Google Scholar] [CrossRef]
- Kundzewicz, Z.W.; Pińskwar, I. Are Pluvial and Fluvial Floods on the Rise? Water 2022, 14, 2612. [Google Scholar] [CrossRef]
- Kundzewicz, Z.W.; Kanae, S.; Seneviratne, S.I.; Handmer, J.; Nicholls, N.; Peduzzi, P.; Mechler, R.; Bouwer, L.M.; Arnell, N.; Mach, K.; et al. Le Risque d’inondation et Les Perspectives de Changement Climatique Mondial et Régional. Hydrol. Sci. J. 2014, 59, 1–28. [Google Scholar] [CrossRef]
- Alfieri, L.; Bisselink, B.; Dottori, F.; Naumann, G.; de Roo, A.; Salamon, P.; Wyser, K.; Feyen, L. Global Projections of River Flood Risk in a Warmer World. Earth’s Future 2017, 5, 171–182. [Google Scholar] [CrossRef]
- Winsemius, H.C.; Aerts, J.C.J.H.; Van Beek, L.P.H.; Bierkens, M.F.P.; Bouwman, A.; Jongman, B.; Kwadijk, J.C.J.; Ligtvoet, W.; Lucas, P.L.; Van Vuuren, D.P.; et al. Global Drivers of Future River Flood Risk. Nat. Clim. Change 2016, 6, 381–385. [Google Scholar] [CrossRef]
- Tellman, B.; Sullivan, J.A.; Kuhn, C.; Kettner, A.J.; Doyle, C.S.; Brakenridge, G.R.; Erickson, T.A.; Slayback, D.A. Satellite Imaging Reveals Increased Proportion of Population Exposed to Floods. Nature 2021, 596, 80–86. [Google Scholar] [CrossRef] [PubMed]
- Rentschler, J.; Salhab, M.; Jafino, B.A. Flood Exposure and Poverty in 188 Countries. Nat. Commun. 2022, 13, 3527. [Google Scholar] [CrossRef]
- Apel, H.; Thieken, A.H.; Merz, B.; Blöschl, G. Natural Hazards and Earth System Sciences Flood Risk Assessment and Associated Uncertainty. Nat. Hazards Earth Syst. Sci. 2004, 4, 295–308. [Google Scholar] [CrossRef]
- Kvočka, D.; Falconer, R.A.; Bray, M. Flood Hazard Assessment for Extreme Flood Events. Nat. Hazards 2016, 84, 1569–1599. [Google Scholar] [CrossRef]
- Maranzoni, A.; D’Oria, M.; Rizzo, C. Quantitative Flood Hazard Assessment Methods: A Review. J. Flood Risk Manag. 2023, 16, e12855. [Google Scholar] [CrossRef]
- Sampson, C.C.; Smith, A.M.; Bates, P.D.; Neal, J.C.; Alfieri, L.; Freer, J.E. A High-resolution Global Flood Hazard Model. Water Resour. Res. 2015, 51, 7358–7381. [Google Scholar] [CrossRef] [PubMed]
- Tehrany, M.S.; Pradhan, B.; Jebur, M.N. Spatial Prediction of Flood Susceptible Areas Using Rule Based Decision Tree (DT) and a Novel Ensemble Bivariate and Multivariate Statistical Models in GIS. J. Hydrol. 2013, 504, 69–79. [Google Scholar] [CrossRef]
- Bersabe, J.T.; Jun, B.W. The Machine Learning-Based Mapping of Urban Pluvial Flood Susceptibility in Seoul Integrating Flood Conditioning Factors and Drainage-Related Data. ISPRS Int. J. Geo-Inf. 2025, 14, 57. [Google Scholar] [CrossRef]
- Gacu, J.G.; Monjardin, C.E.F.; Senoro, D.B.; Tan, F.J. Flood Risk Assessment Using GIS-Based Analytical Hierarchy Process in the Municipality of Odiongan, Romblon, Philippines. Appl. Sci. 2022, 12, 9456. [Google Scholar] [CrossRef]
- Gacul, L.-A.; Ferrancullo, D.; Gallano, R.; Fadriquela, K.J.; Mendez, K.J.; Morada, J.R.; Morgado, J.K.; Gacu, J. GIS-Based Identification of Flood Risk Zone in a Rural Municipality Using Fuzzy Analytical Hierarchy Process (FAHP). Rev. Int. Géomat. 2024, 33, 295–320. [Google Scholar] [CrossRef]
- Gacu, J.G.; Monjardin, C.E.F.; de Jesus, K.L.M.; Senoro, D.B. GIS-Based Risk Assessment of Structure Attributes in Flood Zones of Odiongan, Romblon, Philippines. Buildings 2023, 13, 506. [Google Scholar] [CrossRef]
- United Nations Office for Disaster Risk Reduction. Sendai Framework for Disaster Risk Reduction 2015–2030; United Nations Office for Disaster Risk Reduction (UNDRR): Geneva, Switzerland, 2015; Volume 1. [Google Scholar]
- de Moel, H.; Aerts, J.C.J.H. Effect of Uncertainty in Land Use, Damage Models and Inundation Depth on Flood Damage Estimates. Nat. Hazards 2011, 58, 407–425. [Google Scholar] [CrossRef]
- Kreibich, H.; Bubeck, P.; Van Vliet, M.; De Moel, H. A Review of Damage-Reducing Measures to Manage Fluvial Flood Risks in a Changing Climate. Mitig. Adapt. Strateg. Glob. Change 2015, 20, 967–989. [Google Scholar] [CrossRef]
- Papathoma-Köhle, M.; Gems, B.; Sturm, M.; Fuchs, S. Matrices, Curves and Indicators: A Review of Approaches to Assess Physical Vulnerability to Debris Flows. Earth-Sci. Rev. 2017, 171, 272–288. [Google Scholar] [CrossRef]
- Rufat, S.; Tate, E.; Burton, C.G.; Maroof, A.S. Social Vulnerability to Floods: Review of Case Studies and Implications for Measurement. Int. J. Disaster Risk Reduct. 2015, 14, 470–486. [Google Scholar] [CrossRef]
- Costabile, P.; Costanzo, C.; Ferraro, D.; Barca, P. Is HEC-RAS 2D Accurate Enough for Storm-Event Hazard Assessment? Lessons Learnt from a Benchmarking Study Based on Rain-on-Grid Modelling. J. Hydrol. 2021, 603, 126962. [Google Scholar] [CrossRef]
- Bodoque, J.M.; Aroca-Jiménez, E.; Eguibar, M.; García, J.A. Developing Reliable Urban Flood Hazard Mapping from LiDAR Data. J. Hydrol. 2023, 617, 128975. [Google Scholar] [CrossRef]
- Afshari, S.; Tavakoly, A.A.; Rajib, M.A.; Zheng, X.; Follum, M.L.; Omranian, E.; Fekete, B.M. Comparison of New Generation Low-Complexity Flood Inundation Mapping Tools with a Hydrodynamic Model. J. Hydrol. 2018, 556, 539–556. [Google Scholar] [CrossRef]
- Musolino, G.; Ahmadian, R.; Xia, J.; Falconer, R.A. Mapping the Danger to Life in Flash Flood Events Adopting a Mechanics Based Methodology and Planning Evacuation Routes. J. Flood Risk Manag. 2020, 13, e12627. [Google Scholar] [CrossRef]
- Yamazaki, D.; Ikeshima, D.; Tawatari, R.; Yamaguchi, T.; O’Loughlin, F.; Neal, J.C.; Sampson, C.C.; Kanae, S.; Bates, P.D. A High-Accuracy Map of Global Terrain Elevations. Geophys. Res. Lett. 2017, 44, 5844–5853. [Google Scholar] [CrossRef]
- Hawker, L.; Rougier, J.; Neal, J.; Bates, P.; Archer, L.; Yamazaki, D. Implications of Simulating Global Digital Elevation Models for Flood Inundation Studies. Water Resour. Res. 2018, 54, 7910–7928. [Google Scholar] [CrossRef]
- Nobre, A.D.; Cuartas, L.A.; Hodnett, M.; Rennó, C.D.; Rodrigues, G.; Silveira, A.; Waterloo, M.; Saleska, S. Height Above the Nearest Drainage—A Hydrologically Relevant New Terrain Model. J. Hydrol. 2011, 404, 13–29. [Google Scholar] [CrossRef]
- Medeiros, S.C.; Hagen, S.C.; Weishampel, J.F. Comparison of Floodplain Surface Roughness Parameters Derived from Land Cover Data and Field Measurements. J. Hydrol. 2012, 452–453, 139–149. [Google Scholar] [CrossRef]
- Straatsma, M.W.; Baptist, M.J. Floodplain Roughness Parameterization Using Airborne Laser Scanning and Spectral Remote Sensing. Remote Sens. Environ. 2008, 112, 1062–1080. [Google Scholar] [CrossRef]
- Abu-Aly, T.R.; Pasternack, G.B.; Wyrick, J.R.; Barker, R.; Massa, D.; Johnson, T. Effects of LiDAR-Derived, Spatially Distributed Vegetation Roughness on Two-Dimensional Hydraulics in a Gravel-Cobble River at Flows of 0.2 to 20 Times Bankfull. Geomorphology 2014, 206, 468–482. [Google Scholar] [CrossRef]
- DeVries, B.; Huang, C.; Armston, J.; Huang, W.; Jones, J.W.; Lang, M.W. Rapid and Robust Monitoring of Flood Events Using Sentinel-1 and Landsat Data on the Google Earth Engine. Remote Sens. Environ. 2020, 240, 111664. [Google Scholar] [CrossRef]
- Martinis, S.; Plank, S.; Ćwik, K. The Use of Sentinel-1 Time-Series Data to Improve Flood Monitoring in Arid Areas. Remote Sens. 2018, 10, 583. [Google Scholar] [CrossRef]
- Tarpanelli, A.; Mondini, A.C.; Camici, S. Effectiveness of Sentinel-1 and Sentinel-2 for Flood Detection Assessment in Europe. Nat. Hazards Earth Syst. Sci. 2022, 22, 2473–2489. [Google Scholar] [CrossRef]
- Chai, T.; Draxler, R.R. Root Mean Square Error (RMSE) or Mean Absolute Error (MAE)?—Arguments against Avoiding RMSE in the Literature. Geosci. Model Dev. 2014, 7, 1247–1250. [Google Scholar] [CrossRef]
- Willmott, C.J.; Matsuura, K. Advantages of the Mean Absolute Error (MAE) over the Root Mean Square Error (RMSE) in Assessing Average Model Performance. Clim. Res. 2005, 30, 79–82. [Google Scholar] [CrossRef]
- Herbei, M.V.; Bădăluță-Minda, C.; Popescu, C.A.; Horablaga, A.; Dragomir, L.O.; Popescu, G.; Kader, S.; Sestras, P. Rainfall-Runoff Modeling Based on HEC-HMS Model: A Case Study in an Area with Increased Groundwater Discharge Potential. Front. Water 2024, 6, 1474990. [Google Scholar] [CrossRef]
- Odey, G.; Cho, Y. Event-Based vs. Continuous Hydrological Modeling with HEC-HMS: A Review of Use Cases, Methodologies, and Performance Metrics. Hydrology 2025, 12, 39. [Google Scholar] [CrossRef]
- Baltas, E.A.; Dervos, N.A.; Mimikou, M.A. Technical Note: Determination of the SCS Initial Abstraction Ratio in an Experimental Watershed in Greece. Hydrol. Earth Syst. Sci. 2007, 11, 1825–1829. [Google Scholar] [CrossRef]
- Walega, A.; Amatya, D.M.; Caldwell, P.; Marion, D.; Panda, S. Assessment of Storm Direct Runoff and Peak Flow Rates Using Improved SCS-CN Models for Selected Forested Watersheds in the Southeastern United States. J. Hydrol. Reg. Stud. 2020, 27, 100645. [Google Scholar] [CrossRef]
- Budhathoki, B.R.; Adhikari, T.R.; Shrestha, S.; Awasthi, R.P.; Dawadi, B.; Gao, H.; Dhital, Y.P. Application of Hydrological Models to Streamflow Estimation at Ungauged Transboundary Himalayan River Basin, Nepal. Hydrol. Res. 2024, 55, 859–872. [Google Scholar] [CrossRef]
- Pellet, V.; Aires, F.; Yamazaki, D.; Zhou, X.; Paris, A. A First Continuous and Distributed Satellite-Based Mapping of River Discharge over the Amazon. J. Hydrol. 2022, 614, 128481. [Google Scholar] [CrossRef]
- Starks, P.J.; Moriasi, D.N.; Fortuna, A.M. GIS-Based RUSLE Reservoir Sedimentation Estimates: Temporally Variable C-Factors, Sediment Delivery Ratio, and Adjustment for Stream Channel and Bank Sediment Sources. Land 2023, 12, 1913. [Google Scholar] [CrossRef]
- Peker, İ.B.; Gülbaz, S.; Demir, V.; Orhan, O.; Beden, N. Integration of HEC-RAS and HEC-HMS with GIS in Flood Modeling and Flood Hazard Mapping. Sustainability 2024, 16, 1226. [Google Scholar] [CrossRef]
- Serrano, J.S.; Herrera, E.C.; Naito, K. Hydraulic Analysis of the Marikina River Floodplain During Typhoon Vamco Using Numerical Modelling. Proc. Int. Assoc. Hydrol. Sci. 2024, 386, 121–126. [Google Scholar] [CrossRef]
- Ramos Vallente, J.; Cipriano, N.D.; Ponce, M.E.V.; Gamale, J.G.; Daroy, K.A.B.; Cruza, C.V.; Cabugsa, A.S.I. Assessment Of The Existing And Proposed Dike System Along The Cabulig River In Lower Jasaan, Misamis Oriental, Philippines. Int. Arch. Photogramm. Remote Sens. Spat. Inf. Sci.—ISPRS Arch. 2024, 48, 123–131. [Google Scholar] [CrossRef]
- Asube, L.C.S.; Bolanio, K.P.; Abenales, S.C.; Arogancia, M.C. Application of Geospatial Techniques for Estimating and Simulating Soil Erosion and Sediment Yield in Mat-I Creek, Las Nieves, Agusan Del Norte, Philippines. In Proceedings of the 2023 2nd International Conference on Advances in Computational Intelligence and Communication, ICACIC 2023, Puducherry, India, 7–8 December 2023; IEEE: Piscataway, NJ, USA, 2023; pp. 1–6. [Google Scholar]
- Casila, J.C.; Andres, H.L.; Haddout, S.; Yokoyama, K. Sediment Transport Modeling in the Pasig River, Philippines Post Taal Volcano Eruption. Geosciences 2024, 14, 45. [Google Scholar] [CrossRef]
- Casila, J.C.C.; Nicolas, M.D.; Duka, M.; Haddout, S.; Priya, K.L.; Yokoyama, K. Assessing Dissolved Oxygen Dynamics in Pasig River, Philippines: A HEC-RAS Modeling Approach during the COVID-19 Pandemic. Water Pract. Technol. 2024, 19, 1365–1381. [Google Scholar] [CrossRef]
- Yumol, P.J.M.; Santos, F.D. Hydraulic Investigation of the Impacts of Climate and Land Cover Change on Flooding of the Pinacanauan de Ilagan River in Isabela, Philippines. Front. Environ. Sci. 2025, 13, 1604757. [Google Scholar] [CrossRef]
- Robles, K.P.V.; Monjardin, C.E.F. Forecasting Climate Change Impacts on Water Security Using HEC-HMS: A Case Study of Angat Dam in the Philippines. Water 2025, 17, 2085. [Google Scholar] [CrossRef]
- Cinco, T.A.; de Guzman, R.G.; Hilario, F.D.; Wilson, D.M. Long-Term Trends and Extremes in Observed Daily Precipitation and near Surface Air Temperature in the Philippines for the Period 1951–2010. Atmos. Res. 2014, 145–146, 12–26. [Google Scholar] [CrossRef]
- Hong, J.; Agustin, W.; Yoon, S.; Park, J.S. Changes of Extreme Precipitation in the Philippines, Projected from the CMIP6 Multi-Model Ensemble. Weather Clim. Extrem. 2022, 37, 100480. [Google Scholar] [CrossRef]
- Bharambe, K.; Kantoush, S.; Sumi, T.; Saber, M.; Balderama, O. Spatio-Temporal Variability and Trends of Extreme Rainfall and Temperature Events over Cagayan River Basin, Philippines. In Proceedings of the 23rd DPRI Annual Meeting, Kyoto University, Kyoto, Japan, 21–23 February 2013. C306. [Google Scholar]
- Dingle, E.H.; Paringit, E.C.; Tolentino, P.L.M.; Williams, R.D.; Hoey, T.B.; Barrett, B.; Long, H.; Smiley, C.; Stott, E. Decadal-Scale Morphological Adjustment of a Lowland Tropical River. Geomorphology 2019, 333, 30–42. [Google Scholar] [CrossRef]
- Hoey, T.; Tolentino, P.; Guardian, E.; Williams, R.; Boothroyd, R.; David, C.P.; Paringit, E. Flood Estimation for Ungauged Catchments in the Philippines Using Multiple Archival Data Records. In Proceedings of the vEGU21, the 23rd EGU General Assembly, EGU21-4905, Online, 19–30 April 2021. [Google Scholar]
- Boothroyd, R.J.; Williams, R.D.; Hoey, T.B.; Barrett, B.; Prasojo, O.A. Applications of Google Earth Engine in Fluvial Geomorphology for Detecting River Channel Change. Wiley Interdiscip. Rev. Water 2021, 8, e21496. [Google Scholar] [CrossRef]
- Tolentino, P.L.M.; Perez, J.E.G.; Guardian, E.L.; Boothroyd, R.J.; Hoey, T.B.; Williams, R.D.; Fryirs, K.A.; Brierley, G.J.; David, C.P.C. River Styles and Stream Power Analysis Reveal the Diversity of Fluvial Morphology in a Philippine Tropical Catchment. Geosci. Lett. 2022, 9, 6. [Google Scholar] [CrossRef]
- The Manila Times. The Manila Times ‘Ulysses’ Floods Shut down Metro Manila. Available online: https://www.manilatimes.net/2020/11/13/news/headlines/ulysses-floods-shut-down-metro-manila/795623/ (accessed on 28 June 2021).
- Macalalad, R.V.; Delfino, R.J.P.; Badilla, R.A.; Paat, S.F.; Bagtasa, G. Role of Historical Warming on the Extreme Flooding Event Due to Typhoon Vamco (Ulysses) 2020 in the Philippines. Philipp. J. Sci. 2023, 152, 197–212. [Google Scholar] [CrossRef]
- Santos, G.D.C. 2020 Tropical Cyclones in the Philippines: A Review. Trop. Cyclone Res. Rev. 2021, 10, 191–199. [Google Scholar] [CrossRef]
- Felipe, A.J.B.; Alejo, L.A.; Balderama, O.F.; Rosete, E.A. Climate Change Intensifies the Drought Vulnerability of River Basins: A Case of the Magat River Basin. J. Water Clim. Change 2023, 14, 1012–1038. [Google Scholar] [CrossRef]
- Felipe, A.J.B.; Alejo, L.A.; Padre, R.J.; Bareng, J.L.R. Past and Future River Bank Trend Assessment of Lower Cagayan River, Philippines. Environ. Dev. Sustain. 2024. [Google Scholar] [CrossRef]
- Tupas, M.E.; Roth, F.; Bauer-Marschallinger, B.; Wagner, W. An Intercomparison of Sentinel-1 Based Change Detection Algorithms for Flood Mapping. Remote Sens. 2023, 15, 1200. [Google Scholar] [CrossRef]
- Kurihara, Y.; Miyamoto, M.; Sunakawa, R. Flood Direct Damage Assessment Due to Typhoon Ulysses by Satellite Images. Int. J. Disaster Risk Reduct. 2025, 118, 105067. [Google Scholar] [CrossRef]
- Singson, C.L.; Alejo, L.A.; Balderama, O.F.; Bareng, J.L.R.; Kantoush, S.A. Modeling Climate Change Impact on the Inflow of the Magat Reservoir Using the Soil and Water Assessment Tool (SWAT) Model for Dam Management. J. Water Clim. Change 2023, 14, 633–650. [Google Scholar] [CrossRef]
- Gallentes, A.T.; Manglicmot, M.T.; Gong, S.Y.; Hu, H.M.; Shen, C.C.; Siringan, F.P. Coral Boulder Transport and Gravel Bar Formation by Storms in Lumaniag Village, Batangas, Northwestern Philippines. Geomorphology 2021, 376, 107554. [Google Scholar] [CrossRef]
- Petilla, C.E.R.; Olaguera, L.M.P.; Matsumoto, J. Changes in Intensity and Tracks of Tropical Cyclones Crossing the Central and Southern Philippines from 1979 to 2020: An Observational Study. Prog. Earth Planet. Sci. 2023, 10, 32. [Google Scholar] [CrossRef]
- Monjardin, C.E.F.; Uy, F.A.A.; Tan, F.J.; Carpio, R.C.; Javate, K.C.P.; Laquindanum, J.P. Application of Artificial Neuro-Fuzzy Interference System in Rainfall-Runoff Modelling at Imus River, Cavite. In Proceedings of the 2020 IEEE Conference on Technologies for Sustainability (SusTech), Santa Ana, CA, USA, 23–25 April 2020. [Google Scholar] [CrossRef]
- Holden, W.N. Typhoons, Climate Change, and Climate Injustice in the Philippines. ASEAS—Austrian J. South-East Asian Stud. 2018, 11, 117. [Google Scholar]
- Mata, C.B.; Balderama, O.F.; Alejo, L.A.; Bareng, J.L.R.; Kantoush, S.A. Satellite-Based Flood Inundation and Damage Assessment. J. Robot. Autom. Res. 2022, 3, 209–219. [Google Scholar] [CrossRef]
- Bharambe, K.P.; Kantoush, S.; Goto, H.; Sumi, T.; Saber, M. Climate Change Impacts on Spatiotemporal Variation of Extreme Weather and Its Consequences on Dam Optimisation and Risk Management in the Cagayan Basin, Philippines. APN Sci. Bull. 2023, 13, 208–223. [Google Scholar] [CrossRef]
- Baleta, F.N.; Bolaños, J.M. International Journal of Fisheries and Aquatic Studies 2016; 4, 254-260 Phytoplankton Identification and Water Quality Monitoring along the Fish-Cage Belt at Magat Dam Reservoir, Philippines. Int. J. Fish. Aquat. Stud. 2016, 4, 254–260. [Google Scholar]
- Sarmiento, C.J.S.; Ayson, R.J.V.; Gonzalez, R.M.; Castro, P.P.M. Remote Sensing and GIS in Inflow Estimation: The Magat Reservoir, Philippines Experience. Int. Arch. Photogramm. Remote Sens. Spat. Inf. Sci.—ISPRS Arch. 2010, 38, 227–232. [Google Scholar]
- Cruz, D.; Josephine, D.; Aguinaldo, M.C.; Guzman, E.D.; Ancheta, F.R. Fertility Assessment and Mapping of Rice Areas under the Magat River Integrated Irrigation System in Isabela, Philippines. Int. J. Agric. Technol. 2015, 11, 581–594. [Google Scholar]
- Dullana, R. Swollen Rivers Threaten Isabela, Cagayan with Flash Floods. Available online: https://www.rappler.com/philippines/215606-swollen-rivers-threaten-isabela-cagayan-flashfloods-october-30-2018/ (accessed on 14 November 2024).
- Garousi-Nejad, I.; Tarboton, D.G.; Aboutalebi, M.; Torres-Rua, A.F. Terrain Analysis Enhancements to the Height Above Nearest Drainage Flood Inundation Mapping Method. Water Resour. Res. 2019, 55, 7983–8009. [Google Scholar] [CrossRef]
- Nastiti, K.D.; Kim, Y.; Jung, K.; An, H. The Application of Rainfall-Runoff-Inundation (RRI) Model for Inundation Case in Upper Citarum Watershed, West Java-Indonesia. Procedia Eng. 2015, 125, 166–172. [Google Scholar] [CrossRef]
- Singh, L.; Mishra, P.K.; Pingale, S.M.; Khare, D.; Thakur, H.P. Streamflow Regionalisation of an Ungauged Catchment with Machine Learning Approaches. Hydrol. Sci. J. 2022, 67, 886–897. [Google Scholar] [CrossRef]
- Mishra, S.; Sahu, P.K.; Sarkar, A.K.; Mehran, B.; Sharma, S. Geo-Spatial Site Suitability Analysis for Development of Health Care Units in Rural India: Effects on Habitation Accessibility, Facility Utilization and Zonal Equity in Facility Distribution. J. Transp. Geogr. 2019, 78, 135–149. [Google Scholar] [CrossRef]
- Fischer, S.; Dallan, E.; Fiori, A.; Grimaldi, S.; Kochanek, K.; Prieto, C.; Reis, D.S.; Volpi, E. Hydrological Design in the HELPING Decade–Inspiring the Community to Innovate the Hydrological Design Concept. Hydrol. Sci. J. 2025, 70, 375–389. [Google Scholar] [CrossRef]
- Natural Resources Conservation Service (NRCS) Kansas. NRCS Manning’s n Values for Various Land Covers to Use for Dam Breach Analyses; NRCS Kansas: USA. 2016. Available online: https://rashms.com/wp-content/uploads/2021/01/Mannings-n-values-NLCD-NRCS.pdf (accessed on 25 October 2025).
- Xu, K.; Fang, J.; Fang, Y.; Sun, Q.; Wu, C.; Liu, M. The Importance of Digital Elevation Model Selection in Flood Simulation and a Proposed Method to Reduce DEM Errors: A Case Study in Shanghai. Int. J. Disaster Risk Sci. 2021, 12, 890–902. [Google Scholar] [CrossRef]
- UP Training Center for Applied Geodesy and Photogrammetry. Regiom 2 Cagayan River: DREAM Ground Surveys Report; University of the Philippines Diliman—TCAGP: Quezon City, Philippines, 2015. [Google Scholar]
- Santillan, J.R.; Makinano-Santillan, M.; Makinano, R.M. Vertical Accuracy Assessment of ALOS World 3D—30M Digital Elevation Model over Northeastern Mindanao, Philippines. In Proceedings of the 2016 IEEE International Geoscience and Remote Sensing Symposium (IGARSS), Beijing, China, 10–15 July 2016; pp. 5374–5377. [Google Scholar] [CrossRef]
- Rana, R.; Kalia, A.; Boora, A.; Alfaisal, F.M.; Alharbi, R.S.; Berwal, P.; Alam, S.; Khan, M.A.; Qamar, O. Artificial Intelligence for Surface Water Quality Evaluation, Monitoring and Assessment. Water 2023, 15, 3919. [Google Scholar] [CrossRef]
- Gacu, J.G.; Monjardin, C.E.F.; Mangulabnan, R.G.T.; Pugat, G.C.E.; Solmerin, J.G. Artificial Intelligence (AI) in Surface Water Management: A Comprehensive Review of Methods, Applications, and Challenges. Water 2025, 17, 1707. [Google Scholar] [CrossRef]
- Kia, M.B.; Pirasteh, S.; Pradhan, B.; Mahmud, A.R.; Sulaiman, W.N.A.; Moradi, A. An Artificial Neural Network Model for Flood Simulation Using GIS: Johor River Basin, Malaysia. Environ. Earth Sci. 2012, 67, 251–264. [Google Scholar] [CrossRef]
- Li, W.; Kiaghadi, A.; Dawson, C. High Temporal Resolution Rainfall–Runoff Modeling Using Long-Short-Term-Memory (LSTM) Networks. Neural Comput. Appl. 2021, 33, 1261–1278. [Google Scholar] [CrossRef]
- Schumann, G.J.; Neal, J.C.; Voisin, N.; Andreadis, K.M.; Pappenberger, F.; Phanthuwongpakdee, N.; Hall, A.C.; Bates, P.D. A First Large-Scale Flood Inundation Forecasting Model. Water Resour. Res. 2013, 49, 6248–6257. [Google Scholar] [CrossRef]
- Dasallas, L.; An, H.; Lee, S. Providing Solutions for Data Scarcity in Urban Fl Ood Modeling through Sensitivity Analysis and DEM Modi Fi Cations. J. Hydroinformatics 2024, 26, 459–479. [Google Scholar] [CrossRef]
- Alfonso, C.D.Q.; Sundo, M.B.; Zafra, R.G.; Velasco, P.P.; Aguirre, J.J.C.; Madlangbayan, M.S. Flood Risk Assessment of Major River Basins in the Philippines. Int. J. GEOMATE 2019, 17, 201–208. [Google Scholar] [CrossRef]
- Principe, J.A.; Blanco, A.C. Integrated Use of Remote Sensing, GIS and Swat Model to Explore Climate Change Effects on River Discharge in the Cagayan River Basin and Land Cover-Based Adaptation Measures. In Proceedings of the 33rd Asian Conference on Remote Sensing 2012, ACRS 2012, Pattaya, Thailand, 26–30 November 2012; Volume 2, pp. 1509–1518. [Google Scholar]
- Dela Torre, D.M.G.; Dela Cruz, P.K.A.; Jose, R.P.; Gatdula, N.B.; Blanco, A.C. GEOSPATIAL ASSESSMENT of VULNERABILITIES of CROPLANDS to FLOODING RISKS: A CASE STUDY of PHILIPPINE RIVER BASINS. Int. Arch. Photogramm. Remote Sens. Spat. Inf. Sci.—ISPRS Arch. 2019, 42, 173–180. [Google Scholar] [CrossRef]
- Gacu, J.; Kantoush, S.; Candelario, R.; Falculan, J.; Moaje, K.V.; Famaran, M.J.; Nepomuceno, M.; Ebon, J.A.; Parungao, R.; Ignacio, R.; et al. Integrated Multi-Hazard Risk Assessment under Compound Disasters Using Analytical Hierarchy Process (AHP). Heliyon 2025, 11, 11. [Google Scholar] [CrossRef]
- European Commission (EC). Water Directors of the European Union Best Practices on Flood Prevention, Protection; European Commission: Brussels, Belgium, 2003; pp. 1–29. [Google Scholar]
- Osti, R.; Tanaka, S.; Tokioka, T. Flood Hazard Mapping in Developing Countries: Problems and Prospects. Disaster Prev. Manag. 2008, 17, 104–113. [Google Scholar] [CrossRef]
- Belayneh, A.; Sintayehu, G.; Gedam, K.; Muluken, T. Evaluation of Satellite Precipitation Products Using HEC-HMS Model. Model. Earth Syst. Environ. 2020, 6, 2015–2032. [Google Scholar] [CrossRef]
- Arrighi, C.; Pregnolato, M.; Dawson, R.J.; Castelli, F. Preparedness against Mobility Disruption by Floods. Sci. Total Environ. 2019, 654, 1010–1022. [Google Scholar] [CrossRef] [PubMed]
- Sayama, T.; Iwami, Y. Rainfall-Runoff and Flood Inundation Predictions Using RRI Model. Disaster Prevention Research Institute (DPRI), Kyoto University, and ICHARM, PWRI: Japan 2016. Available online: https://hywr.kuciv.kyoto-u.ac.jp/ihp/cha/tools/RRI/RRI_CHA.pdf (accessed on 25 October 2025).
- Sayama, T.; Tatebe, Y.; Tanaka, S. An Emergency Response-Type Rainfall-Runoff-Inundation Simulation for 2011 Thailand Floods. J. Flood Risk Manag. 2017, 10, 65–78. [Google Scholar] [CrossRef]
- Kumar, V.; Sharma, K.V.; Caloiero, T.; Mehta, D.J.; Singh, K. Comprehensive Overview of Flood Modeling Approaches: A Review of Recent Advances. Hydrology 2023, 10, 141. [Google Scholar] [CrossRef]
- Vashist, K.; Singh, K.K. HEC-RAS 2D Modeling for Flood Inundation Mapping: A Case Study of the Krishna River Basin. Water Pract. Technol. 2023, 18, 831–844. [Google Scholar] [CrossRef]
- Islam, M.M.; Rahman, M.A. Development of Flood Inundation Map for 100 Years Return Period Using HEC-RAS 2D. AIP Conf. Proc. 2023, 2713, 050005. [Google Scholar] [CrossRef]
- Zainal, N.N.; Talib, S.H.A. Review Paper on Applications of the HEC-RAS Model for Flooding, Agriculture, and Water Quality Simulation. Water Pract. Technol. 2024, 19, 2883–2900. [Google Scholar] [CrossRef]
- Mahmood, M.Q.; Wang, X.; Aziz, F.; Dogulu, N. Urban Flood Modelling: Challenges and Opportunities—A Stakeholder-Informed Analysis. Environ. Model. Softw. 2025, 191, 106507. [Google Scholar] [CrossRef]
- Toledo Salgado, S.R.; Carvalho, E.; Viseu, M.T.; de Oliveira, O.F. Influence of Land Use and Land Cover Datasets on Dam-Break Modeling in the Semiarid Region of Brazil. Nat. Hazards 2025, 121, 18295–18319. [Google Scholar] [CrossRef]
- Ardıçlıoğlu, M.; Kuriqi, A. Calibration of Channel Roughness in Intermittent Rivers Using HEC-RAS Model: Case of Sarimsakli Creek, Turkey. SN Appl. Sci. 2019, 1, 1080. [Google Scholar] [CrossRef]
- Attari, M.; Hosseini, S.M. A Simple Innovative Method for Calibration of Manning’s Roughness Coefficient in Rivers Using a Similarity Concept. J. Hydrol. 2019, 575, 810–823. [Google Scholar] [CrossRef]
- Philippus, D.; Wolfand, J.M.; Abdi, R.; Hogue, T.S. Raspy-Cal: A Genetic Algorithm-Based Automatic Calibration Tool for Hec-Ras Hydraulic Models. Water 2021, 13, 3061. [Google Scholar] [CrossRef]
- Brunner, M.I.; Slater, L.; Tallaksen, L.M.; Clark, M. Challenges in Modeling and Predicting Floods and Droughts: A Review. Wiley Interdiscip. Rev. Water 2021, 8, e1520. [Google Scholar] [CrossRef]
- Biazar, S.M.; Golmohammadi, G.; Nedhunuri, R.R.; Shaghaghi, S.; Mohammadi, K. Artificial Intelligence in Hydrology: Advancements in Soil, Water Resource Management, and Sustainable Development. Sustainability 2025, 17, 2250. [Google Scholar] [CrossRef]
- Gacu, J.G.; Monjardin, C.E.F.; Mangulabnan, R.G.T.; Mendez, J.C.F. Application of Artificial Intelligence in Hydrological Modeling for Streamflow Prediction in Ungauged Watersheds: A Review. Water 2025, 17, 2722. [Google Scholar] [CrossRef]
- Mosavi, A.; Ozturk, P.; Chau, K.W. Flood Prediction Using Machine Learning Models: Literature Review. Water 2018, 10, 1536. [Google Scholar] [CrossRef]
- Monjardin, C.E.F.; Transfiguracion, K.M.; Mangunay, J.P.J.; Paguia, K.M.; Uy, F.A.A.; Tan, F.J. Determination of River Water Level Triggering Flood in Manghinao River in Bauan, Batangas, Philippines. J. Mech. Eng. 2021, 18, 181–192. [Google Scholar] [CrossRef]
- Pham, B.T.; Luu, C.; Van Phong, T.; Nguyen, H.D.; Le, H.V.; Tran, T.Q.; Ta, H.T.; Prakash, I. Flood Risk Assessment Using Hybrid Artificial Intelligence Models Integrated with Multi-Criteria Decision Analysis in Quang Nam Province, Vietnam. J. Hydrol. 2021, 592, 125815. [Google Scholar] [CrossRef]
Disclaimer/Publisher’s Note: The statements, opinions and data contained in all publications are solely those of the individual author(s) and contributor(s) and not of MDPI and/or the editor(s). MDPI and/or the editor(s) disclaim responsibility for any injury to people or property resulting from any ideas, methods, instructions or products referred to in the content. |
© 2025 by the authors. Licensee MDPI, Basel, Switzerland. This article is an open access article distributed under the terms and conditions of the Creative Commons Attribution (CC BY) license (https://creativecommons.org/licenses/by/4.0/).