1. Introduction
Refugee camps, while initially deployed as temporary solutions to humanitarian crises, inevitably transform into more permanent settlements over time. The average lifespan of a refugee camp is seventeen years [
1], during which these settlements undergo significant morphological transformations as residents adapt their surroundings to meet evolving needs. Understanding and monitoring these transitions is crucial for effective humanitarian planning and resource allocation, yet conventional monitoring methods often lack the precision and efficiency needed to track these complex spatial changes.
The spatial transformation of refugee camps represents a critical yet understudied area within humanitarian responses. As camps evolve from emergency shelters to established settlements, their spatial organization undergoes systematic changes that reflect both community needs and administrative constraints. These transformations manifest in physical alterations to shelter units, changes in density patterns, modifications to circulation networks and evolving land use characteristics. Tracking these changes is essential for understanding how camps develop and for implementing effective interventions at critical transition points.
Jordan, as a country that has hosted significant refugee populations since 1947 [
2], provides an ideal context for studying these transformation processes. Al-Azraq refugee camp, established in 2014 for Syrian refugees, exemplifies the early to middle stages of settlement transition, offering valuable insights into morphological evolution patterns and computational methods for their analysis.
1.1. Current Challenges in Refugee Settlement Monitoring
Traditional approaches to monitoring refugee camp transitions face several significant challenges. Manual field observations, while valuable, are resource-intensive and often interrupted by security concerns or access restrictions. Conventional mapping techniques struggle to keep pace with the rapid and often informal changes characterizing camp evolution. The diverse and complex nature of these changes requires sophisticated analytical tools that can detect and quantify subtle modifications across different spatial scales.
Moreover, the temporal aspect of camp transition presents additional challenges. Capturing the sequence and rate of changes requires systematic monitoring over extended periods, which conventional methods struggle to maintain consistently. The need for both spatial precision and temporal consistency has led to increasing interest in computational approaches that can efficiently process and analyze satellite imagery for change detection.
Despite these challenges, recent technological advancements in remote sensing and image analysis offer promising solutions. High-resolution satellite imagery now provides unprecedented opportunities for the systematic monitoring of spatial changes, while computational methods enable the efficient processing and analysis of these data sources. Image segmentation techniques, in particular, show significant potential for automating the detection and quantification of morphological changes in refugee settlements.
1.2. Literature Review on Image Segmentation Methods
Image segmentation represents a fundamental process in computer vision that partitions images into meaningful segments or groups of pixels. In the context of satellite imagery analysis, segmentation techniques enable the identification and extraction of specific features or land cover types, supporting detailed spatial analysis and change detection.
Several pioneering studies have established the value of remote sensing for monitoring settlements. Taubenböck et al. [
3] demonstrated the application of satellite imagery for classifying informal settlements, while Zhang et al. [
4] established foundational methods for deep learning applications in remote sensing. These approaches have gradually been adapted for humanitarian contexts, though their application to refugee settlement analysis remains limited.
Traditional clustering-based segmentation methods, such as K-means clustering, have been widely used for land use classification in remote sensing applications [
5]. These approaches group pixels based on spectral or textural similarities, enabling the differentiation of built structures from surrounding landscapes. While effective for basic classification tasks, these methods often struggle with the complex patterns characteristic of informal settlements.
Beyond refugee settlement analysis, clustering-based segmentation methods have demonstrated effectiveness across diverse application domains. In urban planning, Grippa et al. [
6] applied K-means clustering to map urban deprivation and informal settlements in Sub-Saharan Africa, achieving 87% accuracy in identifying informal urban areas. This application bears methodological similarities to refugee camp analysis, though with greater variability in settlement patterns. Similarly, in disaster response contexts, Ghaffarian et al. [
7] employed clustering techniques to detect building damage after earthquakes, demonstrating the method’s utility for rapid assessment in crisis scenarios.
Environmental monitoring applications have further validated segmentation approaches comparable to those examined in our study. Maxwell et al. [
8] implemented ISO clustering to track deforestation patterns from time-series satellite imagery, achieving a detection accuracy comparable to manual interpretation while reducing analysis time by 60%. Their work emphasized the value of parameter optimization, noting that contextually optimized parameters significantly outperformed default settings—a finding that aligns with our parameter sensitivity analysis for refugee camp contexts.
Deep learning approaches have similarly shown versatility across multiple domains. In agricultural applications, Kamilaris and Prenafeta-Boldú [
9] demonstrated U-Net’s effectiveness for crop field delineation, achieving precision comparable to expert annotation. Their implementation required substantially fewer training samples (40–60 images) than traditional applications due to the regular patterns present in agricultural landscapes—a characteristic shared with planned refugee settlements. This finding suggests the potential of transfer learning approaches in humanitarian contexts where training data availability is limited.
In urban infrastructure mapping, Li et al. [
10] applied SAM to delineate buildings and transportation networks from satellite imagery, reporting a 10–15% accuracy improvement over traditional segmentation methods. However, they noted significant performance degradation (12–18%) when applying models trained on one geographic region to another—a limitation particularly relevant for humanitarian applications across diverse contexts. Their findings reinforce this study’s observation that general-purpose models like SAM require significant adaptation for specialized remote sensing tasks.
These diverse applications demonstrate the potential transferability of the methods evaluated in this study beyond refugee contexts to other humanitarian and development applications. They also highlight common challenges in parameter optimization, training data requirements and cross-context generalizability that transcend specific application domains.
Recent advances in deep learning have introduced more sophisticated approaches to image segmentation. Convolutional Neural Networks (CNNs), particularly architectures like U-Net [
11], have demonstrated remarkable capabilities in semantic segmentation tasks. These approaches learn hierarchical feature representations directly from data, potentially enabling the more accurate identification of complex settlement patterns. However, their application to refugee camp analysis remains underexplored. Plaza et al. [
12] highlight how high-performance computing can make these computationally intensive methods feasible for large-scale spatial analysis, though implementation challenges remain in humanitarian contexts.
The emergence of foundation models like Meta SAM represents the latest development in segmentation technology. These models, trained on diverse datasets, offer potential zero-shot generalization capabilities that could be valuable for humanitarian applications. However, their performance in specialized contexts like refugee settlement analysis requires systematic evaluation.
Commercial geographic information system (GIS) platforms like ArcGIS have also developed specialized segmentation and classification tools that integrate spatial context with spectral information. The Iterative Self-Organizing (ISO) clustering algorithm employed by ArcGIS has shown promising results in land cover classification tasks, but its specific application to refugee settlement monitoring remains to be systematically evaluated.
Despite these technological advances, there exists a significant gap in the literature regarding comparative evaluations of different segmentation methods for refugee settlement monitoring. Gil et al. [
13] argue for the integration of computational methods to provide measurable evidence of morphological change, which is particularly valuable in refugee camp contexts where rapid transformation challenges traditional analytical methods.
Dibble et al. [
14] identify the gap between form and process in morphological studies, further emphasizing the need for methods that can capture dynamic transitions. By enabling the systematic analysis of both spatial patterns and their temporal evolution, semantic segmentation provides a methodological framework that supports both structural and process-oriented morphological analysis.
1.3. Image Segmentation in Humanitarian Contexts
While general remote sensing applications have received substantial attention, several studies have specifically addressed refugee camp monitoring through image segmentation techniques. Lang et al. [
15] pioneered the application of object-based image analysis for monitoring refugee settlements in East Africa, demonstrating how segmentation techniques could effectively identify camp expansion patterns. Their work established the foundation for satellite-based humanitarian monitoring, though computational constraints limited its implementation at scale.
Building on this foundation, Tiede et al. [
16] applied multi-scale segmentation to refugee camps in Jordan and Lebanon, investigating how different spatial resolutions affected detection accuracy for informal structures. Their work demonstrated that hierarchical segmentation approaches achieved optimal results when adapted to local settlement patterns, a finding that directly informed our parameter optimization approach. Similarly, Spröhnle et al. [
17] evaluated texture-based segmentation for identifying refugee structures in complex environments, addressing the critical challenge of distinguishing temporary shelters from surrounding features.
More recently, Ghorbanzadeh et al. [
18] compared various CNN architectures for mapping refugee settlements in Bangladesh, demonstrating the superior performance of semantic segmentation for tracking camp evolution. Their work highlighted significant challenges in model generalizability across different camp contexts—an issue addressed through the comparative methodology presented in this research. Moreover, Jenerowicz et al. [
19] developed multi-temporal segmentation techniques for monitoring Syrian refugee camps in Turkey, establishing methodological precedents for change detection that influenced our current research design.
Despite these advances, the systematic comparison of different segmentation approaches for refugee camp monitoring remains limited, with most studies employing single methodologies without cross-method evaluation. This research addresses this critical gap by providing a comparison across fundamentally different segmentation paradigms while establishing parameter optimization frameworks specifically calibrated for humanitarian contexts.
1.4. Research Objectives, Contribution and Originality
Previous studies have typically focused on single methodologies or restricted their analysis to conventional settlement types, leaving critical questions about performance in humanitarian contexts unanswered.
This research aims to address this gap through a comprehensive evaluation of different image segmentation methods for monitoring refugee camp transitions. The specific objectives of this study are as follows:
To systematically compare the performance of five distinct segmentation approaches (ESRI Landviewer clustering, K-means clustering, U-Net segmentation, Meta SAM and ArcGIS segmentation) in detecting and quantifying morphological changes in refugee settlements.
To establish quantitative benchmarks for segmentation accuracy, computational efficiency and practical applicability in humanitarian contexts.
To identify optimal parameter configurations for each method, particularly focusing on those that yield the most reliable results for refugee settlement analysis.
To develop practical guidelines for implementing these methods in humanitarian planning and response operations.
By achieving these objectives, this research aims to provide valuable methodological guidance for humanitarian organizations, government agencies and researchers involved in refugee settlement planning and management. The findings will contribute to the more effective monitoring of settlement transitions, enabling evidence-based interventions at critical development stages.
While individual segmentation methods have been previously applied to satellite imagery analysis, this research makes several original contributions to the field:
First, this study provides the first systematic comparison of five fundamentally different segmentation approaches specifically optimized for refugee settlement analysis. Unlike previous studies, which typically evaluate variations in a single methodological family [
15,
16], our cross-methodological analysis enables evidence-based selection across diverse technical approaches, directly addressing the implementation challenges identified by humanitarian practitioners.
Second, this research develops and validates a parameter optimization framework specifically calibrated for refugee settlement monitoring. By systematically identifying optimal parameter configurations for different camp characteristics (e.g., spectral detail: 3.0–7.0; spatial detail: 14.0–18.0), we establish practical implementation guidelines unavailable in previous research. This framework directly builds upon Tiede et al.’s [
16] work, which identified parameter selection as a critical limitation in settlement analysis.
Third, our methodology incorporates specific adaptations for monitoring settlement evolution over time, addressing the dynamic nature of refugee camps identified by Lang et al. [
15] and Jenerowicz et al. [
19]. The temporal analysis framework enables the systematic tracking of structural modifications throughout settlement lifecycle stages, providing crucial information for humanitarian planning.
Fourth, while previous studies have primarily focused on technical accuracy [
17,
18], this research integrates practical implementation considerations essential for humanitarian contexts. This includes the systematic analysis of computational requirements, user expertise needs and resource constraints—factors critical for field implementation but often overlooked in technical evaluations.
Finally, by rigorously validating these methods in the specific context of Al-Azraq refugee camp, this research demonstrates real-world applicability and provides quantifiable performance expectations for humanitarian practitioners. This directly responds to Ghorbanzadeh et al.’s [
18] call for the application-specific evaluation of segmentation techniques in diverse humanitarian contexts.
These contributions collectively advance the field by bridging the gap between technical capability and practical implementation in humanitarian contexts, providing methodological guidance specifically adapted to refugee settlement monitoring.
2. Materials and Methods
Al-Azraq refugee camp, located approximately 100 km east of Amman, Jordan, served as the primary case study for this research. Established in 2014 as a response to the Syrian refugee crisis, the camp was designed with a more structured layout than previous emergency settlements, featuring designated “villages” with standardized shelter units. This planned organization provided an ideal baseline for studying subsequent morphological changes.
The camp covers approximately 14.7 square kilometers in a desert area characterized by flat terrain with occasional rocky outcrops. Its initial design accommodated approximately 50,000 refugees, though the actual population has fluctuated over time. The camp’s spatial organization follows a hierarchical structure, with individual shelter units (24 m2 transitional shelters, or “T-shelters”, are standardized semi-permanent structures designed for medium-term refugee accommodation) arranged in clusters, which are further organized into village blocks.
This research focuses primarily on the 2014–2023 period, during which Al-Azraq camp underwent significant morphological transformations. The initial years (2014–2016) represent the planned grid stage, with minimal modifications to the original layout. The middle period (2016–2019) captures the early transition phase, characterized by initial shelter extensions and emerging spatial adaptations. The latest period (2019–2023) documents more complex transformations, including potential vertical development and functional diversification.
The controlled initial conditions and subsequent organic development make Al-Azraq camp an ideal case study for evaluating segmentation methods across different stages of settlement evolution. The relative isolation of the camp from surrounding settlements also simplifies the image analysis process, reducing potential confusion with adjacent urban areas.
2.1. Satellite Image Database
The research utilized an extensive database of satellite imagery collected for Al-Azraq camp. Approximately 90 high-resolution images spanning 2014–2023 were acquired from ESRI Landviewer. These images include both broad coverage of the entire camp and detailed captures at the village and block scales, enabling analysis at multiple scales. A more focused collection of around 80 high-resolution images specifically documenting Village III in Al-Azraq camp was also assembled for the same period, providing a consistent dataset for detailed comparative analysis.
The satellite imagery dataset included a variety of sensors to ensure comprehensive coverage, incorporating Landsat and Sentinel-2. The temporal resolution varied from monthly to quarterly, with higher frequencies during periods of significant change. The spatial resolution ranged from 0.5 m for the high-resolution imagery to 10 m for Sentinel-2 data, providing both detailed structure identification and broader contextual information.
While multispectral imagery can enhance land use classification accuracy through additional spectral bands [
8,
20], this research deliberately focused on RGB imagery supplemented with near-infrared data where available. This methodological decision was guided by three primary considerations: First, humanitarian organizations frequently operate with limited access to complete multispectral datasets, particularly in rapidly evolving emergency contexts where commercial imagery prioritizes spatial resolution over spectral range [
21]. Second, processing multispectral data requires specialized expertise and computational resources often unavailable in field settings [
17]. Third, by focusing on methods applicable to widely available RGB imagery, this study’s findings offer greater practical utility for humanitarian implementers working under resource constraints.
The methodological focus of this research relies on spatial context integration rather than spectral range expansion, aligning with the findings of Quinn et al. [
22], who demonstrated that contextual spatial features often outperform spectral diversity in humanitarian mapping applications.
2.2. Image Preprocessing
Prior to computational analysis, several crucial preprocessing steps were implemented to ensure data quality and consistency, specifically addressing challenges unique to refugee camp imagery analysis.
The initial preprocessing phase began with the comprehensive quality assessment of the satellite imagery. Each image was evaluated for minimum resolution requirements of 0.5 m/pixel, which was essential for accurate structure identification (considering the average shelter size as 24 m2, this ensured a minimum of 48 pixels per structure). Cloud cover was assessed with a strict threshold of less than 10% coverage to ensure the clear visibility of ground features. The impact of shadows on image quality was evaluated, particularly in densely built areas where shadows can obscure small structural modifications. Geometric distortion was carefully checked to ensure the accurate spatial representation of camp structures and layouts.
Geometric correction processes were applied to ensure the spatial accuracy of the imagery. This included three steps:
Orthorectification to remove terrain-induced distortions, critical for the variable terrain surrounding Al-Azraq camp and ensuring the accurate representation of ground features.
UTM coordinate system georeferencing (Zone 37 N) with a RMSE < 0.5 pixels, ensuring consistent spatial reference across the dataset.
Spatial alignment verification across all processed images to maintain accuracy in the comparative analyses.
The final preprocessing step involved comprehensive data standardization. The resolution was standardized across all temporal series to ensure consistency in the analysis. Coordinate systems were verified and standardized across the dataset. Projection alignment was performed to ensure spatial accuracy. Metadata were standardized to maintain consistent documentation across all the processed images.
2.3. Methodological Framework
This research employed a comprehensive methodological framework designed to systematically evaluate different image segmentation approaches across consistent datasets. Each method underwent identical preprocessing and was evaluated using the same validation metrics to ensure fair comparison. The following sections detail the implementation and specific parameters for each of the five segmentation methods evaluated.
2.3.1. ESRI Landviewer Clustering
Initial testing began with ESRI Landviewer’s native clustering tools due to their direct integration with the source imagery platform. This approach offered several distinct advantages. The direct access to the imagery database streamlined the workflow process, while integrated preprocessing capabilities simplified initial data preparation. The straightforward workflow implementation allowed for rapid initial analysis, and the real-time visualization of results facilitated the immediate assessment of clustering effectiveness.
The implementation utilized Landviewer’s unsupervised classification tools with spectral clustering parameters optimized for built environment detection. Classification was performed with 5–7 classes to differentiate between shelter structures, roads, open spaces and surrounding desert landscape. The integrated band combination options were utilized to enhance structure visibility before classification.
However, significant limitations were identified during testing. The control over clustering parameters was constrained by the platform’s fixed options, limiting analytical flexibility. Classification schemes were restricted to predetermined categories, reducing adaptability to specific research needs. Export options for further analysis were limited, constraining integration with other analytical tools. The dependency on platform availability posed potential accessibility issues for long-term research applications.
The clustering results from ESRI Landviewer are presented in
Figure 1,
Figure 2 and
Figure 3, showing the progression of built structures in Al-Azraq camp from 2014 to 2023. As shown in
Figure 1, the initial camp layout in 2014 demonstrates a clear planned grid structure with minimal development.
Figure 2 and
Figure 3 show the development in 2017 and 2023, respectively, demonstrating an increase in the built-up area.
2.3.2. K-Means Clustering
K-means clustering was evaluated as a fundamental unsupervised learning approach, chosen for its algorithmic transparency and widespread use in remote sensing applications. The implementation utilized Python 3.9-based code through scikit-learn 1.0.2, with multiple iterations testing different cluster numbers ranging from k = 3 to k = 10. Euclidean distance-based similarity metrics were employed for cluster assignment, with centroid-based clustering forming the core of the analysis process.
The method’s advantages included algorithmic simplicity and interpretability, which facilitated our understanding of the clustering process. Its minimal computational requirements made it accessible for initial testing, while the flexibility in cluster number selection allowed for experimentation with different classification schemes. Its easy integration with other analysis tools supported comprehensive analytical workflows.
Initial clustering was performed on the RGB bands, with subsequent tests incorporating additional spectral information where available. Preprocessing included the standardization of input features and the iterative testing of initialization methods. The elbow method was employed to determine the optimal cluster numbers for different camp areas, with separate optimizations for densely built areas and surrounding landscapes.
However, several limitations proved significant. The sensitivity to initial centroid placement affected result consistency, while the requirement for predefined cluster numbers posed challenges for automated analysis. The method showed limited capability in handling spatial relationships, which is crucial for refugee camp analysis. Computational inefficiency with large datasets hindered the processing of extensive image collections, and the need for a separate classification process added complexity to the workflow.
Figure 4 presents an example of K-means segmentation applied at the village scale. As illustrated, while the method successfully identified broad settlement patterns, it struggled with clearly delineating individual structure boundaries. To make the clusters more distinguishable,
Figure 5 shows custom cluster colors, which are extracted separately in
Figure 6.
2.3.3. U-Net Segmentation
U-Net was explored for its proven effectiveness in medical image segmentation and potential application to satellite imagery analysis. The technical implementation utilized the PyTorch framework (v1.9.0), incorporating an encoder–decoder architecture with skip connections for feature preservation. The model employed a binary cross-entropy loss function for training optimization.
The model architecture consisted of four encoding blocks (each with two convolutional layers followed by ReLU activation and max pooling) and corresponding decoding blocks with up-sampling operations. Skip connections linked corresponding encoder and decoder levels to preserve spatial information. Input images were processed at 256 × 256 pixel resolution, with data augmentation including rotation, flipping and contrast adjustments to enhance model generalization.
Training employed a subset of manually labeled images from Al-Azraq camp, with approximately 50 images used for model development. The training process utilized an Adam optimizer with a learning rate of 0.001 and batch size of 16, running for 100 epochs, with early stopping based on validation performance. The implementation required significant computational resources, utilizing GPU acceleration to manage training demands.
The method demonstrated several potential advantages, including a high accuracy potential in feature detection and robust feature extraction capabilities. The preservation of spatial relationships through skip connections offered promising results for structural analysis, while its multi-scale analysis capabilities aligned well with the research objectives.
However, this method’s implementation faced substantial challenges. The requirement for extensive training data, exceeding 100 annotated images, posed a significant barrier to implementation. The computationally intensive training process demanded substantial resources, while complex implementation requirements increased the development time. Limited transferability between contexts restricted the model’s adaptability, and the resource-intensive annotation process made scaling difficult. An example of U-Net segmentation on the village scale is shown in
Figure 7.
2.3.4. Meta SAM
SAM was evaluated for its state-of-the-art performance in general image segmentation tasks and zero-shot learning capabilities. The model’s transformer-based architecture incorporated prompt-based segmentation and multi-object detection capabilities, offering potential advantages for refugee camp analysis.
The implementation utilized the official Meta SAM (vit_h checkpoint) through the segment-anything Python package. The implementation workflow involved loading preprocessed satellite images, generating automatic prompts for segmentation and applying the model to segment building structures and camp features. The segmentation process employed both automatic and manual prompts, with grid-based prompting tested for systematic coverage of camp areas.
For the prompting strategy, three prompting approaches were evaluated:
Grid-based automatic prompting: A uniform 64 × 64 grid (256 prompts per 1024 × 1024 image).
Point-based manual prompting: 2–3 points per structure for 100 test structures.
A hybrid approach: Automatic grid prompting supplemented with manual points for complex areas.
The hybrid approach was selected as it achieved a higher F1 score.
Postprocessing was the following stage, which included merging overlapping segments, filtering small segments (area < 10 m2) and classifying the resulting segments into relevant categories using simple rule-based approaches. The segmentation outputs were exported as polygon shapefiles for integration with GIS platforms and further analysis.
The method’s strengths included advanced segmentation capabilities that showed promise for complex structural analysis. Its minimal training requirements supported its rapid deployment, while the intuitive user interface facilitated implementation. Strong edge detection capabilities suggested potential for structural boundary identification.
However, critical limitations emerged during testing. The focus on object-level rather than pixel-level segmentation proved problematic for continuous camp structures. Suboptimal performance on aerial imagery reduced effectiveness for satellite image analysis. The computational overhead affected processing efficiency, while the model’s limited spatial context understanding impacted analysis accuracy. Inconsistent results with continuous patterns made reliable analysis difficult, as this model was shown to be more effective with segmenting photographs than top-view satellite imagery. An example of Meta SAM segmentation is shown in
Figure 8.
2.3.5. ArcGIS Segmentation
ArcGIS’s ISO clustering and classification approach emerged as the most effective solution for this research, offering specialized capabilities for geospatial analysis through its implementation of the Iterative Self-Organizing (ISO) clustering algorithm. The technical implementation incorporated iterative self-organizing clustering methods with integrated spatial context consideration and multi-temporal analysis capabilities. Automated parameter optimization and integrated accuracy assessment tools enhanced the analytical workflow.
The implementation utilized ArcGIS Pro 3.1, employing the ISO Clustering Unsupervised Classification tool with carefully optimized parameters. The workflow began with importing preprocessed satellite imagery as multi-band raster datasets. The ISO clustering algorithm was applied with spectral detail values ranging from 3.0 to 7.0 and spatial detail values from 14.0 to 18.0, identified through iterative testing as optimal for refugee camp analysis. The minimum segment size was set at 15–20 pixels to capture individual shelter units while filtering noise.
The classification process employed both spectral and spatial context, with segment merging rules based on both spectral similarity and spatial adjacency. Post-classification refinement included majority filtering with a 3 × 3 window to reduce noise and sieve operations to remove isolated pixels. The classification scheme separated built structures from roads, open spaces and surrounding landscape with classes optimized for camp structure analysis. An example is shown in
Figure 9.
The method demonstrated comprehensive advantages for refugee camp analysis. The complete geospatial analysis toolkit supported diverse analytical needs, while the efficient processing of large datasets facilitated comprehensive temporal studies. Robust change detection capabilities enabled the precise tracking of camp evolution. High accuracy levels, verified through rigorous testing, confirmed the method’s reliability. Integrated spatial statistics enhanced analytical capabilities, while seamless integration with GIS databases streamlined workflows. The built-in validation tools also supported result verification.
Some limitations were identified during implementation. The dependency on proprietary software posed potential access constraints. Higher computational resource requirements necessitated robust processing capabilities. The limited customization of core algorithms restricted some analytical flexibility. The complex parameter optimization process required careful attention during implementation and needed to be checked for each image.
2.4. Validation Approach
The validation process employed multiple complementary approaches to ensure research reliability and result verification. The primary validation strategy utilized methodological triangulation, where different computational methods are applied to the same datasets to cross-validate findings. This involved comparing results from clustering analysis with semantic segmentation outcomes to verify pattern identification and spatial change detection. The consistency in results across different analytical methods strengthened the validity of identified patterns and transformations.
Statistical validation formed another crucial component, incorporating the quantitative analysis of detected patterns through multiple statistical measures. This included testing for spatial autocorrelation to verify identified clusters, measuring the statistical significance of detected changes and calculating confidence intervals for quantitative measurements. Statistical analysis also helped to identify outliers and anomalies that might have indicated important transformation points or methodological issues requiring attention.
For quantitative validation, 500 stratified random points were generated across the study area using a proportional allocation strategy based on class size. These points were distributed across different temporal phases and spatial scales to ensure the comprehensive coverage of both spatial and temporal variations in the classification results.
The validation incorporated several key statistical measures. The primary assessment utilized confusion matrices to evaluate classification accuracy across different classes. These matrices enabled the calculation of user accuracy (measuring commission errors) and producer accuracy (measuring omission errors) for each identified class. The Kappa coefficient was calculated to assess the agreement between the classified results and reference data while accounting for chance agreement. Additional quantitative metrics included the F1-score calculation for individual class accuracy and the Receiver Operating Characteristic (ROC) curve analysis providing Area Under the Curve (AUC) values.
The accuracy assessment results for ArcGIS segmentation are presented in
Figure 10 and
Table 1, demonstrating the performance of this method, with an overall accuracy of 99%.
Temporal validation ensured the reliability of the findings across different time periods. This involved analyzing the consistency of the detected patterns across sequential time points, verifying the logical progression of the changes and examining the stability of the identified spatial relationships over time. The temporal validation process helped to distinguish between genuine transformational patterns and potential artifacts or anomalies in the data.
The comparative analysis between methods served as an additional validation mechanism. By examining similar patterns and processes across different segmentation techniques, this research could identify consistent features and verify their reliability. Differences between methods were analyzed to determine whether they represented methodological variations or potential issues requiring attention.
Systematic error estimation and uncertainty analysis provided an understanding of the limitations and confidence levels of the results. This included quantifying the effects of image resolution limitations, assessing the impact of data preprocessing on the final results and evaluating the sensitivity of the computational algorithms to parameter changes. These analyses helped to establish confidence intervals for quantitative measurements and provided context for interpreting the qualitative patterns.
3. Results
The comparative evaluation of the five segmentation methods employed a comprehensive set of performance metrics designed to assess both technical accuracy and practical applicability in humanitarian contexts. These metrics provide quantitative measures of each method’s effectiveness in identifying and delineating refugee settlement structures and morphological patterns.
Overall accuracy represents the fundamental metric, measuring the percentage of correctly classified pixels across all categories. This metric provides a general assessment of classification performance but may obscure category-specific issues, particularly for imbalanced classes characteristic of refugee camp imagery, where built structures typically occupy a smaller proportion than surrounding areas.
The Kappa coefficient offers a more nuanced assessment by measuring the agreement between the classification results and reference data while accounting for chance agreement. This metric is particularly valuable for refugee camp analysis, as it provides a more robust measure of classification reliability across different structural and spatial categories. The calculation incorporated variance and Z-statistic computations to establish confidence intervals for the accuracy assessment.
Category-specific metrics provide detailed insights into classification performance for different settlement features. The user’s accuracy (measuring commission errors) and producer’s accuracy (measuring omission errors) were calculated for key categories including shelter structures, roads/paths, open spaces and the surrounding landscape. The F1-score, calculated as the harmonic mean of precision and recall, provides a balanced assessment of classification performance for each category.
Receiver Operating Characteristic (ROC) curve analysis and the corresponding Area Under the Curve (AUC) values offer insights into classification performance across different threshold settings. This analysis is particularly valuable for methods with adjustable confidence thresholds, providing guidance for optimal parameter selection in humanitarian applications.
Beyond classification accuracy, computational efficiency metrics assess the practical applicability of each method in resource-constrained humanitarian contexts. The processing time measurements included both training/setup time and operational processing time per image. Memory requirements were documented to establish minimum system specifications for implementation.
User interaction requirements represent another crucial practical consideration, particularly for field implementation. These metrics document the level of expertise required, the number of parameters requiring adjustment and the degree of manual intervention needed for optimal results.
Scalability assessments evaluate each method’s performance with varying image resolutions and geographical extents. These metrics are essential for understanding how methods perform across different operational scenarios, from detailed village-scale analysis to camp-wide monitoring.
3.1. Accuracy Assessment for Each Method
3.1.1. ESRI Landviewer Clustering Accuracy Assessment
ESRI Landviewer’s built-in clustering tools demonstrated moderate performance in refugee camp analysis, achieving an overall accuracy of 85% and a Kappa coefficient of 0.81. The method performed relatively well for broad land cover categorization but struggled with detailed structure differentiation. The confusion matrix revealed notable commission errors between shelter structures and roads/paths (23% misclassification), indicating difficulty in distinguishing linear built elements from circulation networks.
Category-specific metrics showed a stronger performance for large, homogeneous areas (91% user’s accuracy for open spaces) but weaker results for complex settlement patterns (76% user’s accuracy for shelter structures). The method demonstrated particularly poor performance in detecting small structural modifications, with only 68% of shelter extensions being correctly identified. The F1-scores ranged from 0.82 for open spaces to 0.74 for shelter structures.
ROC analysis returned an AUC value of 0.87, indicating a good but not excellent classification performance. The fixed nature of the platform’s classification parameters limited the opportunities for threshold optimization, restricting potential accuracy improvements through parameter adjustment.
3.1.2. K-Means Clustering Accuracy Assessment
The K-means clustering implementation achieved an overall accuracy of 79% with a Kappa coefficient of 0.72, representing the lowest performance among the evaluated methods. The approach demonstrated notable sensitivity to parameter settings, with classification results varying significantly based on initial centroid placement and cluster number selection. The optimal configuration identified through iterative testing utilized k = 5 clusters, providing sufficient differentiation between major structural and landscape elements while avoiding over-segmentation.
Confusion matrix analysis revealed systematic misclassification patterns, particularly between shelter structures and roads (27% confusion) and between camp boundaries and the surrounding desert landscape (31% confusion). These errors reflect the method’s reliance on spectral characteristics without the incorporation of spatial context or geometric features.
Category-specific results showed a reasonable performance in distinguishing built versus non-built areas (82% user’s accuracy), but poor discrimination between different structural types (68% producer’s accuracy for shelter structures). The method performed particularly poorly in areas with shadow effects or varied illumination conditions, highlighting its sensitivity to spectral variation.
Its F1-scores ranged from 0.75 for general built area detection to 0.65 for specific structural classification, demonstrating limited reliability for detailed settlement analysis. ROC analysis yielded an AUC value of 0.81, indicating marginally acceptable performance in general classification tasks.
3.1.3. U-Net Segmentation Accuracy Assessment
The U-Net implementation demonstrated promising but inconsistent performance, achieving an overall accuracy of 89% and a Kappa coefficient of 0.85. The deep learning approach showed strong capabilities in identifying complex structural patterns once properly trained, with particularly good performance in detecting shelter modifications and additions (86% producer’s accuracy).
Training performance analysis revealed significant improvements through data augmentation, with accuracy increasing by approximately 7% when rotation, flipping and contrast adjustments were incorporated. Model convergence typically occurred after 65–80 epochs depending on the initialization conditions. The validation loss curve demonstrated proper model fitting without significant overfitting, particularly when early stopping was implemented.
Category-specific metrics revealed excellent performance for large, distinctive structures (92% user’s accuracy), but more variable results for smaller structural modifications (78–84% producer’s accuracy). The method demonstrated particular strength in boundary delineation, with building footprints showing high geometric accuracy compared to the reference data.
The method’s F1-scores ranged from 0.88 for main shelter units to 0.82 for structural modifications and additions. ROC analysis yielded an AUC value of 0.91, indicating excellent classification potential under optimal conditions. However, performance degraded notably when applied to areas with structural patterns that were not well represented in the training data, highlighting limitations in generalizability.
3.1.4. Meta SAM Accuracy Assessment
Meta SAM demonstrated mixed performance in the refugee camp analysis context, achieving an overall accuracy of 75% and a Kappa coefficient of 0.68 when applied to satellite imagery. Despite its advanced architecture and impressive performance on natural image segmentation tasks, the model struggled with the top-down perspective and lower-contrast characteristics of satellite imagery.
Prompt-based analysis revealed significant variation in segmentation quality based on prompting strategy. Grid-based automatic prompting yielded inconsistent results, with numerous missed structures (producer’s accuracy of 61% for shelter units). Manual point prompting improved performance substantially (increasing producer’s accuracy to 82%) but required significant user interaction, limiting the method’s practical applicability for large-scale analysis.
Our segmentation quality assessment showed the model’s strong performance in identifying distinct, isolated structures but poor results for connected or closely spaced shelter units. The model frequently merged adjacent structures or fragmented single structures into multiple segments. Edge detection demonstrated high precision for clear boundaries but poor performance for the subtle transitions characteristic of informal additions to shelters.
The model’s F1-scores varied dramatically based on structural characteristics, ranging from 0.85 for isolated, high-contrast structures to 0.58 for subtle structural modifications or closely packed shelter arrangements. ROC analysis yielded an AUC value of 0.79, the lowest among the tested deep learning approaches.
3.1.5. ArcGIS Segmentation Accuracy Assessment
ArcGIS’s ISO clustering and classification approach demonstrated superior performance across all the evaluation metrics, achieving an overall accuracy of 99% and a Kappa coefficient of 0.95. The method’s integration of spectral characteristics with spatial context proved particularly effective for refugee camp analysis, enabling the accurate identification of different structural elements while maintaining contextual relationships.
The confusion matrix revealed excellent discrimination between different settlement elements, with minimal confusion between shelter structures and other categories (less than 5% misclassification). The method demonstrated particular strength in identifying structural modifications and additions, with 94% producer’s accuracy for shelter extensions and 92% for structural modifications.
Category-specific analysis showed a consistently high performance across all settlement elements. User’s accuracy ranged from 96% for shelter structures to 98% for the surrounding landscape features. Producer’s accuracy similarly demonstrated excellent results, ranging from 92% for structural modifications to 99% for open spaces. The method’s strength in boundary delineation resulted in highly accurate structure footprints, closely matching manual digitization results.
This approach’s F1-scores ranged from 0.94 to 0.98 across the different structural categories, indicating an excellent balance between precision and recall. ROC analysis yielded an AUC value exceeding 0.95, confirming the superior classification performance. The method’s ability to incorporate both spectral and spatial characteristics through parameter optimization provided robust results across different camp areas and development stages.
3.2. Processing Time and Computational Requirements
The evaluation of computational efficiency revealed significant variations in resource requirements and processing times across the five methods, with important implications for practical implementation in humanitarian contexts.
ESRI Landviewer demonstrated the fastest processing capabilities, requiring approximately 45–60 s per image (10 km2 area at 0.5 m resolution) on standard cloud computing resources. The platform’s integrated preprocessing and classification workflow eliminated data transfer requirements, further enhancing operational efficiency. Its memory requirements remained modest, at 4–6 GB for standard operations. However, these advantages were partially offset by the dependency on platform availability and internet connectivity.
K-means clustering showed efficient performance on local hardware, processing standard images in 2–3 min on a mid-range workstation (16 GB RAM, quad-core processor). Its memory requirements scaled linearly with image size, requiring approximately 8 GB to process a 10 km2 area at a 0.5 m resolution. The method’s implementation in open-source Python libraries ensured platform independence, though its preprocessing requirements added to the overall workflow duration.
U-Net segmentation demonstrated substantially higher computational demands, with training requiring 4–6 h on GPU-accelerated hardware (NVIDIA RTX 3080). Inference time was more reasonable at 2–3 min per image, though it still required GPU acceleration for optimal performance. The memory requirements were substantial during training (>16 GB) but moderate during inference (8–10 GB). The significant training overhead represented a substantial barrier to implementation, despite this approach’s reasonable operational efficiency once trained.
Meta SAM demonstrated the highest computational requirements among the tested methods. The model required GPU acceleration (minimum 8 GB VRAM) for reasonable performance, with processing times of 3–5 min per image segment (approximately 1 km2), necessitating 15–20 min for complete camp analysis. Its memory requirements exceeded 16 GB for full-resolution processing, often requiring image tiling for practical implementation. Prompt-based processing added further operational overhead, particularly when manual prompting was required for optimal results.
ArcGIS segmentation showed balanced computational performance, with processing times of 2–4 min per camp-scale image on standard workstation hardware (16 GB RAM, quad-core processor). The memory requirements scaled with image complexity rather than simply size, ranging from 8 to 12 GB for complete camp analysis. The method’s integration within the ArcGIS environment streamlined its workflow implementation but meant that it required appropriate licensing, representing a potential barrier in some humanitarian contexts.
3.3. Parameter Optimization Results
The investigation of parameter optimization revealed distinct sensitivity patterns across methods, with significant implications for implementation in humanitarian contexts.
ESRI Landviewer’s limited parameter adjustment capabilities constrained optimization opportunities. The available parameters included class number selection (optimal: 5–7 classes) and spectral band combination options (optimal: near-infrared, red, green for built environment detection). The restricted parameter space simplified its implementation but limited its adaptation to specific camp characteristics.
K-means clustering demonstrated high sensitivity to parameter selection, with optimization efforts focused on cluster number determination and initialization methods. The elbow method analysis identified the optimal cluster numbers to be between 4 and 6 for refugee camp imagery, with higher values leading to the over-segmentation of settlement structures. Initialization method comparison revealed that k-means++ initialization consistently outperformed random initialization, reducing classification variance by approximately 15%. Feature standardization improved the classification consistency but showed a minimal impact on the overall accuracy.
U-Net segmentation required extensive parameter optimization across both architectural and training dimensions. The architectural optimization identified a four-level encoder–decoder structure as optimal, balancing feature extraction depth with spatial precision. A hyperparameter grid search determined the following optimal configurations: a learning rate of 0.001, batch size of 16 and early stopping patience of 10 epochs. Data augmentation parameter testing revealed rotation, horizontal flipping and contrast adjustment as the most effective augmentation strategies, collectively improving accuracy by 7–9%.
Meta SAM parameter optimization focused primarily on prompting strategies and postprocessing configurations. Prompt density analysis identified the optimal grid spacing to be 50–70 pixels for systematic coverage, though this required substantial computational overhead. Points-per-object testing determined that 2–3 prompts per target structure maximized segmentation quality while minimizing user interaction. Postprocessing optimization found that Non-Maximum Suppression (NMS) with an IoU threshold of 0.3–0.4 effectively reduced segment overlap while preserving structural detail.
ArcGIS segmentation demonstrated the most comprehensive parameter optimization framework, with systematic testing identifying the optimal configurations for refugee camp analysis. Spectral detail parameter testing revealed the optimal values to be between 3.0 and 7.0, with lower values (3.0–5.0) performing best in densely built areas and higher values (5.0–7.0) being more effective for camp peripheries. Spatial detail testing identified optimal values between 14.0 and 18.0, with higher values being crucial for preserving structural boundaries in densely built areas. The minimum segment size optimization determined 15–20 pixels as the optimal threshold, effectively filtering noise while preserving structural detail.
The spectral vs. spatial parameter interaction analysis revealed important relationships, with higher spatial detail values partially compensating for suboptimal spectral detail settings. This relationship proved particularly valuable in areas with variable image quality, providing robust classification options even under challenging conditions.
3.4. Limitations of Each Approach
Each segmentation method demonstrated specific limitations that affected its applicability for refugee camp analysis, with implications for implementation in humanitarian contexts.
ESRI Landviewer’s primary limitations stemmed from its platform-dependent nature and restricted customization options. The inability to fine-tune clustering parameters beyond basic class numbers limited its adaptation to specific camp characteristics. The platform’s dependence on internet connectivity presents significant challenges for field implementation in humanitarian contexts, where reliable connectivity cannot be assumed. The proprietary nature of the algorithms limited the approach’s methodological transparency, complicating validation and integration with other analytical approaches.
K-means clustering exhibited several fundamental limitations for refugee settlement analysis. The method relies exclusively on spectral characteristics without integrating spatial context. This results in poor discrimination between features that are functionally different but spectrally similar. The algorithm showed high sensitivity to its initial conditions. This produced inconsistent results even when analyzing the same area multiple times.
Additionally, the method performed poorly with complex settlement patterns. It particularly struggled to detect structural modifications that characterize refugee camp transitions. Its limited generalizability across different image acquisition conditions also made reliable temporal analysis difficult.
U-Net segmentation, while powerful, faces significant implementation barriers. The method requires substantial training data (>100 annotated images) for optimal performance. This presents major challenges in humanitarian contexts where annotated datasets are rarely available. The “black box” nature of its deep learning approaches complicates the interpretation of the model’s classification decisions. Performance also degrades noticeably in areas dissimilar to the training data, which restricts this approach’s generalizability across different camp contexts. Moreover, the method’s substantial computational requirements for both training and inference limit its field implementation possibilities.
Meta SAM demonstrated several critical limitations for satellite imagery analysis. The model was designed for natural images rather than those with aerial perspectives. This resulted in suboptimal performance with satellite imagery. The prompt-based approach required significant user interaction for optimal results, which limited its scalability for large-area analysis. The model performed inconsistently with low-contrast features, which are characteristic of informal shelter modifications. This restricted its reliability in monitoring subtle camp transitions. Furthermore, the model tended to over-segment continuous structures, which created challenges for accurate shelter identification. Its substantial computational requirements further limit its potential for practical implementation in resource-constrained contexts.
ArcGIS segmentation, despite its superior performance, still presented certain limitations. Its dependency on proprietary software creates access barriers for some humanitarian organizations with limited resources. Complex parameter optimization requirements necessitate technical expertise, potentially limiting its adoption by field teams. While less computationally demanding than deep learning approaches, the method still required substantial hardware resources for large-area analysis. Certain parameter settings also showed sensitivity to image acquisition conditions, requiring adjustment for optimal performance across different temporal datasets.
4. Discussion
The comprehensive evaluation of five distinct segmentation approaches reveals significant variations in performance, applicability and resource requirements that have important implications for refugee camp monitoring applications. The results demonstrate a clear performance hierarchy among the tested methods, with ArcGIS’s ISO clustering and classification approach achieving superior performance across all evaluation metrics. This method’s integration of spectral characteristics with spatial context proves particularly valuable for refugee settlement analysis, enabling the accurate identification and delineation of complex structural arrangements.
The substantial performance gap between traditional clustering methods (K-means) and more sophisticated approaches highlights the importance of spatial context integration for effective settlement analysis. While K-means clustering achieves reasonable differentiation between built and non-built areas (82% accuracy), its poor performance in distinguishing different structural types (68% accuracy) severely limits its utility for detailed settlement monitoring. This finding aligns with previous research by Taubenböck et al. [
3], who noted similar limitations in spectral-only classification approaches when they were applied to informal settlements.
Deep learning approaches demonstrate promising but inconsistent performance in the refugee settlement context. U-Net segmentation achieves strong results when properly trained (89% overall accuracy), particularly excelling in boundary delineation and structural modification detection. However, its substantial training data requirements and computational demands create significant implementation barriers in humanitarian contexts. This implementation gap represents a crucial consideration for humanitarian applications, where technical resources and expertise may be limited.
Meta SAM’s relatively poor performance (75% accuracy) despite its advanced architecture highlights the challenges of applying general-purpose models to specialized remote sensing tasks. The model’s impressive results on natural image segmentation tasks do not translate effectively to aerial imagery analysis, reinforcing findings by Ma et al. [
23] regarding the domain-specific challenges of satellite imagery processing. This limitation suggests that models specifically designed for overhead imagery analysis are likely to outperform even state-of-the-art general-purpose approaches.
ESRI Landviewer’s moderate performance (85% accuracy) combined with superior processing efficiency presents an interesting efficiency–accuracy trade-off for rapid assessment scenarios. While the method lacks the precision of more sophisticated approaches, its minimal setup requirements and cloud-based processing capabilities offer advantages for initial assessment stages or resource-constrained contexts. This finding suggests a potential staged implementation approach, where rapid methods support initial analysis followed by more precise techniques for detailed monitoring.
4.1. Implications for Humanitarian Applications
The findings from this research have significant implications for humanitarian organizations involved in refugee settlement monitoring and management. The clear superiority of ArcGIS’s segmentation approach provides strong justification for its adoption in operational contexts, despite the associated licensing costs. The method’s ability to accurately identify and track structural changes over time offers valuable capabilities for monitoring settlement evolution and planning appropriate interventions.
The identification of optimal parameter configurations (spectral detail: 3.0–7.0; spatial detail: 14.0–18.0) provides practical implementation guidance for humanitarian organizations. These validated parameters significantly reduce the technical expertise required for implementation, potentially broadening the method’s adoption among field teams. The established parameter sensitivity relationships provide additional flexibility for adaptation to different image quality conditions, enhancing the method’s robustness in challenging operational environments.
The substantial limitations identified in deep learning approaches highlight important considerations for technology’s adoption in humanitarian contexts. Despite their theoretical advantages, the training data requirements and computational demands of these methods present significant barriers to field implementation. Organizations considering these approaches should carefully evaluate their technical capacity and data availability before investment, as conventional methods may offer more immediate practical utility despite their theoretical disadvantages.
The efficiency–accuracy trade-offs identified across these methods suggest the potential for tiered implementation strategies in humanitarian operations. Rapid methods like ESRI Landviewer, despite accuracy limitations, may serve valuable roles in initial assessment phases where processing speed outweighs precision requirements. More sophisticated approaches can then be deployed for the detailed analysis of identified priority areas, optimizing resource allocation while maintaining analytical rigor.
The consistent difficulty that all methods demonstrated with certain analysis tasks—particularly the detection of small structural modifications and closely packed shelter arrangements—highlights areas requiring methodological advancement. These challenging analysis tasks correspond precisely to the early indicators of settlement transition that humanitarian organizations need to monitor, emphasizing the importance of continued methodological development in this domain.
4.2. Technical Considerations
Several key technical considerations emerge from this comparative analysis, with important implications for method selection and implementation in refugee settlement monitoring applications.
The fundamental importance of spatial context integration for effective settlement analysis represents a critical finding. Methods incorporating both spectral and spatial characteristics (ArcGIS segmentation, U-Net) consistently outperform approaches relying solely on spectral information (K-means). This pattern holds across different settlement types and development stages, highlighting spatial context as an essential analytical component rather than merely a supplementary feature.
Parameter sensitivity analysis reveals important implementation considerations across methods. ArcGIS segmentation demonstrates relatively stable performance across moderate parameter variations (±1.0 for spectral detail, ±2.0 for spatial detail), providing operational flexibility in field implementation. In contrast, K-means clustering shows extreme sensitivity to initialization conditions, while deep learning approaches demonstrate critical dependence on training data characteristics. These sensitivity patterns have significant implications for implementation robustness, particularly in operational contexts where technical expertise may be limited.
Resolution requirements analysis establishes important specifications for image acquisition. While ArcGIS segmentation maintains reasonable performance (85% accuracy) with medium-resolution imagery (2 m), high-resolution data (≤0.5 m) remains essential for detailed structural analysis and modification detection (≥95% accuracy). These specifications provide valuable guidance for imagery acquisition planning, helping balance resolution requirements against data costs and availability constraints.
Computational efficiency analysis reveals significant variation in processing requirements across methods. While all the tested approaches can theoretically operate on standard hardware, we suggest minimum specifications for their practical implementation: 16 GB of RAM and quad-core processors for the ArcGIS and K-means approaches, with GPU acceleration highly recommended for the deep learning methods. These requirements establish important baselines for technical infrastructure planning in humanitarian organizations considering the implementation of these methods.
Temporal consistency assessment reveals valuable insights into change detection applications. ArcGIS segmentation demonstrates the highest consistency across temporal images (96% classification agreement between adjacent timepoints), while Meta SAM shows the poorest temporal stability (68% agreement). These variations have direct implications for change detection reliability, as inconsistent classification introduces false change indicators that complicate temporal analysis.
4.3. Open-Source GIS Software Alternatives
While this study primarily evaluated ESRI ArcGIS software for its performance in the GIS-based segmentation approach, several open-source alternatives merit consideration for humanitarian applications.
QGIS with the Orfeo Toolbox plugin and the Semi-Automatic Classification Plugin (SCP) offers comparable segmentation capabilities through the Mean-Shift and region-growing algorithms [
24], potentially providing cost-effective alternatives for organizations with limited resources.
Other notable open-source options include GRASS GIS, which provides robust segmentation tools through its i.segment module, which implements region-growing algorithms suitable for refugee settlement delineation [
25], and SAGA GIS, which offers various clustering algorithms applicable to refugee settlement analysis. For organizations prioritizing accessibility over accuracy, these open-source alternatives present viable implementation options, particularly when combined with custom Python scripting for workflow optimization through the scikit-image and rasterio libraries [
26].
When selecting between proprietary and open-source solutions, organizations should consider not only their accuracy requirements but also a method’s technical capacity, long-term sustainability and integration with existing their workflows. While ArcGIS demonstrated superior performance in our evaluation, the accuracy difference may be acceptable in contexts where cost constraints outweigh precision requirements.
Future research should systematically evaluate these open-source alternatives against the solutions assessed in this study, potentially identifying cost-effective implementations that balance performance requirements with the resource constraints common in humanitarian contexts.
4.4. Comparative Analysis with Previous Studies
The findings of this research both align with and extend previous research in refugee and IDP settlement analysis. The performance of ArcGIS segmentation (99% overall accuracy) significantly exceeds the results reported by Lang et al. [
15], who achieved 83% accuracy using object-based image analysis for East African refugee camps. This improvement likely stems from the integration of spatial context with spectral information, addressing a limitation they identified in early OBIA implementations.
Comparing the deep learning results with Ghorbanzadeh et al.’s [
18] implementation of CNN-based segmentation for Rohingya refugee camps, similar challenges are observed in model generalizability and training data requirements. Their reported accuracy of 87% using a modified U-Net architecture closely aligns with the U-Net implementation (89% accuracy) in this study, suggesting consistent performance across different refugee contexts when sufficient training data are available.
This study’s finding that ArcGIS segmentation outperforms deep learning approaches contrasts with results reported by Quinn et al. [
22], who found CNN-based methods to be superior for settlement detection in complex urban environments. This discrepancy likely reflects differences in settlement characteristics; their study focused on informal urban structures embedded within diverse urban fabrics, while this analysis examined a formally established camp with more distinct spatial patterns.
The parameter optimization framework developed in this study directly addresses a critical gap identified by Tiede et al. [
16], who noted that segmentation parameter selection significantly impacted classification accuracy in their analysis of Middle Eastern refugee camps. The systematic identification of optimal parameter ranges presented in this research provides concrete implementation guidance previously unavailable in the literature.
Regarding computational efficiency, this analysis of processing requirements aligns with the conclusions of Jenerowicz et al. [
19], who similarly noted the significant resource constraints limiting deep learning implementations in humanitarian contexts. The finding that ArcGIS segmentation achieves superior accuracy with moderate computational demands presents a valuable alternative to the resource-intensive methods previously evaluated.
4.5. Implementation Recommendations
Based on the comprehensive evaluation results, several specific implementation recommendations can be formulated for organizations involved in refugee settlement monitoring:
- 1.
Method Selection Guidance: ArcGIS segmentation represents the recommended primary approach for most refugee settlement monitoring applications, offering superior accuracy and reasonable computational requirements. For rapid initial assessment, ESRI Landviewer provides acceptable results with minimal setup requirements, making it suitable for first-phase analysis before more detailed investigation.
- 2.
Configuration Optimization: For ArcGIS implementation, organizations should configure spectral detail parameters between 3.0 and 5.0 for densely built areas and 5.0–7.0 for camp peripheries. Spatial detail settings between 14.0 and 18.0 provide the optimal results, with higher values being crucial for the segmentation of areas with complex structural arrangements. The minimum segment size should be set to 15–20 pixels for 0.5 m resolution imagery.
- 3.
Implementation Workflow: A tiered implementation approach is recommended, beginning with camp-wide analysis using validated parameters and followed by the detailed investigation of identified change areas. Standardized preprocessing procedures, including atmospheric correction and geometric alignment, should be established to ensure consistent results are produced across temporal imagery.
- 4.
Validation Protocols: Organizations should implement systematic validation using stratified random sampling with at least 250 points per classification, ensuring proportional representation across structural classes. Confusion matrices and Kappa coefficients should be calculated for each analysis to document reliability, with minimum acceptable thresholds of 85% overall accuracy and a 0.80 Kappa coefficient.
- 5.
Technical Infrastructure Requirements: Implementing organizations should establish minimum hardware specifications: workstation-grade computers with 16 GB of RAM, quad-core processors and dedicated graphics capabilities. For organizations employing deep learning approaches, GPU acceleration (minimum 8 GB of VRAM) is essential for reasonable performance.
- 6.
Training and Capacity Development: Organizations should invest in technical capacity development focusing on GIS fundamentals, parameter optimization techniques and validation protocols. Standardized training materials and implementation guides should be developed to facilitate knowledge transfer and ensure methodological consistency across teams.
- 7.
Future Exploration Priorities: Organizations with advanced technical capabilities should explore the potential of customized deep learning approaches through transfer learning from existing models. Initial experiments suggest that fine-tuning U-Net or similar architectures with 30–50 annotated camp images may achieve performance comparable to ArcGIS segmentation while offering greater customization potential.
5. Conclusions
This comprehensive evaluation of image segmentation methods for monitoring refugee camp transitions has yielded several significant findings that advance both methodological understanding and practical implementation in humanitarian contexts. The systematic comparison of five distinct approaches demonstrates clear performance hierarchies, with ArcGIS’s ISO clustering and classification method achieving superior results (99% overall accuracy, 0.95 Kappa coefficient) by effectively integrating spectral characteristics with spatial context.
This research establishes specific parameter optimization guidelines for humanitarian contexts, with spectral detail values of 3.0–7.0 and spatial detail values of 14.0–18.0 yielding optimal results for refugee settlement analysis using the ArcGIS approach. These validated parameters provide immediate practical guidance for humanitarian organizations, significantly reducing the technical expertise required for the approach’s effective implementation.
Traditional clustering methods (K-means) demonstrate fundamental limitations for refugee settlement analysis, achieving only 79% overall accuracy with a Kappa coefficient of 0.72. Their exclusive reliance on spectral characteristics without spatial context integration results in poor discrimination between functionally different but spectrally similar features, limiting these approaches’ utility for detailed settlement monitoring.
Deep learning approaches show promising but inconsistent performance. U-Net segmentation achieves strong results when properly trained (89% overall accuracy, 0.85 Kappa coefficient), particularly excelling in boundary delineation. However, its substantial training data requirements and computational demands create significant implementation barriers in humanitarian contexts. Meta SAM, despite its advanced architecture, demonstrates relatively poor performance (75% accuracy) when applied to satellite imagery, highlighting the challenges of applying general-purpose models to specialized remote sensing tasks.
The efficiency–accuracy trade-offs identified across these methods suggest the potential for tiered implementation strategies in humanitarian operations. ESRI Landviewer’s moderate performance (85% accuracy) combined with its superior processing efficiency offers advantages in the initial assessment stages, while more sophisticated approaches can be deployed for the detailed analysis of identified priority areas.
5.1. Methodological Contributions
This research makes several significant methodological contributions to the field of humanitarian remote sensing and settlement analysis. The development of a comprehensive evaluation framework incorporating both technical accuracy metrics and practical implementation considerations establishes a valuable benchmark for future methodological assessments. This balanced approach, considering both performance and practicality, provides a more holistic evaluation than traditional accuracy-focused assessments.
The systematic parameter optimization process for the ArcGIS segmentation approach represents a significant contribution to humanitarian applications by identifying optimal parameter ranges and their relationship to different settlement characteristics. This provides both immediate practical value and a methodological template for similar contexts. The documentation of parameter sensitivity relationships offers additional implementation flexibility, enhancing this method’s robustness in challenging operational environments.
The validation protocols developed and implemented in this research provide a rigorous methodological foundation for future studies. The stratified random sampling approach with proportional class representation ensured comprehensive validation across settlement features, while the multi-metric assessment (including overall accuracy, the Kappa coefficient and category-specific metrics) provided nuanced performance evaluation. These protocols enhance methodological transparency and result reliability, addressing important limitations in previous studies.
The comparative analysis framework developed through this research enables systematic evaluation across fundamentally different segmentation approaches. By establishing consistent preprocessing procedures, validation metrics and application contexts, this framework supports methodological comparison while controlling for extraneous variables. This approach advances beyond traditional method-specific evaluations, providing a foundation for the comprehensive assessment of diverse techniques.
The integration of practical implementation considerations (computational requirements, user interaction needs, and resource dependencies) alongside technical performance metrics provides a more complete assessment of method suitability across operational contexts. This approach bridges the gap between theoretical capability and practical utility, a crucial consideration in humanitarian applications.
5.2. Future Research Directions
Despite the significant advances represented by this research, several important directions for future investigation emerge from the findings. The development of specialized deep learning approaches for refugee settlement analysis represents a promising research direction. While general-purpose models like Meta SAM demonstrate limited effectiveness, customized architectures specifically designed for the overhead imagery analysis of informal settlements could potentially combine the precision of deep learning approaches with the contextual understanding demonstrated by GIS-based methods.
Transfer learning approaches offer another valuable research direction, potentially addressing the training data limitations identified in this study. Initial experiments suggest that fine-tuning existing models with limited annotated data (30–50 images) may achieve performances comparable to specialized methods while reducing implementation barriers. The systematic investigation of transfer learning effectiveness across different settlement types and development stages would provide valuable methodological guidance.
Temporal analysis methodologies represent a crucial area for future research. While the current study evaluates segmentation performance on individual images, developing specialized approaches for direct change detection between temporal images could enhance monitoring capabilities. The exploration of recurrent neural network architectures or temporal attention mechanisms could potentially improve the detection of subtle structural modifications characteristic of early transition stages.
Multi-sensor integration approaches warrant investigation to enhance detection capabilities. Combining optical imagery with radar (SAR) data could potentially improve structural identification in challenging conditions, such as dense settlements or areas with frequent cloud cover. Similarly, the integration of very-high-resolution drone imagery with broader satellite coverage could provide complementary perspectives for comprehensive monitoring.
Automated parameter optimization frameworks represent another valuable research direction. While this study establishes optimal parameter ranges through exhaustive testing, developing automated approaches for context-specific parameter selection could enhance implementation efficiency while maintaining analytical rigor. Machine learning approaches for parameter optimization based on image characteristics and settlement patterns show particular promise for this application.
Finally, the development of specialized validation methods for refugee settlement analysis represents an important methodological direction. While standard accuracy metrics provide valuable assessment, specialized metrics focusing on structural modification detection, boundary precision and temporal consistency could offer more targeted evaluations for settlement monitoring applications. Such metrics would better align validation with the specific requirements of humanitarian applications, enhancing method selection and implementation guidance.
Through these research directions, the foundation established by the current study can be extended to further enhance monitoring capabilities for refugee settlements, ultimately supporting more effective humanitarian planning and responses through an improved spatial understanding of settlement transitions.


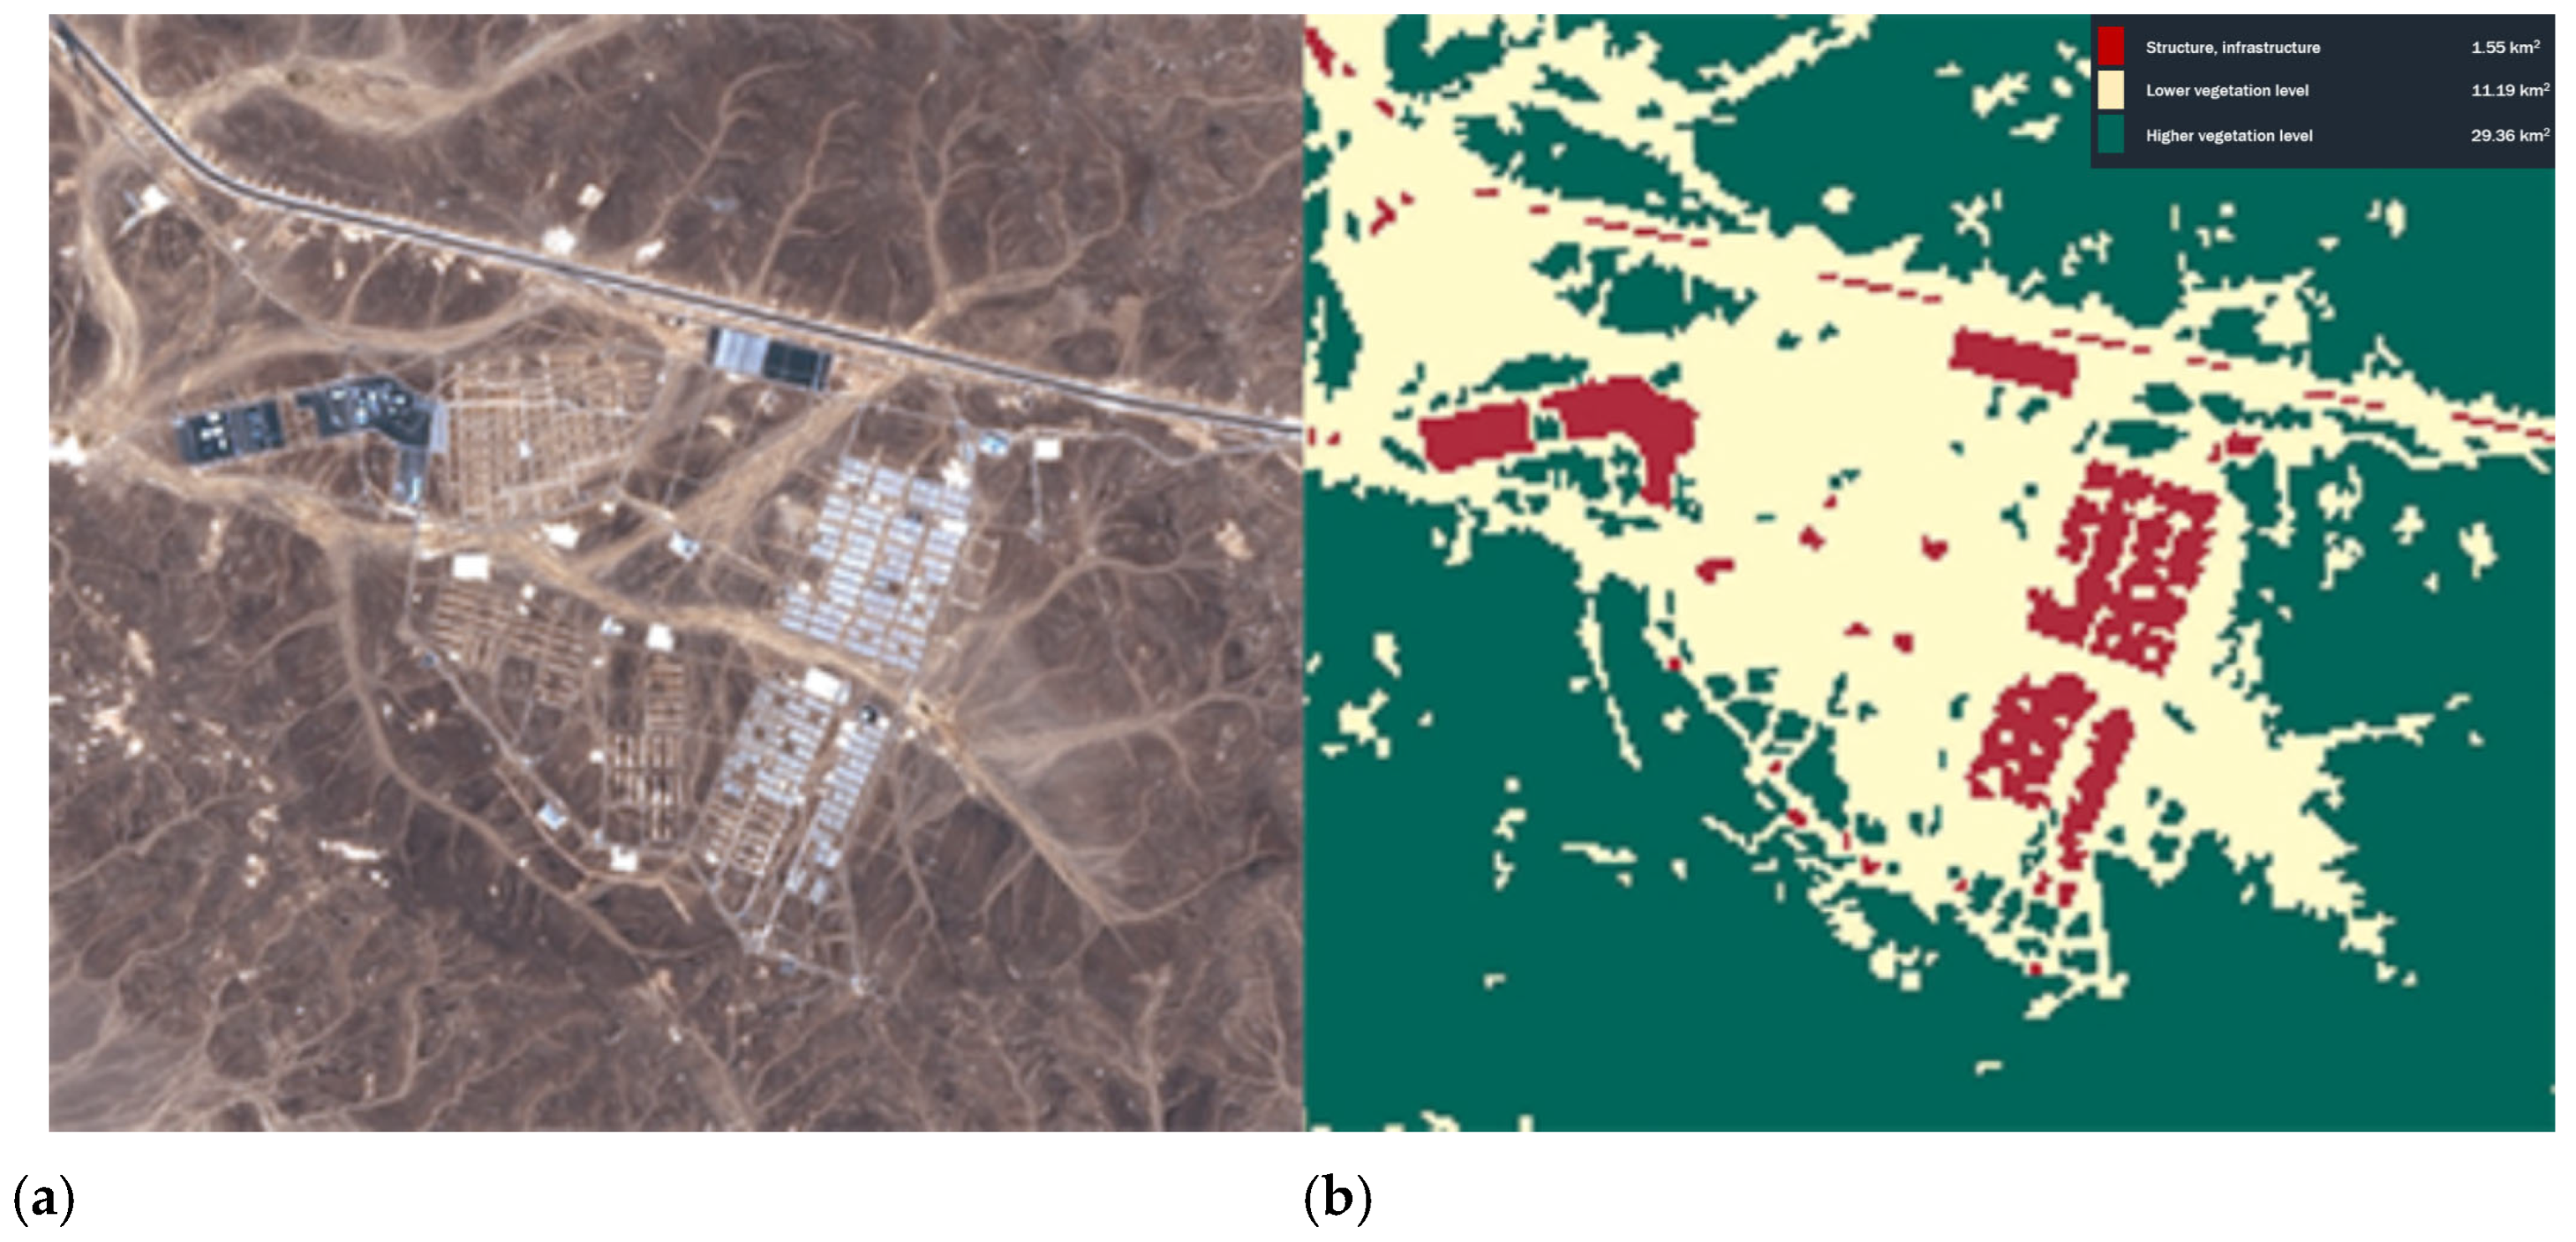
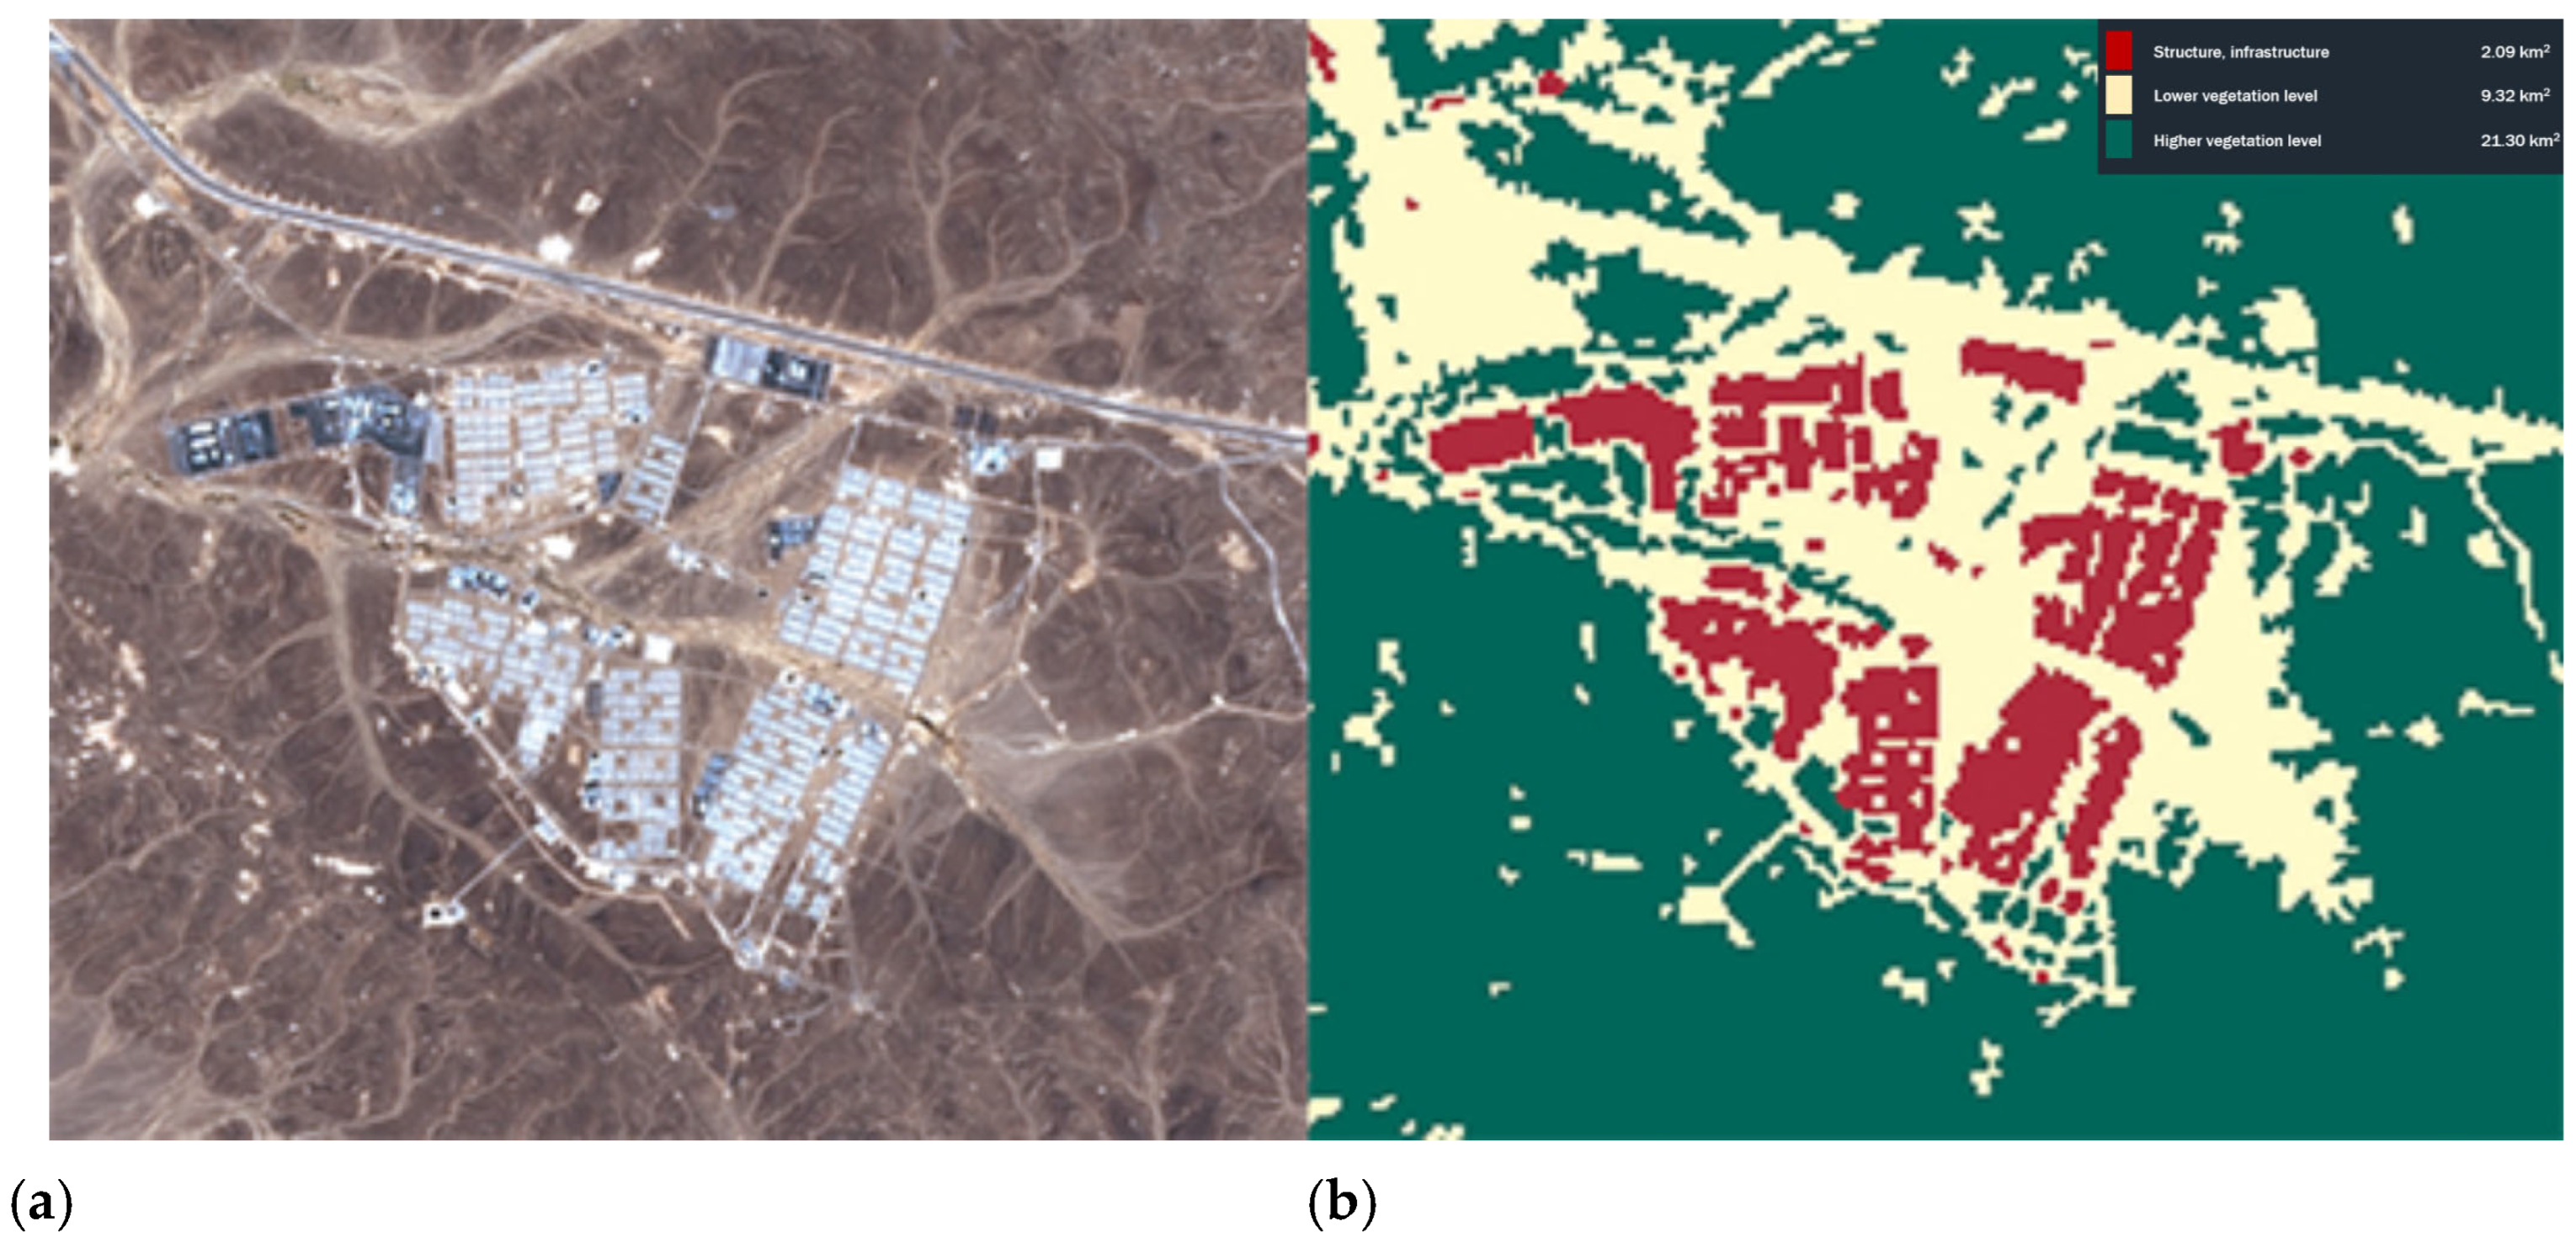


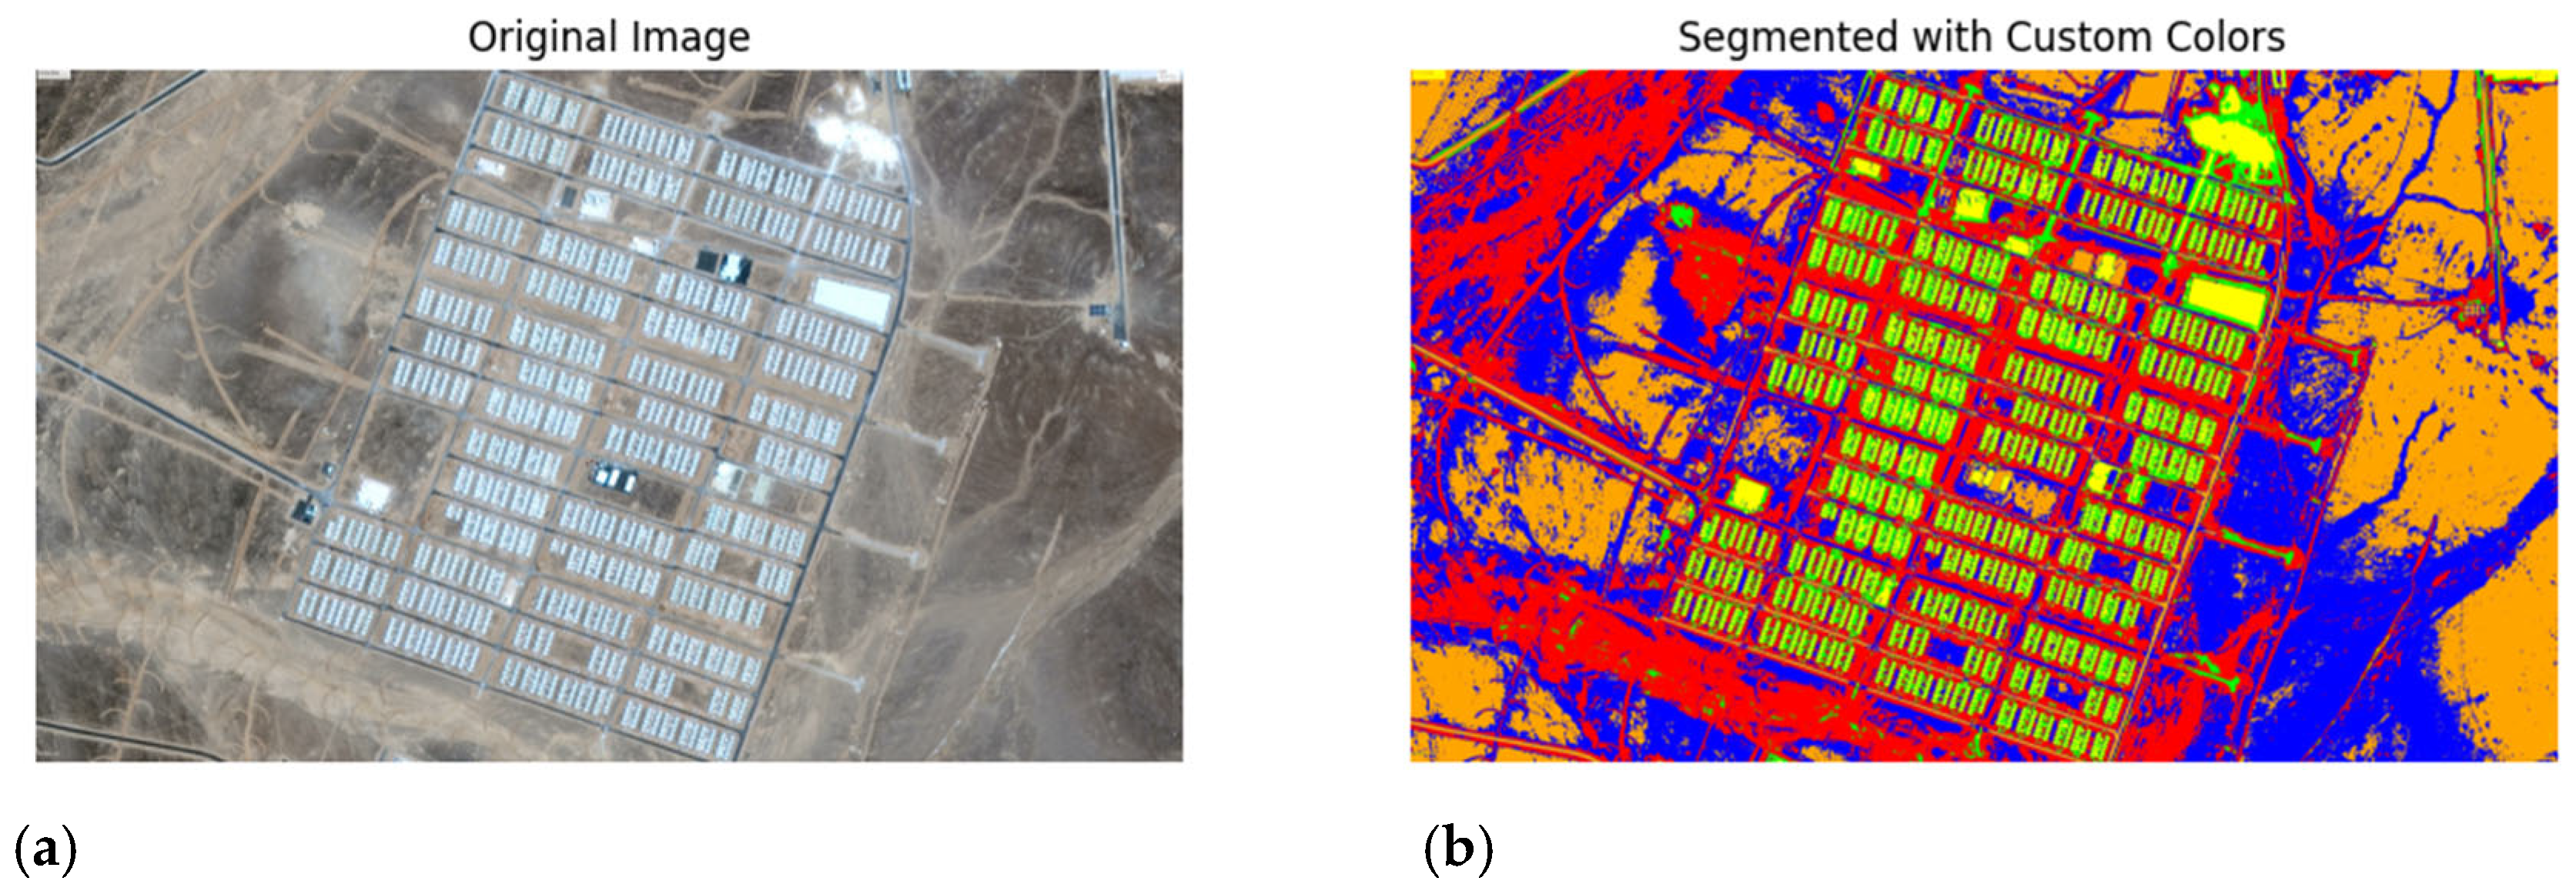
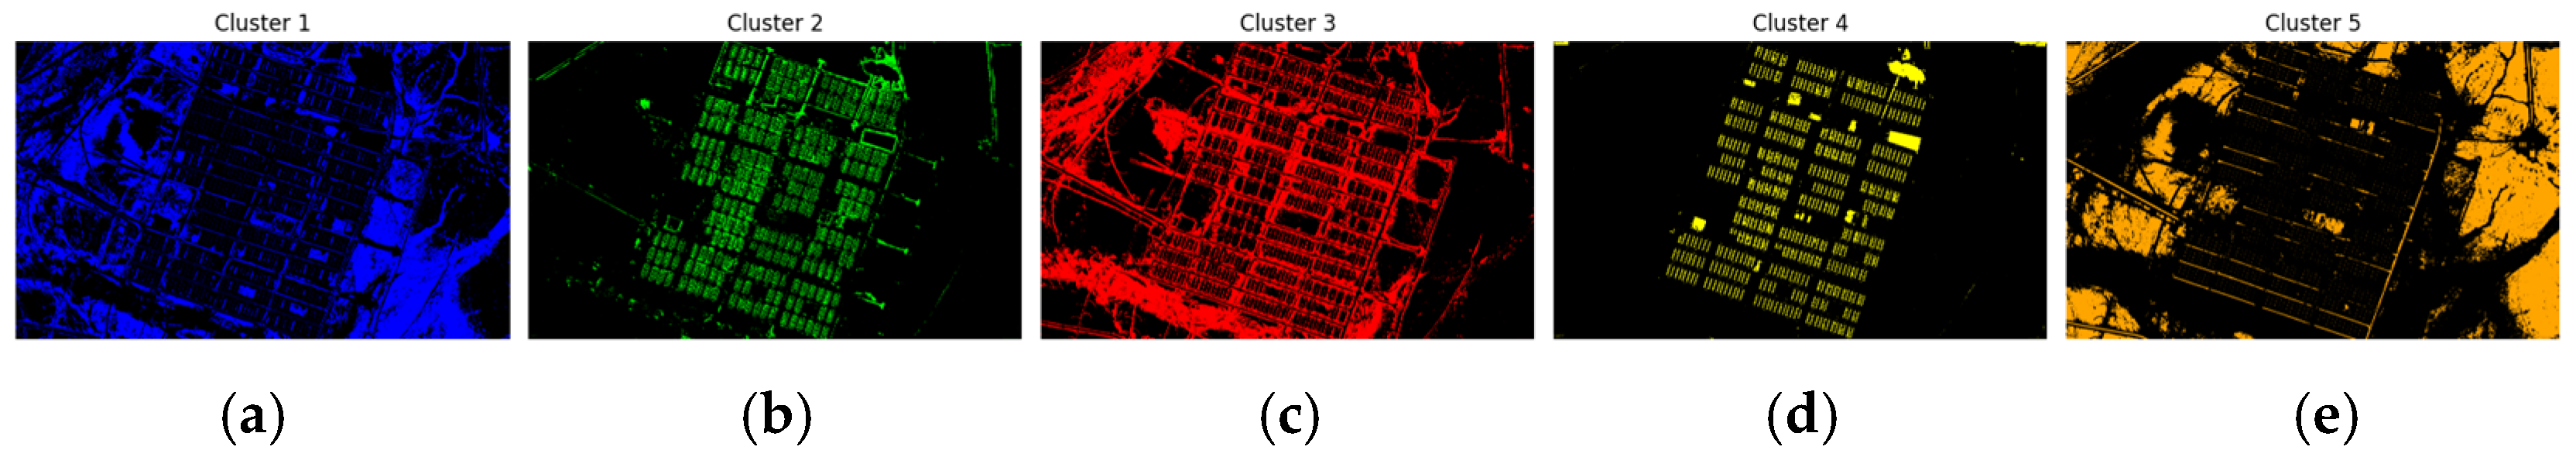

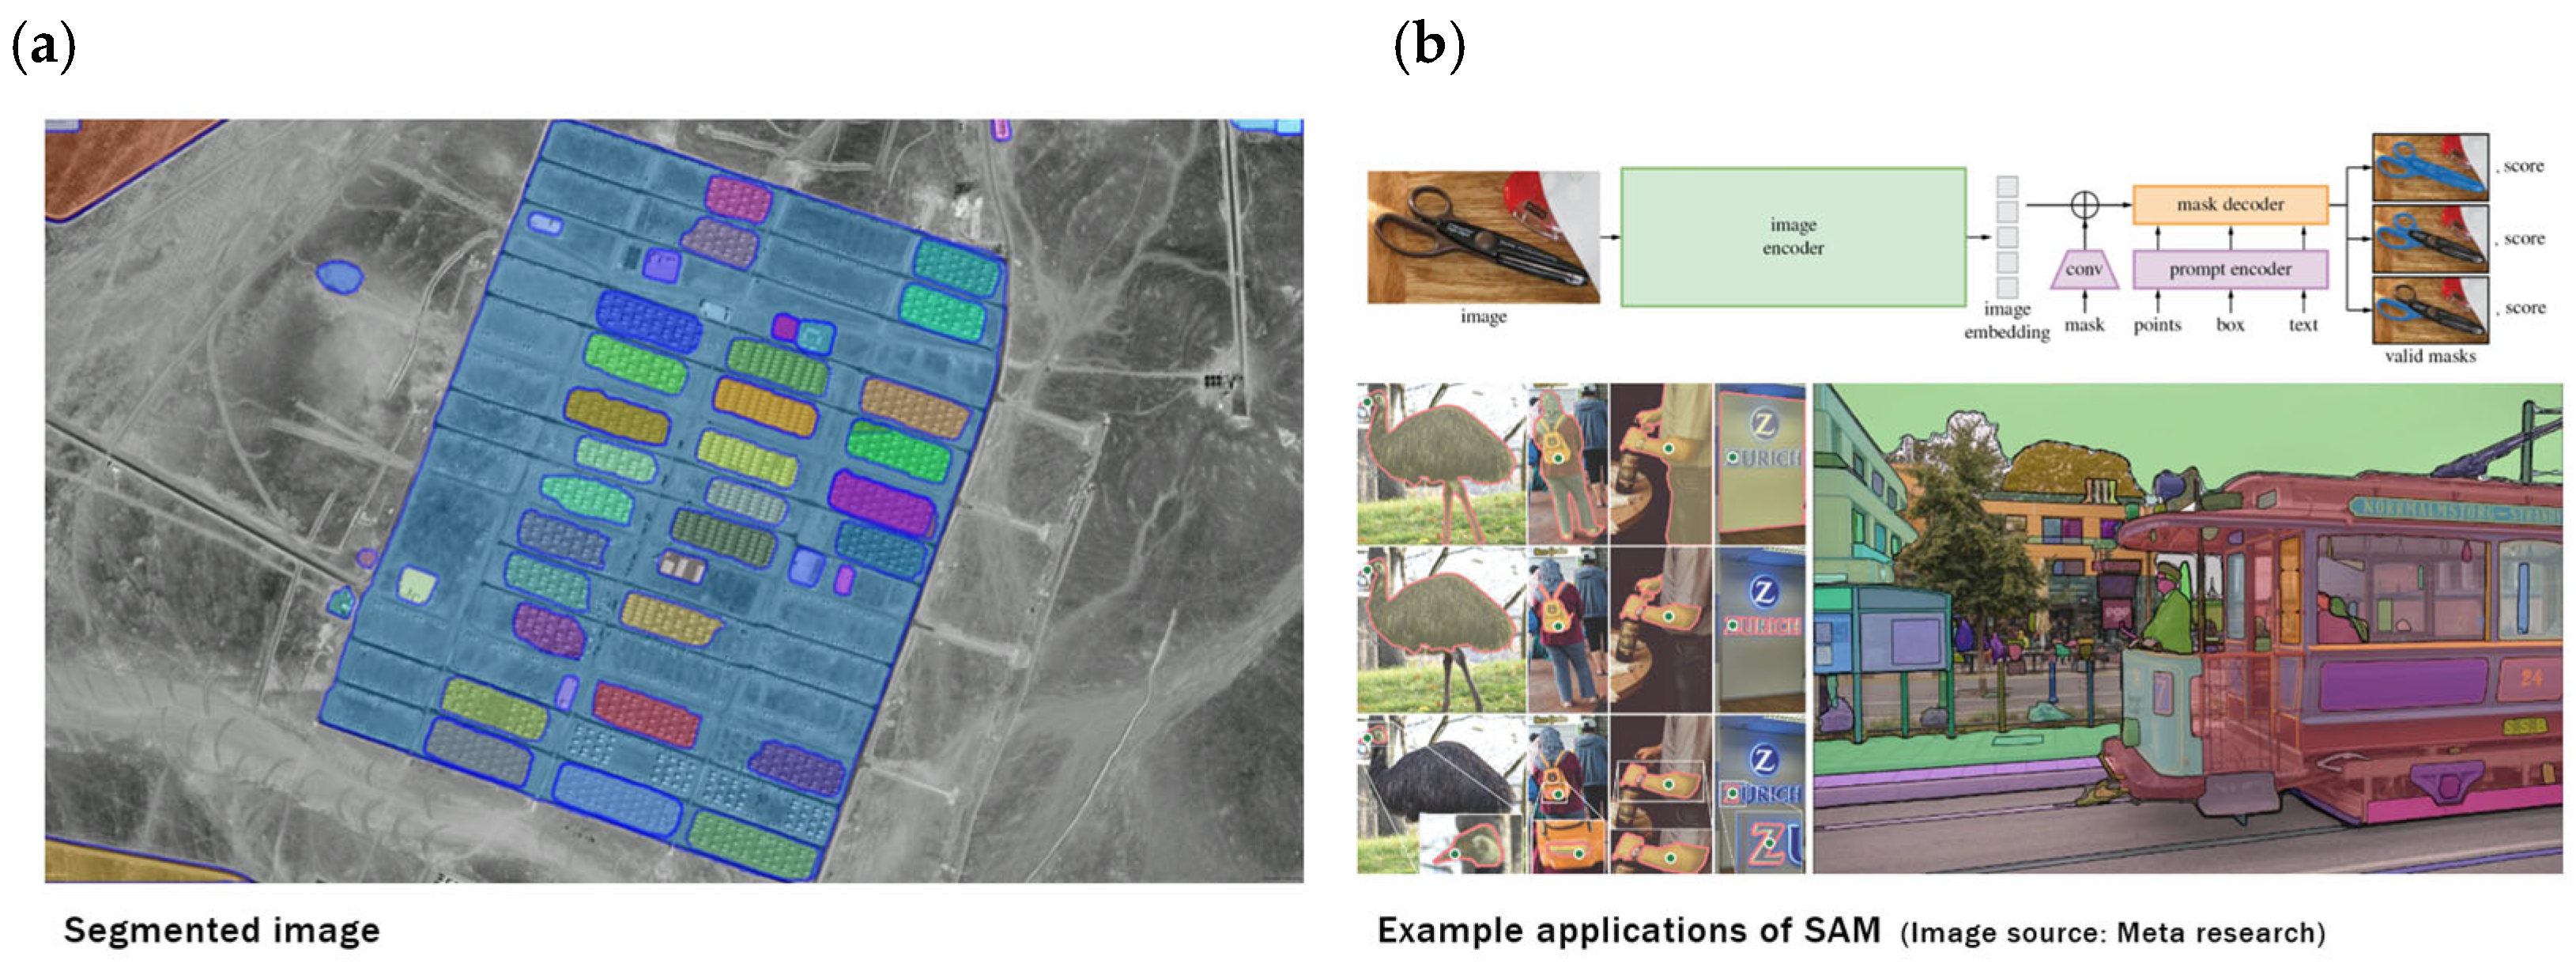
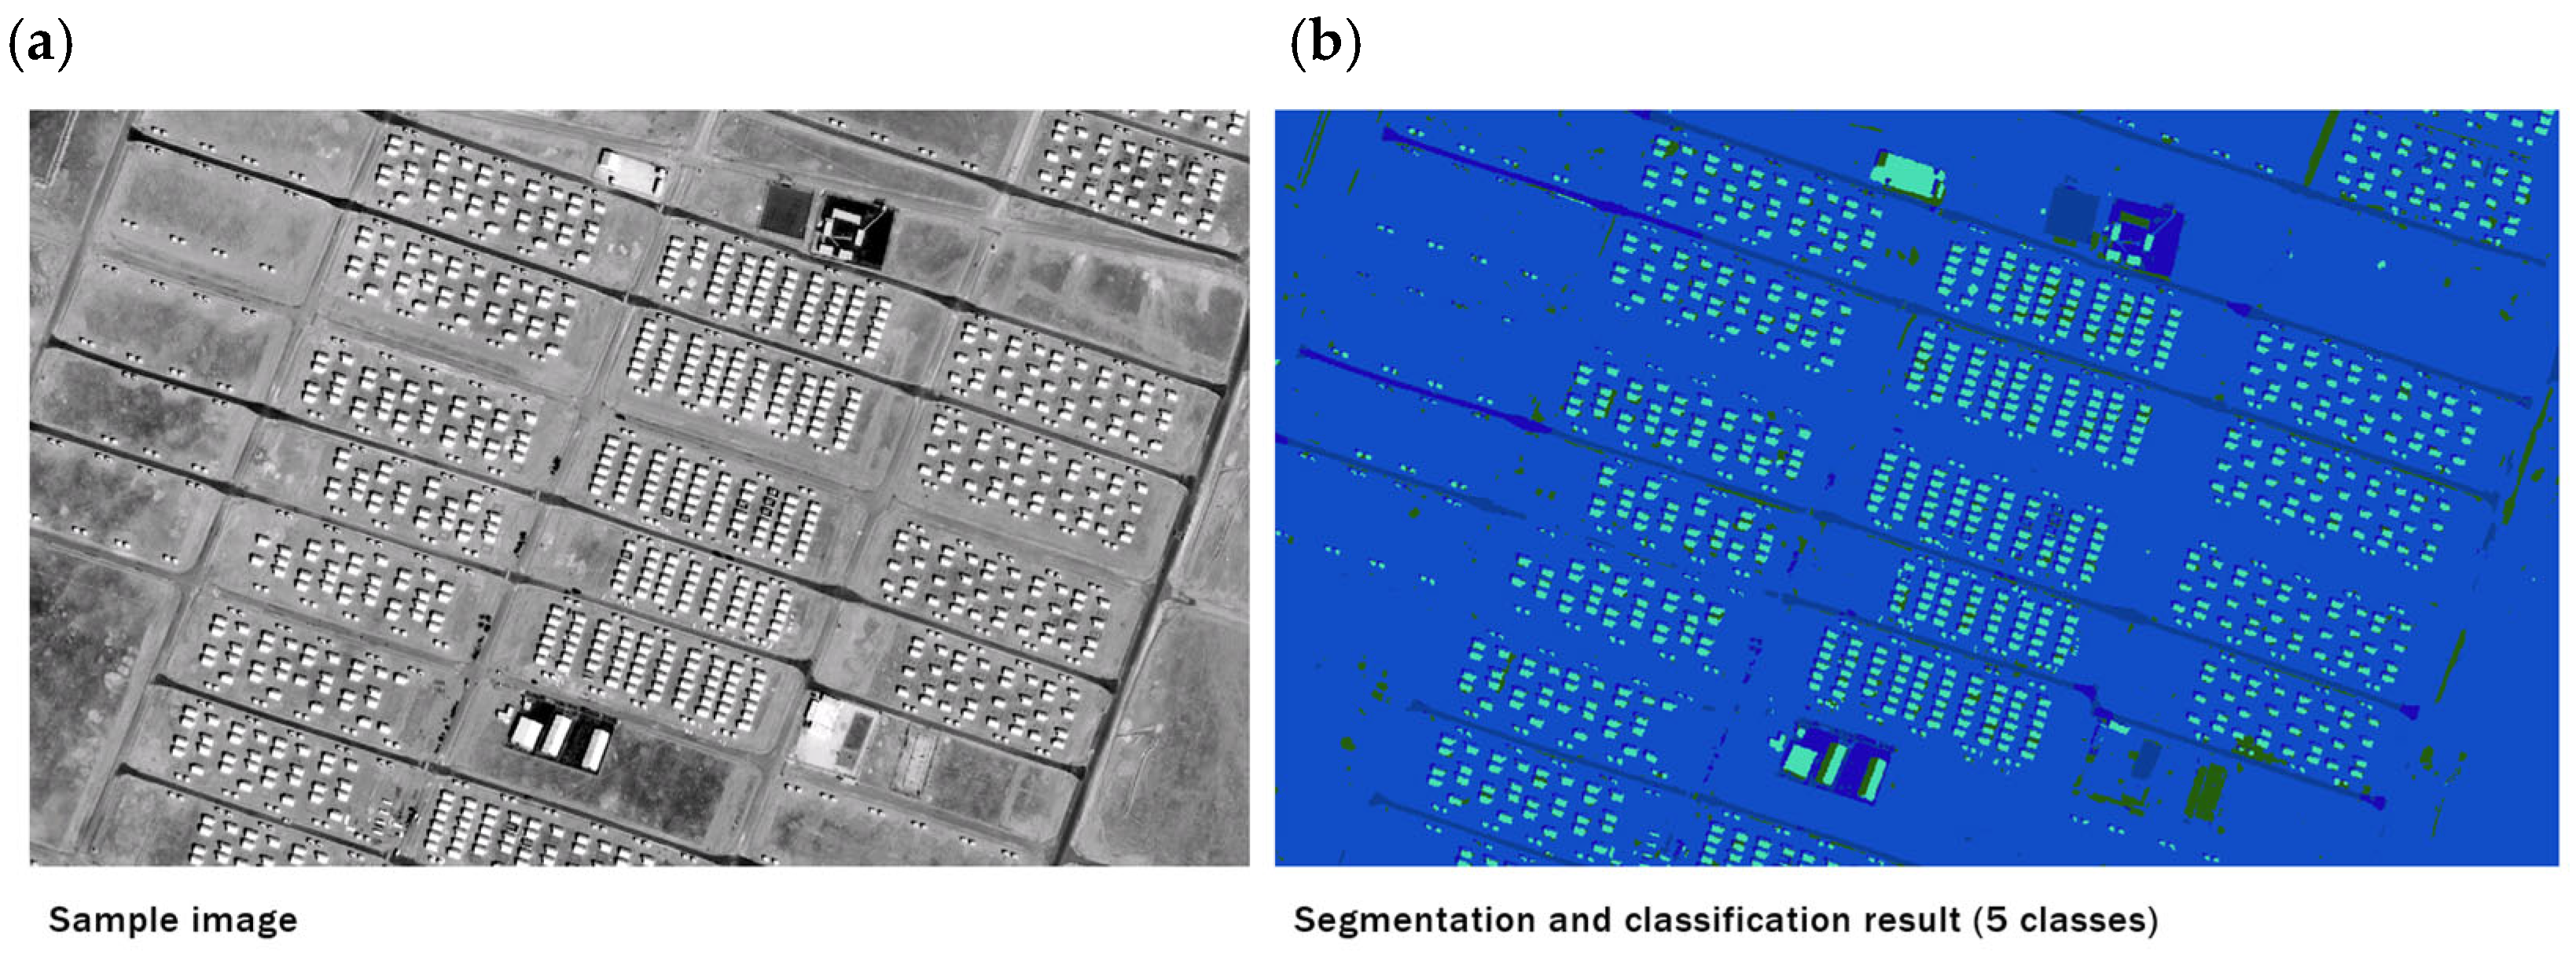
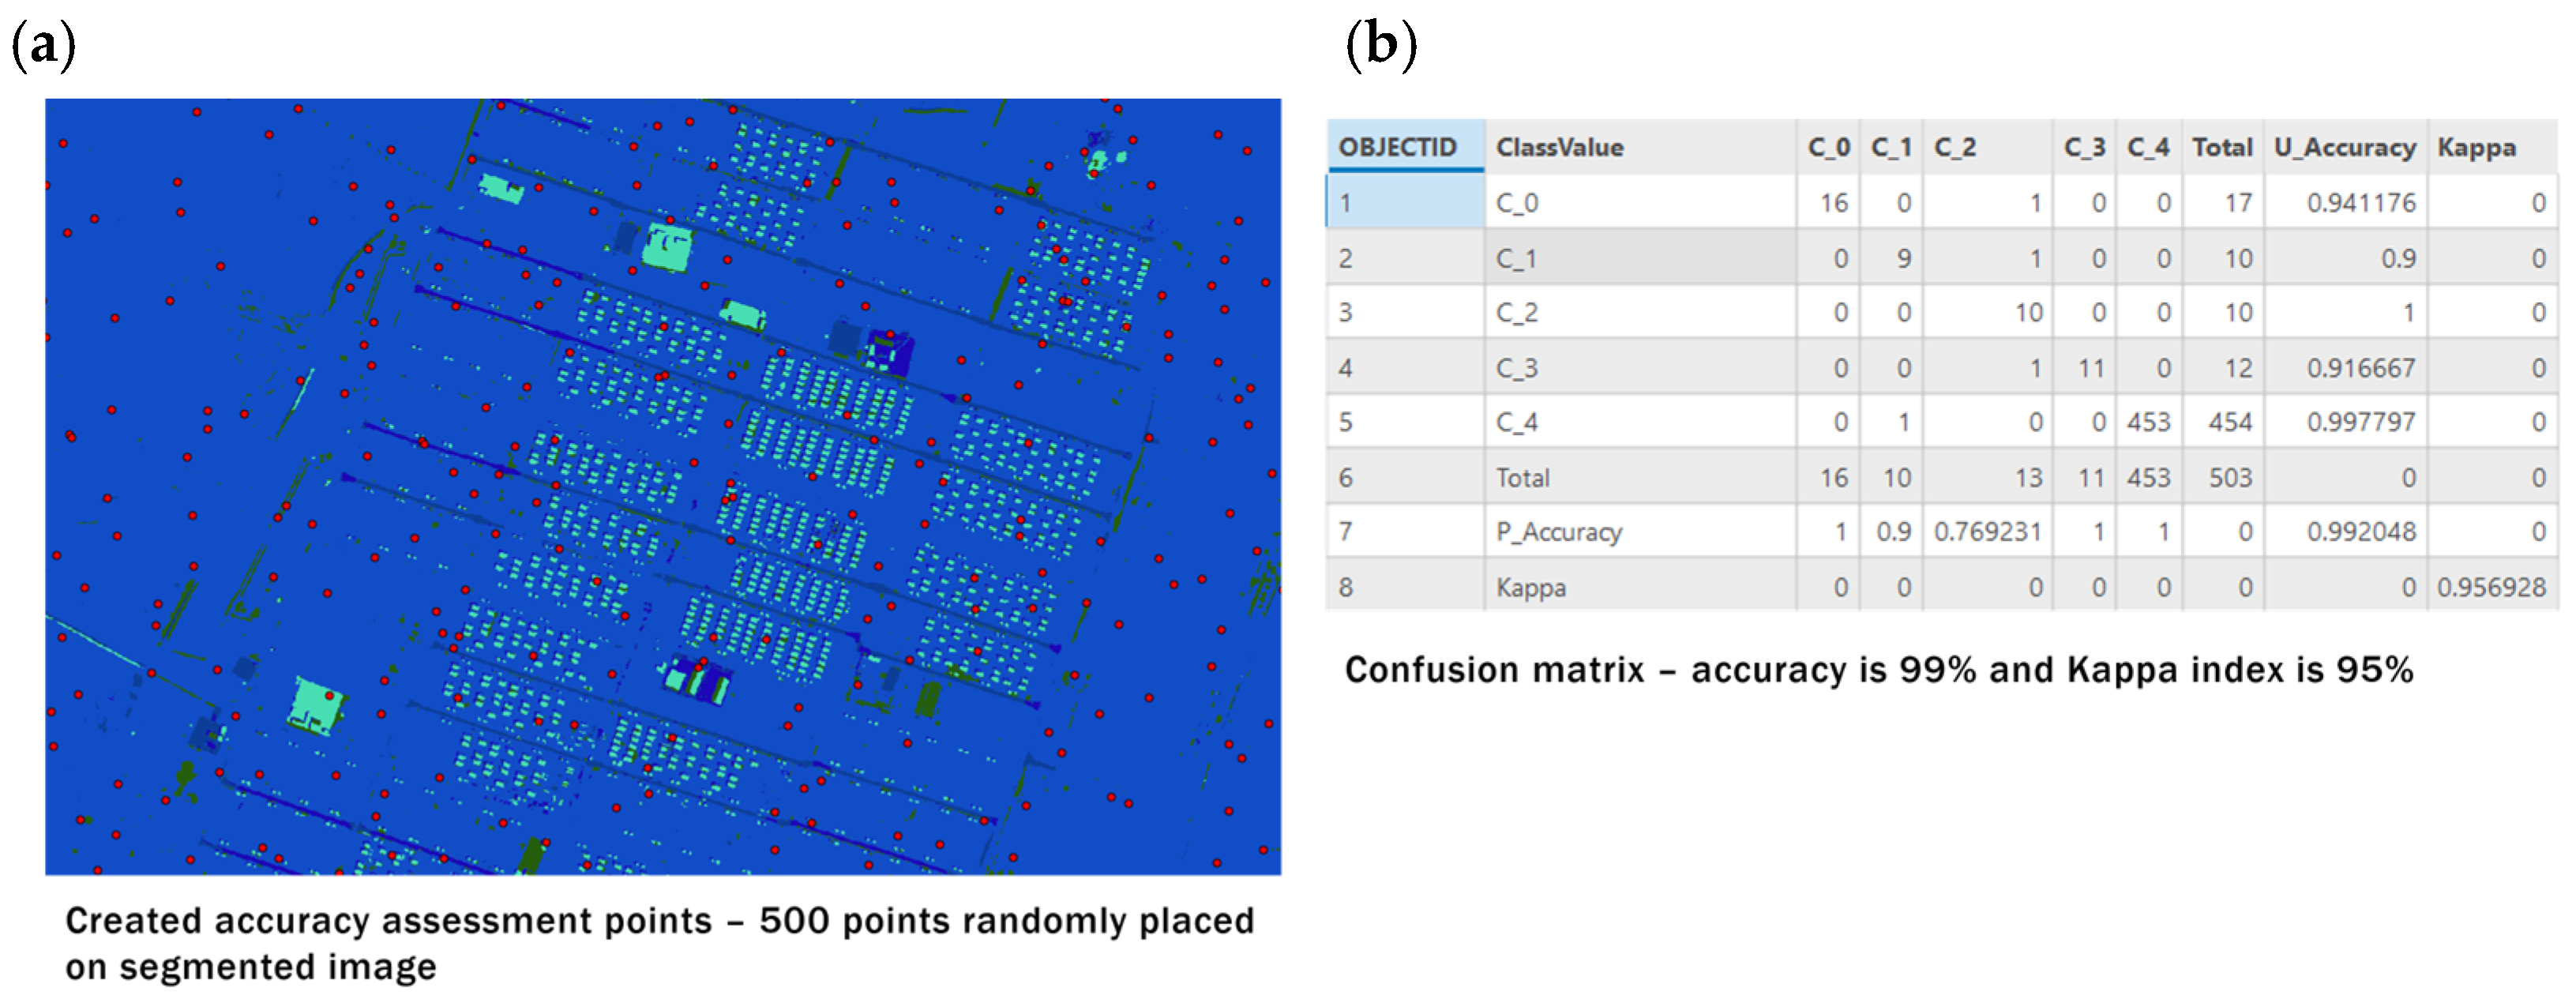
