1. Introduction
The global scientific problem addressed here is the challenge of monitoring and understanding vegetation trends and their implications for environmental sustainability, food security, and climate resilience in arid and semi-arid regions, particularly in the face of climate change, resource limitations, and socio-environmental pressures. This study contributes valuable theoretical insights by enhancing the understanding of vegetation dynamics in arid ecosystems, emphasizing the resilience of Djibouti’s vegetation to climatic and socio-environmental changes over three decades. This research represents a unique contribution to the established body of knowledge by demonstrating the efficacy of advanced spatial data analytic techniques in addressing critical societal challenges, such as food insecurity, without relying on costly remote sensing infrastructure.
Change detection in remote sensing plays a critical role in monitoring Earth’s surface and understanding various phenomena, such as land cover changes, urban expansion, deforestation, and more. Change detection is the process of identifying differences in the state of an object or phenomenon by observing it at different times [
1,
2]. It commonly employs methods such as image differencing, vegetative index differencing (most commonly NDVI), principal component analysis, and post-classification comparison [
2,
3,
4,
5,
6]. Researchers tested differencing methods quantitatively in the study of gypsy moth defoliation in Pennsylvania with results indicating that of the three methods tested, i.e., image differencing, ratioing, and a vegetative index difference, the vegetative index differencing most accurately delineated forest canopy change [
1,
7]. In recent times, essential techniques for change detection applications have evolved to include spectral mixture analysis, artificial neural networks, and the integration of geographical information systems and remote sensing data for object-based change detection [
2,
5,
6].
Several studies have contributed to the development of techniques for change detection, emphasizing different aspects of the process. Ref. [
3] presented a comprehensive review of change detection based on Landsat time series, focusing on frequencies, preprocessing, algorithms, and applications. The study highlighted the shift toward using higher frequencies of Landsat time series, image preprocessing steps like atmospheric correction and cloud detection, and various change detection algorithms categorized into different groups [
3]. The groups were thresholding, differencing, segmentation, trajectory classification, statistical boundary, and regression. Zhu’s research demonstrates the evolution of techniques and their application in understanding changes in land cover and environmental conditions.
These studies on change detection, including comprehensive review [
3], have significantly advanced the field by exploring Landsat time series, preprocessing steps, and diverse algorithms. However, they exhibit several limitations. First, the focus on specific preprocessing techniques, such as atmospheric correction and cloud detection, may overlook the challenges posed by inconsistent or missing data in long time series. Second, while the categorization of algorithms into thresholding, differencing, segmentation, trajectory classification, statistical boundary, and regression provides a useful framework, it does not fully address the integration of these methods or their adaptability to emerging data sources or higher-resolution imagery. Finally, the studies often emphasize technical advancements, with limited discussion on the practical implementation challenges or the broader socio-environmental implications of applying these methods to real-world scenarios. Addressing these gaps could enhance the robustness and applicability of change detection techniques.
The purpose of this study is to determine the temporal trend in total vegetation cover in Djibouti from 1990 to 2020 using DE Africa’s Open Data Cube, thirty years of Landsat imagery, change detection algorithms using NDVI (against baseline and post-baseline composites or decade composites), and statistical analysis (Unequal Variances t-test aka “Welch’s t-test”). To evaluate, this study presents a null hypothesis of no significant change in vegetation trends between 1990 and 2020. An alternate hypothesis will be a significant change, to be noted by Welch’s t-test.
2. Study Region
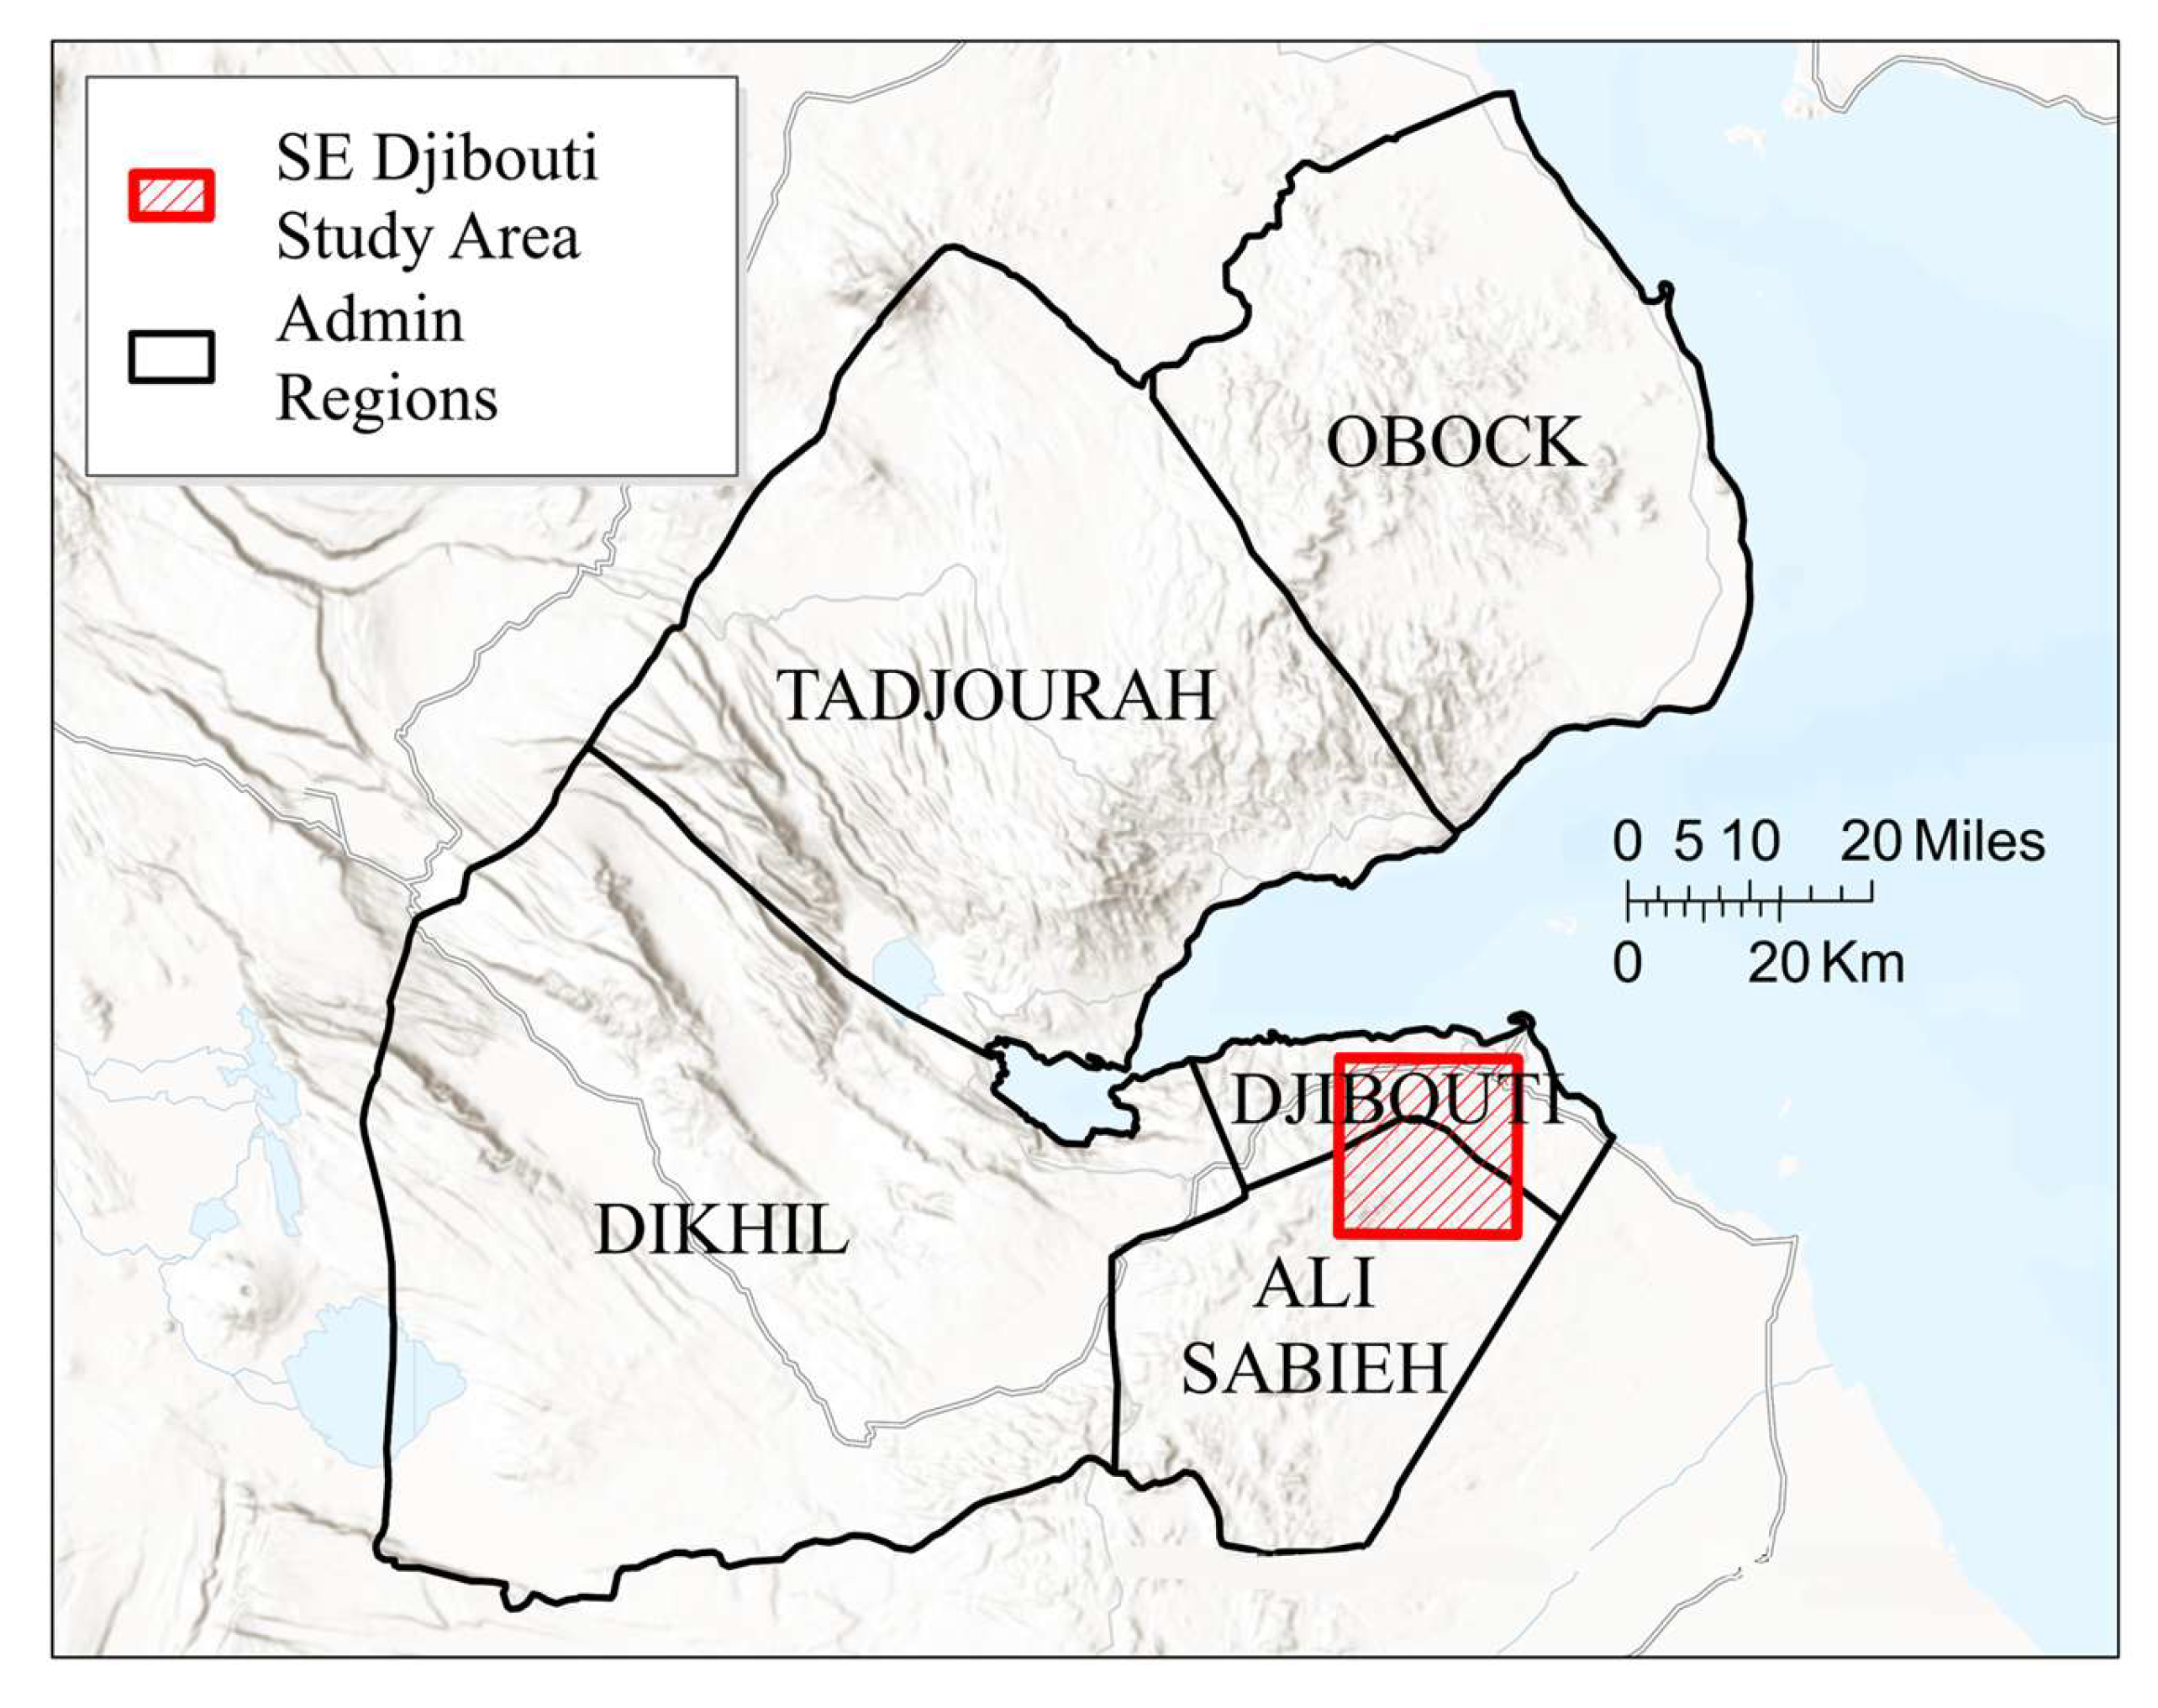
Djibouti, located in the Horn of Africa (
Figure 1A), is a small yet strategically significant country known for its geopolitical importance due to its proximity to key international waterways, including the Red Sea, Bab el Mandeb strait, and the Gulf of Aden [
8,
9,
10,
11,
12]. Bordered by Eritrea to the north, Ethiopia to the west and south, and Somalia to the southeast (
Figure 1B), Djibouti also shares maritime borders with Yemen across the Red Sea [
9,
10,
13]. With an arid and semi-arid climate, Djibouti’s geography predominantly consists of deserts and mountains. Lake Assal, one of the lowest points on Earth and known for its high salt content, lies in the Great Rift Valley within Djibouti’s borders [
9,
10,
13]. Despite its harsh climate, Djibouti plays a vital role in regional trade and logistics, hosting international military bases and serving as a gateway to the Red Sea (
Figure 1B) for landlocked Ethiopia [
9,
10,
11,
13,
14,
15]. Agriculture in Djibouti faces significant challenges due to limited arable land and water resources, making it highly dependent on imports for food supply. The country’s economy is primarily driven by services, trade, and transportation [
9,
10,
11,
12,
14,
15,
16,
17].
Djibouti faces significant challenges related to vegetative health over time and its effects on food security. According to the United States Agency for International Development (USAID), Djibouti’s arid and semi-arid climate, limited water resources, and poor soil quality present formidable obstacles to agriculture [
18,
19]. This situation is further exacerbated by frequent droughts leading to decreased agricultural productivity and jeopardizing food security [
20]. The country relies heavily on food imports due to limited rainfall, and grows vegetables and fruits as the principal production crops [
10]. Additionally, the lack of established agricultural water resources and soil infertility requires the importation of other food items [
10,
18,
19,
21]. Djibouti’s food security challenges are closely linked to its economy, with the services sector being the primary driver of growth [
12]. The country’s status as a regional trade and logistics hub has attracted significant foreign investment, but food security remains a critical concern due to the challenging environmental conditions [
12]. Remote sensing can play a key role in supporting Djibouti’s ongoing struggle with vegetation health and food security, which is shaped by its arid climate and limited agricultural resources [
8,
9,
10,
12,
14,
16,
20,
21,
22,
23].
The climatology of East Africa, particularly the Horn of Africa, has been a subject of interest and concern due to the region’s vulnerability to climate variability and change. Rowell et al. (2015) acknowledged the East African climate paradox, which contrasts recent droughts during the rainy season with climate model projections of increasing rainfall [
24]. This inconsistency raises questions about the reliability of climate models and the drivers behind observed trends [
24]. Ntale and Gan (2003) contribute by analyzing and modifying drought indices, such as the Palmer Drought Severity Index (PDSI), for East Africa [
25]. These indices help assess drought conditions, crucial for understanding the region’s susceptibility to water scarcity [
25]. Cattani et al. (2018) use satellite data to study rainfall trends and variability in East Africa between 1983 and 2015 [
26,
27]. Their findings indicate spatial and temporal variability in rainfall indices, with increasing trends in certain regions during specific seasons [
26,
27]. Khamala et al. (2022) focus on aerosol optical depths over East Africa, identifying an increase in aerosol load, particularly in arid and semi-arid zones, and emphasizing the impact on climate and air quality [
28]. Finally, Dabar et al. (2022) specifically address Djibouti’s meteorological drought and wet events from 1961 to 2021 [
29]. They report a significant drying tendency at Djibouti Airport, with the eastern coastal region being the most affected by increased drought incidence, specifically with more than 80% of the extremely and severely dry events occurring between 2007 and 2017. [
29]. The western regions, however, had a positive trend in their Standard Precipitation Index (SPI) between 1981 and 2021 due to the increase in the June–September rains [
29]. Dabar’s study connects drought patterns to large-scale climate variability in the Indo-Pacific region [
29].
3. Materials and Methods
3.1. Workflow
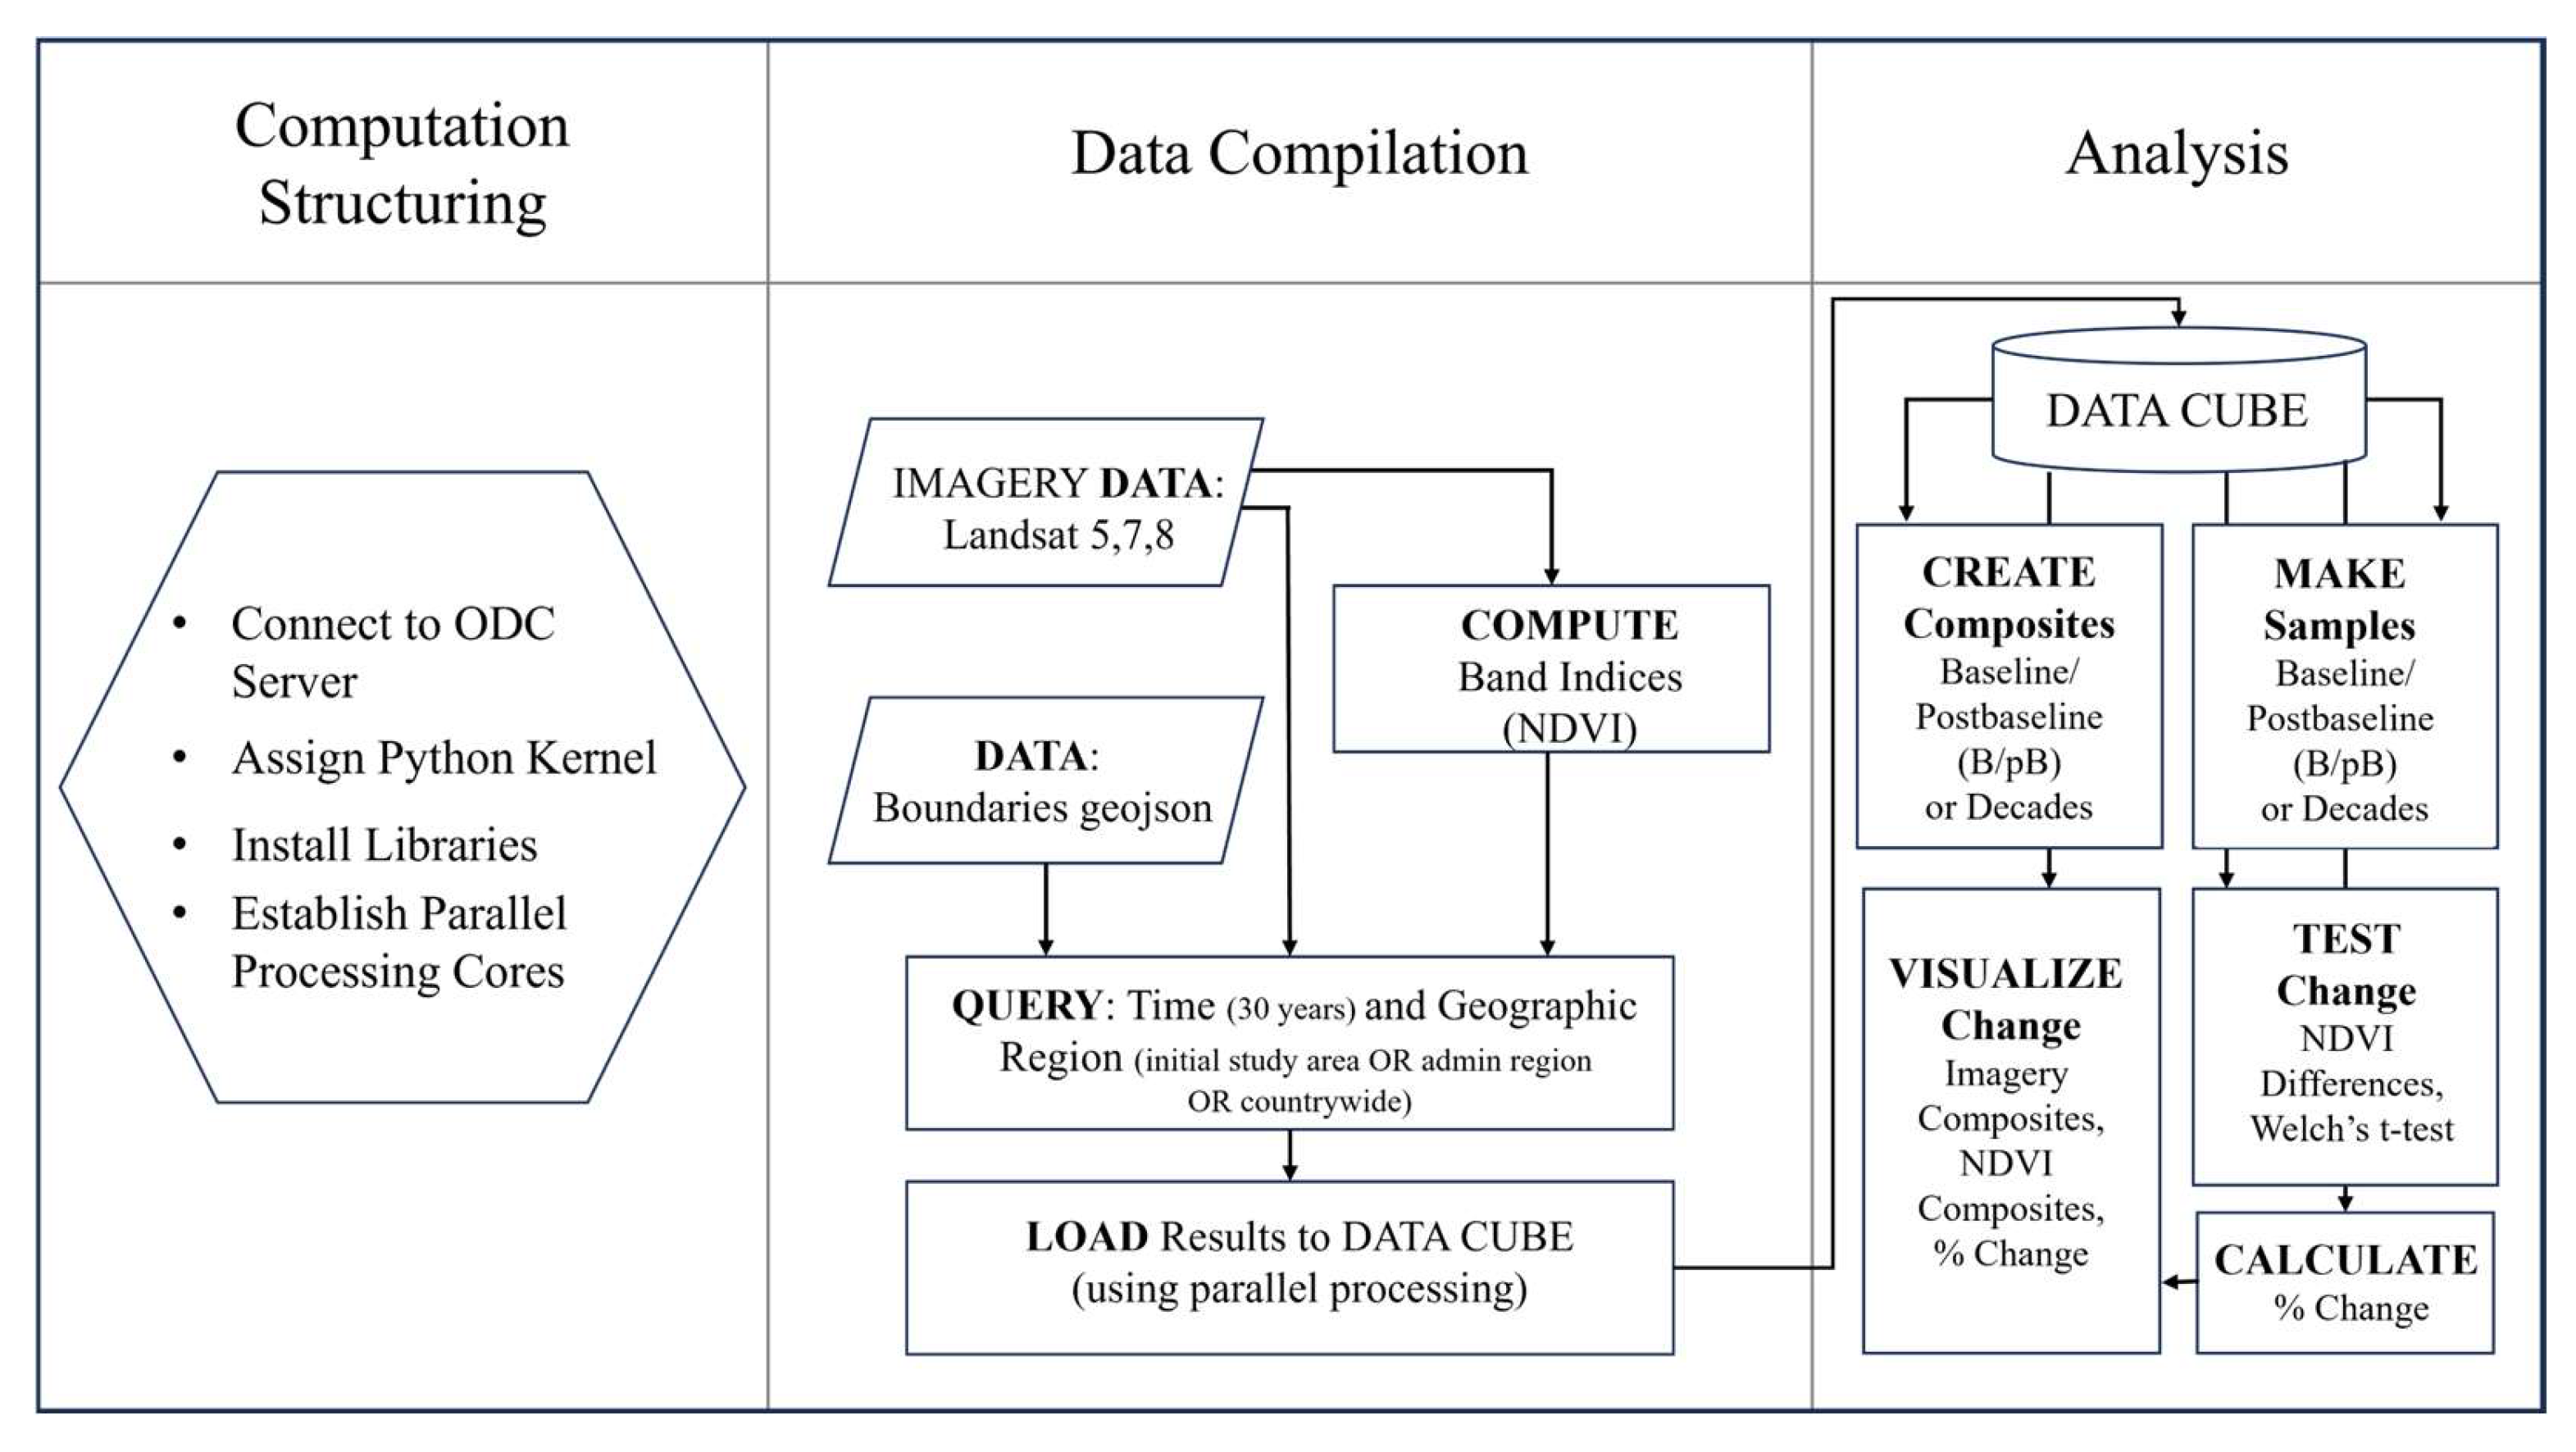
This study included change detection analyses in various spatial and temporal scales across Djibouti, ranging from the SE Djibouti Study Area, regional provinces, and nationwide. The workflow consists of three phases: computation structuring to prepare the ODC platform for the specific analytic task, data compilation to gather, filter, query and load the appropriate data to the data cube, and analysis to run the specific algorithms such as NDVI differencing, Welch’s
t-test, or percent change calculations (
Figure 2).
3.1.1. Computation Structuring
The computation structuring phase begins by connecting to the ODC cloud server, assigning a kernel, installing libraries, and establishing the parallel processing cores. This phase also includes creating an empty data cube in preparation for the next phase, data compilation. In the data compilation phase, the imagery data and GIS data were assembled and the NDVI index was created. To ensure repeatable results, we set preliminary analysis query parameters, including latitude and longitude ranges for the SE Djibouti Study Area (
Figure 3), and defined the administrative areas and countrywide boundaries using geojson files from United States Agency for International Development (USAID) Famine Early Warning Systems Network (FEWSNET) [
30]. The SE Djibouti Study Area (
Figure 3) was chosen to rapidly test the feasibility of algorithms and was based on proximity to the most populous region (capital city) and the immediately adjacent agricultural areas. The regional province level and national level were selected with the intent to show more nuanced regional variability as compared to national vegetative trends. We then established the full study date range of 1990–2020, assigned dates to the baseline, post-baseline, and decade variables, and configured the output coordinate system.
3.1.2. Data Compilation
During the data compilation phase (
Figure 2), the nationwide and regional provincial analysis with higher definition imagery (30 m) requires parallel processing cores to efficiently handle the substantial data loading requirements. Each data cube was created and maintained separately to ensure the different study parameters (i.e., regional versus national; baseline/post-baseline versus decades) were not accidentally overlapped, corrupting the results.
For the regional or national scale portion, we loaded boundary feature layers (country or provincial boundaries [
30]) into the data cube. These are used to create pixel masks that limit the processing to just one specific region, preserving computing resources. We then computed the essential band indices for the study (in this case, NDVI) [
31], to be used in the change detection comparison [
2,
5] in the third phase analysis.
3.1.3. Analysis—Change Detection with NDVI Differencing and Welch’s t-Test
Since hypothesis testing is critical to the study [
32], we created samples for this purpose in the analysis phase (
Figure 2). When comparing baseline (composite of the first fifteen years of the study period) and post-baseline (composite of the last fifteen years of the study) data or evaluating the changes between the three different decades, we employed NDVI differencing (Equation (1)) and Welch’s
t-test (Equation (2)) [
33] to quantify the changes and determine their significance. Calculating the total area change and net change allows us to quantify the magnitude of improvement (gain) or degradation (loss) in Djibouti’s vegetation health.
Vegetative index (NDVI) differencing,
where
t1 is a pixel from the first image and
t2 is the corresponding pixel from the second image (Equation (1)), provides an avenue for deciding whether or not a vegetation canopy has been significantly altered [
1,
7].
Welch’s
t-test (Equation (2)) is an important statistical tool when needing to compare two independent groups. The conventional approach, using Student’s
t-test, assumes the normality and homogeneity of variances [
33,
34,
35]. However, when these assumptions are not met, Student’s
t-test can be biased and lead to invalid inferences [
33,
36,
37,
38]. Welch’s
t-test defines the statistic
t as follows:
where
and
are the sample means,
and
are the sample variances, and
and
are the sample sizes [
33,
39].
It is worth noting that the use of Welch’s
t-test is particularly relevant when dealing with small sample sizes [
33,
36,
38]. Ref. [
38] conducted a simulation study to investigate the behavior of
t-tests with extremely small sample sizes, defining N = 5 as extremely small. The results suggested that the
t-test remains feasible with small sample sizes, providing Type I error rates close to the nominal value and acceptable power for large effect sizes [
38]. Welch’s
t-test addresses the limitations of Student’s
t-test, making it a more robust and suitable choice, especially with challenges such as non-normality and unequal variances [
33,
36,
37,
38,
40]. This recommendation aligns with the observed trend of increasing the acceptance and utilization of Welch’s
t-test in the scientific community [
41].
3.2. Software and Imagery Data
The software used in the study includes Open Data Cube, ArcGIS Pro, Microsoft Excel, and PowerPoint. The actual data loading and primary analysis were accomplished using DE Africa’s Open Data Cube sandbox [
42,
43]; their cloud-based computational platform operates in a Jupyter Lab environment. The study required python packages including NumPy, GeoPandas, Matplotlib, and SciPy (particularly for Welch’s
t-test). Mapping and visualization were performed in Esri’s ArcPro, with some charting and graphing in Microsoft’s Excel and PowerPoint.
The study imagery were Landsat 5, 7, and 8 yearly composites in both 120 m and 30 m resolutions, one composite of each for every year of the study. The GEOMAD Landsat 5, 7, 8 surface reflectance geomedian and triple median absolute deviation data service is a cloud-free composite of Landsat satellite data compiled annually by DE Africa and provided in 30 m and 120 m resolution [
42,
44]. The feature class data for the Djibouti administrative and countrywide boundaries were downloaded from USAID’s FEWSNET [
18,
19,
30].
4. Results
The study results came from two separate approaches to the change detection algorithm. The first approach was to take the data cube for each area at various resolutions: SE Djibouti Study Area 120 m and 30 m, countrywide 120 m and 30 m, administrative regions 30 m (
Figure 3); then, we divide them into baseline and post-baseline (B/pB) composites (1990–2014 and 2015–2020, respectively) to compare changes from the first half and the second half of the study timeline. The second approach was to break the 120 m countrywide data into three decades (1990s as 1990–1999, 2000s as 2000–2009, and 2010s as 2010–2020) and compare them with the change detection algorithm to further delve into more detailed vegetative patterns. The results from Welch’s
t-test on the B/pB composites show the percent Vegetative Gain and Loss for each data cube (
Table 1).
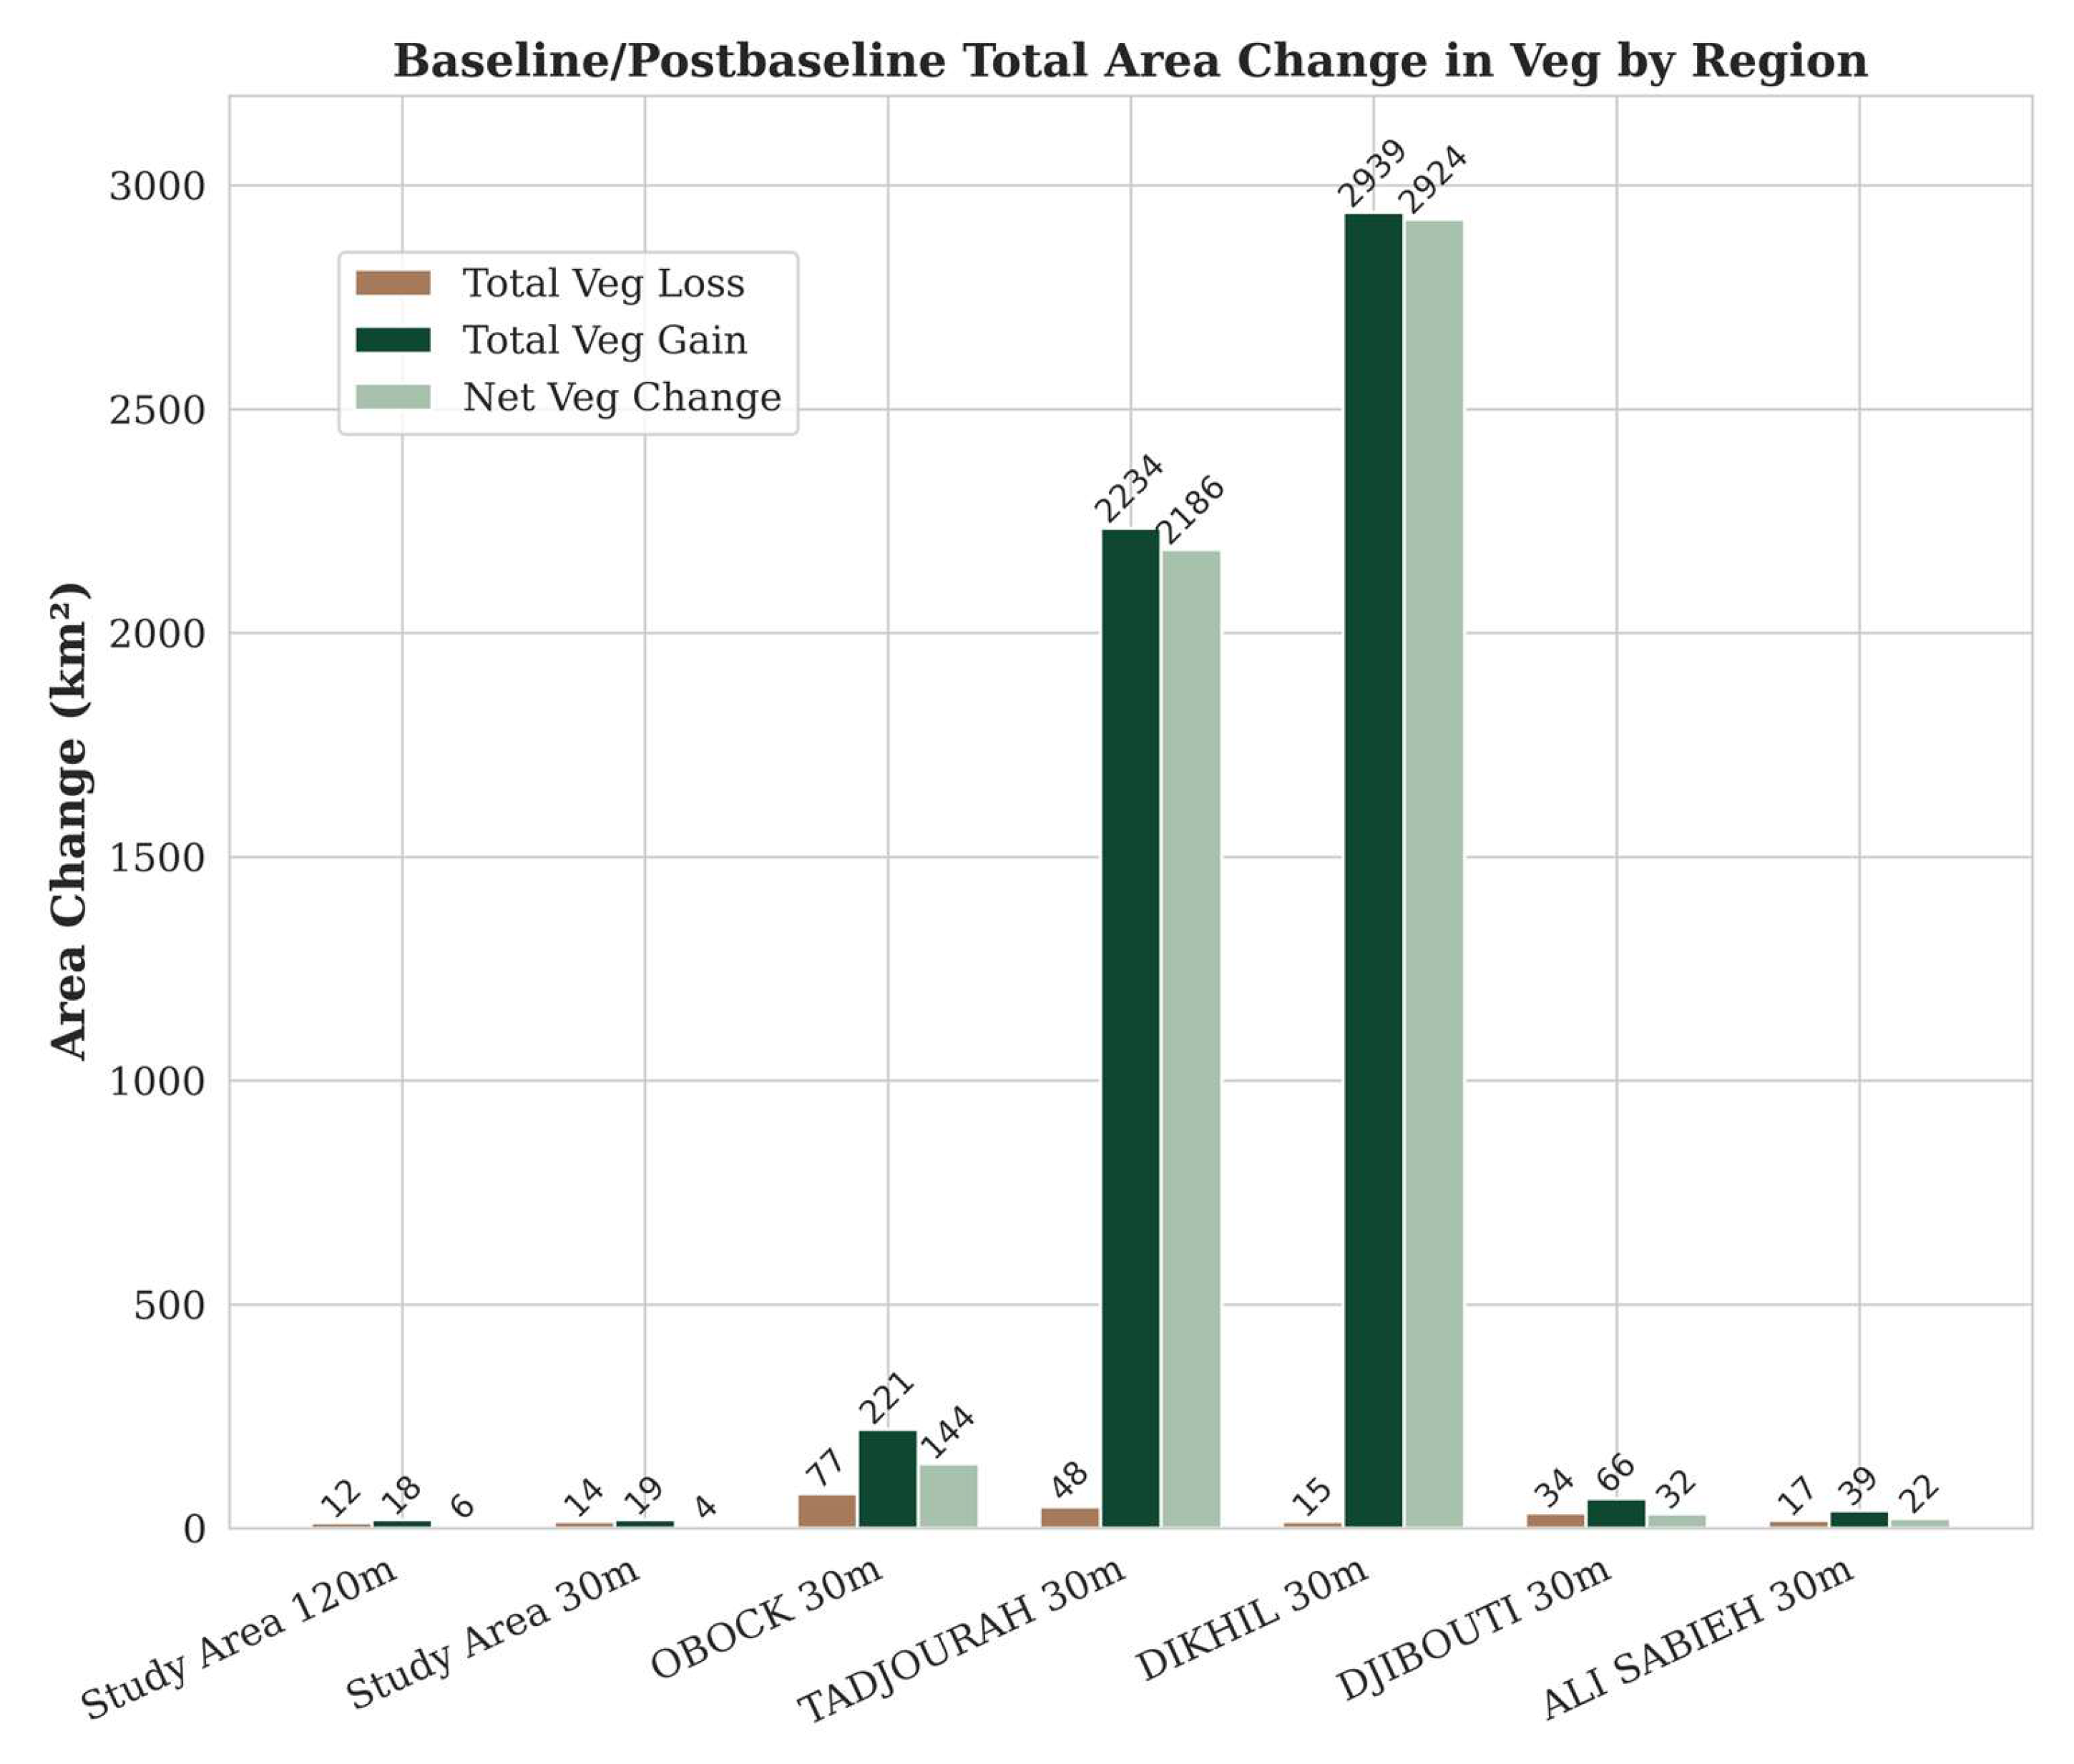
4.1. Baseline/Post-Baseline Results
The baseline to post-baseline (B/pB) data across the various study areas show distinct patterns of vegetation change (
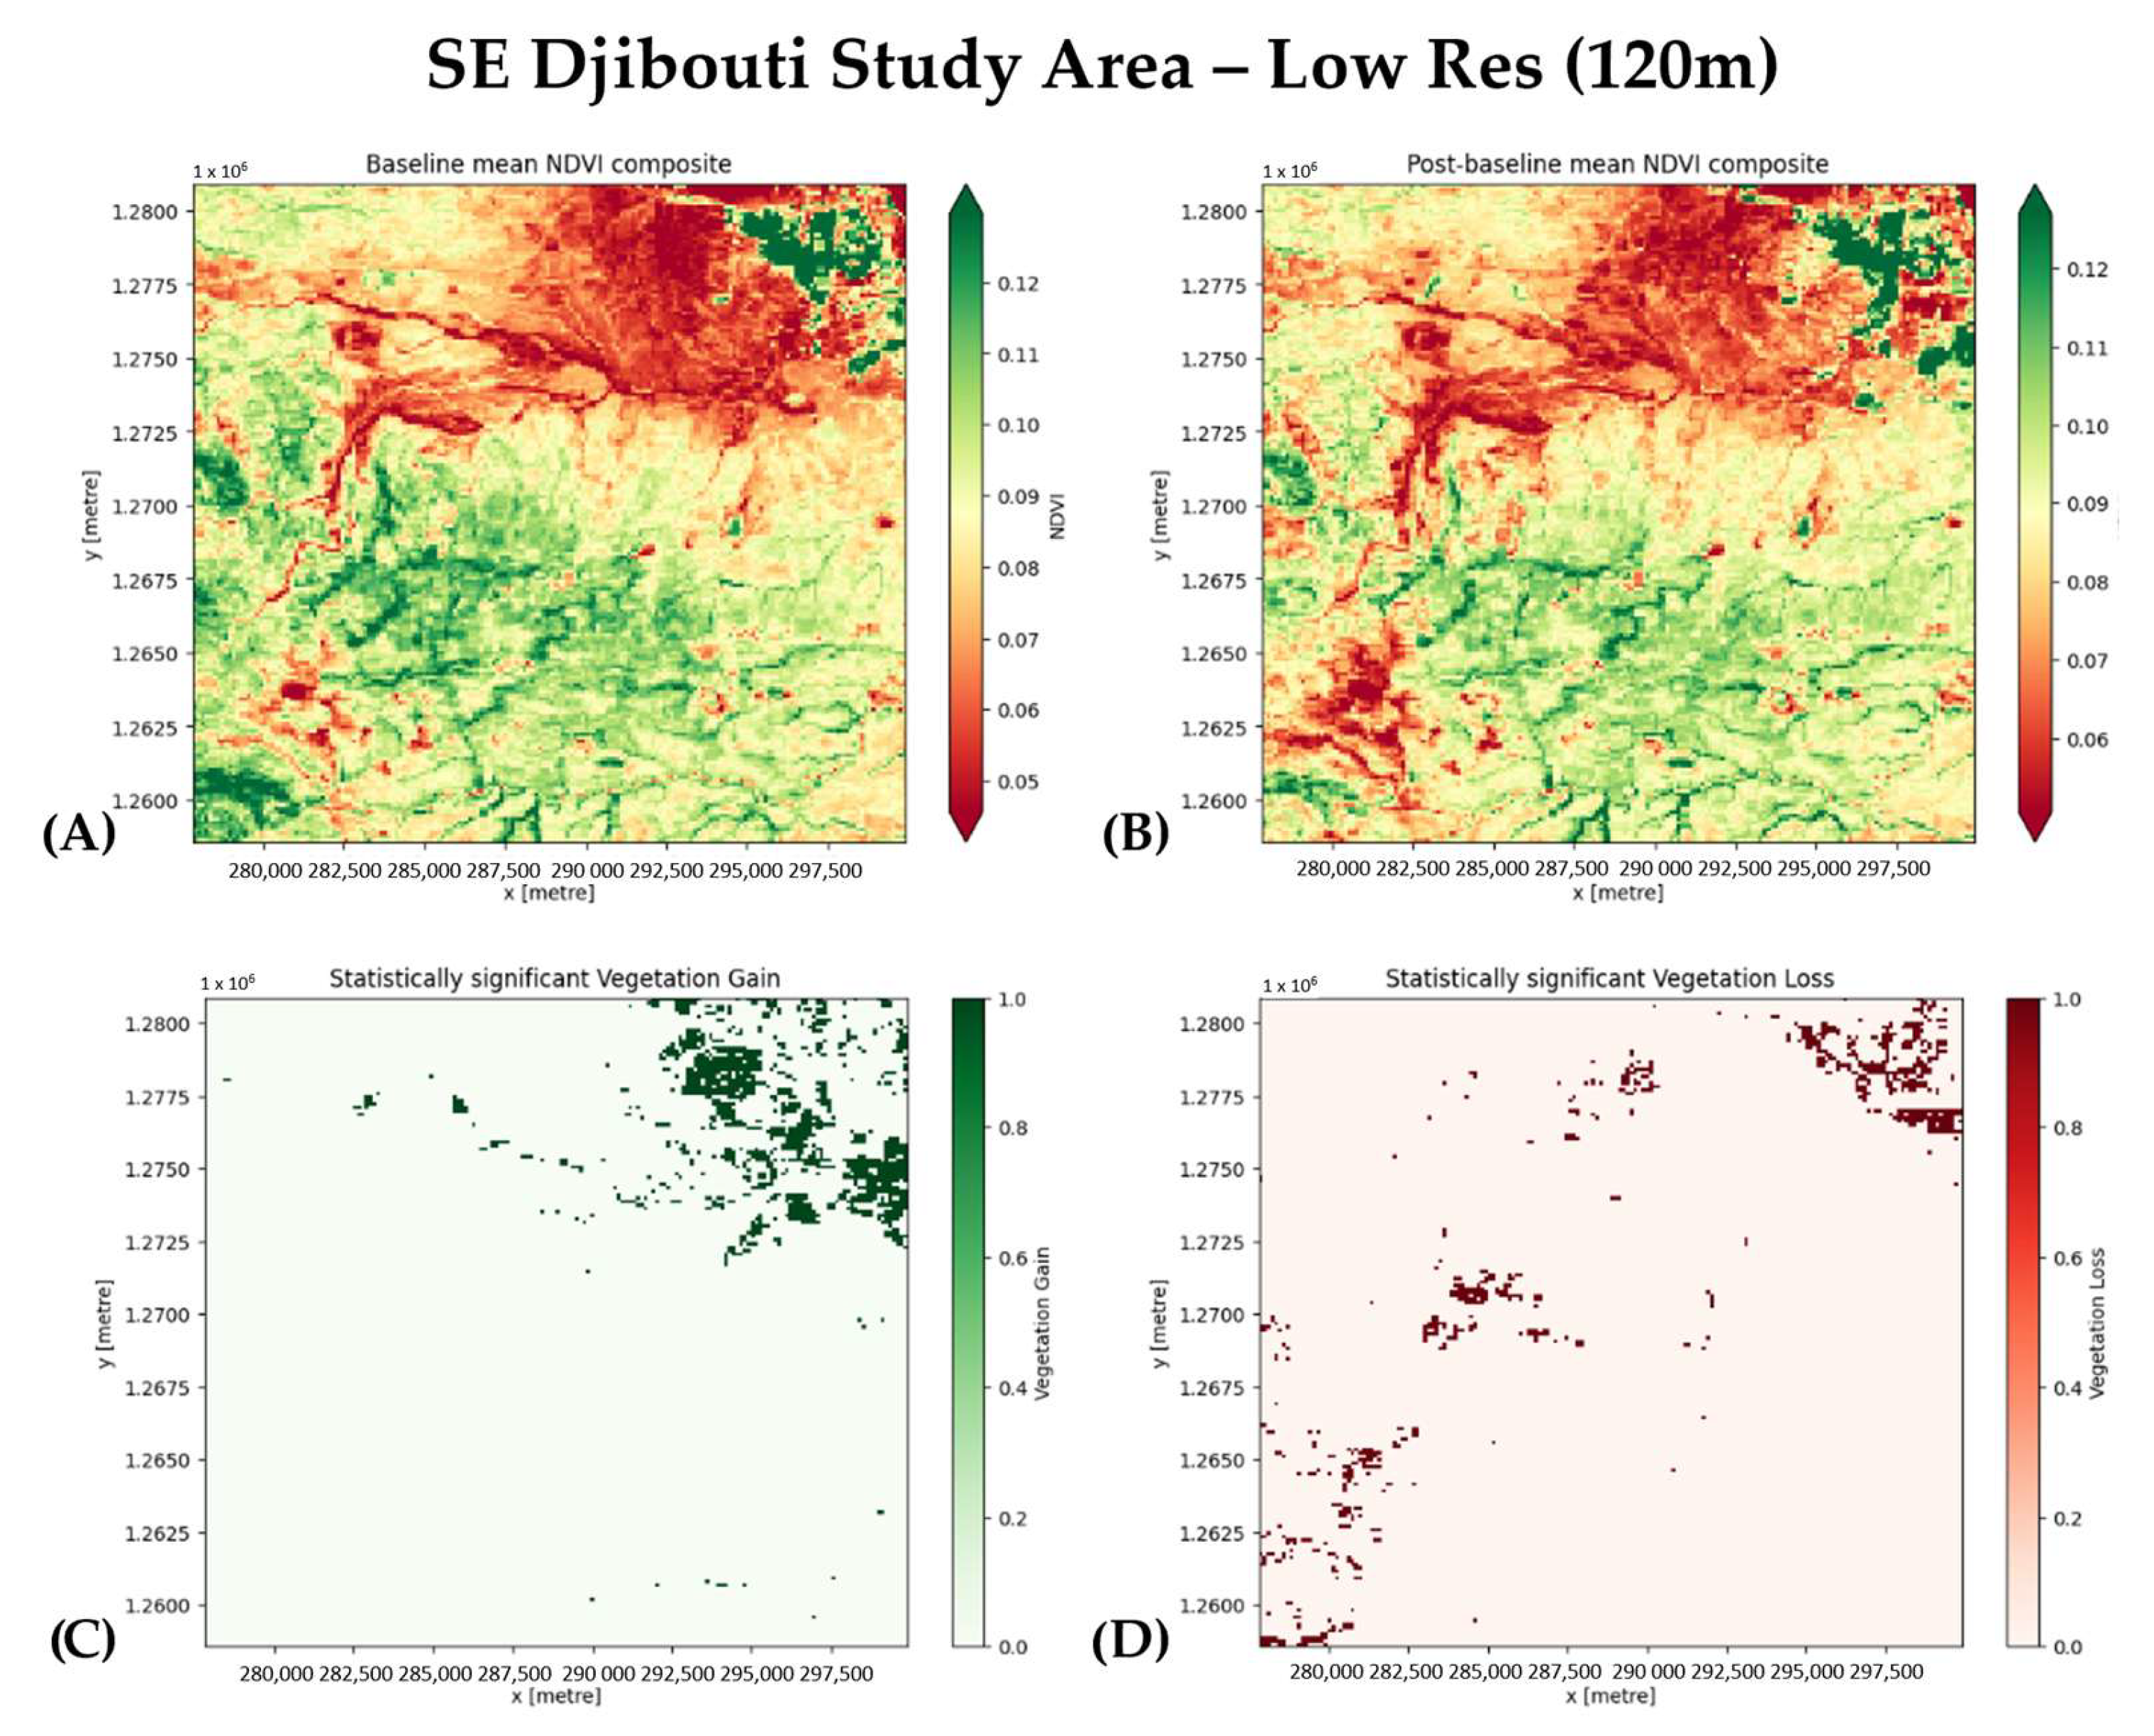
Table 1). Within the SE Djibouti Study Area at 120 m resolution (
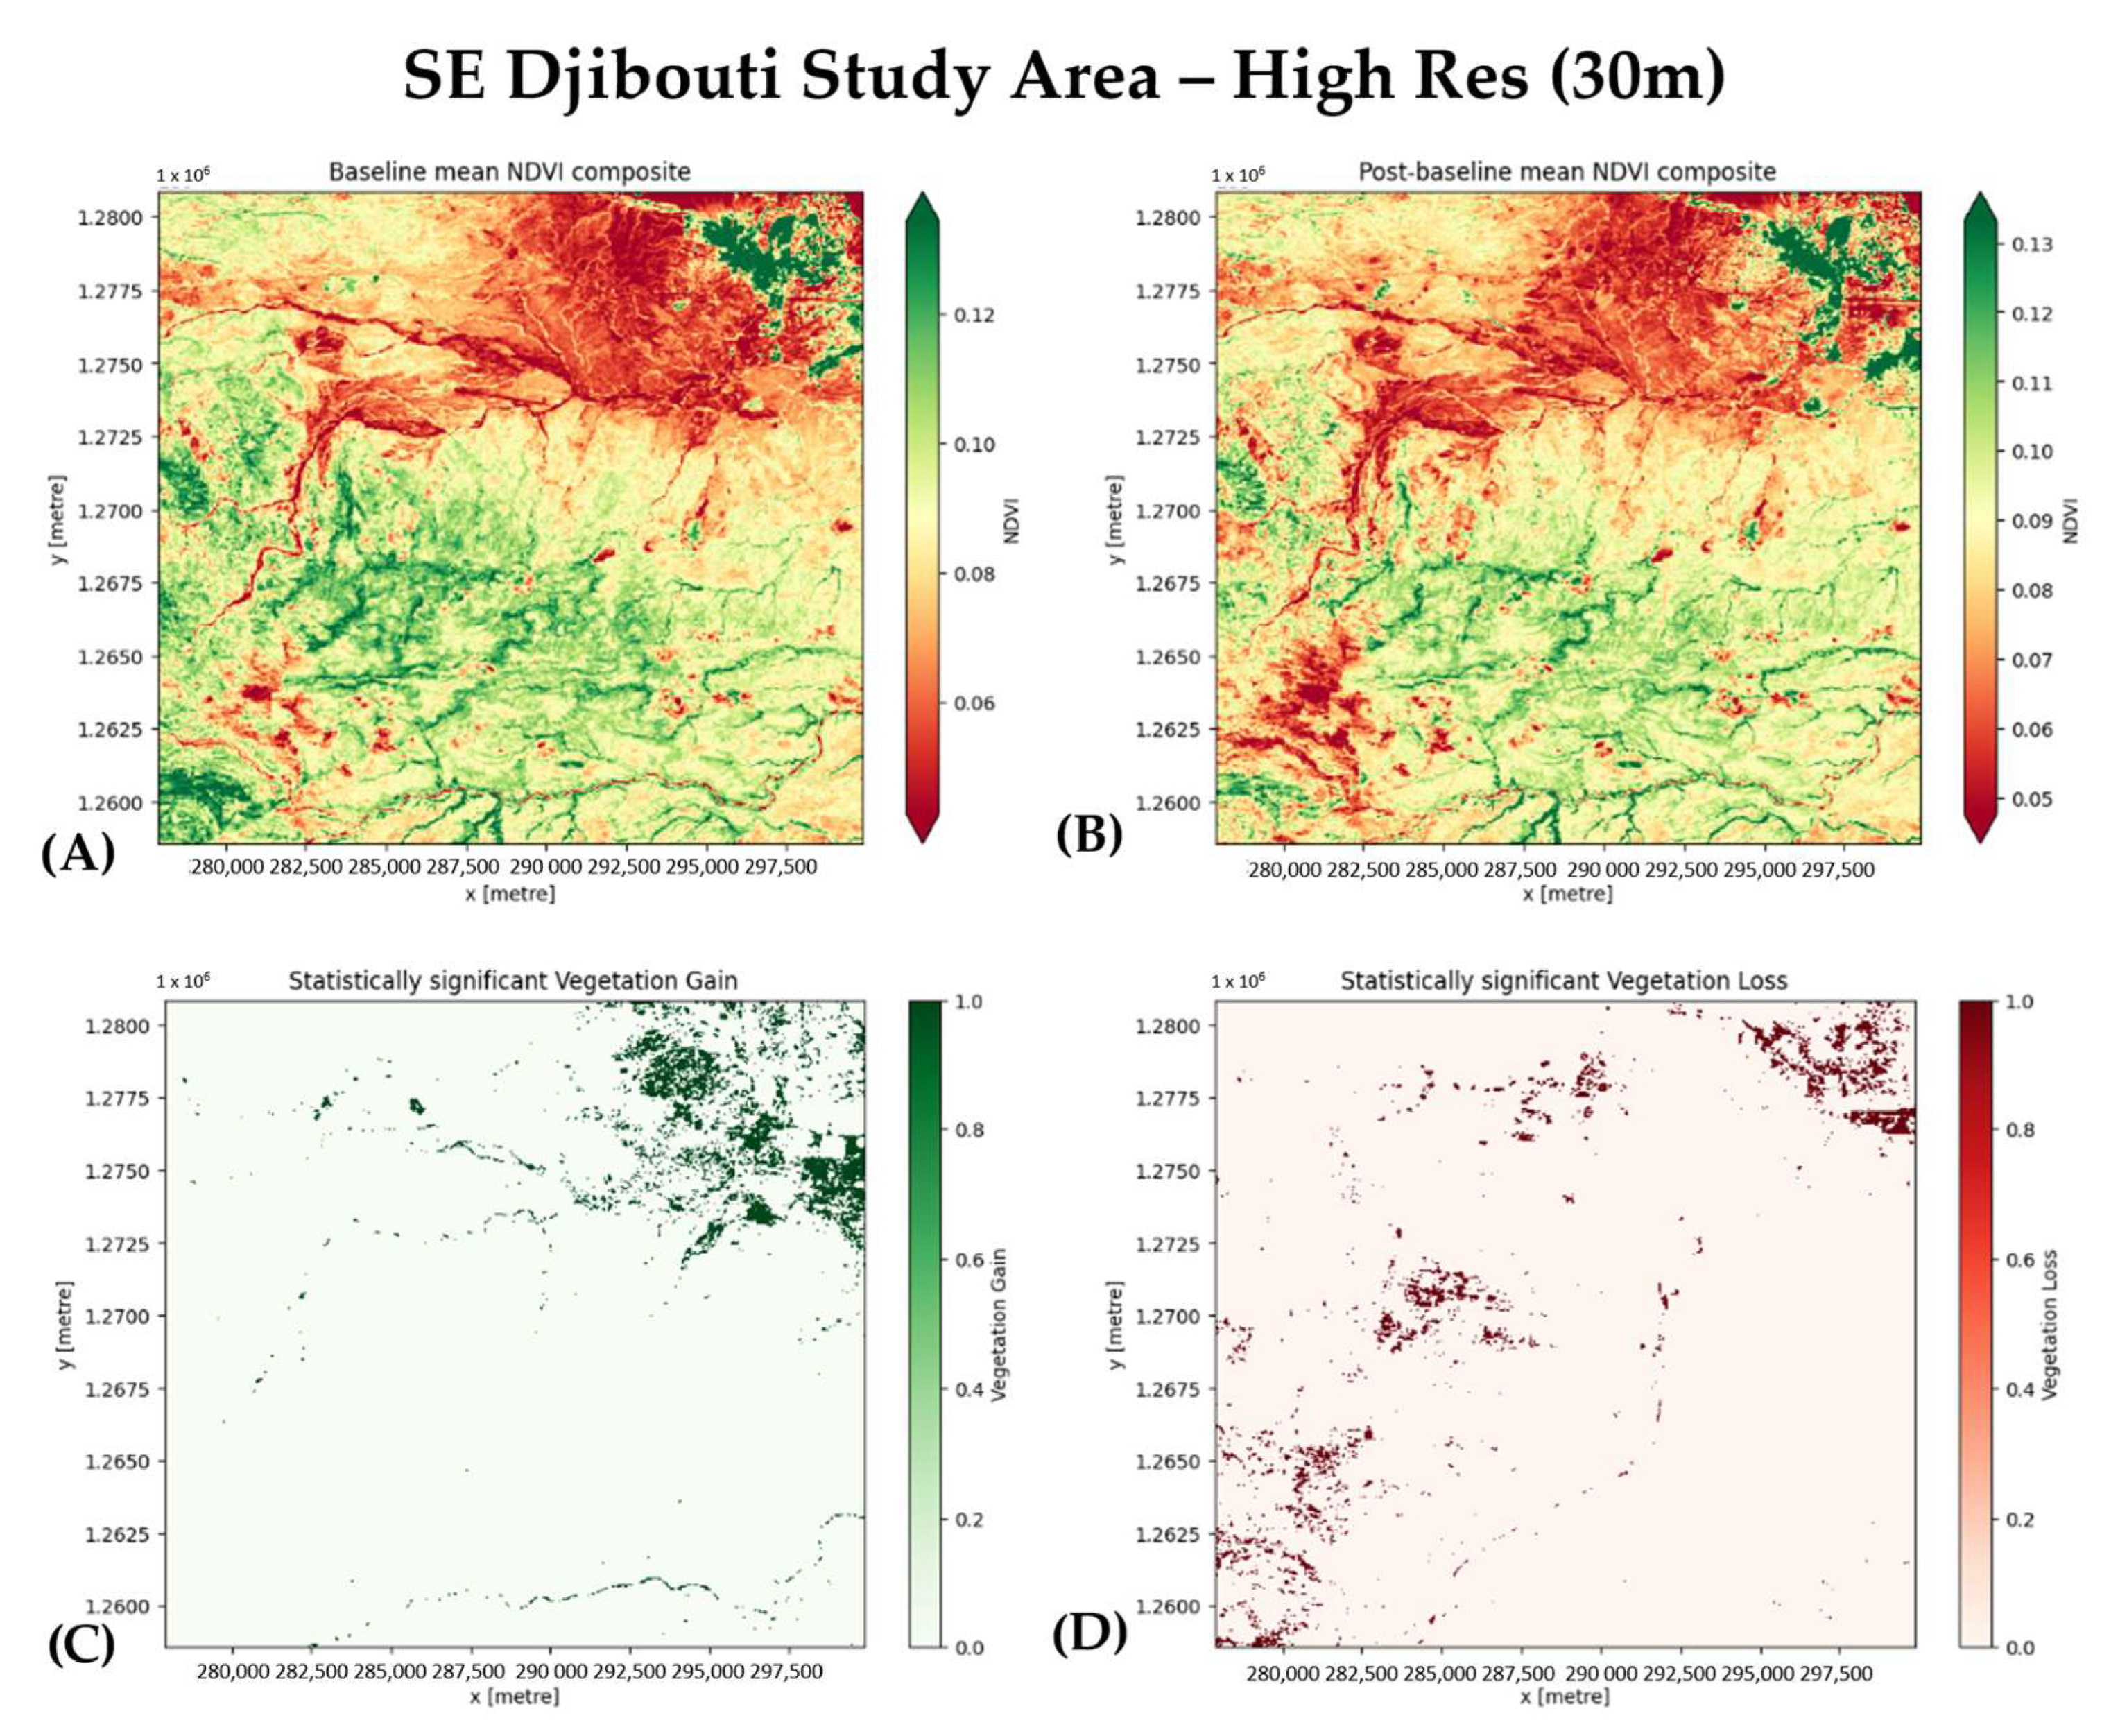
Figure 3), there was an increase of 3.81% in vegetation, accompanied by a loss of 2.44%. Similarly, in the SE Djibouti Study Area at 30 m resolution, a gain of 3.90% in vegetation was observed, while the corresponding loss was nearly the same as the lower resolution at 2.95%. On a countrywide scale, the overall vegetation gain was more pronounced, reaching 25.18%, with a minimal loss of 0.70%. Zooming in on specific regions within Djibouti, the OBOCK region exhibited a gain of 4.97% in vegetation and a loss of 1.74%. The TADJOURAH region displayed a substantial vegetation gain of 34.58%, coupled with a minimal loss of 0.74%. The DIKHIL region showed the most significant vegetation gain at 37.46%, while experiencing an exceptionally low loss of 0.19%. Meanwhile, in the DJIBOUTI region, the vegetation gain was 8.42%, but there was a comparatively higher loss of 4.40%. Lastly, the ALI SABIEH region demonstrated a modest gain of 1.81% in vegetation, with a loss of 0.81% (
Figure 4).
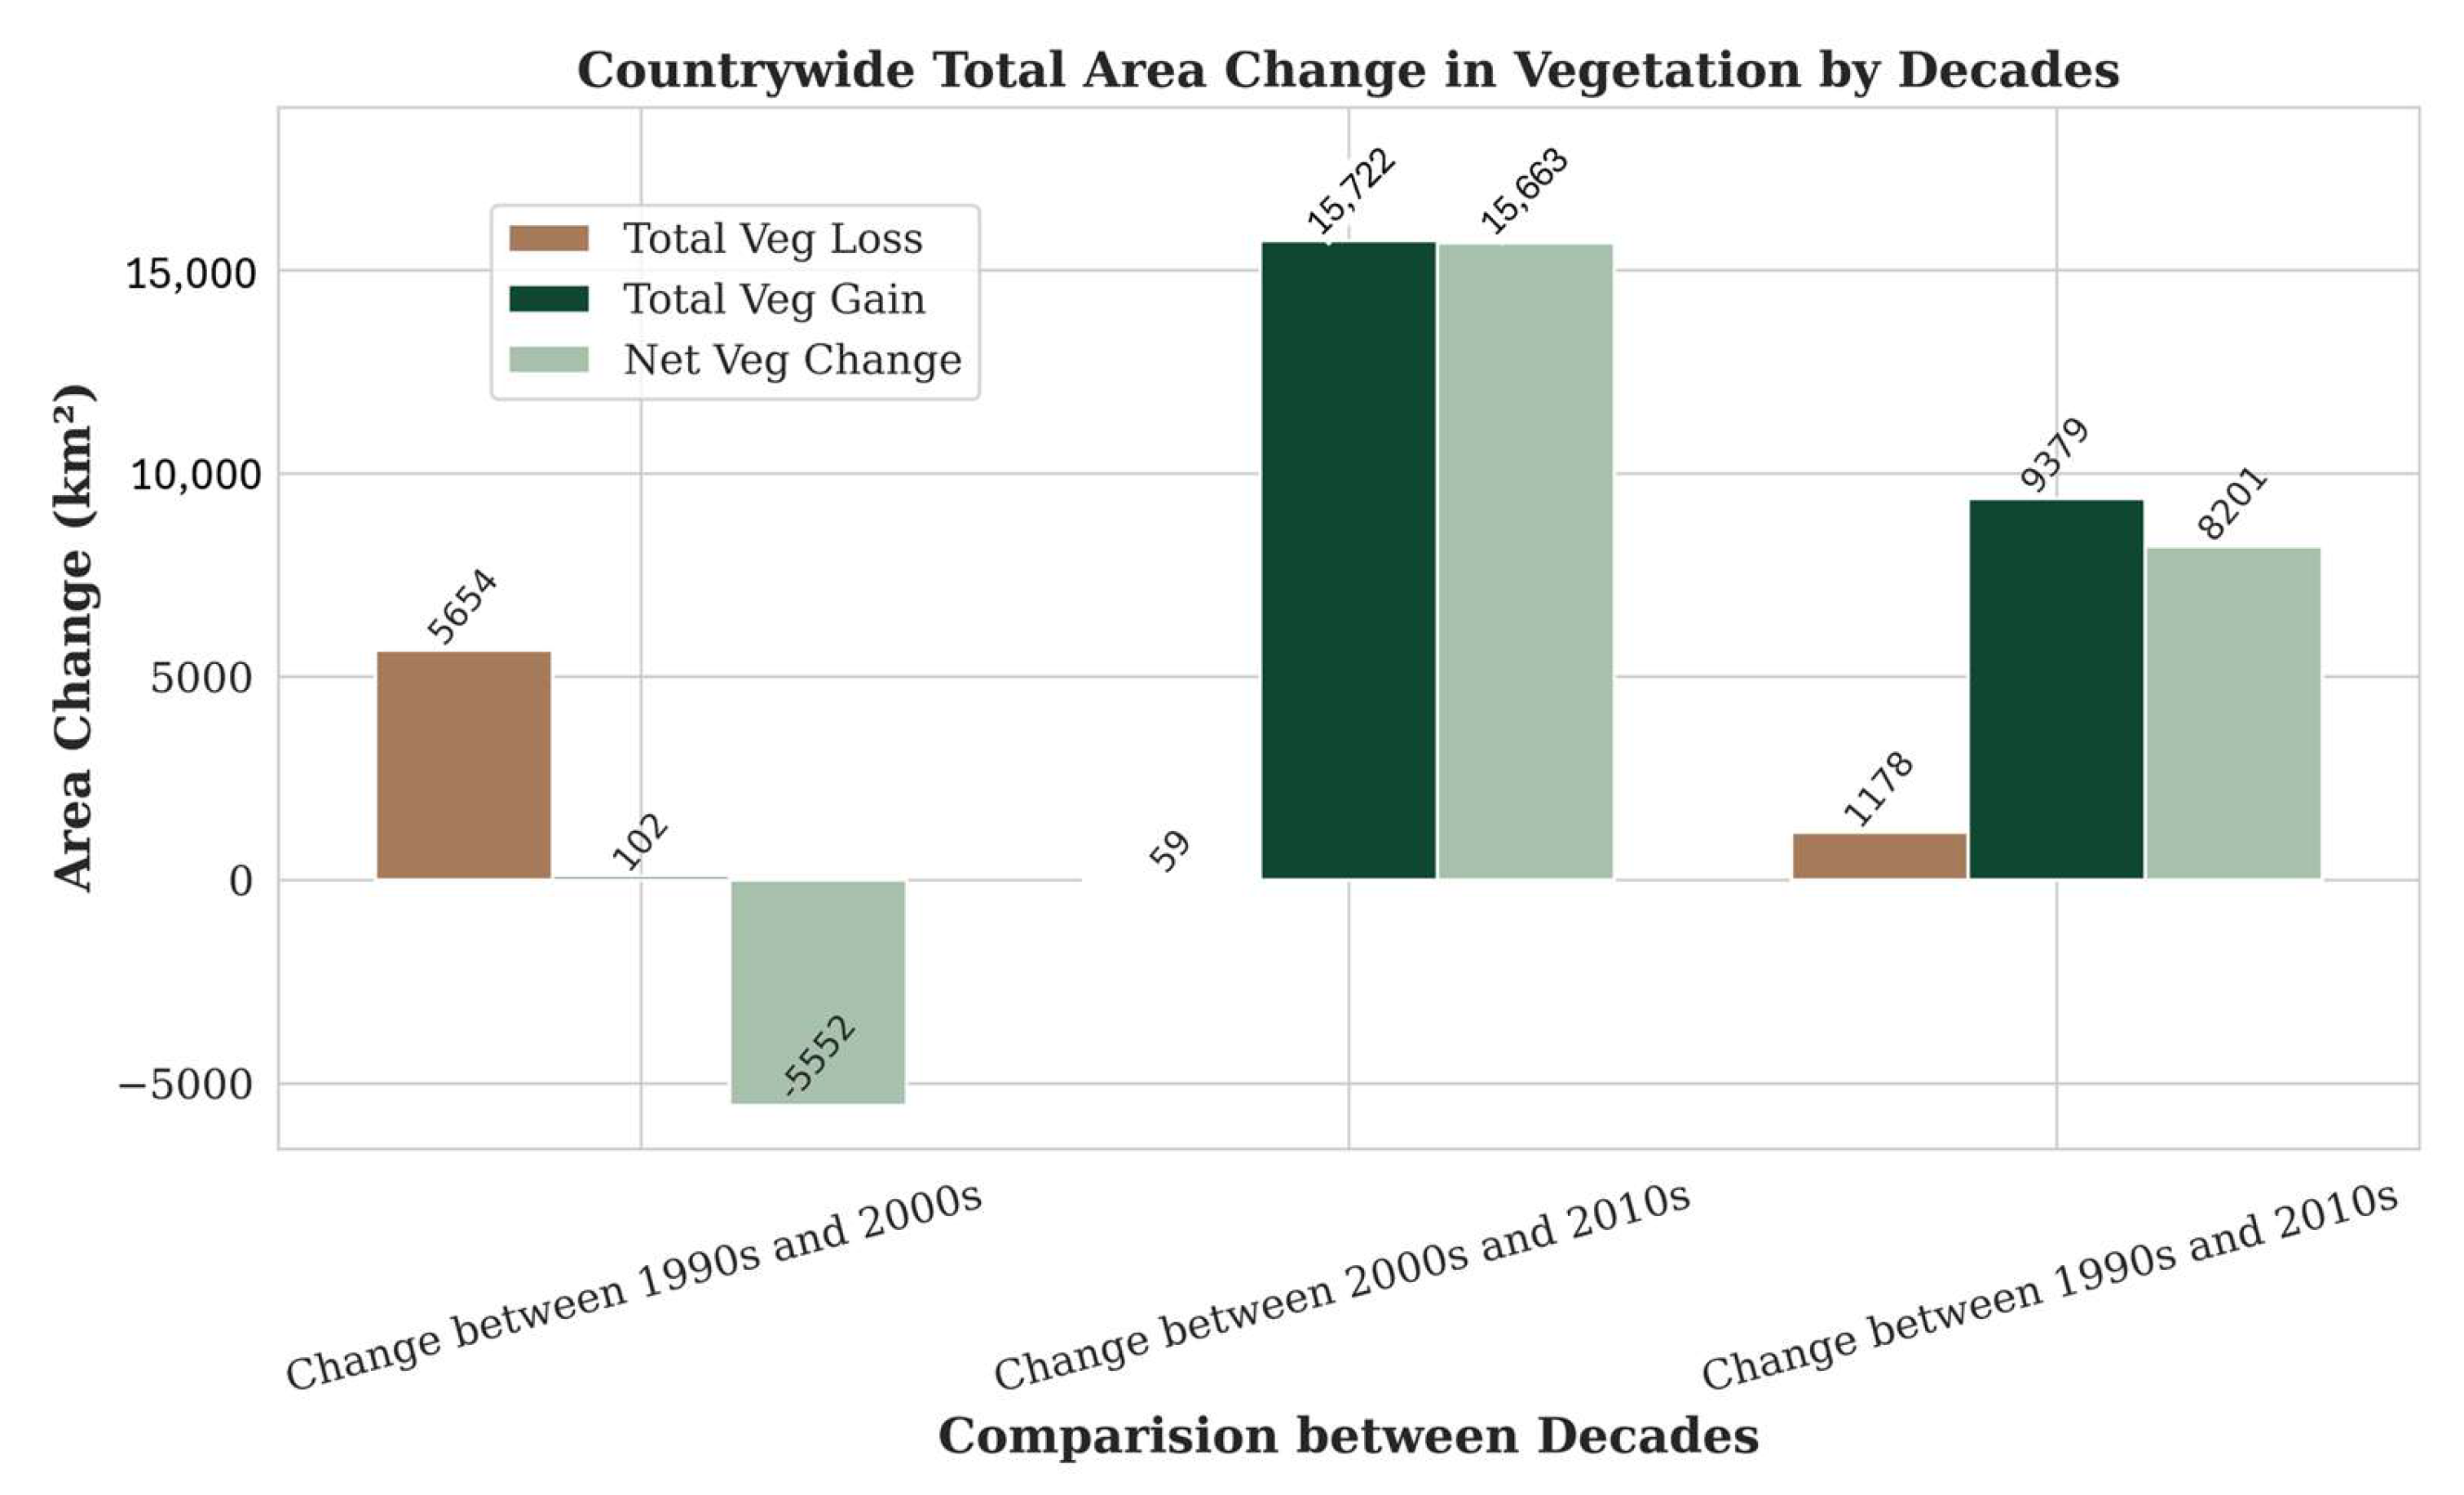
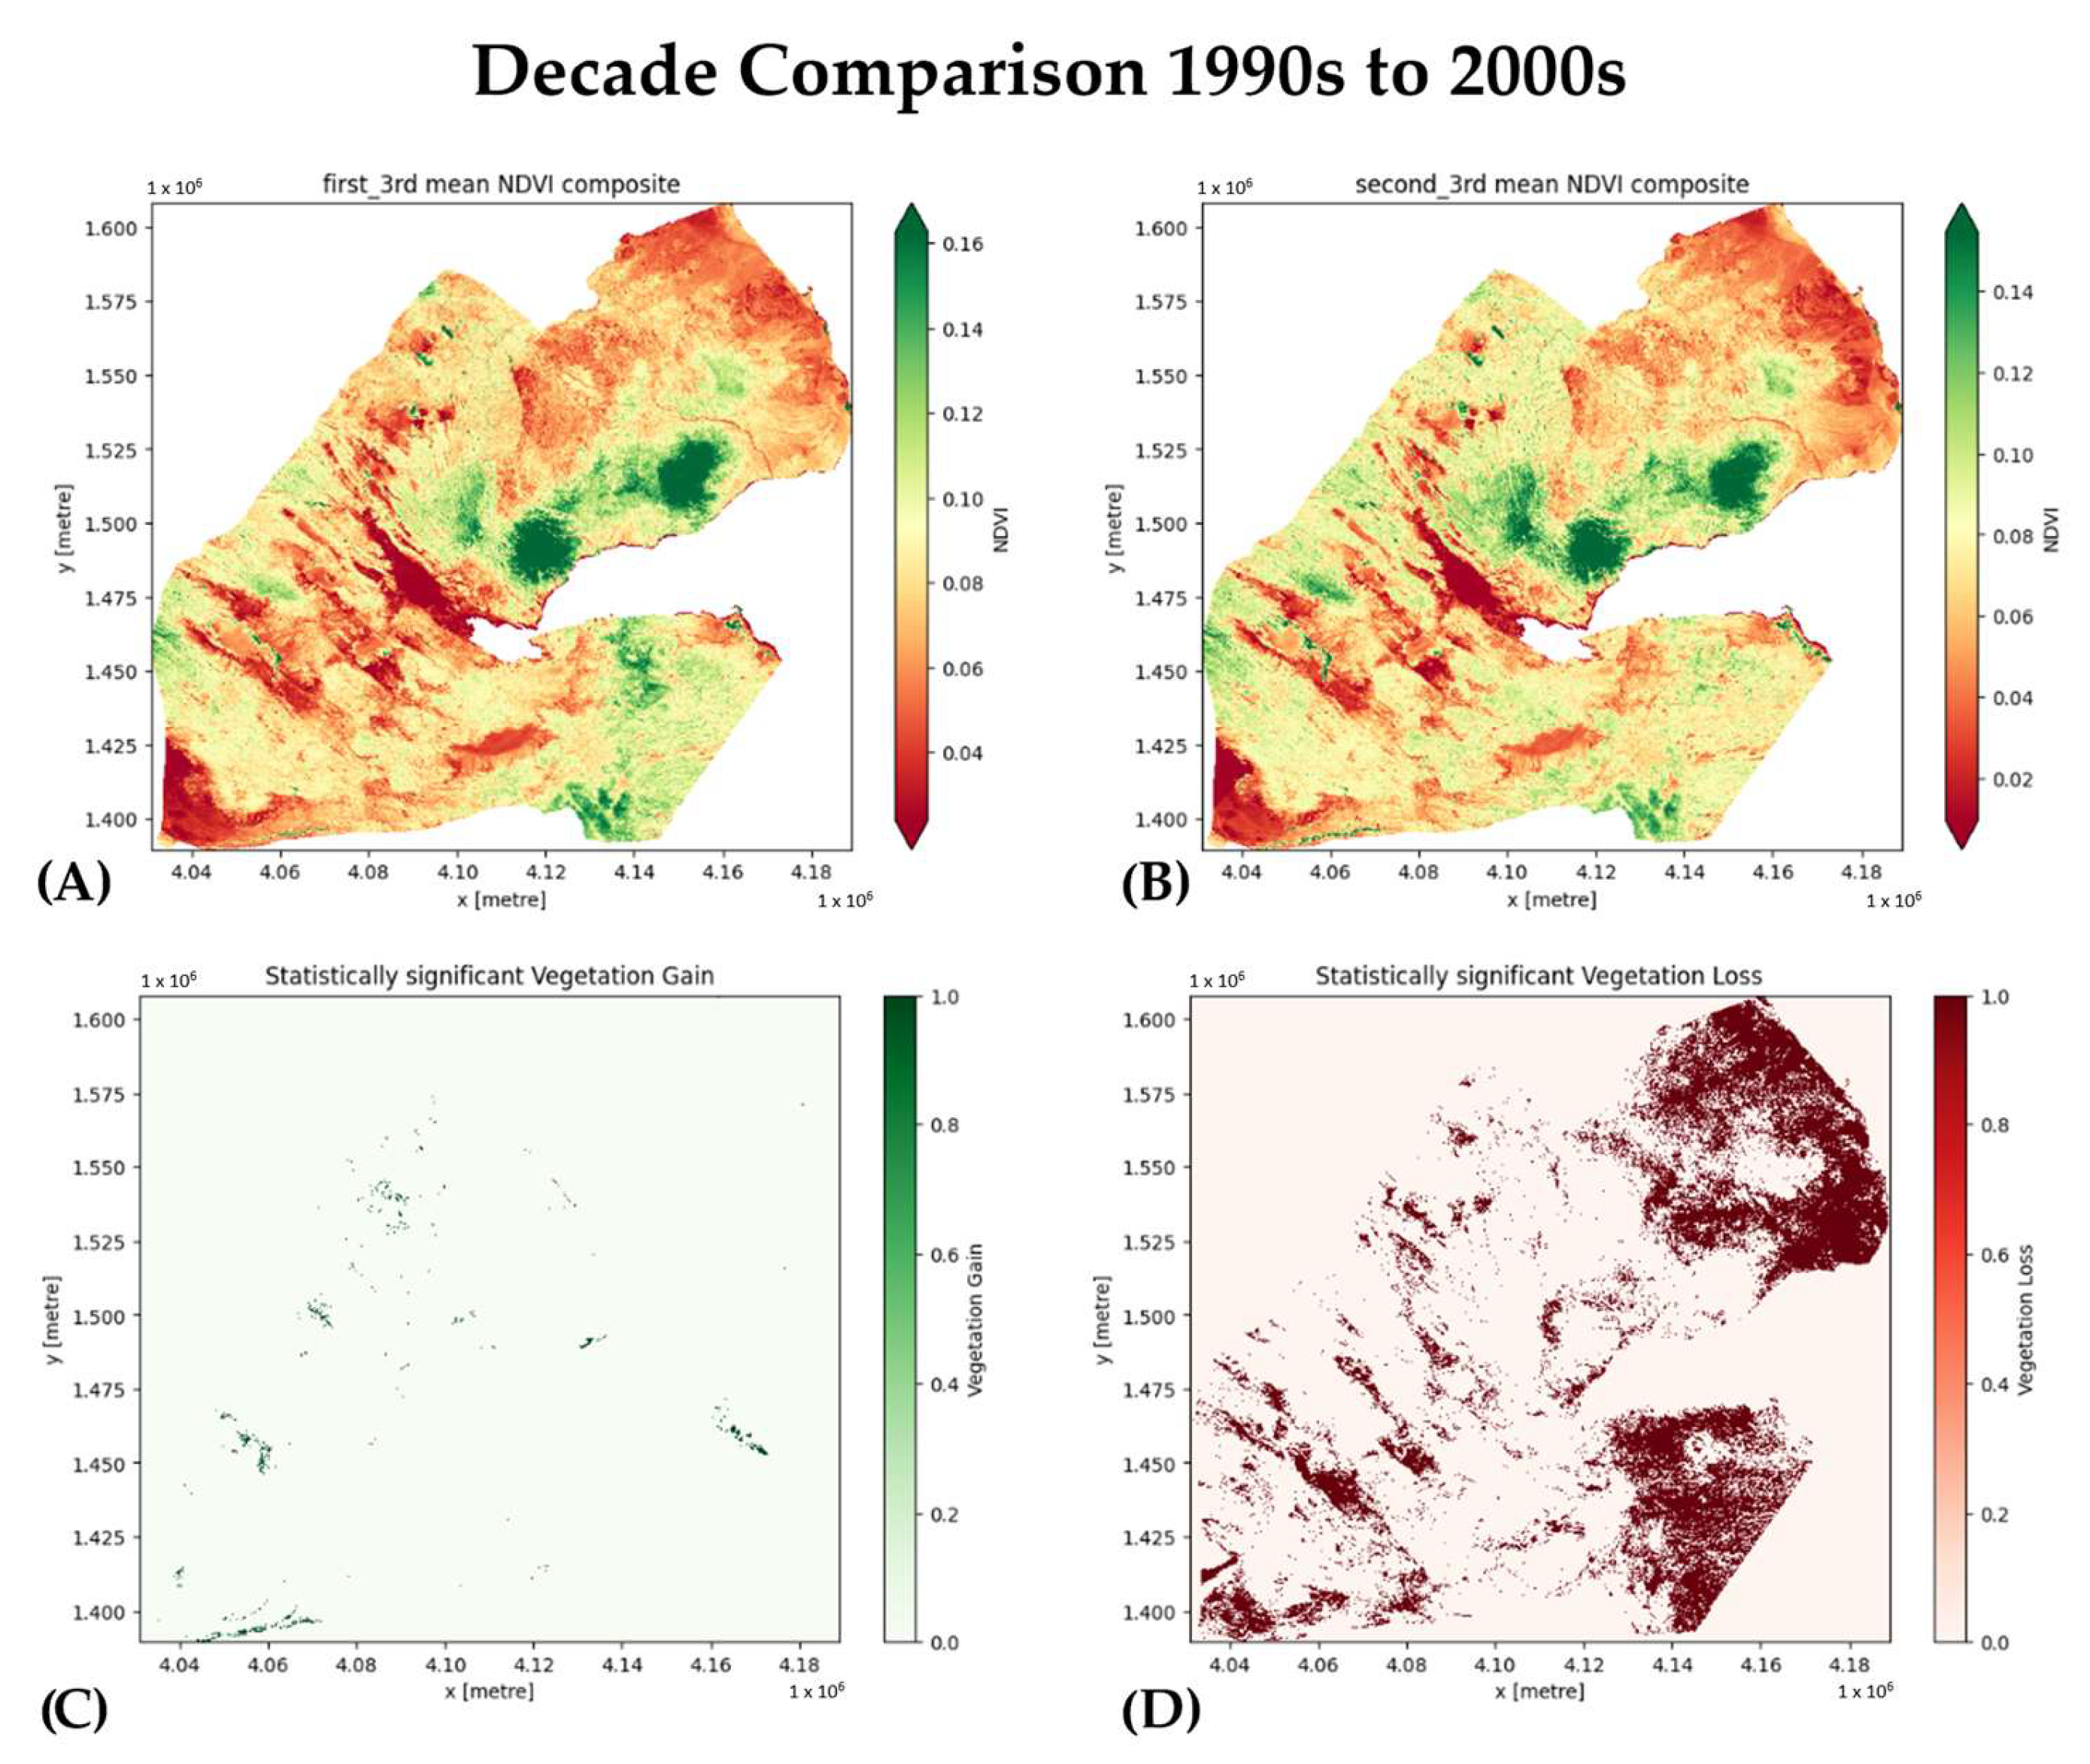
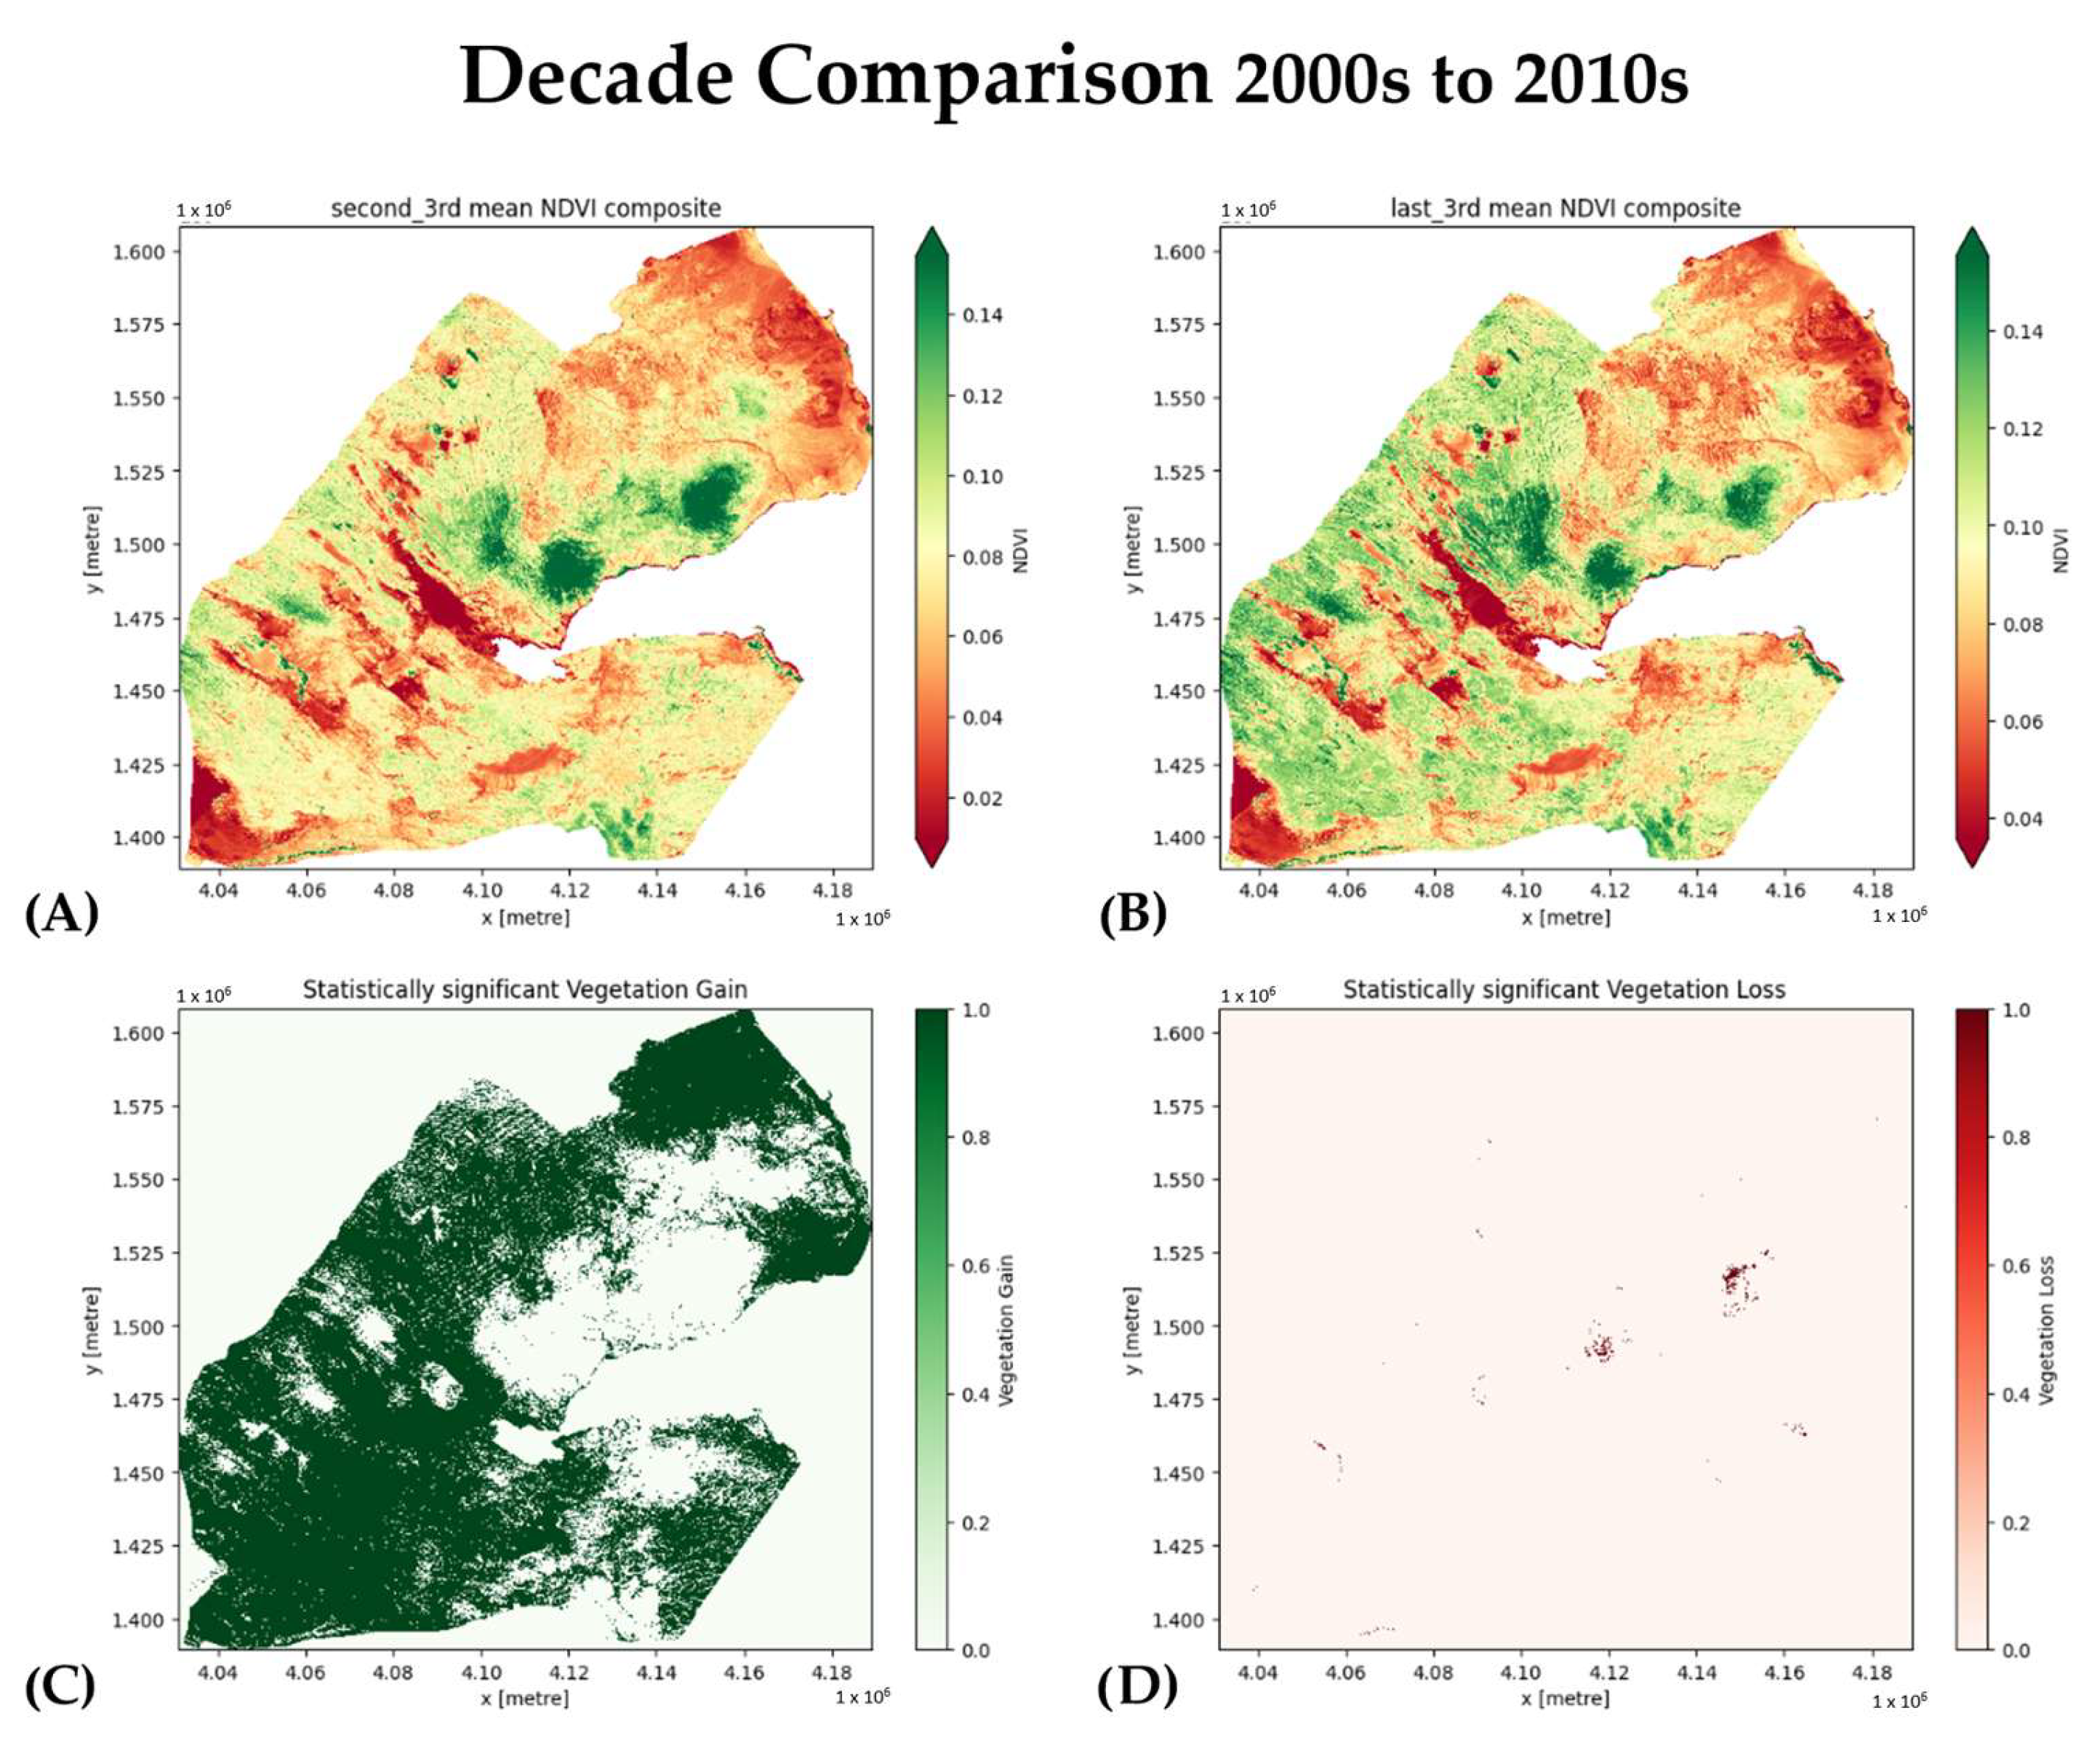
The Djibouti-wide, 120 m change detection results broken into the three decades (
Table 1) show even more notable trends. Comparing the 1990s decade to the 2000s decade, there was only a slight increase in vegetation, amounting to a gain of 0.47% (
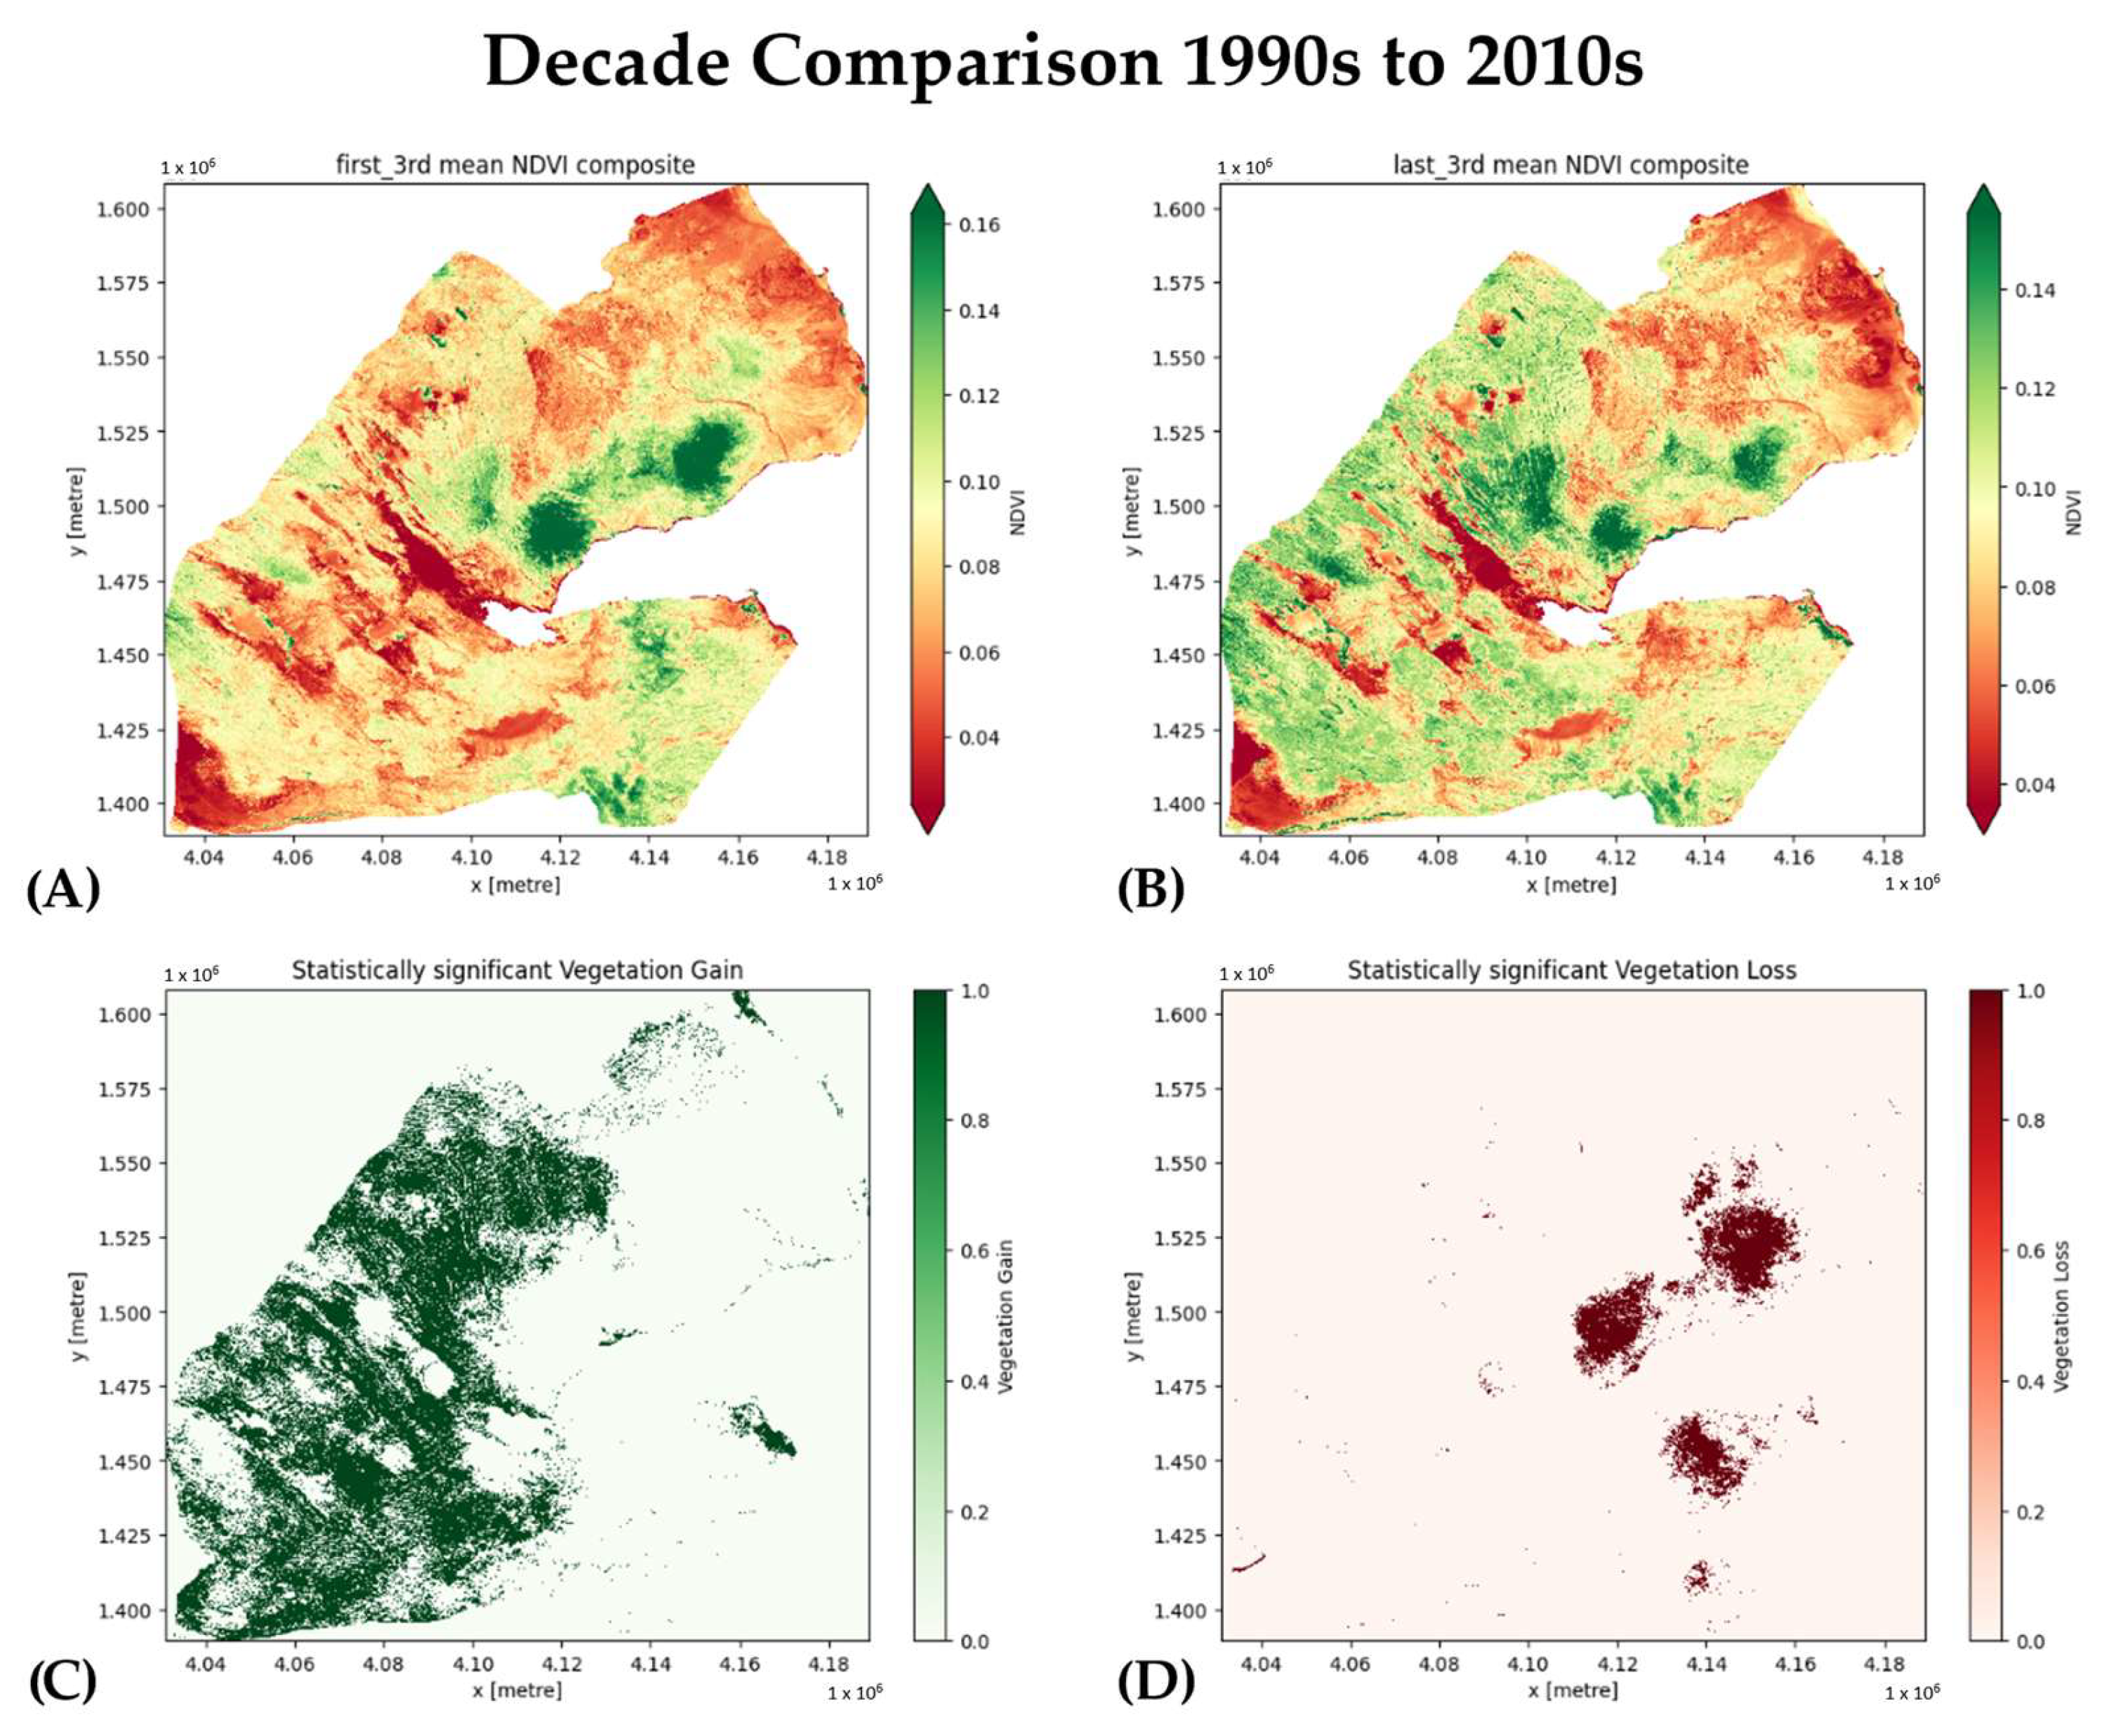
Figure 5). However, this period also witnessed a substantial loss of 26.32% in vegetation. Shifting to the change between the 2000s to the 2010s, there was a remarkable surge in vegetation, with a gain of 67.38%. Conversely, the loss of vegetation was minimal, at 0.24%. Finally, when comparing the 1990s decade to the final 2010s decade, there was a notable gain of 33.75% in vegetation with only 5.43% vegetative loss.
Looking at just the small SE Djibouti Study Area (
Figure 3), the numeric output of Welch’s
t-test is essentially the same for both the 120 m resolution data cube and the 30 m resolution data cube. The 120 m vegetative gain is 3.81% and vegetative loss is 2.44%, while the 30 m resolution
t-test results are only slightly higher with the vegetative gain at 3.90% and vegetative loss at 2.94% (
Table 2). These results are in line with a visual comparison of the raster results (
Figure 6 and
Figure 7).
A visual inspection comparing the 120 m baseline and post-baseline NDVI composites (
Figure 6A and
6B, respectively), and the 120 m Welch’s
t-test results showing vegetative gain (
Figure 6C) and vegetative loss (
Figure 6D) to the 30 m resolution results (
Figure 7A–D, respectively) appear nearly identical.
These results are encouraging because their similarity supports using the lower-resolution imagery countrywide throughout the rest of the study with reliable results. Having trustworthy results with the lower resolution allows for more rapid analysis and the option to run and rerun analysis quickly and not require excessive processing resources.
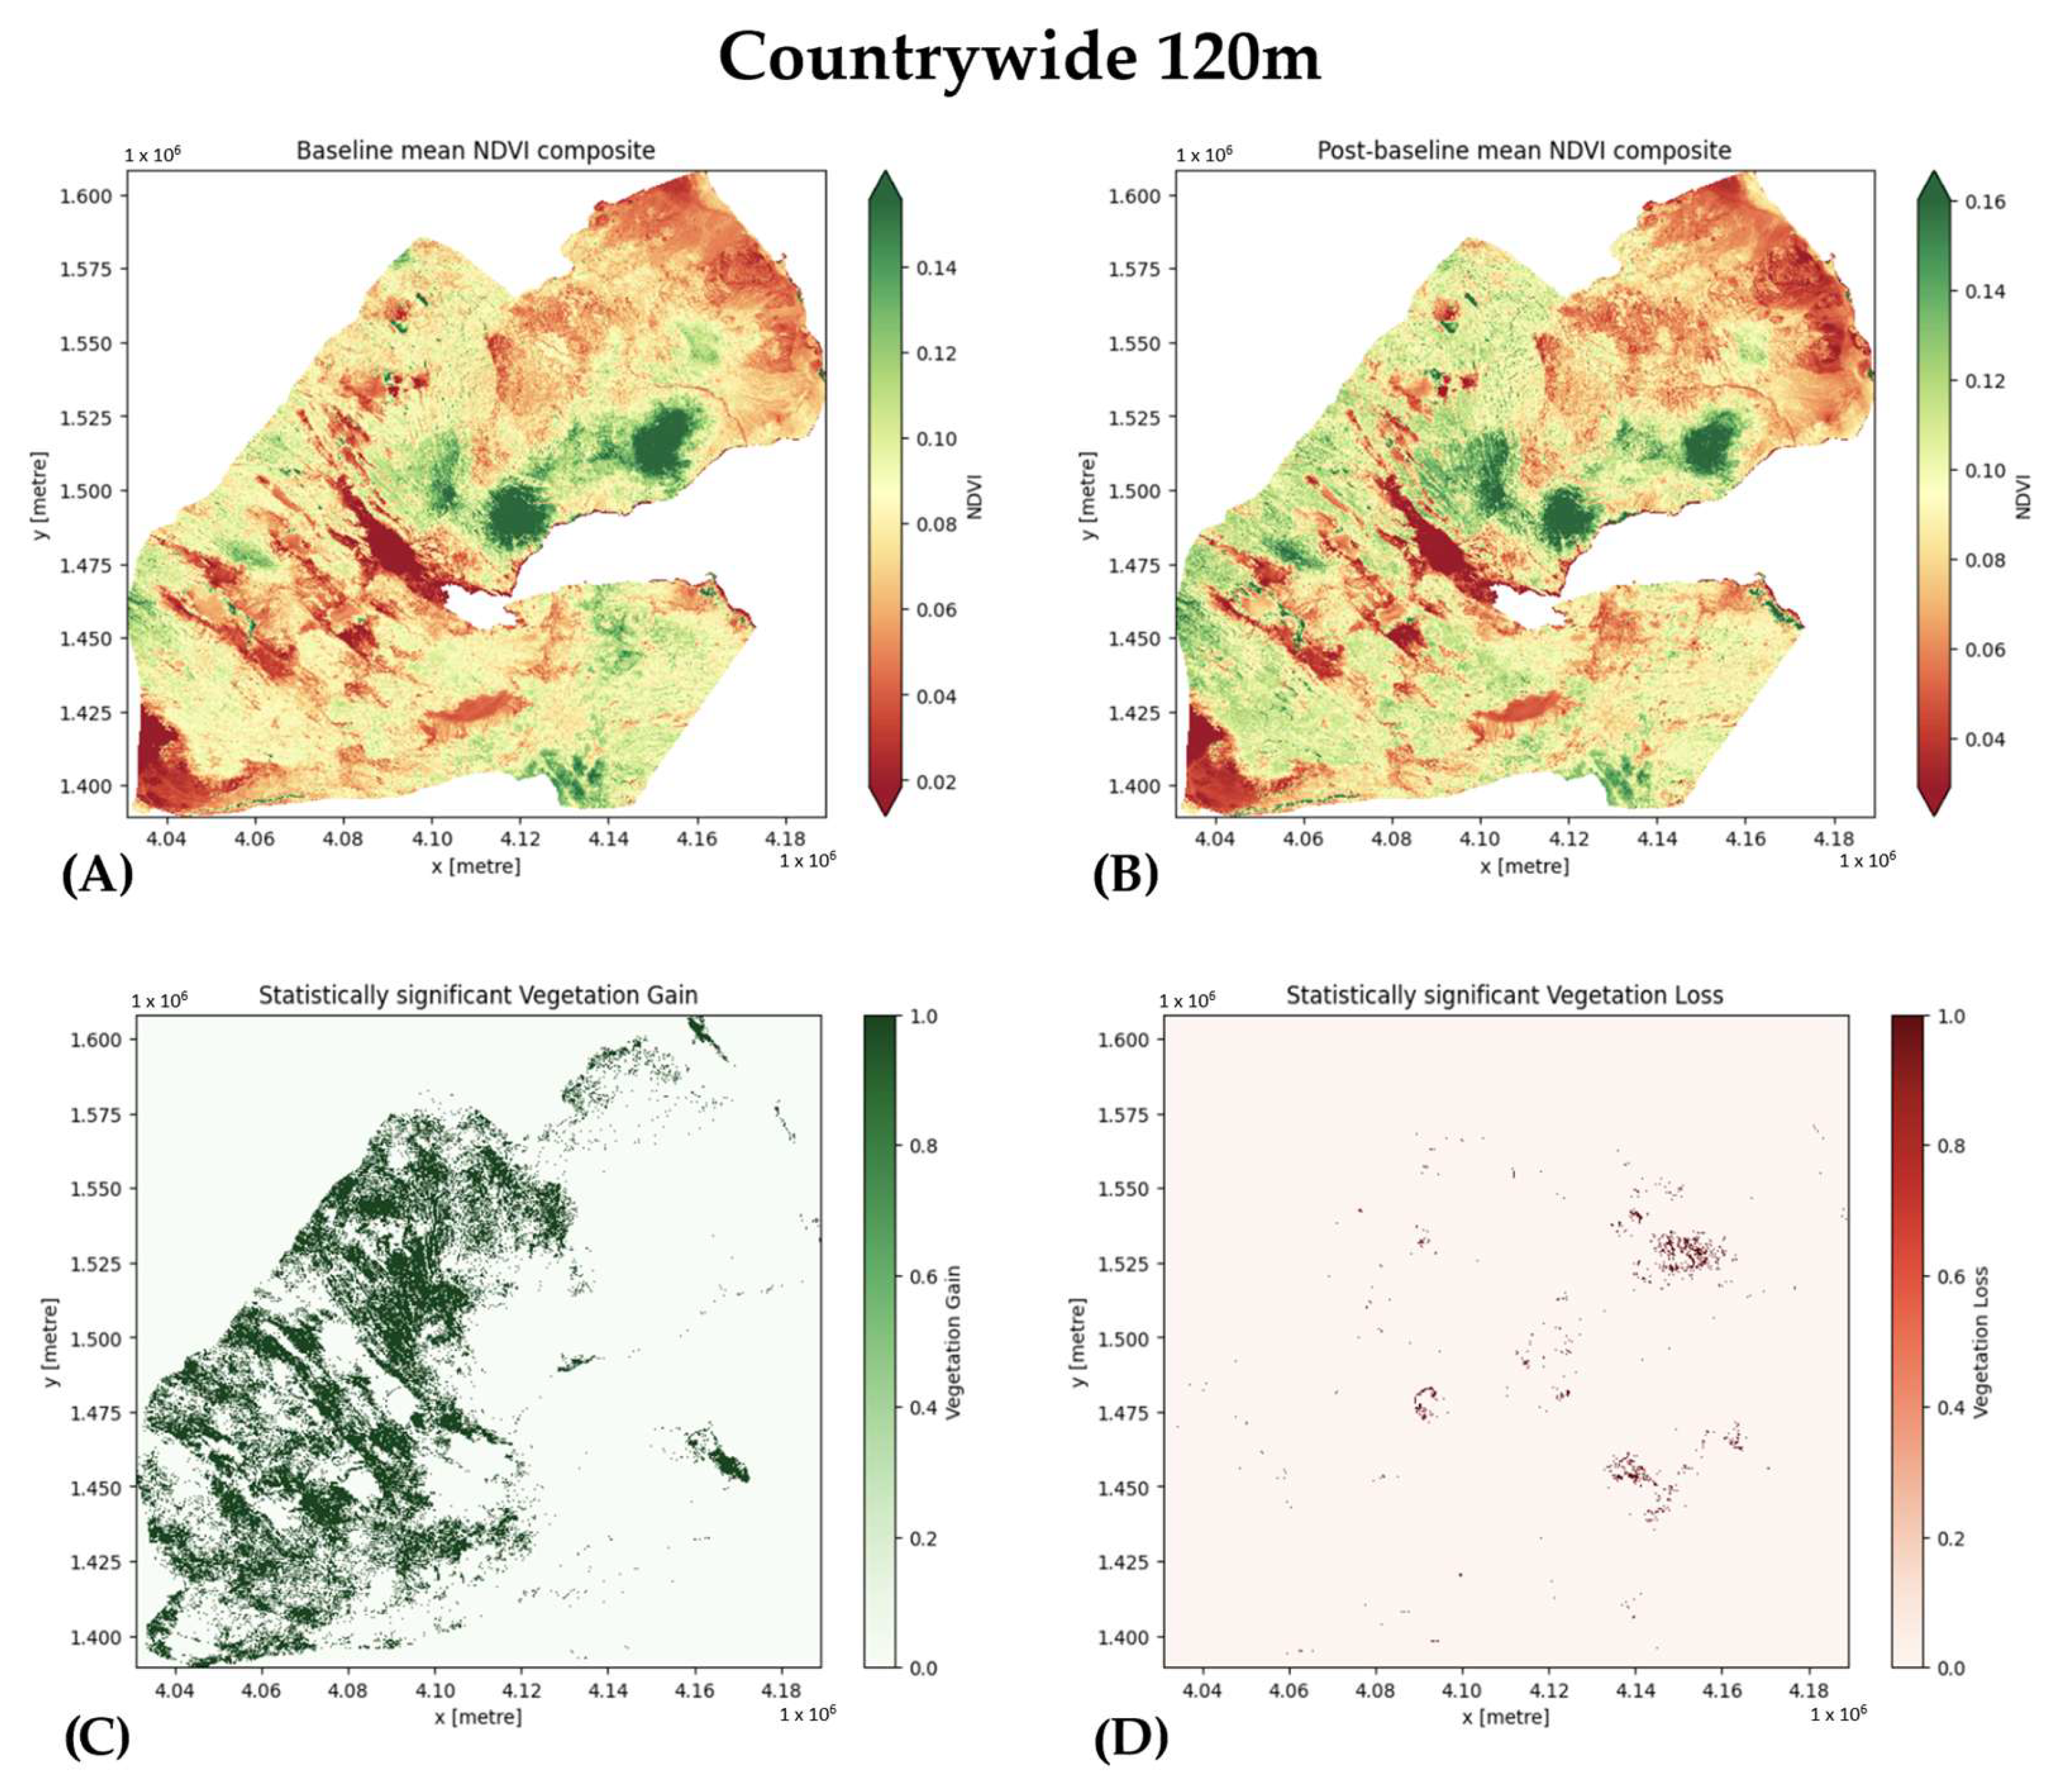
Once confident with the SE Djibouti Study Area results, we moved the focus to countrywide analysis. The B/pB analysis shows that at the 120 m resolution on a countrywide scale, Welch’s
t-test reveals an overall gain of 25.18% in vegetation across the 30 years, with a minimal loss of 0.70% (
Table 1). Visual inspection of the NDVI baseline composite (
Figure 8A), post-baseline composite (
Figure 8B), and the gains (
Figure 8C) and losses
Figure 8D) from Welch’s
t-test suggests a somewhat surprising positive trend in the country’s green cover.
These unexpected results (
Figure 8) warranted a deeper look at significant weather events throughout the study period [
24,
26,
27,
28,
29,
45,
46,
47,
48,
49]. After reviewing the significant 2019 flooding [
26,
28,
29,
48,
49], we reran the analysis with the 2019 flooding event (and the resulting vegetative rebound in 2020) removed. The results still showed a positive trend, though more modest, with 6.03% of the country undergoing vegetative gain and 1.56% seeing vegetative loss.
Zooming into the individual administrative regions (
Figure 3), the results vary (
Figure 4), highlighting the nuanced nature of the microclimate in Djibouti. For example, the TADJOURAH region’s remarkable gain of 34.58% with minimal loss (
Table 1) and the DJIBOUTI region’s smaller gain of 8.42% and comparatively higher loss of 4.40% (
Table 1) indicate unique microclimate and geographical variations that allow for sustained vegetation growth in the western and southwestern regions of the country. The regional results supported Dabar et al.’s findings [
29] that the eastern coastal region was most affected by the increased drought incidence while the western regions had a positive trend in their Standard Precipitation Index from 1981 to 2021, probably due to the dominance of the June–September rains in the region [
29]. Understanding the regional variations is crucial for targeted conservation and land management strategies.
4.2. Decadal Results
The 120 m countrywide data broken into decades further reveal the temporal trends (
Table 1,
Figure 5). Notably, the transition from the 1990s to the 2000s witnessed a significant loss of 26.32%; however, comparing the 2000s to 2010s showed a remarkable surge in vegetation, with a gain of 67.38%, suggesting potential ecological recovery (
Table 1,
Figure 5). Visual inspection of the NDVI decade composites (
Figure 9A,B) and Welch’s
t-test results show significant vegetative loss from the first to second decade (
Figure 9C,D), but impressive vegetative recovery from the second to last decade of the study period (
Figure 10C,D). Of note, the third decade data cube does not include the 2019 flooding event or the 2020 resulting vegetation.
The cumulative change from the first to last decade (1990–1999 to 2010–2020) shows an overall gain of 39.18% (
Table 1). The visual inspection of the composites (
Figure 11A,B) and Welch’s
t-test gain (
Figure 11C) and loss (
Figure 11D) show an impressive recovery of vegetative cover, particularly in the western region of the country, again supporting the climatology reports of an increase in the Standard Precipitation Index in the western regions [
24,
25,
26,
28,
29,
45,
46,
48,
49]. These results emphasize the importance of considering long-term climate trends and the impact of significant weather events like the 2018 and 2019 wet events [
50,
51] on the data for a comprehensive understanding of vegetation dynamics in the region.
The study employed two approaches to a change detection algorithm, analyzing data cubes at different resolutions and breaking down countrywide data into decades. Results indicate distinct patterns of vegetation change, with notable gains and losses across various regions in Djibouti.
5. Discussion
The study’s results reveal intriguing patterns of vegetation change in Djibouti, shedding light on the dynamics within different regions and across decades. Two distinct approaches, using change detection algorithms to compare baseline (1990–2014 NDVI composite) to post-baseline (B/pB) data (2015–2020 NDVI composite) for the SE Djibouti Study Area, the five administrative regions, and countrywide scale, and then using the same algorithms to compare the change between the three decades (1990s, 2000s, 2010s) at the countrywide scale, provide a comprehensive understanding of the vegetative landscape during the period.
5.1. Baseline–Post-Baseline Analysis
The B/pB results for the SE Djibouti Study Area at both the low resolution (120 m) and higher resolution (30 m) (
Table 2) are nearly identical, leading the researchers to trust lower resolution results in the countrywide analysis at the 120 m resolution (
Table 1). The smaller SE Djibouti Study Area, while not fully representative of the entire country, is in line with previous studies [
52,
53], where a small, similar SE Djibouti Study Area is used for initial analysis and to represent visible cropland on satellite imagery [
52]. It was selected to exemplify the study results in raster format and highlight an agriculturally important region in the Djibouti District [
53]. The very minimal vegetative gain results from the B/pB change detection are possibly due to the urbanization of the most northeastern portion of the study area with the outskirts of the capitol, Djibouti City as well as the year-round maintenance of the agricultural region.
The B/pB results at both the countrywide and regional level show much greater variability than the SE Djibouti Study Area’s results. This is probably due to the drought events in 2006/7 and 2010/11 [
29] and flood events such as tropical cyclone Sagar in May 2018 [
50] affecting the under-cultivated areas, particularly in the western administrative regions of Dikhil and Tadjourah.
5.2. Decadal Analysis
The decadal analysis shows an interesting pattern of vegetative loss and then, significant rebounding gain. Initially, the 2000s decade (2000–2009) compared to the 1990s decade (1990–1999) (
Figure 5 and
Figure 9D) shows significant vegetative loss countrywide, probably due to the drought experienced in 2006/7 [
29]. However, the 2010s decade (2010–2020) recovers from that loss (
Figure 5 and
Figure 11C), possibly due to the 2018 and 2019 flood events [
50].
A similar study investigates extreme agricultural drought in the Horn of Africa using satellite remote sensing data [
51]. Utilizing Moderate Resolution Imaging Spectrometer (MODIS) and Tropical Rainfall Measuring Mission (TRMM) instruments, the research assesses vegetation health indices, precipitation trends, and the impacts of extreme drought events from 2000 to 2017. Results reveal severe vegetation stress and cropland deterioration, particularly during the 2015–2016 El Nino event, highlighting the vulnerability of the region to climate-induced food insecurity [
51]. This study shows the important role remote sensing plays by monitoring extreme agricultural drought in the Horn of Africa using satellite data, specifically from MODIS and TRMM instruments [
51]. The study assesses vegetation health indices and precipitation trends, emphasizing the vulnerability of the region to climate-induced food insecurity. These researchers study a seventeen-year period over the Horn of Africa, including Djibouti. Their study is in line with my study by showing the region’s vulnerability to drought and the resulting vegetative stress but does not show data from more recent years where vegetative health rebounded due to the 2018 and 2019 wet events [
50,
51].
5.3. Climate and Vegetative Trends in the Region
Other work analyzed NDVI variations in the Horn of Africa (1982–2013) in response to climate change [
54]. The researchers established a correlation between NDVI and climatic factors, emphasizing the impact of precipitation decrease and temperature increase. Their research identified sensitive vegetation types and highlights land degradation issues like deforestation and desertification, contributing valuable insights to environmental management [
54].
Another study focuses on East Africa’s vulnerability to drought-induced famine due to the heavy reliance on rain-fed agriculture [
55]. It addresses the inadequacy of in situ rainfall data in the region and employs remote sensing, reanalysis, and land surface models to characterize droughts between 1983 and 2013. Results highlight the suitability of specific remote sensing products (CHIRPS, GPCC, FLDAS, and VCI) for agricultural drought monitoring, emphasizing their importance in gauge data-deficient regions [
55].
These researchers analyzed a 20 year period (1983–2013) and included the East African countries of Kenya, Uganda, Tanzania, Rwanda, and Burundi, but did not include any Horn of Africa countries, particularly Djibouti [
55]. While using change detection, they focused on Principal Component Analysis (PCA) rather than NDVI difference for their algorithm [
55]. However, their findings are important for gauge data deficient regions as they provide remote sensing alternatives for monitoring agricultural drought when in situ data are scarce.
While the studies [
51,
54,
55] have similar time periods, similar regions, and similar findings as this study, none take advantage of data cube and cloud server technology to enable the average researcher rapid analysis of very large remote sensing datasets despite not having advanced processing resources at their disposal.
In prior work, NDVI data are used to provide insights into the timing and patterns of the El Niño-Southern Oscillation (ENSO) signal in Africa over the last three decades [
56]. The researchers identify correlations between NDVI and ENSO, highlighting negative correlations over the Sahel, Gulf of Guinea, and regions from Northern Democratic Republic of Congo to Ethiopia during certain months. They demonstrate the impact of ENSO on vegetation dynamics, encompassing rainfall, solar radiation, and temperature [
56].
Other work employs satellite remote sensing data, including MODIS and TRMM instruments, to monitor extreme agricultural drought in the Horn of Africa (HOA) from 2000 to 2017 [
51]. The research assesses vegetation health indices, precipitation trends, and the impacts of extreme drought events, revealing severe vegetation stress and cropland deterioration. It emphasizes the significant decrease in precipitation over major crop growth seasons, particularly during the 2015–2016 El Niño event, contributing to food insecurity in the region [
51].
Other research analyzes the length of the growing period (LGP) in Africa based on 30 years of NDVI time series, using the GIMMS NDVI3g dataset [
57]. Employing a variable threshold method, the research provides reliable LGP estimates, mapping bimodality for wet seasons in the Horn of Africa. The analysis identifies high LGP variability in arid and semi-arid areas, indicative of crop failure risk, and reveals trends in LGP for different regions, providing valuable information for farming systems and assessing climate variability effects [
57].
Another study explores the impacts of two mechanisms on precipitation in the Greater Horn of Africa (GHA) during Northern-Hemisphere summer [
58]. It identifies surface-pressure gradients influencing GHA precipitation and emphasizes the increasing influence of the Southern tropical Indian Ocean (STIO) region on precipitation variability post-1980s [
58]. The warming of the STIO region is linked to decreased moisture transports from the Congo Basin, impacting local convection and precipitation in the GHA. The study suggests a negative trend in GHA precipitation influenced by Indian Ocean warming and expects this trend to continue due to climate change [
58].
The research findings indicate a region that, while sensitive to drought and flooding, has a unique microclimate influence with a stabilizing influence on vegetative health. Future research could include satellite imagery from more recent years and include overlaying weather event data, geographical datasets, and microclimate influences, possibly pulling in situ data from locally maintained weather stations across the country. While countrywide datasets over 30 years are a large amount of data, they are well-handled in the Open Data Cube environment. The significant processing power of the cloud-base server and parallel processing options open the possibility of analyzing much larger time periods of data in the future since the region is regularly collected by numerous satellite systems including both NASA and the European Space Agency.
6. Conclusions
This study determined that, after showing sharp decline from the 1990s decade to the 2000s decade, Djibouti’s vegetation health improved significantly by the end of the 2010s decade (that is 2020). The purpose was to determine trends in vegetation cover in Djibouti over a thirty-year period (1990–2020) using NDVI change detection algorithms (between baseline and post-baseline composites and between decade-wide composites), and Statistical Analysis (Unequal Variances t-test aka “Welch’s t-test”). We presented a null hypothesis of no trend in vegetation changes between 1990 and 2020. The alternate hypothesis was a significant trend, noted by Welch’s t-test. The study results disproved the null hypothesis and proved the alternate hypothesis, as the analysis showed significant trends in all the study regions in Djibouti, at all resolutions.
The recovery from the initial vegetative decline in Djibouti during the past three decades, as evidenced by the improvements observed in the 2010s decade, carries profound ecological implications. Beyond the statistical analyses and trend assessments, these findings underscore the intricate interplay between environmental factors and vegetation dynamics within a seemingly fragile ecosystem. The resurgence of vegetative health not only signifies surprising resilience but also hints at broader climate nuances in a uniquely challenged region.
The improvements likely stem from a complex interplay of factors, including climate variability, weather trends in the Gulf of Aden, land management practices, and perhaps even subtle shifts in socio-economic dynamics. Appreciating the intricacy of these underlying mechanisms is important for policymakers, land managers, and conservationists concerned with Djibouti and its long-term outlook. Understanding the spatial and temporal patterns of vegetation change can inform strategies for sustainable land use, conservation efforts, climate change adaptation, and conservation strategies in similar regions worldwide. Additionally, identifying regions with consistent gains or losses provides valuable insights into the factors influencing vegetation dynamics, allowing for targeted interventions to support ecological balance, environmental sustainability, and resilience in Djibouti and other arid regions.
The methods employed in this study, including NDVI-based change detection algorithms, Open Data Cube technology, and statistical analyses like Welch’s t-test, can be effectively transferred to other regions with arid and semi-arid ecosystems facing similar environmental challenges. These tools offer scalable, data-driven approaches for monitoring vegetation dynamics and identifying trends over time, enabling researchers and policymakers to assess the impacts of climate variability, land management practices, and socio-economic factors on vegetation health. By adapting these methods to local conditions, stakeholders in other regions can gain actionable insights to inform sustainable land management, conservation efforts, and climate change adaptation strategies tailored to their specific ecological and socio-environmental contexts.
Future research will focus on identifying and analyzing the factors driving the spatial and temporal differences in vegetation NDVI across Djibouti. A deeper investigation of climatic variables, land use practices, socio-economic dynamics, and environmental factors will afford a deeper understanding of the mechanisms influencing vegetation patterns. This expanded analysis will enhance the reference value for vegetation management by providing prospective for researchers to outline strategies for sustainable land use, ecosystem conservation, and climate change adaptation.
This study provides significant theoretical value by advancing the understanding of vegetation dynamics in arid ecosystems, highlighting the resilience of Djibouti’s vegetation to climatic and socio-environmental changes over three decades. Its application value lies in providing policymakers, conservationists, and land managers with actionable insights into vegetation trends and effective tools, such as Open Data Cube and NDVI-based analysis, to guide sustainable land management, climate change adaptation, and targeted conservation strategies in Djibouti and similar arid regions.


