Abstract
Tropical forests are essential ecosystems recognized for their carbon sequestration and biodiversity benefits. As the world undergoes a simultaneous data revolution and climate crisis, accurate data on the world’s forests are increasingly important. Completely novel in approach, this study proposes a methodology encompassing two bespoke deep learning models: (1) a single encoder, double decoder (SEDD) model to generate a species segmentation map, regularized by a distance map in training, and (2) an XGBoost model that estimates the diameter at breast height (DBH) based on tree species and crown measurements. These models operate sequentially: RGB images from the ReforesTree dataset undergo preprocessing before species identification, followed by tree crown detection using a fine-tuned DeepForest model. Post-processing applies the XGBoost model and custom allometric equations alongside standard carbon accounting formulas to generate final sequestration estimates. Unlike previous approaches that treat individual tree identification as an isolated task, this study directly integrates species-level identification into carbon accounting. Moreover, unlike traditional carbon estimation methods that rely on regional estimations via satellite imagery, this study leverages high-resolution, drone-captured RGB imagery, offering improved accuracy without sacrificing accessibility for resource-constrained regions. The model correctly identifies 67% of trees in the dataset, with accuracy rising to 84% for the two most common species. In terms of carbon accounting, this study achieves a relative error of just 2% compared to ground-truth carbon sequestration potential across the test set.
1. Introduction
Comprising the largest proportion of the world’s forests, tropical forests play a crucial role as a carbon sink. Carbon is stored in forests via vegetation, soil, and litter [1], and over 70% of the global, vegetation-based carbon storage can be attributed to forests. Thirty-six percent is attributed to tropical forests specifically [2]. However, deforestation, wildfires, and extreme weather threaten forests’ future. Between 2010 and 2020, 4.7 million ha of forest land was lost per year, equating to a loss over the 10-year period that is approximately equivalent to the whole of Kenya [3]. This is particularly concerning because forests are essential not only for carbon storage but also for protecting against soil erosion, regulating the water cycle, and supporting local economic systems. Forests also provide refuge for 80% of the world’s land-based biodiversity [4].
Accurate carbon storage metrics in forests are imperative to monitor forest health and ensure transparency in the voluntary carbon market. Forest-based carbon credits are often based on preventative deforestation, meaning a reliable carbon storage baseline helps calculate the number of credits issued. For most projects, the minimum baseline is the regional average carbon stock density for the forest type [5]. By aggregating by species and region, estimations are wrought with imprecision. Consider the Amazon rain forest, home to both Bertholletia excelsa, a large tree that can grow to heights of over 30 m with trunks of 1 to 2 m in diameter, as well as Euterpe precatoriam, a slender palm tree. These tree species are only two of many in the diverse ecosystem, and yet, current approaches are species agnostic, categorizing entire areas by the most common species. By treating each tree as part of a landmass rather than an individual tree, a systemic bias is introduced. Estimates are imprecise to begin and difficult to maintain once a credit is issued. Unless an entire region is impacted, the carbon estimation will not change. This creates a scenario in which smaller-scale events that affect carbon sequestration potential, such as selective logging or storm damage, remain undetected. Climate stressors, like prolonged droughts or temperature extremes, can also impact individual tree growth and survival. The inaccuracies from these approaches are not hypothetical. One study found that current forest carbon stock practices systematically overestimate the amount of storage, up to a value of USD 410 million in California alone [6].
One traditional approach to forest carbon accounting uses existing landcover datasets. For example, Spawn et al. [7] created a global biomass carbon density map at 300-m resolution by combining above- and below-ground biomass datasets. While this provided global coverage, it relied on generalized root-to-shoot ratios and landcover maps that struggle to capture complexity in mixed ecosystems and are expensive to update in real time. Santoro et al. [8] addressed some of these limitations by developing a global above-ground biomass map with a 1-hectare resolution using high-resolution radar and LiDAR data. Their approach improved spatial accuracy and leveraged field inventory data but encountered significant uncertainties in high-carbon stock forests, where radar retrievals became unreliable beyond 250 Mg ha⁻1 due to signal saturation.
Additionally, LiDAR is an expensive technology to deploy, and most afforestation and deforestation are happening in low- and middle-income countries, necessitating scalable and cost-efficient methods for calculating carbon storage. By using RGB aerial imagery, captured by affordable and continually deployable drones, issues with spatial resolution and costliness can be avoided. Developing methods using free or easily accessible images and technologies is an emerging focus in the field [9,10]. One such free and easily accessible technology is satellite imagery, which is provided without cost to the public through programs like MODIS [11]. However, with a resolution of 250 m, the granularity of these images is far from the 2 cm resolution this study employs, making individual tree crown detection impossible. Planet Labs achieves a more granular 50 cm resolution but requires a paid subscription, making it inaccessible for resource-constrained environments [12].
Existing approaches to carbon estimation often rely on these satellite-based methods. For example, Global Forest Watch employs LiDAR and regional allometric equations for global approximations [13], while Klein et al. use LiDAR data in urban forests [14]. There has been some recent work to combine the use of machine learning and satellite imagery. Yuan et al. [15] utilized Sentinel-2 imagery combined with a Long Short-Term Memory (LSTM) network to classify crop types based on vegetation indices. However, vegetation indices struggle to differentiate between vegetation types with similar spectral signatures, leading to classification errors, particularly in diverse ecosystems like tropical forests. Bartold and Kluczek [16] further explored machine learning in remote sensing by employing the XGBoost algorithm to map chlorophyll fluorescence in wetlands using Sentinel-2 satellite mosaics. Their model achieved a coefficient of determination of 0.71, but its accuracy depended on optimizing satellite overpass timing to match plant developmental stages. This limitation underscores the broader challenge of vegetation indices and spectral-based machine learning models; they often require extensive temporal calibration and can miss structural and biomass-related variations.
In the pure machine learning tradition, there is a strong body of research on individual tree crown (ITC) delineation, outlining the boundaries of individual tree crowns within a forest canopy, using RGB imagery. However, these approaches have not been applied to estimating carbon sequestration potential. Deep learning models, such as Faster R-CNN and Mask R-CNN, have shown promise. Braga et al. [17] uses an Instance Segmentation approach with Mask R-CNN in tropical forests while Wu et al. [18] focus on apple orchards using semantic segmentation and convex boundary extraction. Weinstein et al. [19] present DeepForest, a package specifically designed for ITC delineation on RGB images, while Lassalle et al. [20] show integrating deep learning models with advanced image processing techniques, such as watershed segmentation, can further enhance the accuracy of ITC delineation.
Similarly, research on tree species identification has extensively utilized deep learning, with advancements including 3D CNNs for hyperspectral images [21], SVM classifiers for specific ecosystems [9], and the integration of LiDAR data with multispectral imagery [10]. Most applicable to this study are recent studies that use RGB imagery to simultaneously identify species and generate a distance map as a regularizer. For instance, Martins et al. [22] demonstrated the use of CNNs in an urban setting for identifying individual tree crowns using high-resolution RGB imagery. Ferreira et al. [23] further applied deep learning models to detect individual trees and classify their species in UAV-RGB images, enabling large-scale forest monitoring.
While significant progress has been made in ITC delineation and species segmentation, this study, to the author’s knowledge, is the first to integrate these techniques for direct application in carbon accounting and does so using imagery that is high-resolution (2 cm), affordable, and easily deployable for monitoring purposes. This approach also emphasizes data accuracy and reliability, incorporating multiple validation steps to ensure the integrity of both species classification and biomass estimation. By comparing model outputs with field-collected data, we account for potential systematic errors in tree detection and allometric modeling, improving confidence in per-tree carbon estimates. Additionally, the method ensures consistent processing workflows, helping to standardize results across different datasets and facilitating broader applicability in forest monitoring efforts.
2. Materials and Methods
2.1. Study Area and Ground Truth
This study used the ReforesTree dataset, prepared by Reierson et al. [24]. Reierson et al. provided this dataset to encourage the development of machine learning approaches in estimating carbon sequestration potential from RGB images, a challenge this study takes on. The dataset comprises RGB aerial images of six agroforestry carbon offsetting sites in the central coastal region of Ecuador. Each site is approximately 0.5 ha. The forests are dry tropical forest type. Drone images were captured in 2020 by an RGB camera from a Mavic 2 Pro drone with a resolution of 2 cm per pixel. Field measurements to establish a baseline ground truth were determined by hand. This study used the provided drone images and an associated Excel file comprising ground-truth data about diameter at breast height (DBH), aboveground biomass (AGB), bounding box shape and location, and tree species. This study did not employ Reierson et al.’s full preparation pipeline. Because the data were collected in Ecuador, species names are written in Spanish and will be referred to by their Spanish names throughout this paper. Table A1 in Appendix A provides a translation table.
2.2. Computational Resources
Most work was completed on a MacBook Air with an M1 Apple Chip with 16 GB of memory. For more memory-intensive tasks, such as training and evaluation of the SEDD model, the HX1 High-Performance Computing (HPC) cluster provided by Research Computing Services at Imperial College London was used. Designed for GPU-accelerated workflows, the cluster is equipped with NVIDIA A100 80 GB SXM GPUs. Implications of the computational resources required is discussed in Section 4.4 Limitations and Next Steps.
2.3. Methodological Sequence
The heart of this study’s novelty is its proposed methodological structure:
- I.
- Pre-processing;
- II.
- Individual tree-level species identification using bespoke SEDD model;
- III.
- ITC delineation using DeepForest [25];
- IV.
- XGBoost for prediction of DBH;
- V.
- GAN-based custom allometric equations for AGB prediction;
- VI.
- Estimation of carbon sequestration potential using accepted equations.
While other researchers have completed individual steps, such as ITC delineation and species identification, in this study, each step built upon the previous one. As such, we provided this brief overview of each for the reader to refer back to in comprehending the rest of the report and understanding the interconnectivities.
Since the SEDD model was specifically developed for this study, it formed the core of the following report. Steps III–VI collectively represent what will be referred to as post-processing.
2.4. Preprocessing
Inheriting orthomosaic images cut into 4000 × 4000 pixel tiles, this study implemented further image enhancements, considering methods for brightness and contrast adjustment, edge sharpening, and noise reduction. Specific enhancements were chosen based on combined impact on brightness, contrast, and edge intensity metrics relative to the baseline. Ultimately, Contrast Limited Adaptive Histogram Equalization (CLAHE) [26], Gamma Correction, and Laplacian Sharpening were applied. Figure A1 in Appendix A illustrates the applied image adjustments on an example image from the dataset. Some of the orthomosaic tiles were largely whitespace, a by-product of the Reierson cutting technique. Those tiles with greater than 80% whitespace, eight tiles in total, were excluded from the dataset. Table 1 shows the species breakdown of the filtered dataset. Figure A2 in Appendix A shows the species breakdown in the data before and after culling.

Table 1.
Species representation in filtered dataset.
2.5. SEDD Architecture
This work used a multi-task fully convolutional network known as a single encoder, double decoder (SEDD) model, inspired and developed after La Rosa et al. [27] and Martins et al. [22]. The architecture employed a shared backbone network, learning common representations for both tasks and then producing two outputs: a semantic segmentation map and a distance map (see Figure 1). Both were pixel-based. The former assigned a species classification to each pixel, while the latter indicated the distance of each pixel to the nearest tree crown boundary. In the encoding phase, the network learned a general representation, and in the decoder phase, the network was able to refine task-specific representations.

Figure 1.
SEDD model architecture.
2.5.1. Justification for SEDD Architecture
As this approach took inspiration primarily from La Rosa et al. [27] and Martins et al. [22], it also accepted their evidenced conclusions regarding the use of a double decoder architecture. Martins works in a highly diverse tropical urban setting, addressing the challenges posed by diversity species, while La Rosa maps dense forests, similar to the setting of this study. Both papers conclude the use of a double decoder serves as an effective regularizer, particularly crucial when dealing with a small number of ITC samples representing a variety of species. La Rosa’s research directly compares a single decoder to a double decoder architecture, demonstrating an improvement in accuracy across multiple metrics. For some species, accuracy improved by as much as 11%.
Neither paper uses the distance map as an output in and of itself, a tradition this paper will continue to follow, instead opting for the more well-recognized DeepForest model when generating distance maps for use in post-processing (see Section 2.7.1. DeepForest) [25]. Instead, the distance map is used as a regularlizer, influencing the backpropagation of loss in the training of the model, an effective tool in preventing overfitting (see Section 2.5.5. Loss Calculation).
2.5.2. Encoder
The shared encoder was based on ResNet18 [28], a popular deep convolutional neural network (DCNN). The use of ResNet18 was similarly inspired by La Rosa et al. [27]. As a lightweight architecture, it can be leveraged in resource-constrained settings for effective RGB image processing. Despite its simplicity, ResNet18 incorporates residual connections, which help in maintaining gradient flow and learning both low-level and high-level features effectively. This ensures sufficient feature extraction without overcomplicating the model.
A 7 × 7 convolution with stride 2 and a max pooling layer was initially applied to reduce dimensionality. Convolutional layers were then organized into four main sections, each with two 3 × 3 convolutional layers followed by batch normalization and ReLU activation. In this work, the ResNet18 model was initialized with pre-trained weights on ImageNet. Earlier layers were retained, while the deeper layers were fine-tuned on the current dataset with a lower learning rate.
2.5.3. Semantic Segmentation
For species map creation, the encoded output was fed into a DeepLabv3 decoder [29], an architecture known for excellence in semantic segmentation. Incorporating Atrous Spatial Pyramid Pooling (ASPP), a technique characterized by filters with rows or columns of zeros separating the learnable weights, allowed the network to maintain a large receptive field without increasing the number of parameters or sacrificing spatial resolution. The ASPP module in this implementation included parallel atrous convolutions with dilation rates of 12, 24, and 36. After passing through the ASPP module, the feature map went through 3 × 3 convolution, batch normalization, ReLU activation, and 1 × 1 convolution layers, outputting the class probabilities for each pixel in the image. The output was then passed through a softmax activation function to produce the final probability map, which passed to the loss function.
2.5.4. Distance Regression
Designed for efficiency, the distance map branch received the ResNet18 encoder output and passed it through a decoder composed of a 3 × 3 convolutional layer that reduced the input feature map’s dimensions, followed by a ReLU activation function and a dropout layer with a dropout rate of 0.65 to mitigate overfitting. This was followed by another 1 × 1 convolutional layer, which refined the feature map before applying a sigmoid activation function that output a continuous value between 0 and 1, representing the normalized distance for each pixel. This result was passed to the appropriate loss function, discussed in the following section.
2.5.5. Loss Calculation
This study dealt with an imbalanced dataset. Therefore, segmentation loss was calculated using a modified version of categorical focal loss called Partially Weighted Categorical Focal Loss [30]. This technique downweighs the contribution of well-represented species, favoring the learning impact of those difficult to classify species. This loss was backpropagated through the species branch exclusively and through the shared encoder in combination with the distance loss, serving as a regulator. The loss for the distance branch was calculated using mean squared error (MSE). By providing auxiliary spatial information, the distance map regularized by reinforcing boundary constraints and improving the segmentation branch’s ability to generalize. The distance loss was backpropagated through the distance branch and through the shared encoder in combination with the species loss. To calculate overall loss, species and distance losses were summed, propagating at a ratio of 1:1 into the shared encoder. This integration allowed the distance map to complement the species classification task, helping to stabilize learning and reduce overfitting by leveraging spatial structure.
2.6. Experimental Setup
The 4623 ITCs remaining after pre-processing filtration were split so that the training set had 3388 trees, the validation set had 660 trees, and the test set had 575 trees. So that the data were not made even sparser putting trees from a singular tile into different sets, they were split in a manner that kept all trees in an individual tile together. The SEDD model was trained using image patches of 224 × 224 pixels. Before the patches were cropped, dual species and distance maps were created, which were then cropped in coordination with the original images (see Figure 2). Cropping happened on the fly during each epoch, and transformations were applied, generating more learning images. Transformations for data augmentation included horizontal and vertical flips as well as rotations (90°, 180°, 270°). These transformations were also applied to the validation data. Dropout with a rate of 0.65 was used to prevent overfitting. The model was optimized using Stochastic Gradient Descent (SGD) with a momentum of 0.9, an initial learning rate of 0.01, and a weight decay of 1 × 10⁻⁴. The learning rate was scheduled to decay by a factor of 0.1 every 10 epochs to ensure a gradual reduction in step size as training progressed. The model was trained for 15 epochs. For evaluation, the test data were loaded at full size, 4000 × 4000 pixels (see Figure A3 in Appendix A). Then, a sliding window slid over the image, considering patches of the image one 224 × 224 window at a time (see Figure A4 in Appendix A). An overlap of 50% was used, with pixels in overlapping patches being averaged for more accurate outputs. At the end of the evaluation, the predicted species map, distance map, and probability map were saved for post-processing.
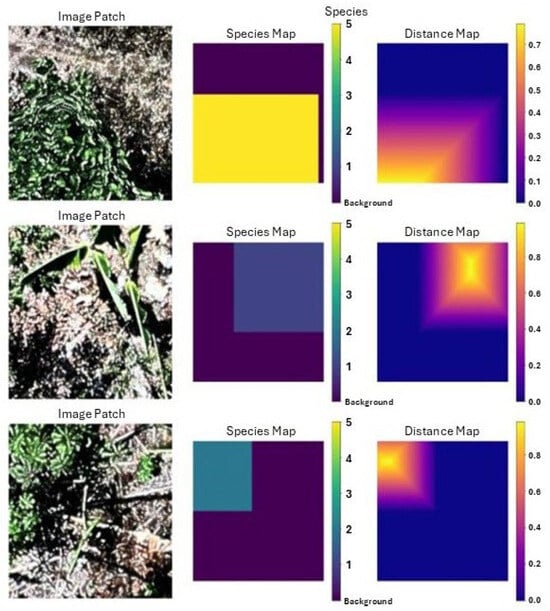
Figure 2.
Visualization of three image patches, processed with associated species and distance maps and ready for training in SEDD model.
2.7. Post-Processing
Post-processing procedures took species maps from the SEDD model and used them to generate carbon sequestration estimates for individual trees. As aforementioned, the distance map was designed to be used as a regularizer, not as an output in and of itself. Instead, for tree crown size information in the post-processing steps, the output from the SEDD model species branch was combined with DeepForest ITC bounding box predictions. Before this, filtering of low probability pixels was performed—removing pixels where the maximum probability for a given species was less than 20%.
2.7.1. DeepForest
DeepForest is a python package trained to detect ITCs in complex forest environments using RGB aerial images [19]. Built on a Faster R-CNN architecture, it has been trained on a variety of different forest types and geographies. In this study, the model was fine-tuned using the same ground-truth data as the SEDD model, with precautions taken to prevent data leakage. The SEDD model’s test set was saved into a CSV file, which was then loaded into the DeepForest training environment. This allowed for the removal of the test data from the base dataset before splitting it into standard training and validation sets (70% of data for training set and 30% for validation set).
In order for the output to be actionable in accounting carbon sequestration, tree crowns that aligned with the sparse ground-truth data had to be isolated from the overall bounding box predictions. DeepForest identifies all tree crowns in an image, but all trees in a given image were not ground-truthed in this dataset. If DeepForest bounding boxes were not aligned with ground-truth boxes, when moving to predict AGB, there would exist bounding boxes without associated ground-truth AGB data. If completing this process without ground-truth data, this step would be unnecessary, and all bounding box predictions could be used. In this study, however, the IoU was calculated for each predicted bounding box against the ground-truth data to isolate the most accurate predictions. Only those predictions with the highest IoU scores, indicating a strong match between the predicted and actual tree crown locations, were retained for further analysis. In Figure 3, the green boxes represent the true bounding boxes, and the blue boxes represent DeepForest predictions after IoU culling was performed.
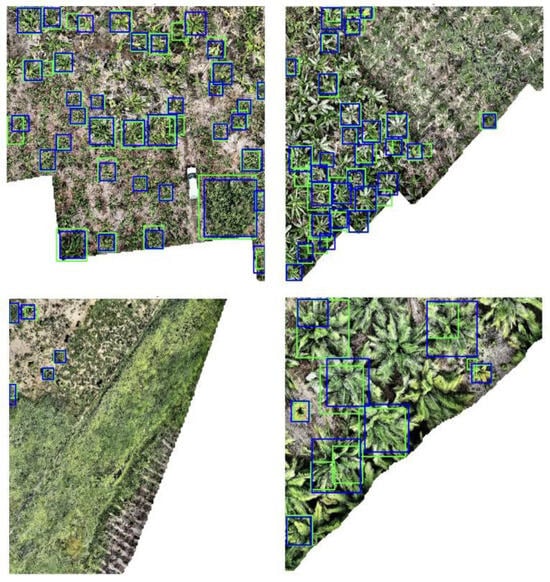
Figure 3.
Four test set images with ground-truth bounding boxes (green) and DeepForest-predicted bounding boxes (Blue).
2.7.2. Diameter Model
The primary challenge in using ITC delineation outputs for carbon accounting, as suggested by the theoretical applications of these technologies [20,31], lies in the reliance on traditional allometric equations—mathematical formulas developed in dendrology to estimate the biomass, volume, or other biological characteristics of trees—on DBH. Diameter at breast height is the measurement of a tree’s diameter at 1.37 m above ground. However, DBH is impossible to capture directly from aerial RGB images. While methods incorporating photogrammetry or LiDAR can generate point clouds, they primarily provide accurate height measurements from which DBH has to be inferred. With solutions for estimating DBH still in development, this challenge remains a significant obstacle to individual-level tree carbon accounting.
With this in mind, this study developed a DBH prediction model based solely on species and bounding box characteristics. From the bounding box dimensions, three additional metrics were calculated: bounding box area, measuring the total area of the box in pixels; bounding box diagonal, calculating the Euclidean distance between the opposite corners of the bounding box, providing an indication of the size and shape of the tree crown; and bounding box across, which is the larger dimension between the height and width of the bounding box, representing the maximum span of the tree crown. Additionally, the tree species was one hot encoded to be used numerically by the model. As with DeepForest fine-tuning, test data from SEDD model development were removed to prevent leakage. Outliers, trees with a diameter in the bottom or top 10% of the data, were removed. Additionally, there were some trees for which Reierson et al. [24] did not gather ground-truth data on DBH. For these, they populated the data frame with the average diameter for that species. These trees were removed for the purpose of training the diameter model but were included in the training data for other models so that their AGB, bounding boxes, and species could still be ground-truthed. The remaining data were scaled and split into a training set comprising 80% of the data and a validation set of 20%.
Four different model types were tested, the results of which can be seen in Figure A5 in Appendix A. Ultimately, a XGBoost Regressor model was selected. This model builds an ensemble of shallow decision trees sequentially, where each tree corrects the errors of its predecessors, allowing it to handle complex, non-linear relationships. Regularization parameters like gamma and minimum child weight help control model complexity and prevent overfitting. The model was configured with a set of hyperparameters that included 100,000 estimators, a maximum depth of 6 for each tree, a learning rate of 0.1, and subsampling and column sampling rates of 0.8 to prevent overfitting. The model also incorporated a gamma value of 0.05 to control tree splitting and a minimum child weight of 1 to ensure leaves were formed only when sufficient data were available.
In post-processing, this model was applied to the output by combining the DeepForest model results and SEDD model results. It used predicted boxes from DeepForest and species predictions from SEDD to generate DBH predictions.
2.7.3. Custom Statistical Models and Carbon Sequestration Calculation
There are widely accepted allometric equations for common species [32], but not all species in the dataset had a previously developed custom equation. Additionally, because there was an ‘Otra Vareidad’ category, a generalized equation was needed. As such, five custom allometric statistical models were generated, one for each of the four species and one for the other species combined in this dataset. Once again, test data and outliers were removed before testing six potential models, the results of which can be viewed in Table A2 in Appendix A.
The selected Generalized Additive Model (GAM) specializes in modeling complex, non-linear relationships by applying a smooth function to the diameter feature. This model was applied to the data frame, including DBH predictions, generating an estimated AGB for each tree.
As dry tropical forests have a root-to-shoot ratio of 22% [33], meaning the below-ground biomass is 22% of its above-ground counterpart, total biomass in the current study was predicted by multiplying the predicted above-ground biomass by 1.22. Then, aligned with the accepted principle that the carbon stock of a tree is approximately 50% of its total biomass [34], the total biomass was divided by 2, resulting in an individual carbon sequestration prediction of each tree.
Because the final model was a GAM, the specific form was not a simple parametric equation like linear or polynomial models. Instead, it was composed of smooth functions for each predictor variable. Those interested in reproducing the statistical models used in this report can access relevant code in GitHub (https://github.com/edsml-ger23/SEDD-Carbon-Accounting (accessed on 1 October 2024)) in the Jupyter Notebook 7.4.0b1 entitled allometric equations. Summaries of the GAMs can be found in Appendix A (Table A3).
3. Results
3.1. Project Aims
This study investigates one key hypothesis and one secondary hypothesis:
Hypothesis H1:
It is possible to quantify carbon sequestration potential at the individual tree level using only RGB aerial imagery via a methodological sequence that combines deep learning and statistical methods.
Hypothesis H2:
Machine learning techniques can be employed to develop a predictive model for estimating the diameter at breast height (DBH) based solely on tree species and crown attributes.
The final result, comparing carbon sequestration predictions with the ground truth, will be the most pertinent for the key hypothesis. However, there are also intermediary results to consider throughout the methodological sequence. Of particular importance to the secondary hypothesis is assessing the success of the DBH model (see Section 3.3. Diameter Results).
3.2. SEDD Model Results
In Appendix A (Table A4), you can see the pixel-based classification accuracy and distance map mean squared error. F1 metrics for individual tiles can be found in Table 2. These figures differ because the former is pixel based, measuring each pixel’s classification against its ground truth. The latter is tile based and controlled by bounding boxes, matching the prediction for a single tree crown. This comparison necessitates that the “Before” column use a small amount of post-processing, matching pixels to their associated bounding box. With this small amount, the SEDD model achieves an F1 score of 0.72, similar to the industry standard for this type of task (0.74 [18], 0.77 [19]). After post-processing, that figure increased to 0.852.

Table 2.
F1 scores for each test image tile before and after post-processing.
3.3. Diameter Results
The chosen diameter model achieved a root mean squared error (RMSE) of 2.84 on the test set established in training the model, and an RMSE of 3.27 on the outputs from the combination of the SEDD model and the DeepForest model. While some of the other attempted diameter models achieved lower RMSE scores (see Figure A5 in Appendix A), plotting the results showed a trend of overgeneralization. Consequently, the XGBoost model was selected for its ability to incorporate variability while avoiding overfitting.
With general DBH measurements ranging between 5 and 18 inches, the XGBoost RMSE measurements indicate a moderately high degree of error, with the RMSE representing as much as half of the total measurement in some cases. This inaccuracy is further reflected by the R2 score associated with the selected model. At just 0.1, the model offers limited improvement over using the average DBH for each species (see Figure 4). There is no autocorrelation in the model, achieving a Durbin–Watson score of 2.12.
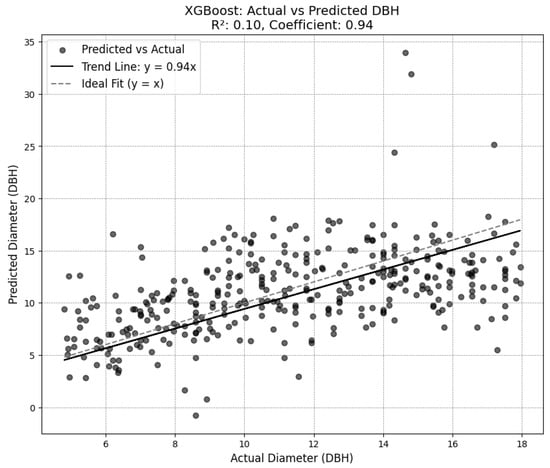
Figure 4.
Diameter model predictions compared to ground truth.
3.4. Allometric Results
AGB statistical models were evaluated for their ability to predict the AGB in a species-specific context using the DBH as the primary input. The baseline model, a linear regression, achieved an R-squared score between 0.97 and 0.99 for all named species. For the Otra Variedad category, the R-squared score was 0.86, indicating a reasonable level of predictive power despite limited information about individual species.
The chosen Generalized Additive Model (GAM) provided slightly lower but still strong R-squared scores, with values near 1 for the named species and 0.97 for the Otra Variedad category. This result suggests the GAM better accommodates variability between the DBH and AGB, especially in less well-defined cases. When applied to the entire dataset, a quality control flag identified instances where the difference between the predicted and actual AGB exceeded 20%. Only 10 trees were flagged, and all belonged to the Otra Variedad category.
3.5. AGB and Carbon Sequestration Results
Post-processing greatly improved the F1 scores, with an average overall increase in an F1 score from 72.4 to 85.2 (see Table 2). In challenging images, such as Flora Pluas RGB_16_11400_3800_15400_7800, where the original accuracy was 47.5, great improvements were made, with a final F1 of 75. These improvements indicate that the post-processing steps of combining the SEDD model output with the DeepForest output were successful in their aim of increasing the accuracy of the predictions. Figure 5 gives an example of the post-processing steps for a sample test image, visually demonstrating post-processing and highlighting the correct identification of both Guaba and Cacao trees. In Appendix A (Figure A6), another example tile shows Musacea/Cacao separation in a denser tile.
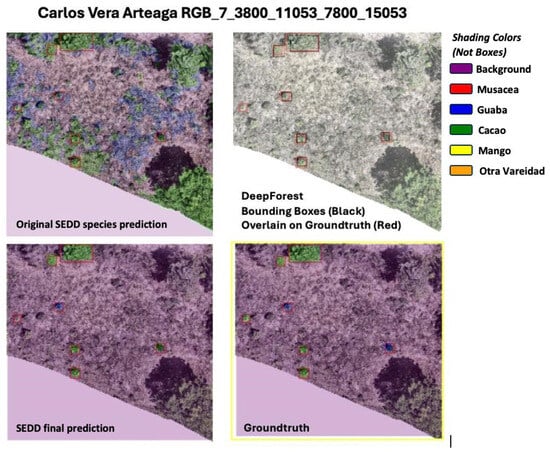
Figure 5.
A comparison of the original model output and final output (after post-processing) compared to the ground truth for Carlos Vera Arteaga.
Across tiles, there tended to be difficulty identifying species of sparser representation in the original dataset. Sixty-eight percent of trees in the test images were accurately identified. However, for just the most common species—Musacea and Cacao—accurate identification was much higher, reaching over 90% accuracy for the most common species, Musacea (see Table 3). The challenges of a sparse dataset prove impactful at this stage, with the Mango and Otra Vareidad categories not being identified at all by the model. Still, the correct identification of 2% of the Guaba trees, while a small figure, suggests the model was not simply defaulting to the two most represented species and was, in fact, learning the species representations.

Table 3.
Correct classification percentages by species as considered via bounding box.
Once the SEDD and DeepForest model outputs were combined, the AGB and carbon could be calculated using the DBH model and allometric equations. In an effort to control for cascading errors from different models, these calculations were performed considering both the situation in which species were accurately predicted and the situation in which they were not. Because the DBH and AGB models are reliant on species, results from incorrectly classed species should not be considered as pertinent as those from correctly classed species. Both are included for a robust presentation of results. The results inclusive of only correctly identified trees can be found in Table 4, while the full table is available in Appendix A (Table A5).

Table 4.
Carbon sequestration results for each tile in the test set, controlled for only those trees where the predicted species matched the actual species.
4. Discussion
4.1. SEDD Model Discussion
The primary goal behind this study’s main model was to create a lightweight architecture that could accurately and efficiently predict species classification based on an aerial RGB image. To that end, it was successful, achieving an F1 of 72% before post-processing and an F1 of 85% after post-processing. While using ResNet18 as the encoder is less complex than deeper models, its performance in this study demonstrates its adequacy for extracting meaningful spatial features for both species’ segmentation and distance regression tasks. Similarly, the complexity could have been increased on the distance branch. However, the distance decoder architecture was kept purposefully simple, contributing to computational efficiency and scalability in resource-limited settings.
4.2. Post-Processing Discussion
Armed with semantic output, post-processing allowed for a final measurement of the AGB for individual trees based only on RGB images. The initial aim of this project was to prove the feasibility of that initiative, a first-of-its-kind undertaking. The widely accepted DeepForest package allowed for ITC-delineation, paired using IoU with the species segmentation map. After this first post-processing step, there existed a map that included metrics on both species and bounding box size, representing tree crown size.
The next step in the work involved using species and bounding box metrics to predict the DBH. Obtaining DBH measurements is one of the most time-consuming and cost-prohibitive components of estimating tree biomass. Since the DBH falls below the tree canopy, it is impossible to see using aerial imagery. The XGBoost model employed in this study predicts the DBH based only on species and bounding box dimensions with an RMSE of 3.27 and R2 of 0.1. These results are not unexpected given that the input data are limited to the dimensions of the tree crown from above and the species classification—two variables that are not strongly correlated with the DBH in the existing literature.
Developing a model that outperforms the species average, even by a small margin, represents an exciting first step in this proof-of-concept study. In terms of the secondary hypothesis, the relatively high RMSE and low R2 score suggest that either more sophisticated modeling techniques or additional predictor variables, such as environmental factors or higher-resolution crown metrics, may be required for improved accuracy. Therefore, while the second hypothesis is rejected in the current project, the approach remains promising with further methodological enhancements and expanded data inputs. (See Section 4.4. Limitations and Next Steps.)
Importantly, this rejection of the secondary hypothesis does not jeopardize the validation of the key hypothesis. The outputs of the DBH model are still used in the rest of the methodological sequence, as they do outperform taking the average based on species (if only just).
Once the DBH was calculated, allometric equations custom-developed for Cacao, Mango, Musacea, and Guaba achieved an R-squared near 1. The Otra Vareidad category achieved an R-squared of 0.86. While this high accuracy may appear overly optimistic, it reflects the tightly coupled relationship between the AGB, the DBH, and species-specific allometric equations, which are well established in forestry science.
4.3. Comparison of Final Results
Comparing this study to others is a challenge since it is the first of its kind in the way that it uses individual tree data. Other strategies are not based on ITCs, and therefore, their test sets are not isolated to ITCs, instead comprising whole areas. Since individual trees exist in this study’s training set, considering the biomass of the whole area would entail data leakage, a problem that does not present for those researchers using individual-tree-agnostic approaches. In an attempt to compare this approach to others tackling the same challenge, relative error between the predicted and actual AGB is compared instead.
This study is not the first to encounter the challenge of comparison when introducing a novel approach. A similar issue was identified by Klein et al. [12], whose study calculated the carbon sequestration potential for Manhattan based on ITCs. That study also recognized relative error comparisons with non-ITC methods as the best available means of validation. Following this principle, Table 5 presents the predictions by various methods for the entire ReforesTree dataset [24]. The original evaluation predicts the AGB rather than carbon, but since carbon is a linear transformation of the AGB, the relative error remains unchanged.

Table 5.
Relative error by other reports in predicted AGB.
Unlike large-scale satellite-derived estimates, which often lack direct validation against localized tree measurements, this approach benefits from species-specific allometric models calibrated against empirical field data. The results strongly support the acceptance of the key hypothesis, demonstrating that carbon sequestration potential can be quantified at the individual tree level using only RGB aerial imagery. This is true despite the rejection of the secondary hypothesis, which was originally thought to be crucial to accepting the key hypothesis. Instead, this study demonstrates that estimations of carbon sequestration potential are sufficiently accurate when localized to the individual tree level even when using a DBH measurement, which is essentially the average of that tree’s species.
In an acceptance of the key hypothesis, the approach presented here achieves a relative error across the test set of 2%, a level of accuracy comparable to studies that rely on manually collected DBH and species data, such as Reierson et al. [1]. The Santoro et al. study [10], which uses satellite L-band observations, has a relative error on this test set of 34%, while the GFW [13] and Spawn et al. [7] approaches have errors of over 100%. It was exactly these types of methodologies that were identified as causing the gross overestimation of carbon potential underlying the world’s carbon credits [17]. As an alternative, this study’s approach offers an exciting way forward in its low relative error to provide more accuracy in the market.
The overall runtime for this application is 3 h, which is a realistic and scalable solution for use in the voluntary carbon market, a non-emergency sector.
4.4. Limitations
This project used RGB aerial data, in large part because of its availability in lower-income areas. However, there are more sophisticated techniques that could have been employed if using multispectral or LiDAR data, particularly as it relates to DBH approximation. Additionally, this project was designed for deployment in low- and middle-income environments. That said, the evaluation of the SEDD model requires the use of a high-performance computing (HPC) cluster. This usage of high-end computing resources means that running the current models could be out of reach for resource-constrained areas.
Additionally, while our approach demonstrates strong potential, its applicability across different ecological settings requires further calibration and validation efforts to ensure standardization. The methodology was trained and tested on dry tropical forests, and while the model structure is adaptable, differences in species composition, canopy density, and biomass distribution across forest types necessitate additional testing.
4.5. Next Steps
As hypothesis two was rejected, future research could further explore the feasibility of creating a DBH model based on aerial imagery by incorporating additional data sources, such as geographic region or average weather conditions. Researchers could also evaluate whether the species’ average DBH might be sufficiently accurate for estimating carbon sequestration at the individual tree level when compared with regional approaches.
Future work may also look at creating a sleeker species segmentation model evaluated on less-powerful computing infrastructure. Data augmentation techniques could be leveraged to address species class imbalance, or distinct models could be trained to detect individual species and leveraged in parallel.
While the current project used the distance decoder exclusively as a regularizer and therefore prioritized a lightweight implementation, future work could consider a more advanced model architecture. Incorporating multi-scale convolutions or attention mechanisms could enhance the precision of distance regression, allowing for use in post-processing as opposed to the use of the secondary distance task in DeepForest. Similarly, the ResNet18 encoder is relatively lightweight. Future studies weighing the benefits of efficiency and effectiveness could experiment with comparing the ResNet18 against deeper architectures, such as ResNet50 or Vision Transformers.
Finally, this model was trained on a dry tropical forest type using imagery with a resolution of 2 cm per pixel. Conducting similar work in different geographical regions or forest types would advance this proof of concept toward actionable implementation. Similarly, applying and testing this methodology with lower-resolution, widely available imagery, such as that provided freely by MODIS [13], could increase scalability. If proved more scalable, this approach could be embedded in existing software like GlobWetland Africa [35] and POLWET [36], providing increased transparency and therefore reliability.
5. Conclusions
The solution proposed in this study is lightweight in its data requirements, relying solely on RGB aerial imagery while achieving an accuracy in predicting carbon sequestration that outperforms existing methods requiring more extensive field data. The study’s key hypothesis is accepted—per-tree carbon sequestration potential can be quantified using only high-resolution RGB imagery and deep learning techniques.
Given the challenges in accurately estimating carbon storage in the past, a relative error across the test tiles of 2% could solve transparency challenges in the voluntary carbon market. Additionally, achieving a species classification accuracy of 84% for the two most representative species in the data is an encouraging step forward in applying machine learning to fine-grained carbon accounting.
Beyond demonstrating accuracy, our approach provides a standardized methodology for fine-scale forest monitoring and carbon estimation, including species classification, tree crown delineation, custom allometric models, DBH prediction, and accepted carbon accounting equations. This study, therefore, defines a structured workflow for processing, validating, and supplying geographical data in a carbon accounting context. By emphasizing standardization, this work can provide the methodological foundation for future deep learning-based forest monitoring reliant on RGB imagery.
Author Contributions
Conceptualization, M.S. and G.R.; Data curation, G.R.; Formal analysis, G.R.; Investigation, G.R.; Methodology, M.S. and G.R.; Project administration, M.S.; Resources, M.S.; Supervision, M.S.; Writing—original draft, G.R.; Writing—review and editing, M.S. All authors have read and agreed to the published version of the manuscript.
Funding
This study received no external funding.
Informed Consent Statement
Not applicable.
Data Availability Statement
Data are publicly available from https://github.com/edsml-ger23/SEDD-Carbon-Accounting (accessed on 1 February 2025).
Acknowledgments
The authors are grateful for the support of the Center for Environmental Policy and Royal School of Mines at the Imperial College London.
Conflicts of Interest
The authors declare no conflicts of interest.
Appendix A

Table A1.
Species name translations.
Table A1.
Species name translations.
| Spanish Name | English Name |
|---|---|
| Cacao | Cacao |
| Musacea | Musaceae (commonly known as the banana tree) |
| Guaba | Guava |
| Mango | Mango |
| Otra Variedad | Other Variety |
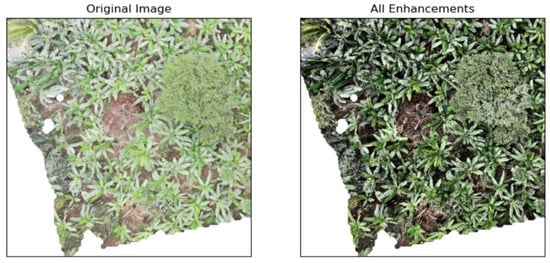
Figure A1.
A selected image tile from the ReforesTree dataset before and after image enhancements are applied.
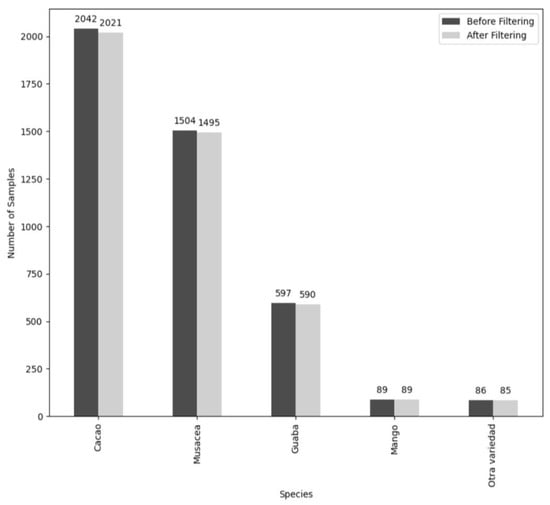
Figure A2.
Species representation in dataset before and after filtering.
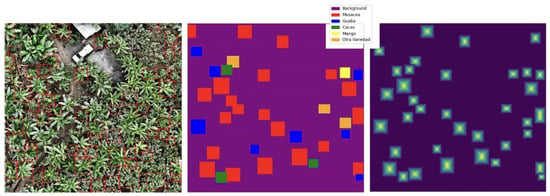
Figure A3.
An example test image with associated species and distance maps, ready for evaluation.
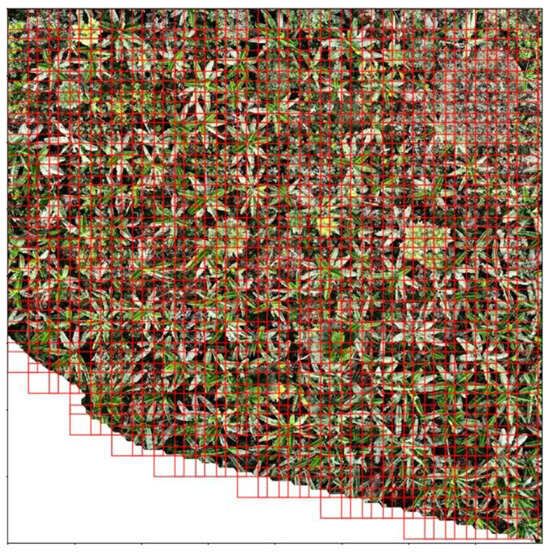
Figure A4.
Visualization of sliding window movement over example image with 50% overlap.
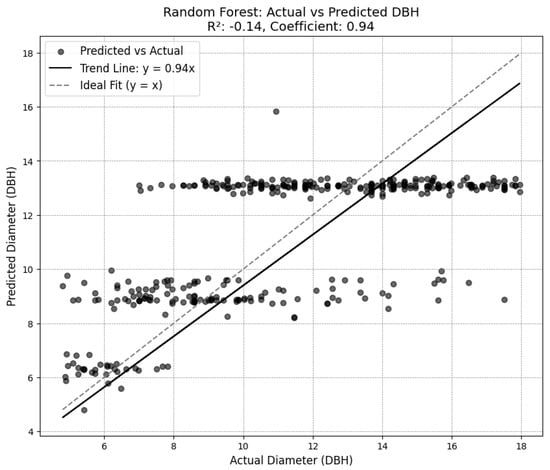
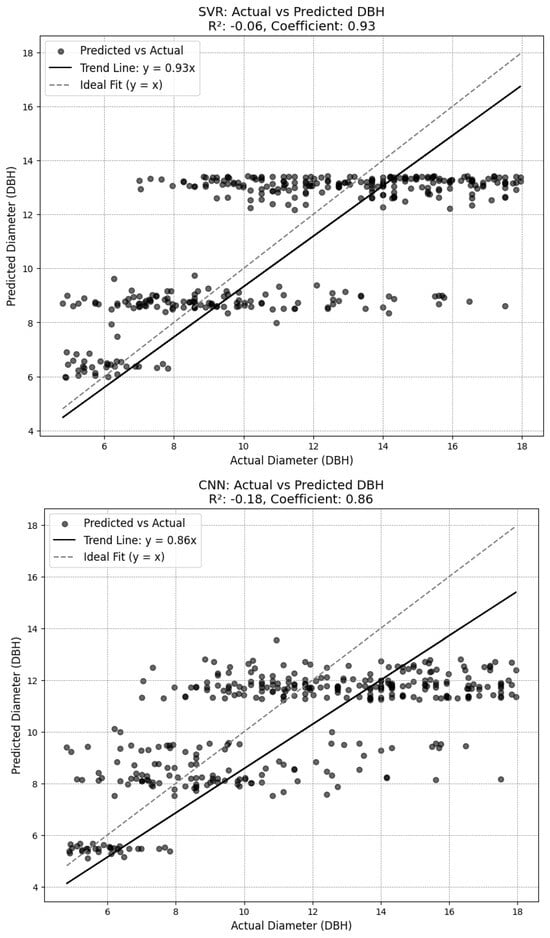
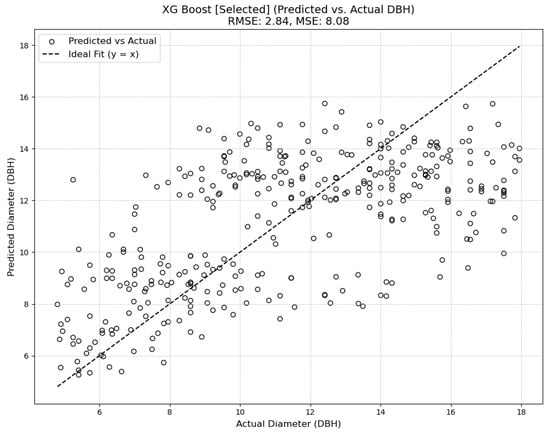
Figure A5.
Different diameter model architectures.

Table A2.
Comparison of R-squared scores from statistical allometric models.
Table A2.
Comparison of R-squared scores from statistical allometric models.
| Log Log | Linear | Exponential | Logarithmic | Polynomial | GAM | |
|---|---|---|---|---|---|---|
| Musacea | 1.0 | 0.99 | 0.99 | 0.97 | 1.0 | 1.0 |
| Cacao | 1.0 | 0.99 | 0.98 | 0.95 | 1.0 | 1.0 |
| Guaba | 1.0 | 0.97 | 0.98 | 0.93 | 1.0 | 1.0 |
| Mango | 1.0 | 1.0 | 1.0 | 0.99 | 1.0 | 1.0 |
| Otra Variedad | 0.87 | 0.86 | 0.92 | 0.71 | 0.93 | 0.98 |

Table A3.
Summaries for GAM models across species.
Table A3.
Summaries for GAM models across species.
| Cacao | |||||||
| Mean Squared Error: 0.0000 R2 Score: 1.0000 GAM Summary: LinearGAM | |||||||
| Distribution: NormalDist Link Function: IdentityLink Number of Samples: 83 | Effective DoF: 9.4847 Log Likelihood: −1043592724.0811 AIC: 2087185469.1315 AICc: 2087185472.499 GCV: 0.0 Scale: 0.0 Pseudo R-Squared: 1.0 | ||||||
| Feature Function | Lambda | Rank | EDoF | p > x | Sig. Code | ||
| s(0) | 0.6 | 20 | 9.5 | 1.11 × 10⁻¹⁶ | 0 | ||
| Intercept | 1 | 0.0 | 1.11 × 10⁻¹⁶ | 0 | |||
| Guaba | |||||||
| Mean Squared Error: 0.0000 R2 Score: 1.0000 GAM Summary: LinearGAM | |||||||
| Distribution: NormalDist Link Function: IdentityLink Number of Samples: 319 | Effective DoF: 12.1432 Log Likelihood: −9752239.4131 AIC: 19504505.1125 AICc: 19504506.332 GCV: 0.0 Scale: 0.0 Pseudo R-Squared: 1.0 | ||||||
| Feature Function | Lambda | Rank | EDoF | p > x | Sig. Code | ||
| s(0) | 0.6 | 20 | 12.1 | 1.11 × 10⁻¹⁶ | 0 | ||
| Intercept | 1 | 0.0 | 1.11 × 10⁻¹⁶ | 0 | |||
| Mango | |||||||
| Mean Squared Error: 0.0000 R2 Score: 1.0000 GAM Summary: LinearGAM | |||||||
| Distribution: NormalDist Link Function: IdentityLink Number of Samples: 50 | Effective DoF: 8.357 Log Likelihood: −66169739.1487 AIC: 132339497.0114 AICc: 132339501.9006 GCV: 0.0 Scale: 0.0 Pseudo R-Squared: 1.0 | ||||||
| Feature Function | Lambda | Rank | EDoF | p > x | Sig. Code | ||
| s(0) | 0.6 | 20 | 8.4 | 1.11 × 10⁻¹⁶ | 0 | ||
| Intercept | 1 | 0.0 | 1.11 × 10⁻¹⁶ | 0 | |||
| Musacea | |||||||
| Mean Squared Error: 0.0000 R2 Score: 1.0000 GAM Summary: LinearGAM | |||||||
| Distribution: NormalDist Link Function: IdentityLink Number of Samples: 773 | Effective DoF: 13.7307 Log Likelihood: −5655390038.9665 AIC: 11310780107.3944 AICc: 11310780108.0064 GCV: 0.0 Scale: 0.0 Pseudo R-Squared: 1.0 | ||||||
| Feature Function | Lambda | Rank | EDoF | p > x | Sig. Code | ||
| s(0) | 0.6 | 20 | 13.7 | 1.11 × 10⁻¹⁶ | 0 | ||
| Intercept | 1 | 0.0 | 1.11 × 10⁻¹⁶ | 0 | |||
| Otra Vareidad | |||||||
| Mean Squared Error: 1.8291 R2 Score: 0.9754 GAM Summary: LinearGAM | |||||||
| Distribution: NormalDist Link Function: IdentityLink Number of Samples: 155 | Effective DoF: 9.983 Log Likelihood: −283.4332 AIC: 588.8324 AICc: 590.6729 GCV: 2.2096 Scale: 1.955 Pseudo R-Squared: 0.9754 | ||||||
| Feature Function | Lambda | Rank | EDoF | p > x | Sig. Code | ||
| s(0) | 0.6 | 20 | 10.0 | 1.11 × 10⁻¹⁶ | 0 | ||
| Intercept | 1 | 0.0 | 1.11 × 10⁻¹⁶ | 0 | |||

Table A4.
Accuracy metrics from SEDD model before post-processing (Section 3.4).
Table A4.
Accuracy metrics from SEDD model before post-processing (Section 3.4).
| Species | F1 | 31.90 |
| Precision | 68.43 | |
| Recall | 20.80 | |
| Distance | MSE | 0.0515 |
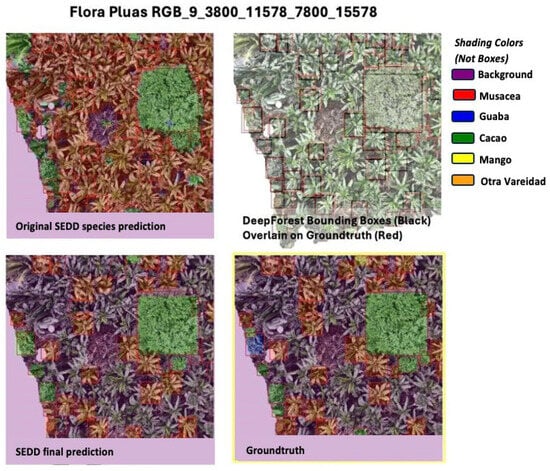
Figure A6.
A comparison of the original model outputs and final outputs (after post-processing) compared to the ground truth for Flora Pluas.

Table A5.
Carbon sequestration results for each tile in the test set, the comparison between controlling for the species and the whole dataset.
Table A5.
Carbon sequestration results for each tile in the test set, the comparison between controlling for the species and the whole dataset.
| Controlled for Species Matching | Actual Carbon | Predicted Carbon | Absolute Difference | Relative Difference |
|---|---|---|---|---|
| Carlos Vera Arteaga RGB_7_3800_11053_7800_15053.png | 44.77 | 28.33 | 16.44 | 0.37 |
| Carlos Vera Guevara RGB_10_7600_7600_11600_11600.png | 16.6 | 15.84 | 0.77 | 0.05 |
| Carlos Vera Guevara RGB_11_7600_8305_11600_12305.png | 6.64 | 6.74 | 0.09 | 0.01 |
| Flora Pluas RGB_14_7600_11578_11600_15578.png | 104.34 | 94.44 | 9.91 | 0.09 |
| Flora Pluas RGB_15_11400_0_15400_4000.png | 77.32 | 59.63 | 17.68 | 0.23 |
| Flora Pluas RGB_16_11400_3800_15400_7800.png | 151.21 | 126.18 | 25.03 | 0.17 |
| Flora Pluas RGB_9_3800_11578_7800_15578.png | 98.03 | 73.82 | 24.2 | 0.25 |
| Leonor Aspiazu RGB_14_11400_7600_15400_11600.png | 16.69 | 20.84 | 4.16 | 0.25 |
| Leonor Aspiazu RGB_2_0_7600_4000_11600.png | 85.4 | 110.22 | 24.83 | 0.29 |
| Leonor Aspiazu RGB_6_3800_7600_7800_11600.png | 134.21 | 147.01 | 12.8 | 0.1 |
| Leonor Aspiazu RGB_9_7600_3800_11600_7800.png | 168.7 | 171.92 | 3.23 | 0.02 |
| Manuel Macias RGB_5_3800_6879_7800_10879.png | 17.85 | 18.28 | 0.42 | 0.02 |
| Manuel Macias RGB_8_7600_6879_11600_10879.png | 16.29 | 24.13 | 7.84 | 0.48 |
| Manuel Macias RGB_9_9748_0_13748_4000.png | 0.53 | 2.95 | 2.42 | 4.6 |
| Nestor Macias RGB_11_7600_9024_11600_13024.png | 109.8 | 102.34 | 7.46 | 0.07 |
| Nestor Macias RGB_8_7600_0_11600_4000.png | 153.05 | 162.52 | 9.47 | 0.06 |
| Total | 1201.4 | 1165.2 | 36.2 | 0.03 |
| Whole Test Dataset—Not Controlled for Species Matching | ||||
| Carlos Vera Arteaga RGB_7_3800_11053_7800_15053.png | 58.71 | 34.73 | −23.97 | 0.41 |
| Carlos Vera Guevara RGB_10_7600_7600_11600_11600.png | 62.98 | 23.82 | −39.16 | 0.62 |
| Carlos Vera Guevara RGB_11_7600_8305_11600_12305.png | 83.24 | 25.23 | −58.01 | 0.70 |
| Flora Pluas RGB_14_7600_11578_11600_15578.png | 112.19 | 95.00 | −17.19 | 0.15 |
| Flora Pluas RGB_15_11400_0_15400_4000.png | 169.07 | 84.34 | −84.73 | 0.50 |
| Flora Pluas RGB_16_11400_3800_15400_7800.png | 436.79 | 178.07 | −258.72 | 0.59 |
| Flora Pluas RGB_9_3800_11578_7800_15578.png | 159.10 | 90.61 | −68.49 | 0.43 |
| Leonor Aspiazu RGB_14_11400_7600_15400_11600.png | 28.91 | 32.66 | 3.75 | 0.13 |
| Leonor Aspiazu RGB_2_0_7600_4000_11600.png | 235.12 | 204.61 | −30.51 | 0.13 |
| Leonor Aspiazu RGB_6_3800_7600_7800_11600.png | 335.81 | 288.95 | −46.85 | 0.14 |
| Leonor Aspiazu RGB_9_7600_3800_11600_7800.png | 285.42 | 223.47 | −61.96 | 0.22 |
| Manuel Macias RGB_5_3800_6879_7800_10879.png | 41.27 | 41.32 | 0.05 | 0.00 |
| Manuel Macias RGB_8_7600_6879_11600_10879.png | 77.36 | 75.16 | −2.20 | 0.03 |
| Manuel Macias RGB_9_9748_0_13748_4000.png | 21.73 | 17.21 | −4.52 | 0.21 |
| Nestor Macias RGB_11_7600_9024_11600_13024.png | 154.21 | 118.31 | −35.89 | 0.23 |
| Nestor Macias RGB_8_7600_0_11600_4000.png | 307.34 | 214.95 | −92.39 | 0.30 |
| Total | 2569.25 | 1748.44 | 820.81 | 0.32 |
References
- Sun, W.; Liu, X. Review on carbon storage estimation of forest ecosystem and applications in China. For. Ecosyst. 2019, 7, 4. [Google Scholar]
- Intergovernmental Panel on Climate Change. Land–climate interactions. In Climate Change and Land: IPCC Special Report on Climate Change, Desertification, Land Degradation, Sustainable Land Management, Food Security, and Greenhouse Gas Fluxes in Terrestrial Ecosystems; Cambridge University Press: Cambridge, UK, 2022; pp. 131–247. [Google Scholar]
- Food and Agriculture Organization of the United Nations. Global Forest Resources Assessment 2020. Available online: https://www.fao.org/interactive/forest-resources-assessment/2020/en/ (accessed on 11 February 2024).
- Shi, H.; Tian, H.; Lange, S.; Yang, J.; Pan, S.; Fu, B.; Reyer, C.P.O. Terrestrial biodiversity threatened by increasing global aridity velocity under high-level warming. Proc. Natl. Acad. Sci. USA 2021, 118, e2015552118. [Google Scholar] [CrossRef]
- Haya, B.K.; Evans, S.; Brown, L.; Bukoski, J.; Butsic, V.; Cabiyo, B.; Jacobson, R.; Kerr, A.; Potts, M.; Sanchez, D.L. Comprehensive review of carbon quantification by improved forest management offset protocols. Front. For. Glob. Change 2023, 6, 958879. [Google Scholar] [CrossRef]
- Badgley, G.; Freeman, J.; Hamman, J.J.; Haya, B.; Trugman, A.T.; Anderegg, W.R.L.; Cullenward, D. Systematic over-crediting in California’s forest carbon offsets program. Glob. Change Biol. 2022, 28, 1433–1445. [Google Scholar] [CrossRef]
- Spawn, S.A.; Sullivan, C.C.; Lark, T.J.; Gibbs, H.K. Harmonized global maps of above and belowground biomass carbon density in the year 2010. Sci. Data 2020, 7, 112. [Google Scholar] [CrossRef]
- Santoro, M.; Cartus, O.; Carvalhais, N.; Rozendaal, D.M.A.; Avitabile, V.; Araza, A.; de Bruin, S.; Herold, M.; Quegan, S.; Rodríguez-Veiga, P.; et al. The global forest above-ground biomass pool for 2010 estimated from high-resolution satellite observations. Earth Syst. Sci. Data 2021, 13, 3927–3950. [Google Scholar]
- Fassnacht, F.E.; Latifi, H.; Stereńczak, K.; Modzelewska, A.; Lefsky, M.; Waser, L.T.; Straub, C.; Ghosh, A. Review of studies on tree species classification from remotely sensed data. Remote Sens. Environ. 2016, 186, 64–87. [Google Scholar]
- Korznikov, K.A.; Kislov, D.E.; Altman, J.; Doležal, J.; Vozmishcheva, A.S.; KRESTOV, P.V. Using U-Net-like deep convolutional neural networks for precise tree recognition in very high resolution RGB (red, green, blue) satellite images. Forests 2021, 12, 66. [Google Scholar] [CrossRef]
- MODIS Science Team. MODIS—Moderate Resolution Imaging Spectroradiometer. Available online: https://modis.gsfc.nasa.gov/ (accessed on 27 February 2025).
- Planet Team. Planet Basemaps—High-Frequency, Global Satellite Imagery. Available online: https://www.planet.com/products/basemap/ (accessed on 27 February 2025).
- Global Forest Watch Dataset. Available online: https://data.globalforestwatch.org/ (accessed on 11 February 2024).
- Klein, L.; Zhou, W.; Albrecht, C. Quantification of carbon sequestration in urban forests. arXiv 2021, arXiv:2106.00182. [Google Scholar]
- Yuan, X.; Liu, S.; Feng, W.; Dauphin, G. Feature Importance Ranking of Random Forest-Based End-to-End Learning Algorithm. Remote Sens. 2023, 15, 5203. [Google Scholar] [CrossRef]
- Bartold, M.; Kluczek, M. A machine learning approach for mapping chlorophyll fluorescence at inland wetlands. Remote Sens. 2023, 15, 2392. [Google Scholar] [CrossRef]
- Braga, G.J.R.; Peripato, V.; Dalagnol, R.; Ferreira, M.P.; Tarabalka, Y.; Aragão, L.E.O.C.; de Campos Velho, H.F.; Shiguemori, E.H.; Wagner, F.H. Tree crown delineation algorithm based on a convolutional neural network. Remote Sens. 2020, 12, 1288. [Google Scholar] [CrossRef]
- Wu, J.; Yang, G.; Yang, H.; Zhu, Y.; Li, Z.; Lei, L.; Zhao, C. Extracting apple tree crown information from remote imagery using deep learning. Comput. Electron. Agric. 2020, 174, 105504. [Google Scholar] [CrossRef]
- Weinstein, B.G.; Marconi, S.; Bohlman, S.A.; Zare, A.; White, E.P. Cross-site learning in deep learning RGB tree crown detection. Ecol. Inform. 2020, 56, 101061. [Google Scholar] [CrossRef]
- Lassalle, G.; Ferreira, M.P.; La Rosa, L.E.C.; de Souza Filho, C.R. Deep learning-based individual tree crown delineation in mangrove forests using very-high-resolution satellite imagery. ISPRS J. Photogramm. Remote Sens. 2022, 189, 220–235. [Google Scholar] [CrossRef]
- Sothe, C.; Dalponte, M.; Almeida, C.M.; Schimalski, M.B.; Lima, C.L.; Liesenberg, V.; Miyoshi, G.T.; Tommaselli, A.M. Tree species classification in a highly diverse subtropical forest integrating UAV-based photogrammetric point cloud and hyperspectral data. Remote Sens. 2019, 11, 1338. [Google Scholar] [CrossRef]
- Martins, G.B.; La Rosa, L.E.C.; Happ, P.N.; Filho, L.C.T.C.; Santos, C.J.F.; Feitosa, R.Q.; Ferreira, M.P. Deep learning-based tree species mapping in a highly diverse tropical urban setting. Urban For. Urban Green. 2021, 64, 127241. [Google Scholar] [CrossRef]
- Ferreira, M.P.; Almeida, D.R.A.D.; Papa, D.D.A.; Minervino, J.B.S.; Veras, H.F.P.; Formighieri, A.; Santos, C.A.N.; Ferreira, M.A.D.; Figueiredo, E.O.; Ferreira, E.J.L. Individual tree detection and species classification of Amazonian palms using UAV images and deep learning. For. Ecol. Manag. 2020, 475, 118397. [Google Scholar] [CrossRef]
- Reiersen, G.; Dao, D.; Lütjens, B.; Klemmer, K.; Amara, K.; Steinegger, A.; Zhang, C.; ZHU, X. ReforesTree: A dataset for estimating tropical forest carbon stock with deep learning and aerial imagery. Proc. AAAI Conf. Artif. Intell. 2022, 36, 12119–12125. [Google Scholar] [CrossRef]
- Weinstein, B.G.; Marconi, S.; Aubrykientz, M.; Vincent, G.; Senyondo, H.; White, E.P. DeepForest: A Python package for RGB deep learning tree crown delineation. Methods Ecol. Evol. 2020, 11, 1743–1751. [Google Scholar] [CrossRef]
- Zuiderveld, K.J. Contrast limited adaptive histogram equalization. Graph. Gems 1994, 4, 474–485. [Google Scholar]
- La Rosa, L.E.C.; Sothe, C.; Feitosa, R.Q.; de Almeida, C.M.; Schimalski, M.B.; Oliveira, D.A.B. Multi-task fully convolutional network for tree species mapping in dense forests using small training hyperspectral data. ISPRS J. Photogramm. Remote Sen. 2021, 179, 35–49. [Google Scholar] [CrossRef]
- He, K.; Zhang, X.; Ren, S.; Sun, J. Deep residual learning for image recognition. In Proceedings of the IEEE Conference on Computer Vision and Pattern Recognition, Las Vegas, NV, USA, 28 June 2016. [Google Scholar]
- Chen, L.C.; Papandreou, G.; Kokkinos, I.; Murphy, K.; Yuille, A.L. DeepLab: Semantic image segmentation with deep convolutional nets, Atrous convolution, and fully connected CRFs. IEEE Trans. Pattern Anal. Mach. Intell. 2018, 40, 834–848. [Google Scholar] [CrossRef]
- Lin, T.-Y.; Goyal, P.; Girshick, R.; He, K.; Dollar, P. Focal loss for dense object detection. In Proceedings of the IEEE International Conference on Computer Vision, Venice, Italy, 22 October 2017. [Google Scholar]
- Luo, M.; Tian, Y.; Zhang, S.; Huang, L.; Wang, H.; Liu, Z.; Yang, L. Individual tree detection in coal mine afforestation area based on improved faster RCNN in UAV RGB images. Remote Sens. 2022, 14, 5545. [Google Scholar] [CrossRef]
- Segura, M.; Kanninen, M.; Suárez, D. Allometric models for estimating aboveground biomass of shade trees and coffee bushes grown together. Agrofor. Syst. 2006, 68, 143–150. [Google Scholar] [CrossRef]
- Qi, Y.; Wei, W.; Chen, C.; Chen, L. Plant root-shoot biomass allocation over diverse biomes: A global synthesis. Glob. Ecol. Conserv. 2019, 18, e00606. [Google Scholar] [CrossRef]
- Vashum, K.T.; Jayakumar, S. Methods to estimate above-ground biomass and carbon stock in natural forests-a review. J. Ecosyst. Ecography 2012, 2, 1–7. [Google Scholar] [CrossRef]
- GlobWetland. GlobWetland-Africa. Available online: http://globwetland-africa.org/ (accessed on 10 March 2025).
- POLWET. Integrated non-C02 Greenhouse Gas Observing System. Available online: https://www.ingos-infrastructure.eu/polwet-2/ (accessed on 10 March 2025).
Disclaimer/Publisher’s Note: The statements, opinions and data contained in all publications are solely those of the individual author(s) and contributor(s) and not of MDPI and/or the editor(s). MDPI and/or the editor(s) disclaim responsibility for any injury to people or property resulting from any ideas, methods, instructions or products referred to in the content. |
© 2025 by the authors. Licensee MDPI, Basel, Switzerland. This article is an open access article distributed under the terms and conditions of the Creative Commons Attribution (CC BY) license (https://creativecommons.org/licenses/by/4.0/).