
Tropical Forest Carbon Accounting Through Deep Learning-Based Species Mapping and Tree Crown Delineation


Abstract
1. Introduction
2. Materials and Methods
2.1. Study Area and Ground Truth
2.2. Computational Resources
2.3. Methodological Sequence
- I.
- Pre-processing;
- II.
- Individual tree-level species identification using bespoke SEDD model;
- III.
- ITC delineation using DeepForest [25];
- IV.
- XGBoost for prediction of DBH;
- V.
- GAN-based custom allometric equations for AGB prediction;
- VI.
- Estimation of carbon sequestration potential using accepted equations.
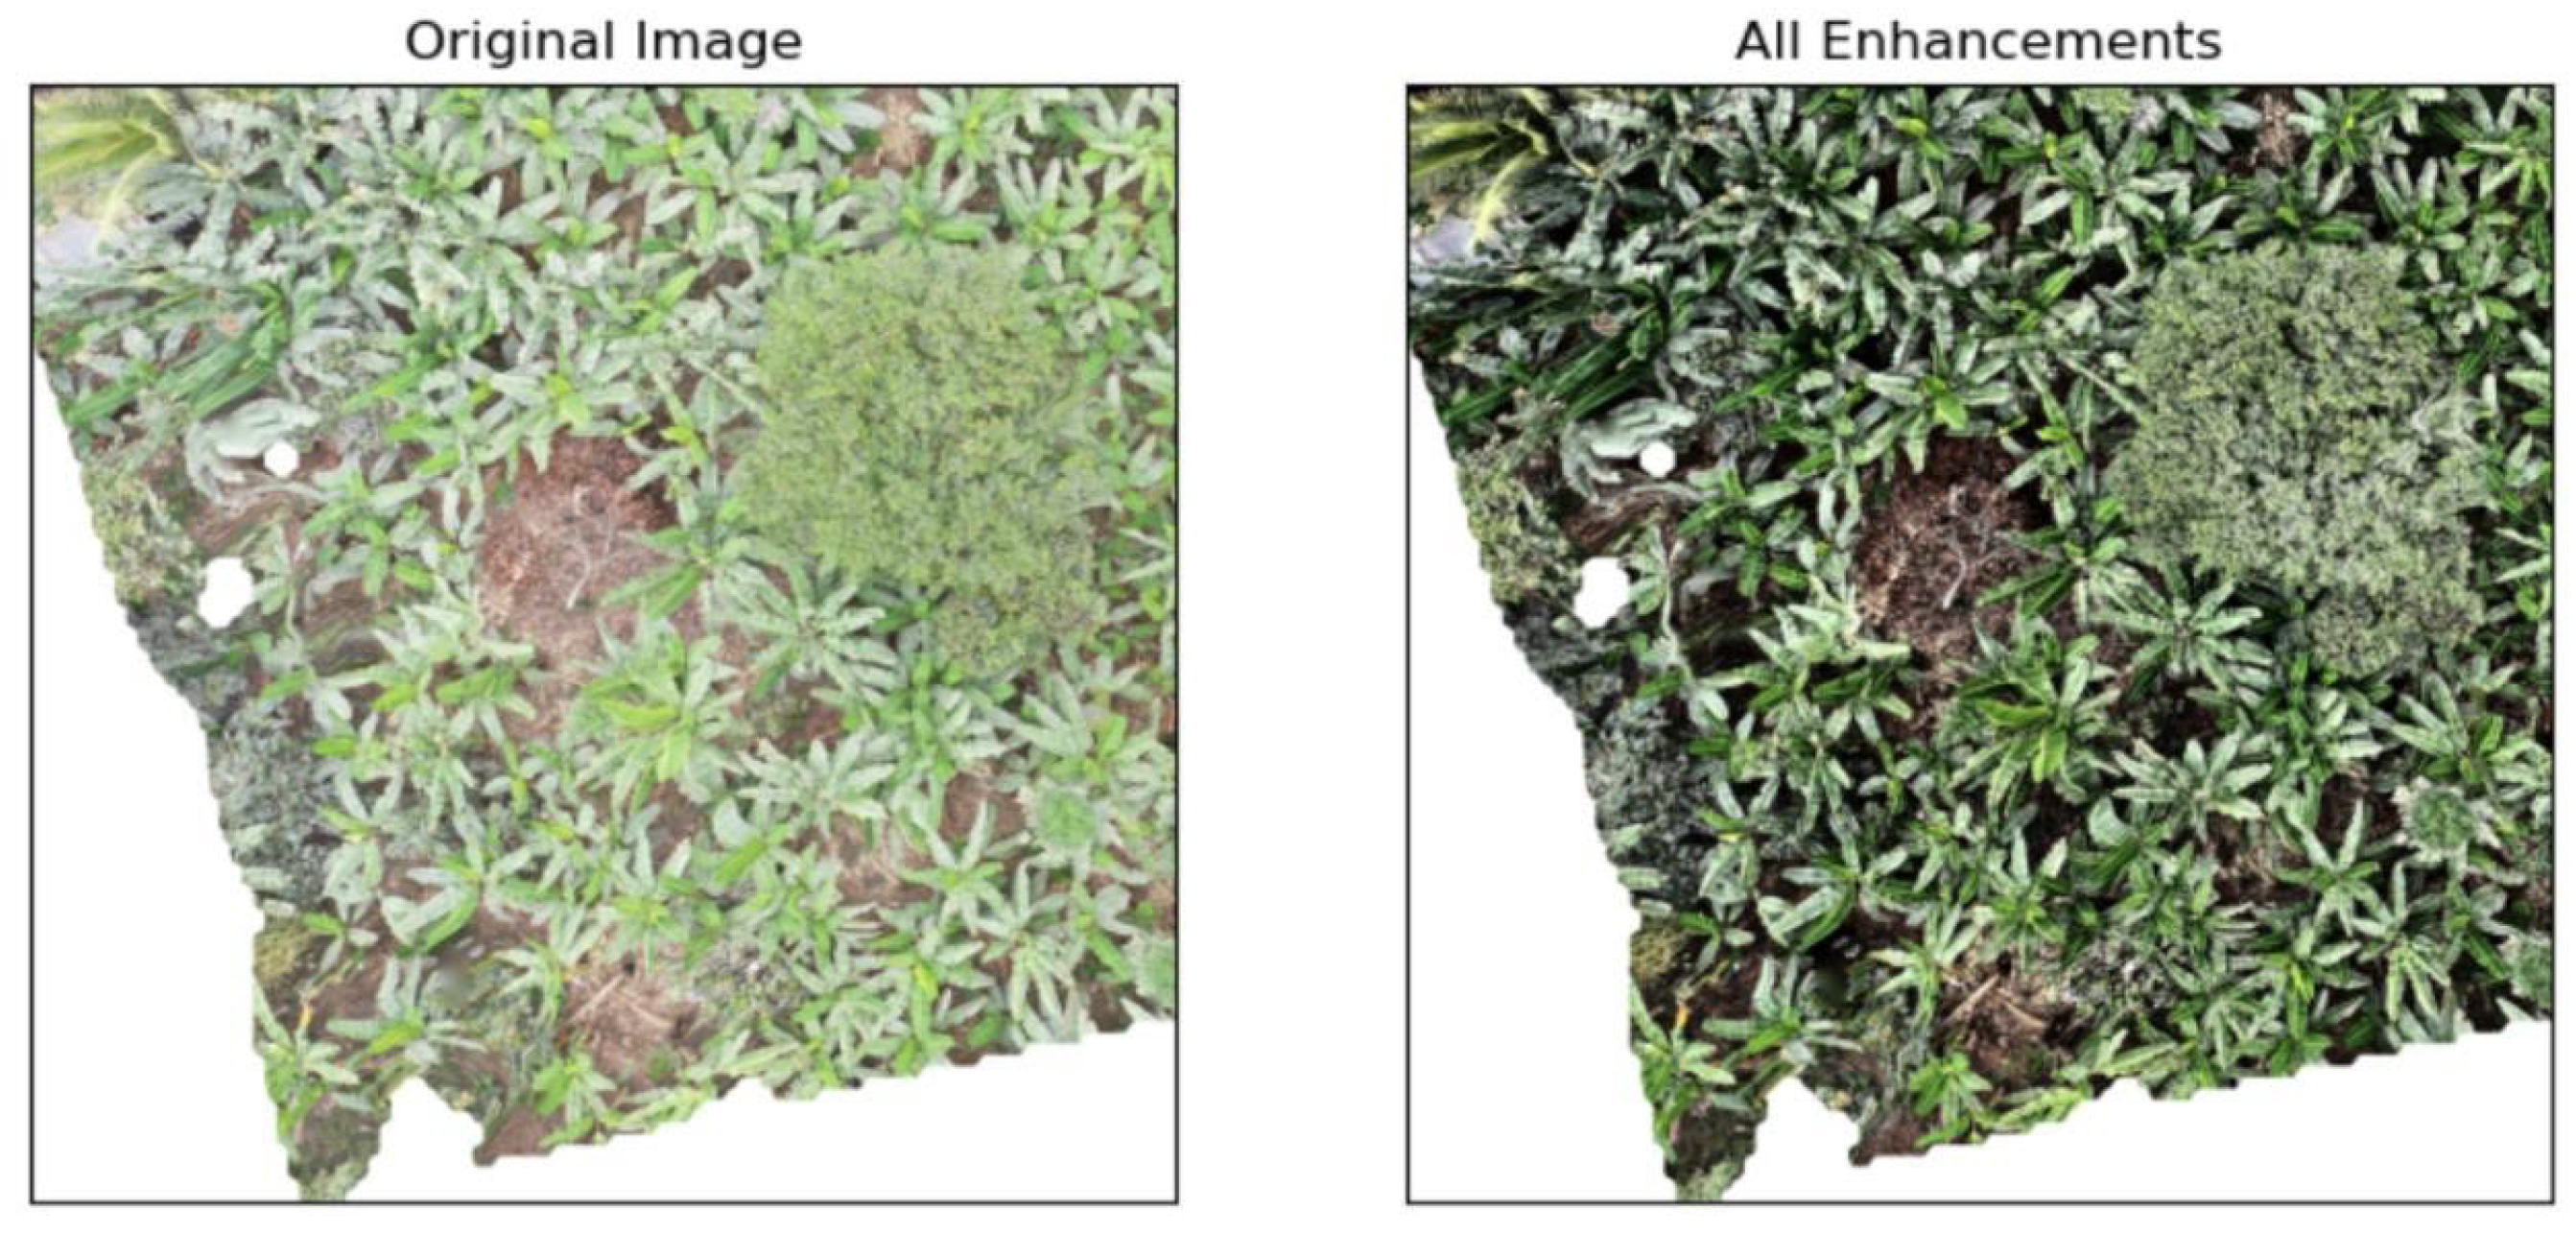
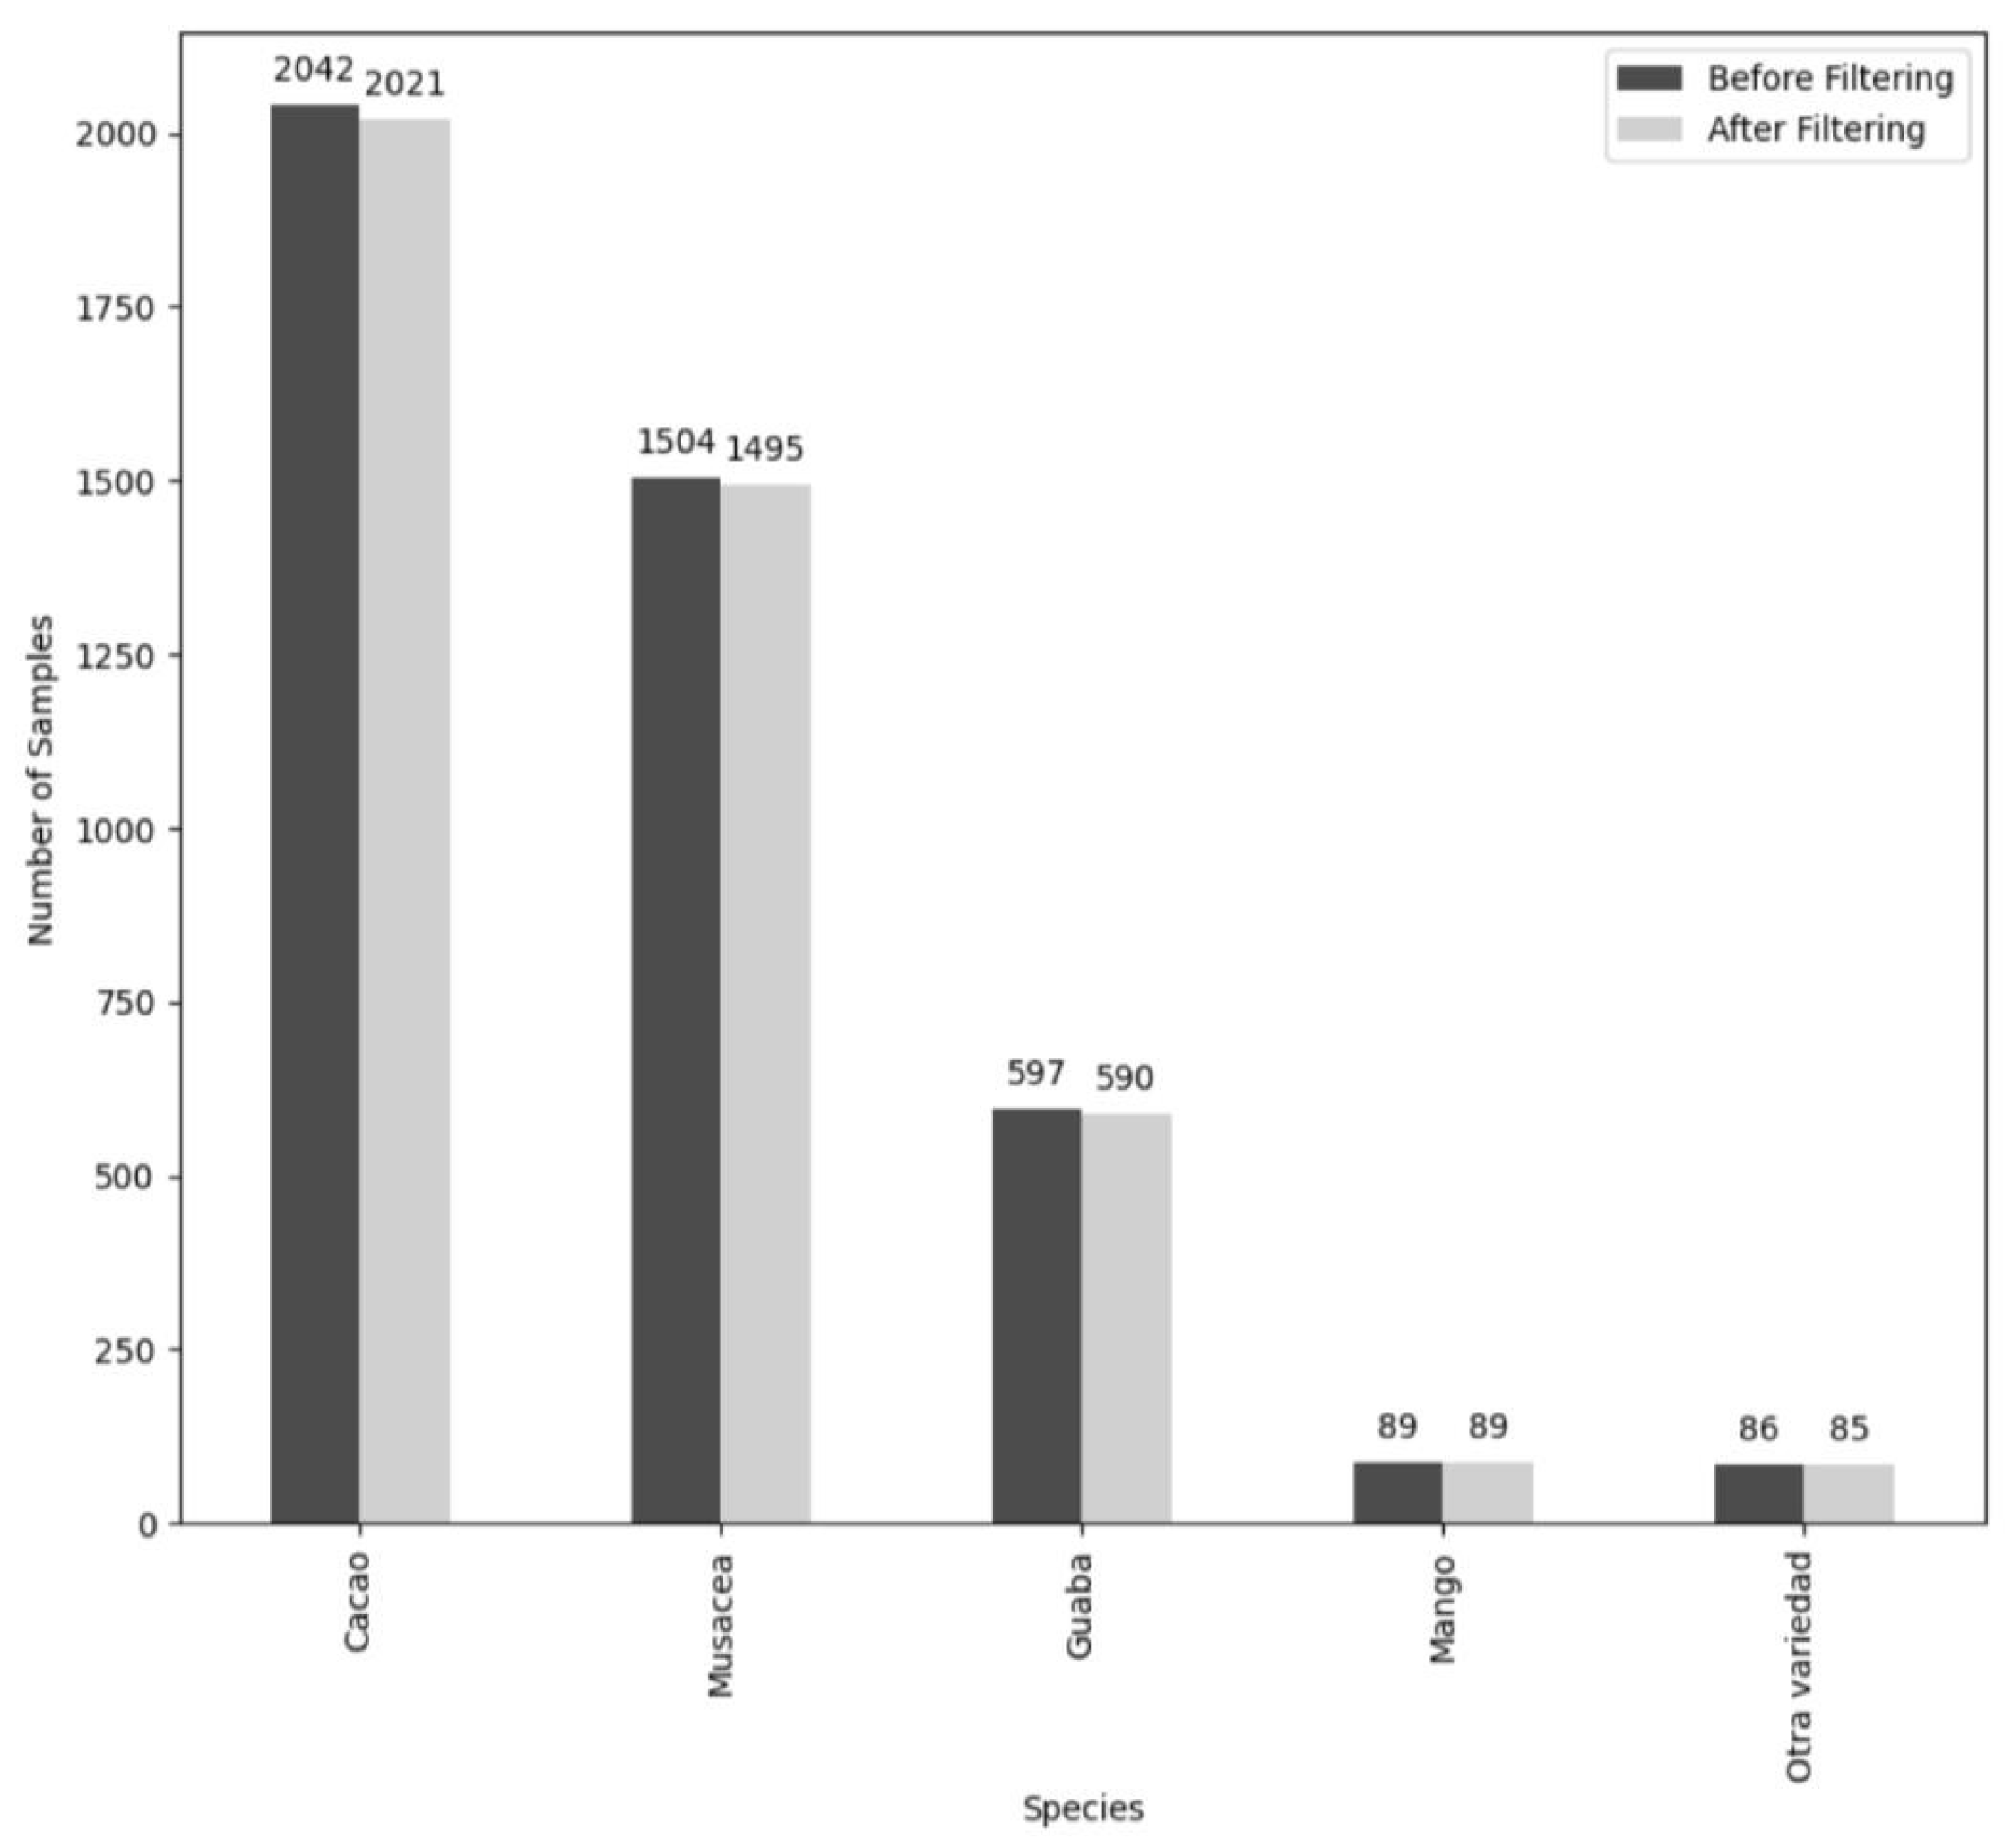
2.4. Preprocessing
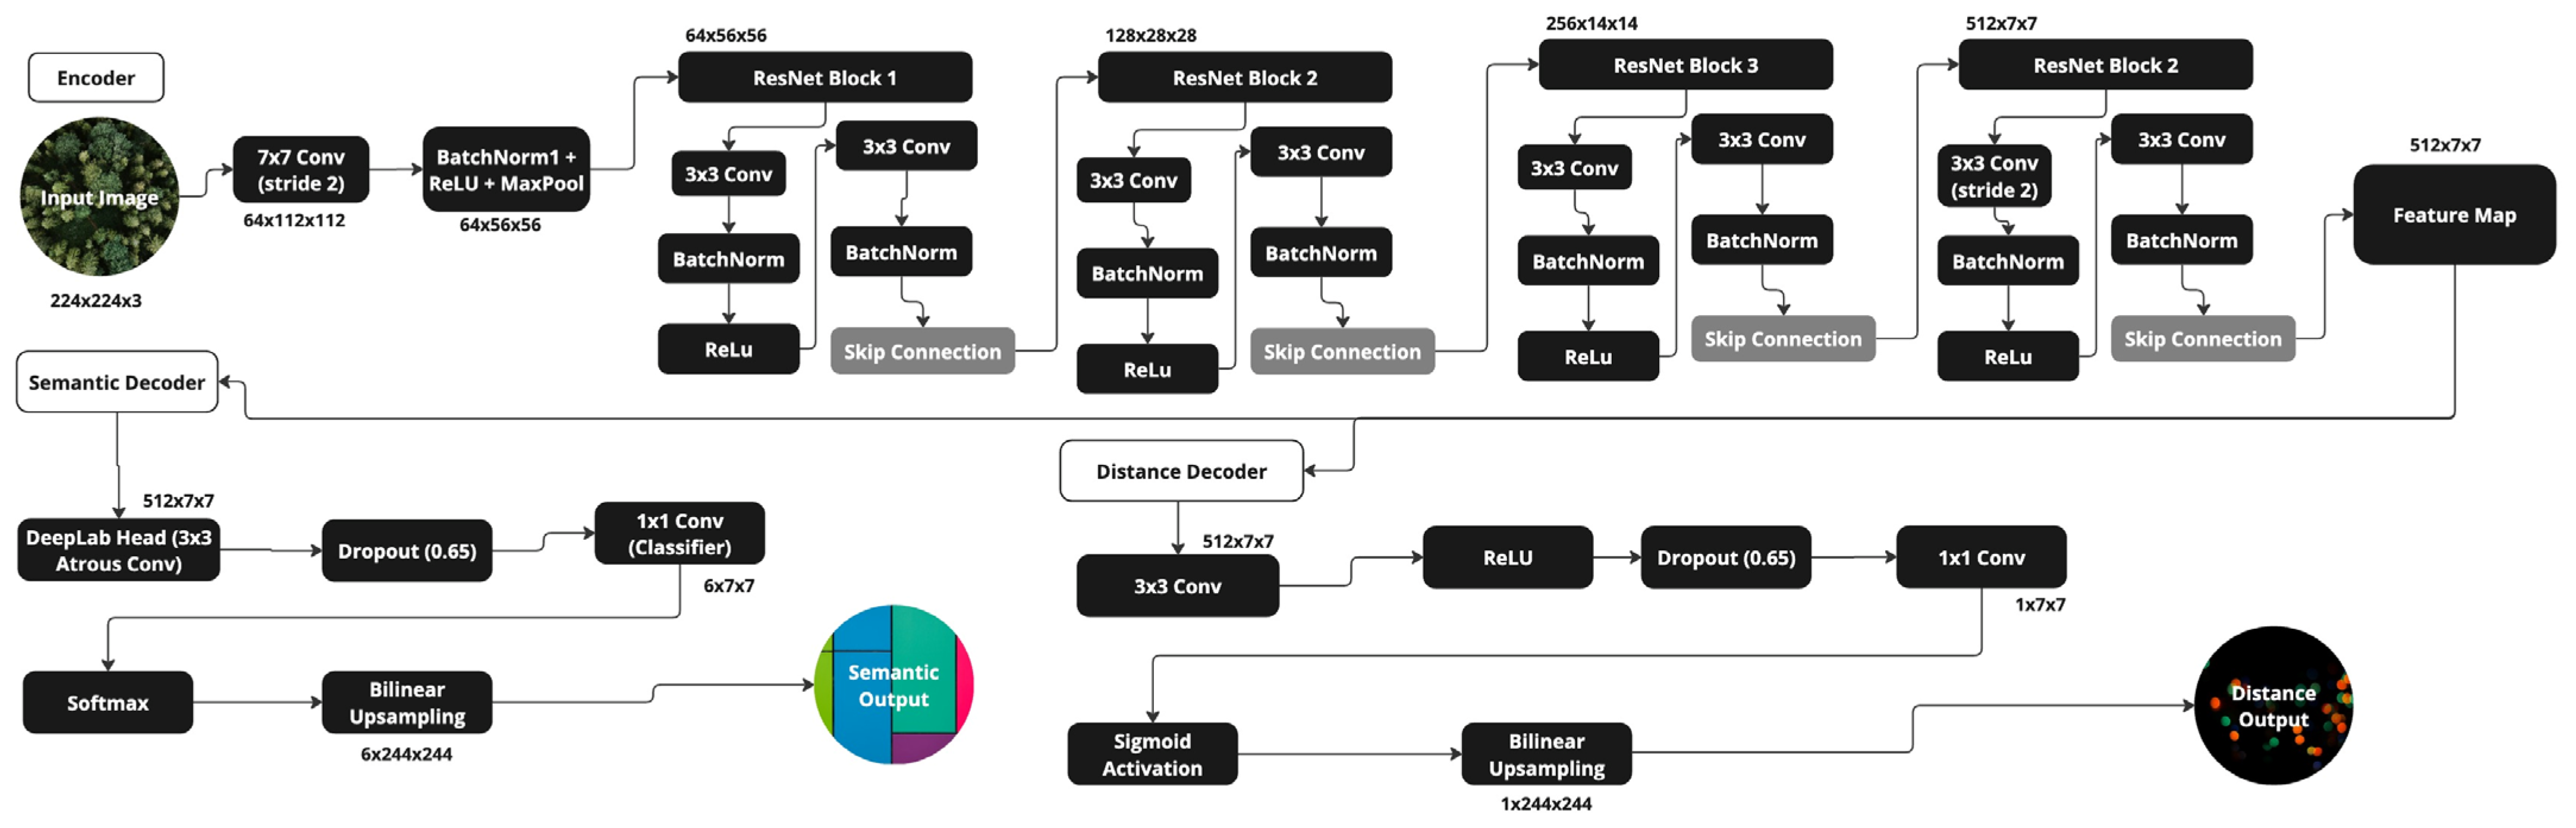
2.5. SEDD Architecture
2.5.1. Justification for SEDD Architecture
2.5.2. Encoder
2.5.3. Semantic Segmentation
2.5.4. Distance Regression
2.5.5. Loss Calculation
2.6. Experimental Setup
2.7. Post-Processing
2.7.1. DeepForest
2.7.2. Diameter Model
2.7.3. Custom Statistical Models and Carbon Sequestration Calculation
3. Results
3.1. Project Aims
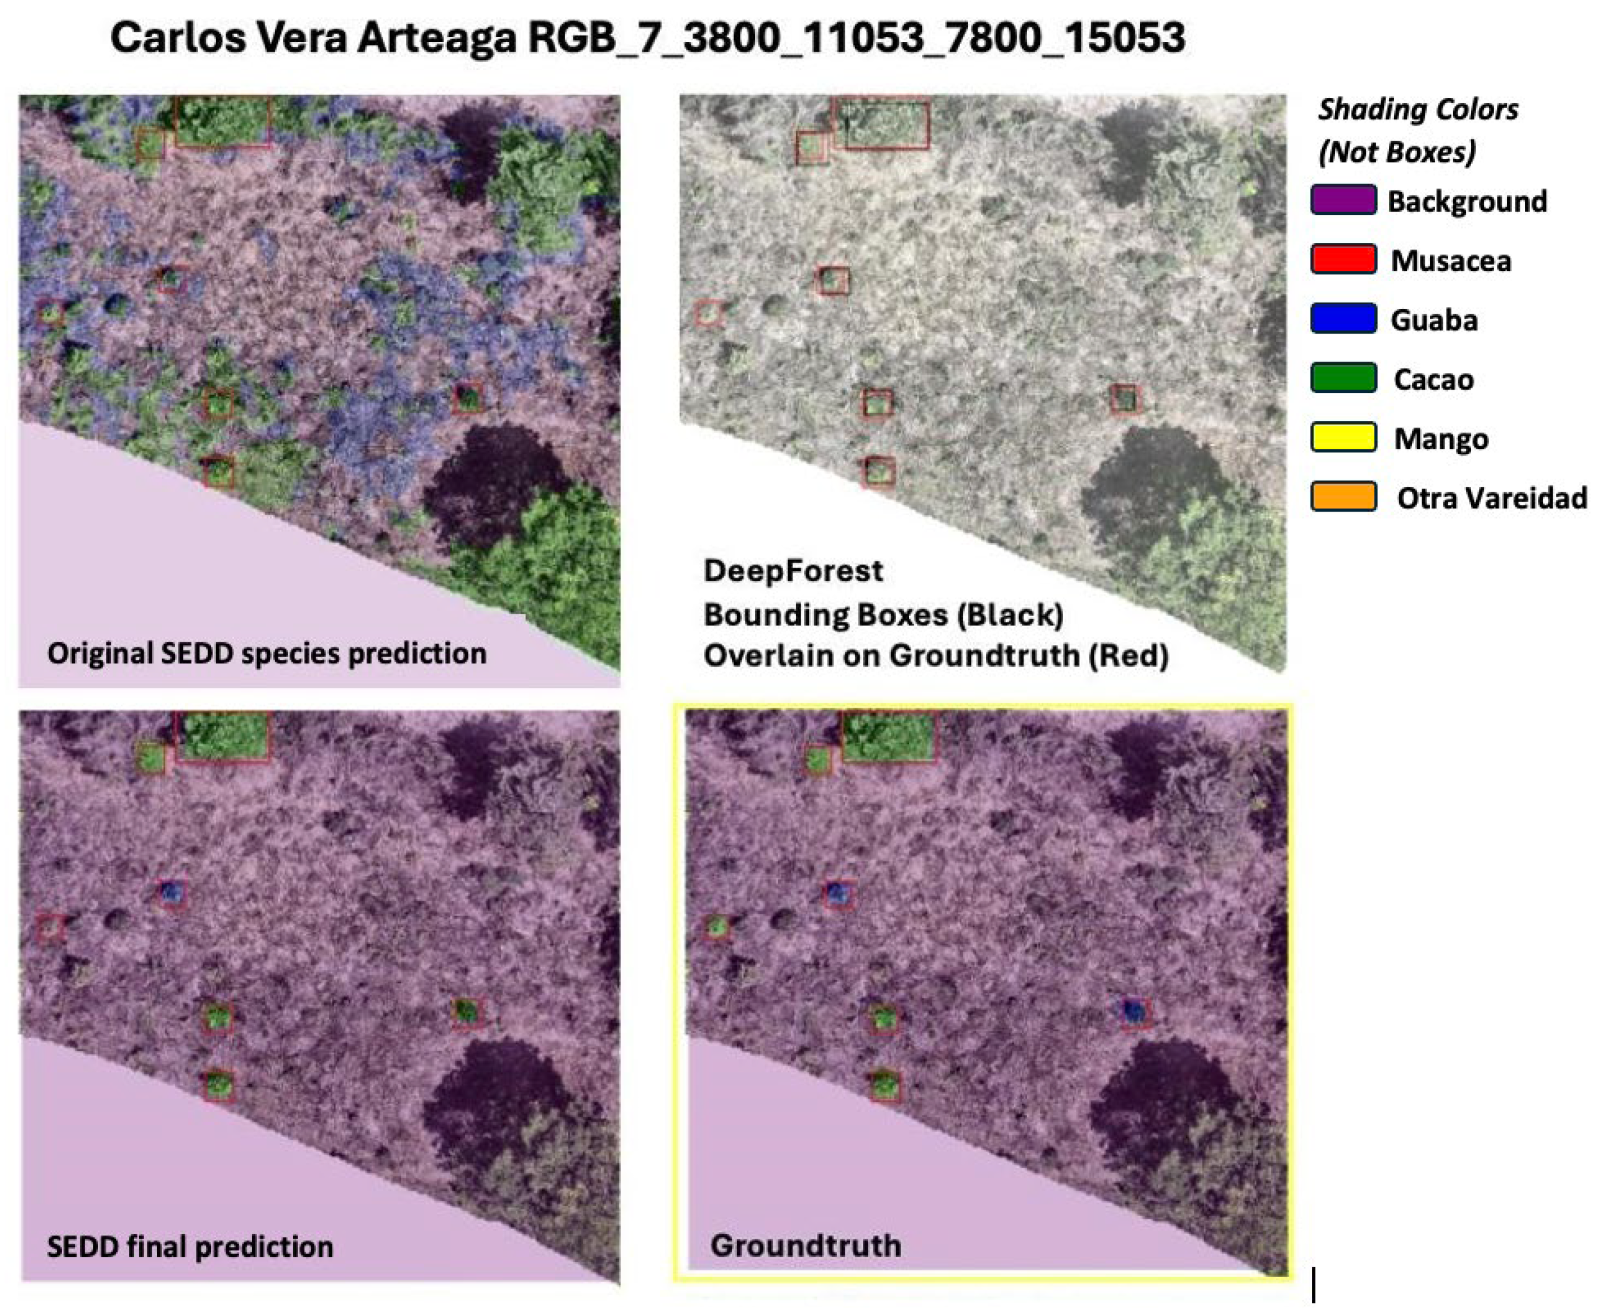
3.2. SEDD Model Results
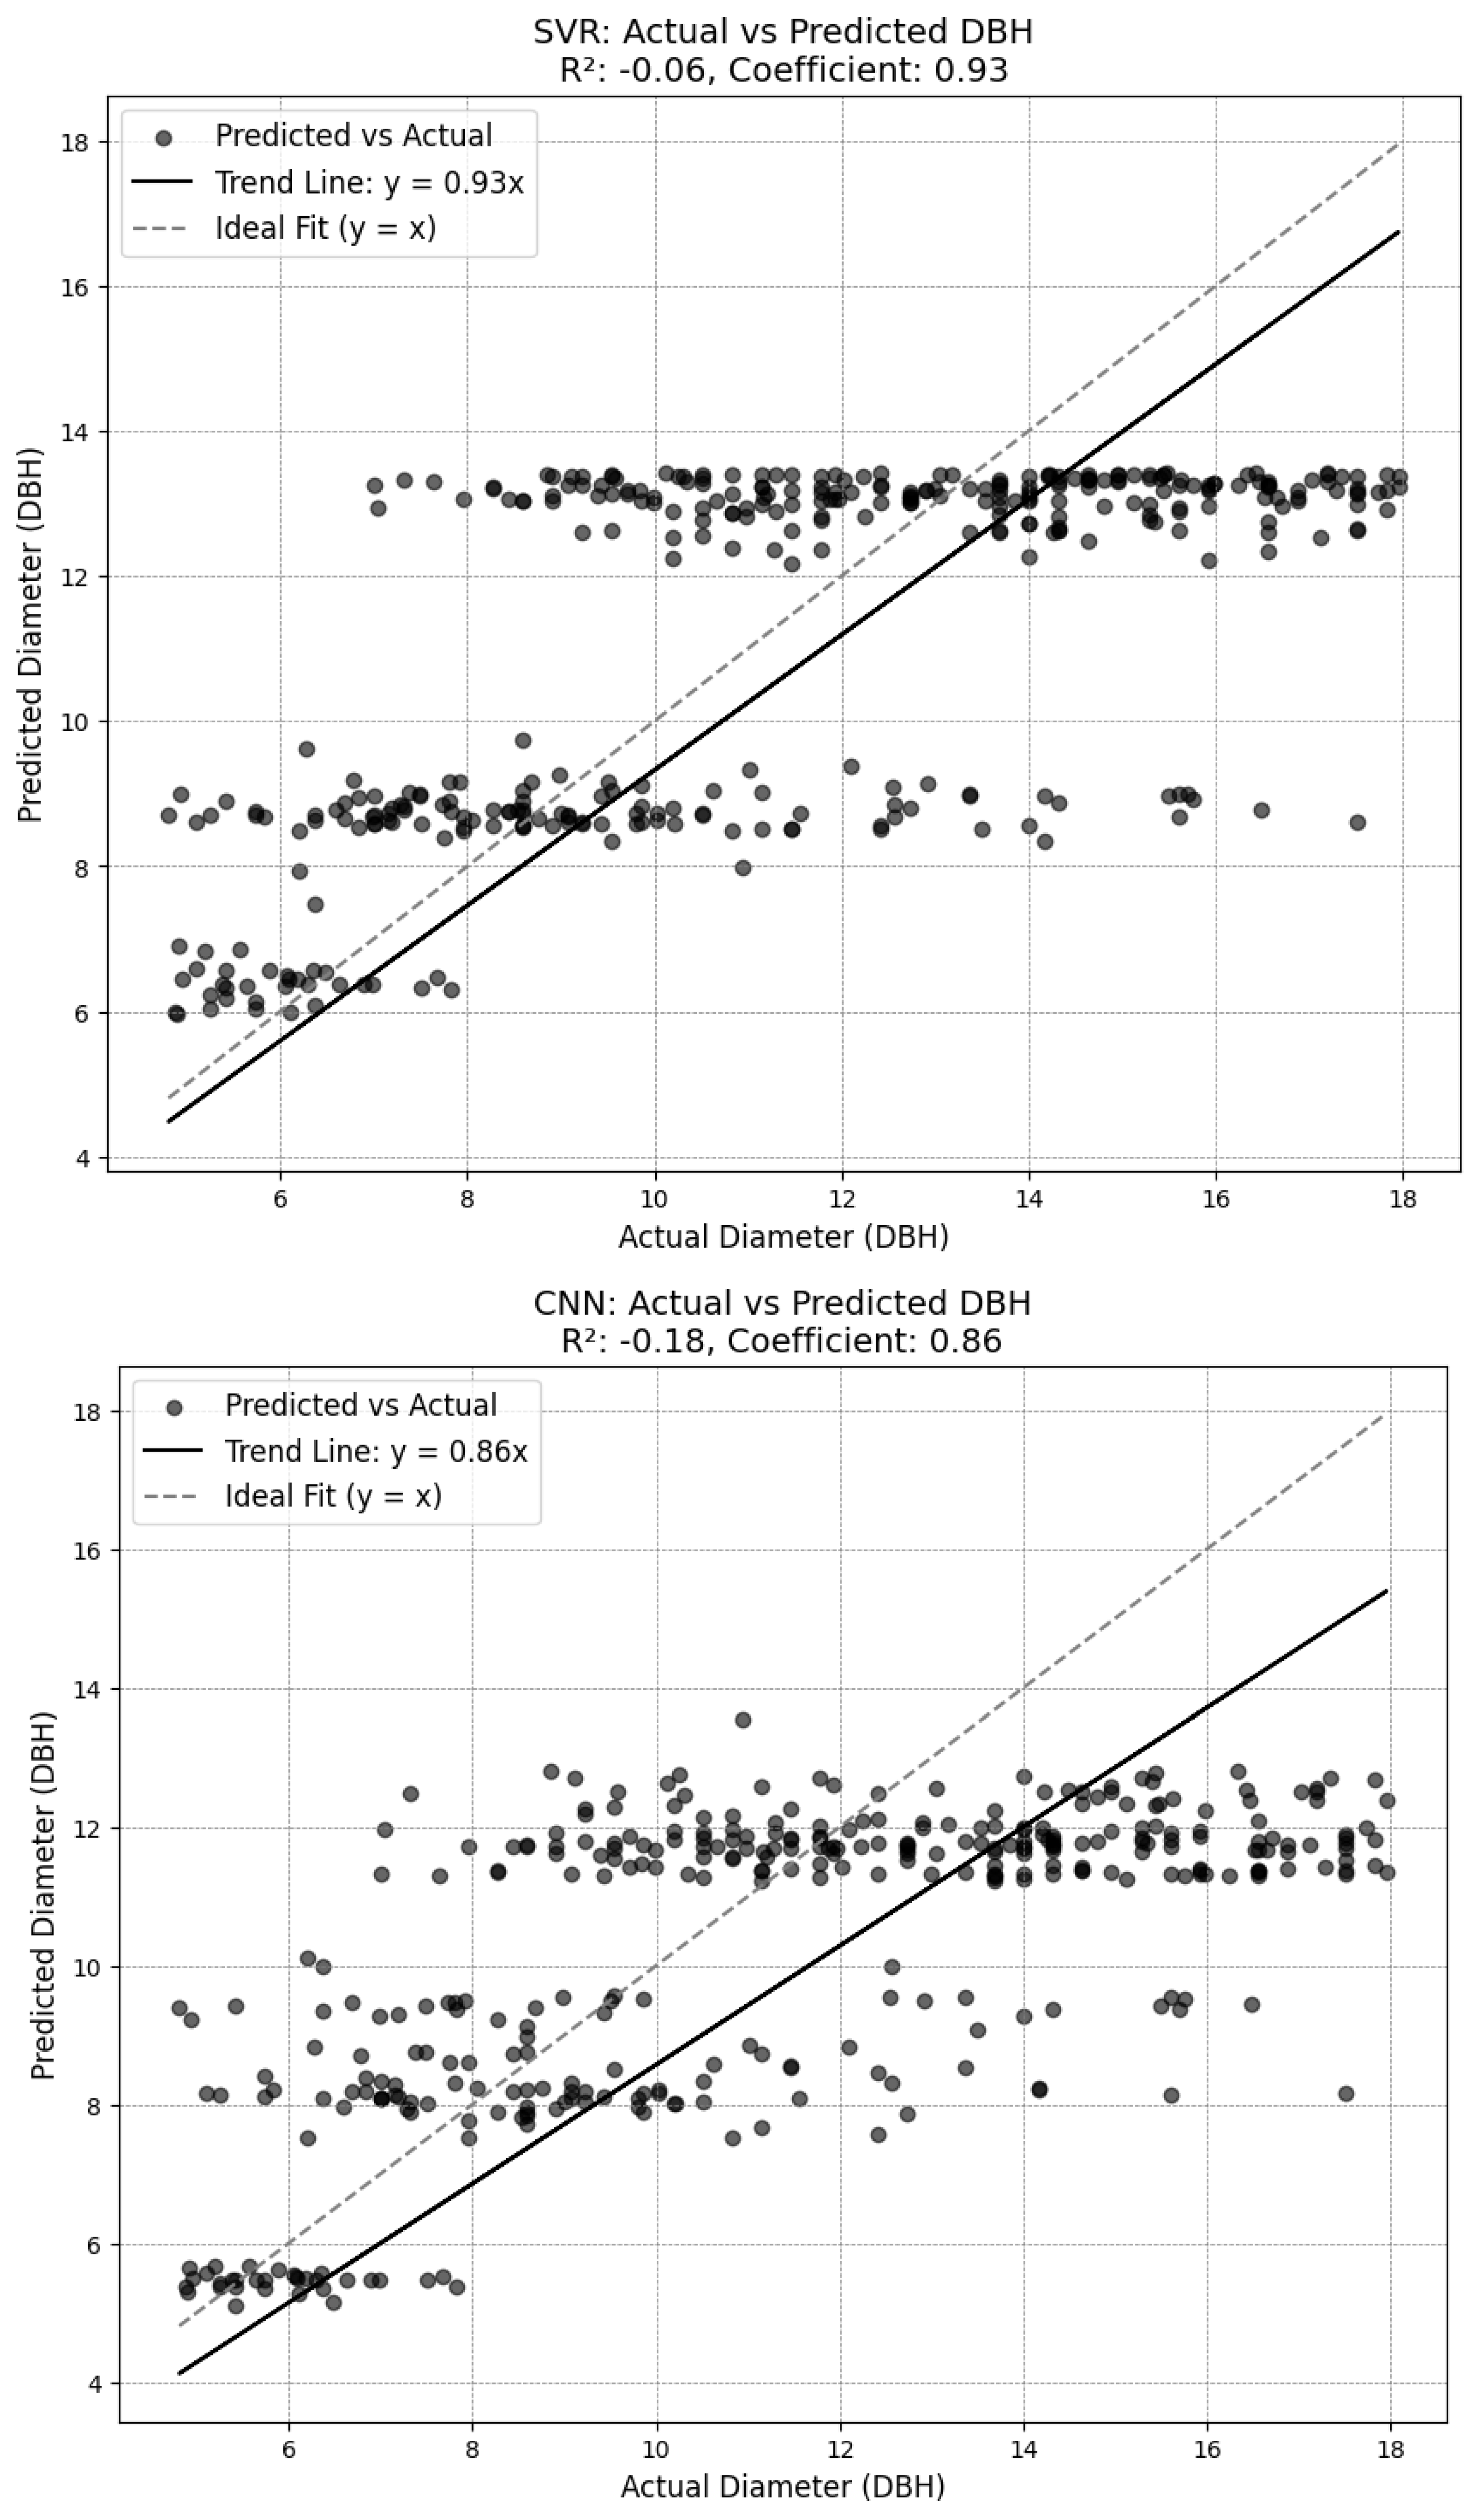
3.3. Diameter Results
3.4. Allometric Results
3.5. AGB and Carbon Sequestration Results
4. Discussion
4.1. SEDD Model Discussion
4.2. Post-Processing Discussion
4.3. Comparison of Final Results
4.4. Limitations
4.5. Next Steps
5. Conclusions
Author Contributions
Funding
Informed Consent Statement
Data Availability Statement
Acknowledgments
Conflicts of Interest
Appendix A

| Spanish Name | English Name |
|---|---|
| Cacao | Cacao |
| Musacea | Musaceae (commonly known as the banana tree) |
| Guaba | Guava |
| Mango | Mango |
| Otra Variedad | Other Variety |


| Log Log | Linear | Exponential | Logarithmic | Polynomial | GAM | |
|---|---|---|---|---|---|---|
| Musacea | 1.0 | 0.99 | 0.99 | 0.97 | 1.0 | 1.0 |
| Cacao | 1.0 | 0.99 | 0.98 | 0.95 | 1.0 | 1.0 |
| Guaba | 1.0 | 0.97 | 0.98 | 0.93 | 1.0 | 1.0 |
| Mango | 1.0 | 1.0 | 1.0 | 0.99 | 1.0 | 1.0 |
| Otra Variedad | 0.87 | 0.86 | 0.92 | 0.71 | 0.93 | 0.98 |
| Cacao | |||||||
| Mean Squared Error: 0.0000 R2 Score: 1.0000 GAM Summary: LinearGAM | |||||||
| Distribution: NormalDist Link Function: IdentityLink Number of Samples: 83 | Effective DoF: 9.4847 Log Likelihood: −1043592724.0811 AIC: 2087185469.1315 AICc: 2087185472.499 GCV: 0.0 Scale: 0.0 Pseudo R-Squared: 1.0 | ||||||
| Feature Function | Lambda | Rank | EDoF | p > x | Sig. Code | ||
| s(0) | 0.6 | 20 | 9.5 | 1.11 × 10⁻¹⁶ | 0 | ||
| Intercept | 1 | 0.0 | 1.11 × 10⁻¹⁶ | 0 | |||
| Guaba | |||||||
| Mean Squared Error: 0.0000 R2 Score: 1.0000 GAM Summary: LinearGAM | |||||||
| Distribution: NormalDist Link Function: IdentityLink Number of Samples: 319 | Effective DoF: 12.1432 Log Likelihood: −9752239.4131 AIC: 19504505.1125 AICc: 19504506.332 GCV: 0.0 Scale: 0.0 Pseudo R-Squared: 1.0 | ||||||
| Feature Function | Lambda | Rank | EDoF | p > x | Sig. Code | ||
| s(0) | 0.6 | 20 | 12.1 | 1.11 × 10⁻¹⁶ | 0 | ||
| Intercept | 1 | 0.0 | 1.11 × 10⁻¹⁶ | 0 | |||
| Mango | |||||||
| Mean Squared Error: 0.0000 R2 Score: 1.0000 GAM Summary: LinearGAM | |||||||
| Distribution: NormalDist Link Function: IdentityLink Number of Samples: 50 | Effective DoF: 8.357 Log Likelihood: −66169739.1487 AIC: 132339497.0114 AICc: 132339501.9006 GCV: 0.0 Scale: 0.0 Pseudo R-Squared: 1.0 | ||||||
| Feature Function | Lambda | Rank | EDoF | p > x | Sig. Code | ||
| s(0) | 0.6 | 20 | 8.4 | 1.11 × 10⁻¹⁶ | 0 | ||
| Intercept | 1 | 0.0 | 1.11 × 10⁻¹⁶ | 0 | |||
| Musacea | |||||||
| Mean Squared Error: 0.0000 R2 Score: 1.0000 GAM Summary: LinearGAM | |||||||
| Distribution: NormalDist Link Function: IdentityLink Number of Samples: 773 | Effective DoF: 13.7307 Log Likelihood: −5655390038.9665 AIC: 11310780107.3944 AICc: 11310780108.0064 GCV: 0.0 Scale: 0.0 Pseudo R-Squared: 1.0 | ||||||
| Feature Function | Lambda | Rank | EDoF | p > x | Sig. Code | ||
| s(0) | 0.6 | 20 | 13.7 | 1.11 × 10⁻¹⁶ | 0 | ||
| Intercept | 1 | 0.0 | 1.11 × 10⁻¹⁶ | 0 | |||
| Otra Vareidad | |||||||
| Mean Squared Error: 1.8291 R2 Score: 0.9754 GAM Summary: LinearGAM | |||||||
| Distribution: NormalDist Link Function: IdentityLink Number of Samples: 155 | Effective DoF: 9.983 Log Likelihood: −283.4332 AIC: 588.8324 AICc: 590.6729 GCV: 2.2096 Scale: 1.955 Pseudo R-Squared: 0.9754 | ||||||
| Feature Function | Lambda | Rank | EDoF | p > x | Sig. Code | ||
| s(0) | 0.6 | 20 | 10.0 | 1.11 × 10⁻¹⁶ | 0 | ||
| Intercept | 1 | 0.0 | 1.11 × 10⁻¹⁶ | 0 | |||
| Species | F1 | 31.90 |
| Precision | 68.43 | |
| Recall | 20.80 | |
| Distance | MSE | 0.0515 |
| Controlled for Species Matching | Actual Carbon | Predicted Carbon | Absolute Difference | Relative Difference |
|---|---|---|---|---|
| Carlos Vera Arteaga RGB_7_3800_11053_7800_15053.png | 44.77 | 28.33 | 16.44 | 0.37 |
| Carlos Vera Guevara RGB_10_7600_7600_11600_11600.png | 16.6 | 15.84 | 0.77 | 0.05 |
| Carlos Vera Guevara RGB_11_7600_8305_11600_12305.png | 6.64 | 6.74 | 0.09 | 0.01 |
| Flora Pluas RGB_14_7600_11578_11600_15578.png | 104.34 | 94.44 | 9.91 | 0.09 |
| Flora Pluas RGB_15_11400_0_15400_4000.png | 77.32 | 59.63 | 17.68 | 0.23 |
| Flora Pluas RGB_16_11400_3800_15400_7800.png | 151.21 | 126.18 | 25.03 | 0.17 |
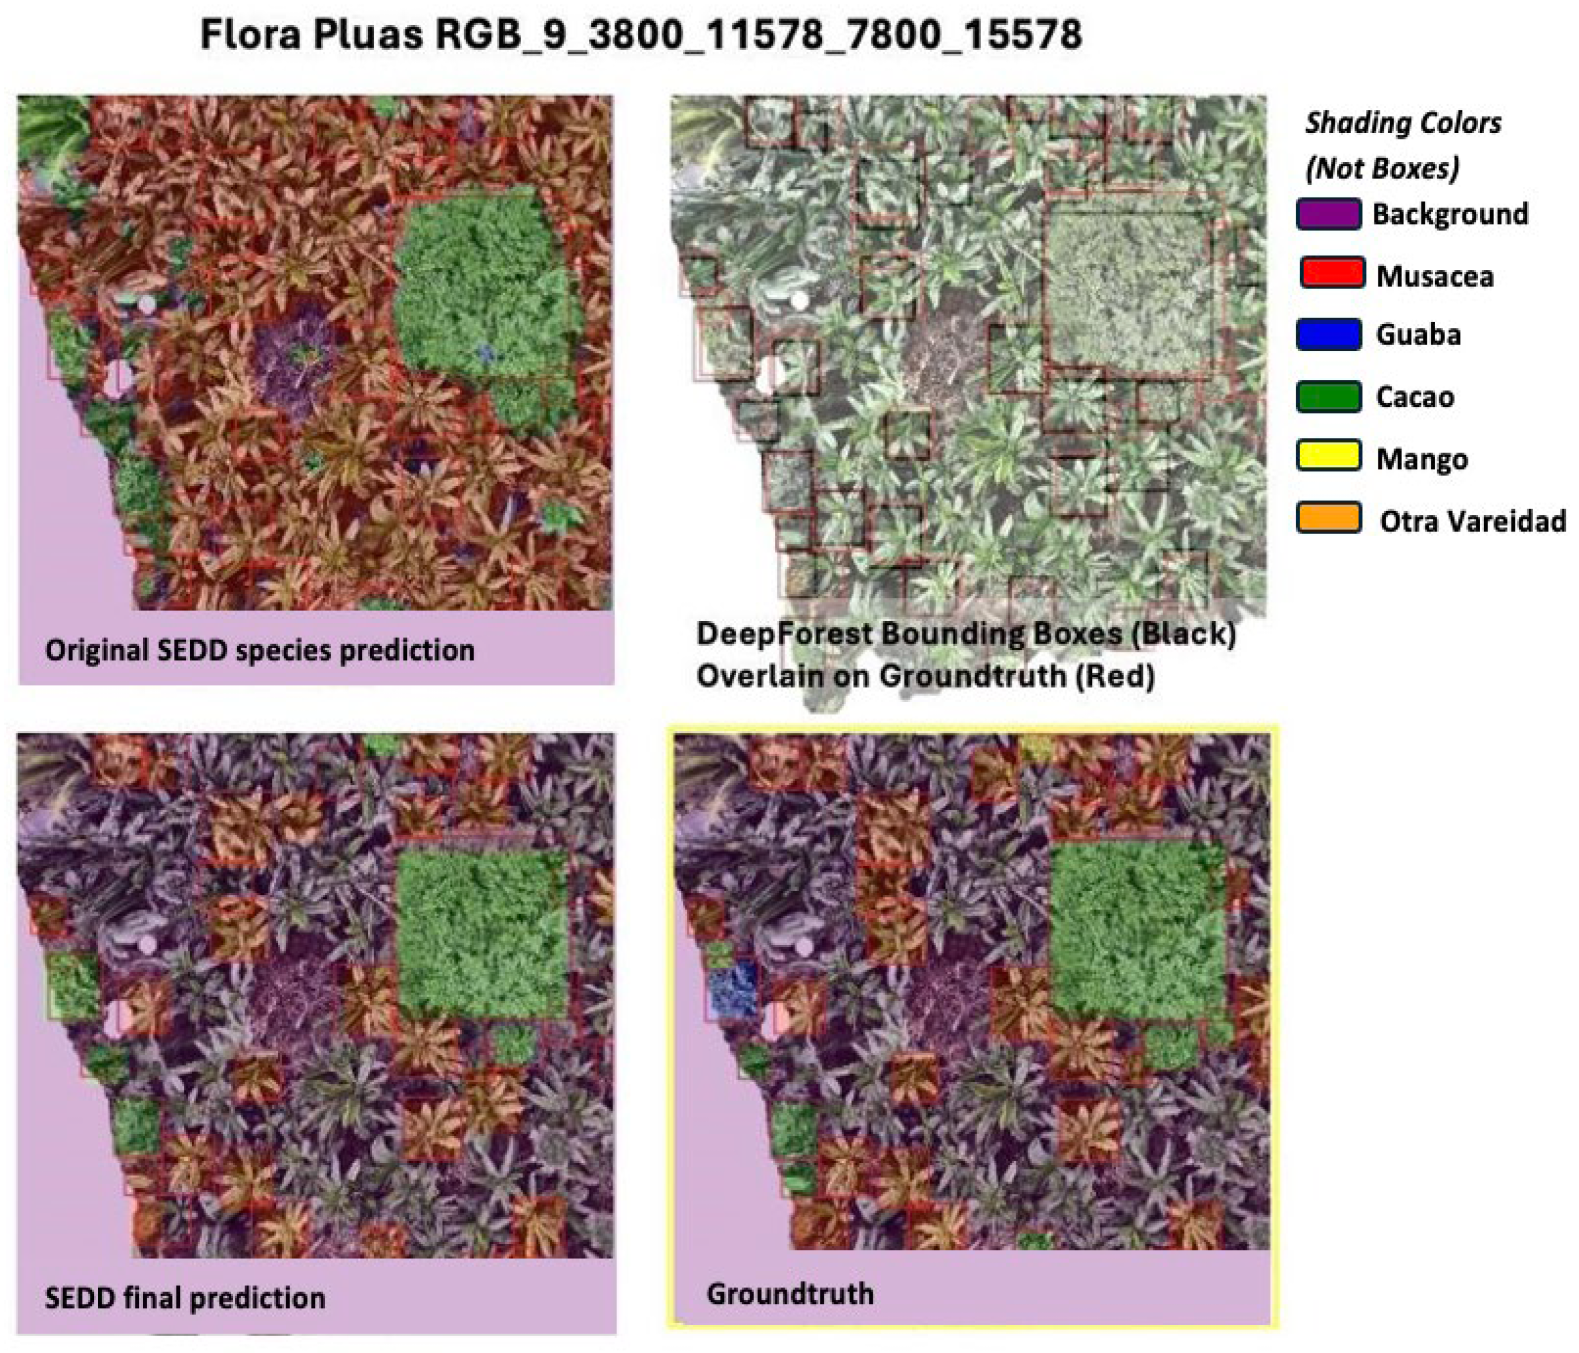
| Flora Pluas RGB_9_3800_11578_7800_15578.png | 98.03 | 73.82 | 24.2 | 0.25 |
| Leonor Aspiazu RGB_14_11400_7600_15400_11600.png | 16.69 | 20.84 | 4.16 | 0.25 |
| Leonor Aspiazu RGB_2_0_7600_4000_11600.png | 85.4 | 110.22 | 24.83 | 0.29 |
| Leonor Aspiazu RGB_6_3800_7600_7800_11600.png | 134.21 | 147.01 | 12.8 | 0.1 |
| Leonor Aspiazu RGB_9_7600_3800_11600_7800.png | 168.7 | 171.92 | 3.23 | 0.02 |
| Manuel Macias RGB_5_3800_6879_7800_10879.png | 17.85 | 18.28 | 0.42 | 0.02 |
| Manuel Macias RGB_8_7600_6879_11600_10879.png | 16.29 | 24.13 | 7.84 | 0.48 |
| Manuel Macias RGB_9_9748_0_13748_4000.png | 0.53 | 2.95 | 2.42 | 4.6 |
| Nestor Macias RGB_11_7600_9024_11600_13024.png | 109.8 | 102.34 | 7.46 | 0.07 |
| Nestor Macias RGB_8_7600_0_11600_4000.png | 153.05 | 162.52 | 9.47 | 0.06 |
| Total | 1201.4 | 1165.2 | 36.2 | 0.03 |
| Whole Test Dataset—Not Controlled for Species Matching | ||||
| Carlos Vera Arteaga RGB_7_3800_11053_7800_15053.png | 58.71 | 34.73 | −23.97 | 0.41 |
| Carlos Vera Guevara RGB_10_7600_7600_11600_11600.png | 62.98 | 23.82 | −39.16 | 0.62 |
| Carlos Vera Guevara RGB_11_7600_8305_11600_12305.png | 83.24 | 25.23 | −58.01 | 0.70 |
| Flora Pluas RGB_14_7600_11578_11600_15578.png | 112.19 | 95.00 | −17.19 | 0.15 |
| Flora Pluas RGB_15_11400_0_15400_4000.png | 169.07 | 84.34 | −84.73 | 0.50 |
| Flora Pluas RGB_16_11400_3800_15400_7800.png | 436.79 | 178.07 | −258.72 | 0.59 |
| Flora Pluas RGB_9_3800_11578_7800_15578.png | 159.10 | 90.61 | −68.49 | 0.43 |
| Leonor Aspiazu RGB_14_11400_7600_15400_11600.png | 28.91 | 32.66 | 3.75 | 0.13 |
| Leonor Aspiazu RGB_2_0_7600_4000_11600.png | 235.12 | 204.61 | −30.51 | 0.13 |
| Leonor Aspiazu RGB_6_3800_7600_7800_11600.png | 335.81 | 288.95 | −46.85 | 0.14 |
| Leonor Aspiazu RGB_9_7600_3800_11600_7800.png | 285.42 | 223.47 | −61.96 | 0.22 |
| Manuel Macias RGB_5_3800_6879_7800_10879.png | 41.27 | 41.32 | 0.05 | 0.00 |
| Manuel Macias RGB_8_7600_6879_11600_10879.png | 77.36 | 75.16 | −2.20 | 0.03 |
| Manuel Macias RGB_9_9748_0_13748_4000.png | 21.73 | 17.21 | −4.52 | 0.21 |
| Nestor Macias RGB_11_7600_9024_11600_13024.png | 154.21 | 118.31 | −35.89 | 0.23 |
| Nestor Macias RGB_8_7600_0_11600_4000.png | 307.34 | 214.95 | −92.39 | 0.30 |
| Total | 2569.25 | 1748.44 | 820.81 | 0.32 |
References
- Sun, W.; Liu, X. Review on carbon storage estimation of forest ecosystem and applications in China. For. Ecosyst. 2019, 7, 4. [Google Scholar]
- Intergovernmental Panel on Climate Change. Land–climate interactions. In Climate Change and Land: IPCC Special Report on Climate Change, Desertification, Land Degradation, Sustainable Land Management, Food Security, and Greenhouse Gas Fluxes in Terrestrial Ecosystems; Cambridge University Press: Cambridge, UK, 2022; pp. 131–247. [Google Scholar]
- Food and Agriculture Organization of the United Nations. Global Forest Resources Assessment 2020. Available online: https://www.fao.org/interactive/forest-resources-assessment/2020/en/ (accessed on 11 February 2024).
- Shi, H.; Tian, H.; Lange, S.; Yang, J.; Pan, S.; Fu, B.; Reyer, C.P.O. Terrestrial biodiversity threatened by increasing global aridity velocity under high-level warming. Proc. Natl. Acad. Sci. USA 2021, 118, e2015552118. [Google Scholar] [CrossRef]
- Haya, B.K.; Evans, S.; Brown, L.; Bukoski, J.; Butsic, V.; Cabiyo, B.; Jacobson, R.; Kerr, A.; Potts, M.; Sanchez, D.L. Comprehensive review of carbon quantification by improved forest management offset protocols. Front. For. Glob. Change 2023, 6, 958879. [Google Scholar] [CrossRef]
- Badgley, G.; Freeman, J.; Hamman, J.J.; Haya, B.; Trugman, A.T.; Anderegg, W.R.L.; Cullenward, D. Systematic over-crediting in California’s forest carbon offsets program. Glob. Change Biol. 2022, 28, 1433–1445. [Google Scholar] [CrossRef]
- Spawn, S.A.; Sullivan, C.C.; Lark, T.J.; Gibbs, H.K. Harmonized global maps of above and belowground biomass carbon density in the year 2010. Sci. Data 2020, 7, 112. [Google Scholar] [CrossRef]
- Santoro, M.; Cartus, O.; Carvalhais, N.; Rozendaal, D.M.A.; Avitabile, V.; Araza, A.; de Bruin, S.; Herold, M.; Quegan, S.; Rodríguez-Veiga, P.; et al. The global forest above-ground biomass pool for 2010 estimated from high-resolution satellite observations. Earth Syst. Sci. Data 2021, 13, 3927–3950. [Google Scholar]
- Fassnacht, F.E.; Latifi, H.; Stereńczak, K.; Modzelewska, A.; Lefsky, M.; Waser, L.T.; Straub, C.; Ghosh, A. Review of studies on tree species classification from remotely sensed data. Remote Sens. Environ. 2016, 186, 64–87. [Google Scholar]
- Korznikov, K.A.; Kislov, D.E.; Altman, J.; Doležal, J.; Vozmishcheva, A.S.; KRESTOV, P.V. Using U-Net-like deep convolutional neural networks for precise tree recognition in very high resolution RGB (red, green, blue) satellite images. Forests 2021, 12, 66. [Google Scholar] [CrossRef]
- MODIS Science Team. MODIS—Moderate Resolution Imaging Spectroradiometer. Available online: https://modis.gsfc.nasa.gov/ (accessed on 27 February 2025).
- Planet Team. Planet Basemaps—High-Frequency, Global Satellite Imagery. Available online: https://www.planet.com/products/basemap/ (accessed on 27 February 2025).
- Global Forest Watch Dataset. Available online: https://data.globalforestwatch.org/ (accessed on 11 February 2024).
- Klein, L.; Zhou, W.; Albrecht, C. Quantification of carbon sequestration in urban forests. arXiv 2021, arXiv:2106.00182. [Google Scholar]
- Yuan, X.; Liu, S.; Feng, W.; Dauphin, G. Feature Importance Ranking of Random Forest-Based End-to-End Learning Algorithm. Remote Sens. 2023, 15, 5203. [Google Scholar] [CrossRef]
- Bartold, M.; Kluczek, M. A machine learning approach for mapping chlorophyll fluorescence at inland wetlands. Remote Sens. 2023, 15, 2392. [Google Scholar] [CrossRef]
- Braga, G.J.R.; Peripato, V.; Dalagnol, R.; Ferreira, M.P.; Tarabalka, Y.; Aragão, L.E.O.C.; de Campos Velho, H.F.; Shiguemori, E.H.; Wagner, F.H. Tree crown delineation algorithm based on a convolutional neural network. Remote Sens. 2020, 12, 1288. [Google Scholar] [CrossRef]
- Wu, J.; Yang, G.; Yang, H.; Zhu, Y.; Li, Z.; Lei, L.; Zhao, C. Extracting apple tree crown information from remote imagery using deep learning. Comput. Electron. Agric. 2020, 174, 105504. [Google Scholar] [CrossRef]
- Weinstein, B.G.; Marconi, S.; Bohlman, S.A.; Zare, A.; White, E.P. Cross-site learning in deep learning RGB tree crown detection. Ecol. Inform. 2020, 56, 101061. [Google Scholar] [CrossRef]
- Lassalle, G.; Ferreira, M.P.; La Rosa, L.E.C.; de Souza Filho, C.R. Deep learning-based individual tree crown delineation in mangrove forests using very-high-resolution satellite imagery. ISPRS J. Photogramm. Remote Sens. 2022, 189, 220–235. [Google Scholar] [CrossRef]
- Sothe, C.; Dalponte, M.; Almeida, C.M.; Schimalski, M.B.; Lima, C.L.; Liesenberg, V.; Miyoshi, G.T.; Tommaselli, A.M. Tree species classification in a highly diverse subtropical forest integrating UAV-based photogrammetric point cloud and hyperspectral data. Remote Sens. 2019, 11, 1338. [Google Scholar] [CrossRef]
- Martins, G.B.; La Rosa, L.E.C.; Happ, P.N.; Filho, L.C.T.C.; Santos, C.J.F.; Feitosa, R.Q.; Ferreira, M.P. Deep learning-based tree species mapping in a highly diverse tropical urban setting. Urban For. Urban Green. 2021, 64, 127241. [Google Scholar] [CrossRef]
- Ferreira, M.P.; Almeida, D.R.A.D.; Papa, D.D.A.; Minervino, J.B.S.; Veras, H.F.P.; Formighieri, A.; Santos, C.A.N.; Ferreira, M.A.D.; Figueiredo, E.O.; Ferreira, E.J.L. Individual tree detection and species classification of Amazonian palms using UAV images and deep learning. For. Ecol. Manag. 2020, 475, 118397. [Google Scholar] [CrossRef]
- Reiersen, G.; Dao, D.; Lütjens, B.; Klemmer, K.; Amara, K.; Steinegger, A.; Zhang, C.; ZHU, X. ReforesTree: A dataset for estimating tropical forest carbon stock with deep learning and aerial imagery. Proc. AAAI Conf. Artif. Intell. 2022, 36, 12119–12125. [Google Scholar] [CrossRef]
- Weinstein, B.G.; Marconi, S.; Aubrykientz, M.; Vincent, G.; Senyondo, H.; White, E.P. DeepForest: A Python package for RGB deep learning tree crown delineation. Methods Ecol. Evol. 2020, 11, 1743–1751. [Google Scholar] [CrossRef]
- Zuiderveld, K.J. Contrast limited adaptive histogram equalization. Graph. Gems 1994, 4, 474–485. [Google Scholar]
- La Rosa, L.E.C.; Sothe, C.; Feitosa, R.Q.; de Almeida, C.M.; Schimalski, M.B.; Oliveira, D.A.B. Multi-task fully convolutional network for tree species mapping in dense forests using small training hyperspectral data. ISPRS J. Photogramm. Remote Sen. 2021, 179, 35–49. [Google Scholar] [CrossRef]
- He, K.; Zhang, X.; Ren, S.; Sun, J. Deep residual learning for image recognition. In Proceedings of the IEEE Conference on Computer Vision and Pattern Recognition, Las Vegas, NV, USA, 28 June 2016. [Google Scholar]
- Chen, L.C.; Papandreou, G.; Kokkinos, I.; Murphy, K.; Yuille, A.L. DeepLab: Semantic image segmentation with deep convolutional nets, Atrous convolution, and fully connected CRFs. IEEE Trans. Pattern Anal. Mach. Intell. 2018, 40, 834–848. [Google Scholar] [CrossRef]
- Lin, T.-Y.; Goyal, P.; Girshick, R.; He, K.; Dollar, P. Focal loss for dense object detection. In Proceedings of the IEEE International Conference on Computer Vision, Venice, Italy, 22 October 2017. [Google Scholar]
- Luo, M.; Tian, Y.; Zhang, S.; Huang, L.; Wang, H.; Liu, Z.; Yang, L. Individual tree detection in coal mine afforestation area based on improved faster RCNN in UAV RGB images. Remote Sens. 2022, 14, 5545. [Google Scholar] [CrossRef]
- Segura, M.; Kanninen, M.; Suárez, D. Allometric models for estimating aboveground biomass of shade trees and coffee bushes grown together. Agrofor. Syst. 2006, 68, 143–150. [Google Scholar] [CrossRef]
- Qi, Y.; Wei, W.; Chen, C.; Chen, L. Plant root-shoot biomass allocation over diverse biomes: A global synthesis. Glob. Ecol. Conserv. 2019, 18, e00606. [Google Scholar] [CrossRef]
- Vashum, K.T.; Jayakumar, S. Methods to estimate above-ground biomass and carbon stock in natural forests-a review. J. Ecosyst. Ecography 2012, 2, 1–7. [Google Scholar] [CrossRef]
- GlobWetland. GlobWetland-Africa. Available online: http://globwetland-africa.org/ (accessed on 10 March 2025).
- POLWET. Integrated non-C02 Greenhouse Gas Observing System. Available online: https://www.ingos-infrastructure.eu/polwet-2/ (accessed on 10 March 2025).


| Species Name | Total ITCs | Percent of Data |
|---|---|---|
| Cacao | 2021 | 43.54 |
| Musacea | 1504 | 32.41 |
| Guaba | 597 | 12.87 |
| Otra Variedad (includes all other species in dataset) | 428 | 9.22 |
| Mango | 89 | 1.92 |
| Tile Name | Before | After |
|---|---|---|
| Carlos Vera Arteaga RGB_7_3800_11053_7800_15053 | 96.7 | 99.1 |
| Carlos Vera Guevara RGB_10_7600_7600_11600_11600 | 68.9 | 99.2 |
| Carlos Vera Guevara RGB_11_7600_8305_11600_12305 | 88.4 | 99.4 |
| Flora Pluas RGB_14_7600_11578_11600_15578 | 80.1 | 91.6 |
| Flora Pluas RGB_15_11400_0_15400_4000 | 87.3 | 91.0 |
| Flora Pluas RGB_16_11400_3800_15400_7800 | 47.5 | 75.6 |
| Flora Pluas RGB_9_3800_11578_7800_15578 | 84.4 | 86.6 |
| Leonor Aspiazu RGB_14_11400_7600_15400_11600 | 79.9 | 85.2 |
| Leonor Aspiazu RGB_2_0_7600_4000_11600 | 75.9 | 78.0 |
| Leonor Aspiazu RGB_6_3800_7600_7800_11600 | 25.4 | 59.7 |
| Leonor Aspiazu RGB_9_7600_3800_11600_7800 | 61.6 | 78.6 |
| Manuel Macias RGB_5_3800_6879_7800_10879 | 75.0 | 82.8 |
| Manuel Macias RGB_8_7600_6879_11600_10879_4000 | 44.5 | 76.1 |
| Manuel Macias RGB_9_9748_0_13748_ | 81.2 | 84.1 |
| Nestor Macias RGB_11_7600_9024_11600_13024 | 88.2 | 91.2 |
| Nestor Macias RGB_8_7600_0_11600_4000 | 73.2 | 84.7 |
| Average | 72.4 | 85.2 |
| Species Name | Total # in Test Set | % Correctly Identified by Model |
|---|---|---|
| Musacea | 181 | 91.7 |
| Cacao | 198 | 81.3 |
| Guaba | 50 | 2.0 |
| Mango | 3 | 0.0 |
| Otra | 51 | 0.0 |
| Variedad | ||
| Total | 483 | 67.9 |
| Tile Name | Actual Carbon | Predicted Carbon | Absolute Difference | Relative Difference |
|---|---|---|---|---|
| Carlos Vera Arteaga RGB_7_3800_11053_7800_15053.png | 46.16 | 36.73 | 9.43 | 0.2 |
| Carlos Vera Guevara RGB_10_7600_7600_11600_11600.png | 16.6 | 15.84 | 0.77 | 0.05 |
| Carlos Vera Guevara RGB_11_7600_8305_11600_12305.png | 6.64 | 6.74 | 0.09 | 0.01 |
| Flora Pluas RGB_14_7600_11578_11600_15578.png | 104.34 | 94.44 | 9.91 | 0.09 |
| Flora Pluas RGB_15_11400_0_15400_4000.png | 88.1 | 68.13 | 19.97 | 0.23 |
| Flora Pluas RGB_16_11400_3800_15400_7800.png | 157.86 | 131.07 | 26.79 | 0.17 |
| Flora Pluas RGB_9_3800_11578_7800_15578.png | 93.55 | 71.39 | 22.16 | 0.24 |
| Leonor Aspiazu RGB_14_11400_7600_15400_11600.png | 16.69 | 20.84 | 4.16 | 0.25 |
| Leonor Aspiazu RGB_2_0_7600_4000_11600.png | 87.63 | 113.82 | 26.19 | 0.3 |
| Leonor Aspiazu RGB_6_3800_7600_7800_11600.png | 134.21 | 147.01 | 12.8 | 0.1 |
| Leonor Aspiazu RGB_9_7600_3800_11600_7800.png | 168.7 | 171.92 | 3.23 | 0.02 |
| Manuel Macias RGB_5_3800_6879_7800_10879.png | 17.85 | 18.28 | 0.42 | 0.02 |
| Manuel Macias RGB_8_7600_6879_11600_10879.png | 16.29 | 24.13 | 7.84 | 0.48 |
| Manuel Macias RGB_9_9748_0_13748_4000.png | 0.53 | 2.95 | 2.42 | 4.6 |
| Nestor Macias RGB_11_7600_9024_11600_13024.png | 106.47 | 99.9 | 6.57 | 0.06 |
| Nestor Macias RGB_8_7600_0_11600_4000.png | 160.42 | 166.26 | 5.84 | 0.04 |
| Total | 1222.04 | 1189.45 | 32.59 | 0.02 |
| ReforesTree Site No | GFW 2019 | Spawn 2020 | Santoro 2021 | Reierson 2022 |
|---|---|---|---|---|
| 1 | 10.3 | 9.5 | 0.75 | 0.13 |
| 2 | 5.6 | 5.8 | 0.2 | 0.46 |
| 3 | 1.5 | 2.3 | 0.9 | 0.5 |
| 4 | 0.8 | 15.4 | 1.4 | 0.27 |
| 5 | 4.2 | 4.1 | 0.0 | 0.27 |
| 6 | 1.5 | 1.91 | 0.33 | 0.25 |
| Total | 4.0 | 5.25 | 0.34 | 0.02 |
Disclaimer/Publisher’s Note: The statements, opinions and data contained in all publications are solely those of the individual author(s) and contributor(s) and not of MDPI and/or the editor(s). MDPI and/or the editor(s) disclaim responsibility for any injury to people or property resulting from any ideas, methods, instructions or products referred to in the content. |
© 2025 by the authors. Licensee MDPI, Basel, Switzerland. This article is an open access article distributed under the terms and conditions of the Creative Commons Attribution (CC BY) license (https://creativecommons.org/licenses/by/4.0/).
Share and Cite
Ray, G.; Singh, M. Tropical Forest Carbon Accounting Through Deep Learning-Based Species Mapping and Tree Crown Delineation. Geomatics 2025, 5, 15. https://doi.org/10.3390/geomatics5010015
Ray G, Singh M. Tropical Forest Carbon Accounting Through Deep Learning-Based Species Mapping and Tree Crown Delineation. Geomatics. 2025; 5(1):15. https://doi.org/10.3390/geomatics5010015
Chicago/Turabian StyleRay, Georgia, and Minerva Singh. 2025. "Tropical Forest Carbon Accounting Through Deep Learning-Based Species Mapping and Tree Crown Delineation" Geomatics 5, no. 1: 15. https://doi.org/10.3390/geomatics5010015
APA StyleRay, G., & Singh, M. (2025). Tropical Forest Carbon Accounting Through Deep Learning-Based Species Mapping and Tree Crown Delineation. Geomatics, 5(1), 15. https://doi.org/10.3390/geomatics5010015