Article

Monitoring the Net Primary Productivity of Togo’s Ecosystems in Relation to Changes in Precipitation and Temperature

1
Laboratory of Botany and Plant Ecology, Department of Botany, Faulty of Sciences, University of Lomé, Lomé 01 BP 1515, Togo
2
Institute for Botany and Botanical Garden, Faculty of Biology, University of Belgrade, Takovska 43, 11000 Belgrade, Serbia
3
Center for Ecological Forecasting and Global Change, College of Forestry, Northwest Agriculture and Forestry University, Yangling 712100, China
4
Qinling National Forest Ecosystem Research Station, Yangling 712100, China
5
State Key Laboratory of Efficient Production of Forest Resources, Beijing Forestry University, Beijing 100107, China
*
Author to whom correspondence should be addressed.
Geomatics 2024, 4(3), 342-361; https://doi.org/10.3390/geomatics4030018
Submission received: 19 August 2024 / Revised: 11 September 2024 / Accepted: 13 September 2024 / Published: 18 September 2024

Abstract

:
Climate variability significantly impacts plant growth, making it crucial to monitor ecosystem performance for optimal carbon sequestration, especially in the context of rising atmospheric CO2 levels. Net Primary Productivity (NPP), which measures the net carbon flux between the atmosphere and plants, serves as a key indicator. This study uses the CASA (Carnegie–Ames–Stanford Approach) model, a radiation use efficiency method, to assess the spatio-temporal dynamics of NPP in Togo from 1987 to 2022 and its climatic drivers. The average annual NPP over 36 years is 4565.31 Kg C ha−1, with notable extremes in 2017 (6312.26 Kg C ha−1) and 1996 (3394.29 Kg C ha−1). Productivity in natural formations increased between 2000 and 2022. While climate change and land use negatively affect Total Production (PT) from 2000 to 2022, they individually enhance NPP variation (58.28% and 188.63%, respectively). NPP shows a strong positive correlation with light use efficiency (r2 = 0.75) and a moderate one with actual evapotranspiration (r2 = 0.43). Precipitation and potential evapotranspiration have weaker correlations (r2 = 0.20; 0.10), and temperature shows almost none (r2 = 0.05). These findings contribute to understanding ecosystem performance, supporting Togo’s climate commitments.

1. Introduction

Vegetation is of great importance in the interaction between the biosphere and the atmosphere as it helps modulate regional and global climate [1,2,3,4]. From 1980 to today, Earth has experienced dramatic environmental changes, particularly in terms of climate [5]. Human activities, such as slash-and-burn agriculture, logging, grazing, fishing, intensive livestock farming, urbanization coupled with climate change, directly alter the structure and functioning of ecosystems. This situation has led to an increase in the number of protected areas worldwide in recent decades [6,7] to create biodiversity refuges and unique ecosystems.
Monitoring forest cover and related changes over time has become essential in many environmental management strategies, particularly to reduce emissions resulting from deforestation and forest degradation [8]. Indeed, variations in atmospheric CO2 concentrations and global climate change have heightened the need to better understand ecosystem carbon cycle responses to environmental changes [9].
Recent research on the terrestrial carbon cycle has aimed to improve estimates of carbon storage and fluxes and to deepen the examination of variations between regions and continents [10]. NPP, representing the net carbon flux from the atmosphere to green plants per unit time, is a key parameter of the carbon cycle and an important indicator of ecosystem status [11,12,13]. Estimating this key parameter is very useful for modeling regional and global carbon cycles and is performed using several models, including those based on radiation use efficiency (LUE) [14,15,16,17,18,19,20,21,22,23], empirical models [24,25], and enzymatic kinetic models [26,27,28].
The usefulness of NPP estimates from MODIS satellite data in various ecosystem studies is well-established [19,29,30,31,32] with the increase, availability, and free access to these quality data. These NPP estimation methods are especially important for developing countries as many lack the technology for on-ground estimation of this key parameter. According to Bradford, Hicke [33], regional and global NPP studies using a LUE-based model require accurate estimates of the photosynthetically active radiation absorbed by vegetation (APAR) and LUE.
Togo, a country in West Africa, faces significant degradation of its forest ecosystems, leading to a substantial loss of vegetation cover, biodiversity, and soil quality [34]. Land use dynamics, primarily driven by agriculture and deforestation, contribute to greenhouse gas (GHG) emissions and exacerbate the negative impacts of climate change [35,36,37]. As a signatory to the United Nations Framework Convention on Climate Change (UNFCCC), the Kyoto Protocol, and the Paris Agreement (COP 21), the country has undertaken efforts to combat climate change. It has committed to reducing greenhouse gas emissions by 50.57% by 2030, contributing to the global effort to limit global warming below 2 °C by 2030 [38]. Togo’s government roadmap for 2020–2025, in its Section 3, aims to promote sustainable development and anticipate future crises as a priority, addressing major climate risks (Project 35), the green mobility program (Project 36), and the reform of environmental legislation (Project 37). These projects aim to increase the country’s forest cover to 25% to achieve a 10% increase in carbon sequestration by 2030, including continued afforestation efforts to plant one billion trees by 2030. Given these actions to mitigate climate change effects, monitoring ecosystem performance is necessary. According to Xie, Ma [39], vegetation NPP is a commonly used measure to assess carbon storage levels in ecosystem restoration projects. Climate change and human activities are the factors influencing NPP [40,41,42]. This study aims to contribute to a better understanding of the spatio-temporal dimensions of ecosystem productivity in relation to climatic variables. Specifically, it involves estimating NPP in a time series, assessing NPP dynamics of ecosystems, evaluating the impact of climate change and land use change on total production (PT) variation, analyzing the correlation between mean NPP and climatic variables. The research questions raised are: what is the performance of Togo’s ecosystems over the past three decades? What are the spatio-temporal distribution and trends of NPP in the study area? Which ecosystems sequester more carbon? What are the impacts of climate change and land use change on PT variation? What are the climatic variables that have determined and influenced the NPP of ecosystems in Togo during this time leap?

2. Materials and Methods

2.1. Study Area

The study was conducted in Togo, a country on the West African coast (Figure 1) located between 6 and 11° latitude North and 0 and 2° longitude East. Covering an area of 56,600 km2, it is subdivided into 39 prefectures grouped from the coast inland into five economic regions: the Maritime region, the Plateaux region, the Central region, the Kara region, and the Savanes region. The terrain is mostly flat, except for the Atakora chain that crosses the country diagonally from the Southwest to the Northeast, with peaks reaching about 800 m in the south and 500 m in the north [43] with Mount Agou, the highest peak in the country, rising over 900 m in the southwest. Located in the intertropical zone, Togo enjoys a Guinean tropical climate with four seasons in the southern part and a Sudanese tropical climate with two seasons in the northern part. The Maritime and Savanes regions receive less than 1000 mm of water per year. Togo’s water resources are quite abundant. They consist of surface waters drained by the three main watersheds (Oti: 47.3%, Mono: 37.5%, Lake Togo: 6%) and renewable groundwater contained in the two aquifers of the basement and the coastal sedimentary. With a forest cover of 24.24% (IFN, 2016), Togo’s biological resources are numerous and diverse. Vegetation formations consist of semi-deciduous dense forests, Guinean savannas, Sudanese savannas interspersed with dry forests or clear forests, gallery forests, and riparian forests. Phytogeographically, Togo is divided into five ecological zones (Figure 1) [44]. Ecological zone I, which is the northern plains zone, is predominantly Sudanese savanna. Ecological zone II corresponds to the northern branch of the Togo Mountains. It is the domain of a savanna-forest mosaic with Isoberlinia doka and dry dense forests (mainly sacred groves). Ecological zone III extends across the central plain (Mono plain) from Sokodé to Notsé. The characteristic vegetation is Guinean savanna, within which there are many fragments of dry dense forest. Ecological zone IV corresponds to the southern part of the Togo Mountains. It is the only zone covered with authentic semi-evergreen forests. Today, they are fragmented and reduced to patches and strips of trees along watercourses [45]. Ecological zone V corresponds to the coastal plain covered by a mosaic of semi-deciduous forests, savannas, thickets, and grasslands. According to INSEED [46], Togo’s population was estimated at 8,095,498 inhabitants in 2022, with a density of 143 inhabitants/km² and a growth rate of 2.3% per year between 2010 and 2022.

2.2. Data Collection

2.2.1. MODIS Data and Preprocessing

The global MOD13Q1 data with a spatial resolution of 250 m for the rainy months (June to October) from a time series spanning 1987 to 2022 were downloaded for tile ID h28v07 from the USGS server using the MODIS Reverb tool https://lpdaac.usgs.gov/products/mod13q1v006/ (accessed on 10 April 2023). Only the rainy months were considered because several studies have shown that NPP varies significantly with the seasons [47]. Studies have demonstrated a positive relationship between NPP and precipitation, with precipitation playing a crucial role in determining NPP levels, especially in the context of the growing season [48]. Additionally, as indicated by research conducted by Sun, Yue [49], focusing on rainy season NPP allows researchers to better understand the direct impact of precipitation on vegetation productivity. This, in turn, facilitates more accurate predictions and assessments of ecosystem dynamics in light of changing climatic conditions.

2.2.2. Meteorological Data

Monthly meteorological data for the period 1987 to 2022 were collected from the National Meteorology Agency (ANAMET) of Togo. Existing gaps amounting to 6% in these data were filled using data from the NASA site. The collected data include average temperature (T, °C) and precipitation (P, mm). These data were gathered from nine meteorological sites scattered across the entire territory (Figure 1).

2.2.3. Land Use Data

Global Land Use and Land Cover (GLULC) data, freely accessible, were obtained from the Earthmap.org platform https://earthmap.org/ (accessed on 12 June 2023) developed in collaboration with the FAO. These data were preferred due to their international validation and the absence of reference land use data over a significant time span in Togo; the first national forest inventory (IFN 1) coupled with land use mapping only dates back to 2016. The Global Land Use and Land Cover (GLULC) data for the years 2000 and 2020 were reclassified into six land use units: Forests, Savanna Mosaics, Croplands/Agroforestry/Pastures, Swamp Vegetation, Water Bodies, and Habitations/Infrastructure/Quarries. The 2020 data were reclassified to reflect the Land Use and Land Cover of 2022. An intersection between NPP data and vegetation data from 2000 and 2022 was carried out to estimate the NPP of different ecosystems on a national scale.

2.3. Methods

2.3.1. Estimation of NPP

The model built on the basis of NDVI, SR, and NPP, along with the light use efficiency method [50], was used to assess carbon sequestration over the time series. The model evaluation was primarily based on the CASA algorithm (Carnegie–Ames–Stanford approach) [23]. NDVI and SR were applied to calculate the fraction of incident photosynthetically active radiation (FPAR) and the absorbed incident photosynthetically active radiation (APAR), which allowed for the estimation of NPP [51].
N P P = A P A R × U E
N P P = F P A R × P A R × L U E
L U E = ε max × f ( T 1 , T 2 , W )
The light use efficiency factor (LUE) is a function of T1, T2, and W, which are limits imposed by two temperatures and water stress on the energy use rate. εmax is the maximum light use efficiency under ideal conditions, with a value adopted of 0.389 g C/MJ [23].
According to Hatfield, Asrar [52] and Los, Justice [53], FPAR has a linear relationship with NDVI or SR. Thus, FPAR can be calculated from NDVI and SR using the following equations [43]:
F P A R n d v i x , t = N D V I ( x , t ) N D V I i , m i n × F P A R m a x F P A R m i n ( N D V I i , m a x N D V I i , m i n ) + F P A R m i n
F P A R s r x , t = S R ( x , t ) S R i , m i n × ( F P A R m a x F P A R m i n ) ( S R i , m a x S R i , m i n ) + F P A R m i n
FPARmax and FPARmin are assumed to be 0.95 and 0.001, respectively.
FPAR estimates based on NDVI are generally higher than actual values, while estimates based on SR tend to be lower than actual values [53]. To reduce errors in FPAR evaluation, averaging the results derived from NDVI and SR has been strongly suggested [54]. In this regard, the following equation was applied:
F P A R x , t = F P A R n d v i + 1 F P A R s r
∝ = 0.5 is the adjustment factor for NDVI and SR [55].
According to [56], for clear skies and tropical countries, PAR is 0.51.
The light use efficiency factor (LUE) T1 reflects the limitation imposed by the biochemical action of plants on photosynthesis at low and high temperatures [23,57].
T 1 = 0.8 + 0.02 × T o p t 0.0005 × T o p t 2
where Topt is the average monthly temperature in the month when NDVI reaches its maximum in a given year. T2 shows the declining trend of effective light use as ambient temperature increases or decreases relative to the optimal temperature value (Topt). It can be calculated using the following formula:
T 2 = 1.1814 / ( 1 + e 0.2 × T o p t 10 T ) / ( 1 + e 0.3 ( T o p t 10 T ) )
The water stress factor reflects the influence of water effectively used by plants for an optimal energy conversion rate. As the available water in the environment increases, W also increases, ranging from 0.5 (extremely arid condition) to 1 (very humid condition).
W = 0.5 + 0.5 × E T R E T P
Potential evapotranspiration (ETP) corresponds to moist soil and plants with enough water. For this study, the method proposed by [58] which is based primarily on air temperatures, was used.
E T P = 16 10 t I a . K i = ( t 5 ) 1.5 e t I = 12 I i a = 1.6 100 I + 0.5
ETP is the potential evapotranspiration for the considered month t;
t = average monthly temperature for the considered month;
a = 6.75·10−7 × I3 − 7.71·10−5 × I2 + 1.79·10−2·I + 0.49239;
K = monthly adjustment coefficient, which depends on the latitude of the area (Table 1);
i = monthly heat index calculated from average monthly temperatures;
I = annual heat index, which is the sum of monthly heat indices.
The actual evapotranspiration or runoff deficit was calculated using Turc’s formula:
E T R = P 0.9 + P 2 l 2 0.5
where P is the average annual rainfall (in mm) and ETR represents the actual evapotranspiration (in mm/year). The parameter L, a function of the average annual temperature t (in °C), is expressed as follows:
L = 300 + 25 t + 0.05 t 3

2.3.2. Validation of NPP Estimation

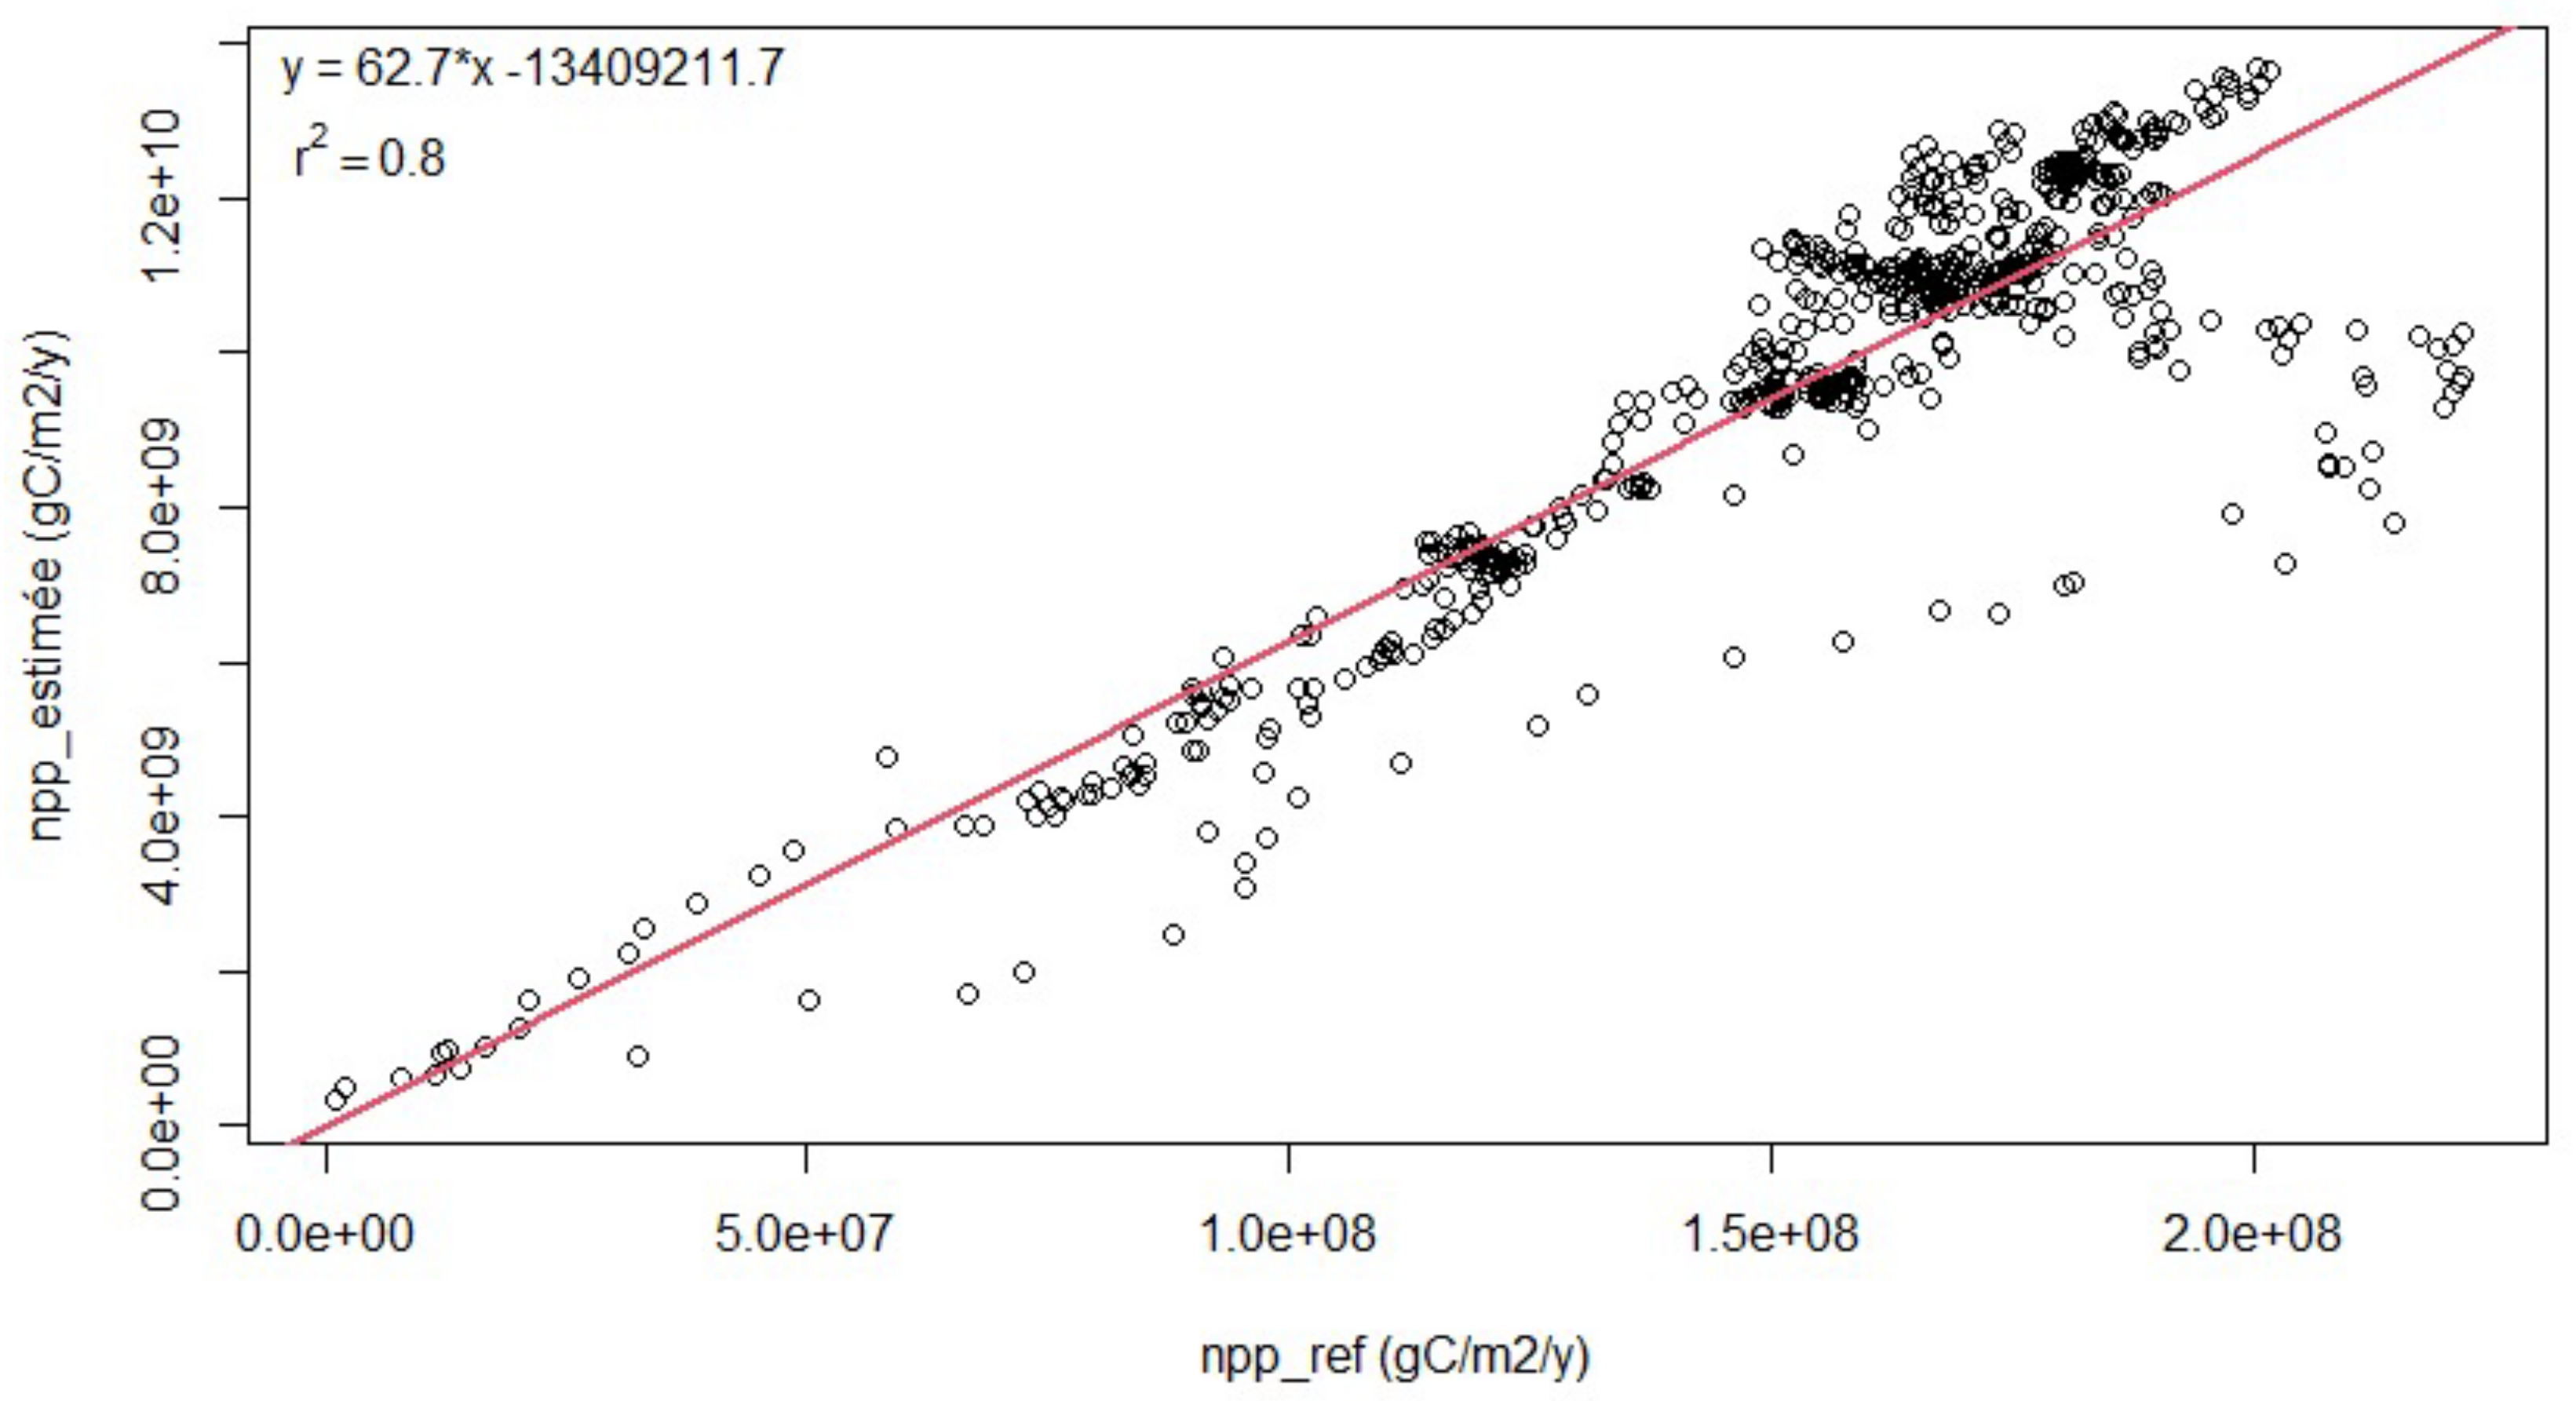
The 500 m resolution MODA17A3HGF v006 reference data from the year 2022 for Togo were acquired to validate the estimated NPP of Togo using the model applied in this study. The absence of ground-measured data at the scale of Togo explains the choice of the widely used MODA17 reference data by other authors to validate NPP estimation [59]. When ground reference data are lacking, the use of satellite-derived datasets such as MODIS can serve as an alternative for validation [60]. However, it is essential to account for potential biases and uncertainties associated with using these reference data. The correlation between NPP and the MODA17 reference NPP was used to validate the results. Figure 2 clearly shows that the estimated NPP corresponds to the simulated NPP (r2 = 0.8).

2.3.3. Impacts of Climate Change and Land Use

The NPP of vegetation is the production per unit of land area. Therefore, the total production (PT) is calculated as follows:
P T = S u p × N P P
where Sup = area of the study zone.
The change in PT between two different dates (2000 and 2022) will be estimated as:
Δ P T = P T 2022 P T 2000 = S u p 2022 × N P P 2022 S u p 2000 × N P P 2000
Since Sup2022 = Sup2000 + ΔSup and NPP2022 = NPP2000 + ΔNPP, we have:
Δ P T = S u p 2000 + Δ S u p × N P P 2000 + Δ N P P S u p 2000 N P P 2000
Δ P T = S u p 2000 × Δ N P P + Δ S u p × N P P 2000 + Δ S u p × Δ N P P
The work of [61] linked this to three parameters: climate change, land use changes, and the interaction between climate change and land use. Indeed, the variation of PT according to the last equation is a function of the induced change in NPP (Sup2000 × ΔNPP), the change in area (ΔSup × NPP2000), and the interactions (ΔSup × ΔNPP).
The relative contribution of the three parameters to the change in PT (ΔPT) can be estimated as follows:
Ƞ c l i m = S u p 1 × Δ N P P Δ P T × 100
Ƞ l a n d = Δ S u p × N P P 2000 Δ P T × 100
Ƞ i n t e r s e c t = Δ S u p × Δ N P P Δ P T × 100
where Ƞ_clim, Ƞ_land, and Ƞ_intersect are, respectively, the contributions of climate change, land use changes, and their interactions; |ΔPT| represents the absolute value of ΔPT.

2.3.4. Correlation Analysis between NPP and Climatic Variables

The correlation analysis was conducted to evaluate the relationships between NPP and climatic variables. Several studies have demonstrated the necessity of this relationship in studies on ecosystem performance. Using Pearson’s correlation coefficient R, the linear relationship between two variables (NPP and a climatic variable, an input parameter of the CASA model in conjunction with the Thornthwaite model) was evaluated. This coefficient measures the strength of the association and ranges from −1 to +1 [62]. The correlation coefficient was calculated between the climatic parameters (precipitation, temperature, actual evapotranspiration, potential evapotranspiration, effective light use factor) and the NPP.
R = i = 1 n X i X ¯ Y i Y ¯ i = i n X i X ¯ 2 i = 1 n Y I Y ¯ 2
where R is the correlation coefficient between variables X and Y. Xi and Yi indicate X and Y of year i, and represent the multi-year average of X and Y, respectively. n is the number of years of the study. The t-test method is used to test the significance of the correlation coefficient R, and p < 0.05 is considered statistically significant.

3. Results

3.1. Temporal Dynamics of NPP in Togo

3.1.1. Distribution and Temporal Evolution of NPP in Togo

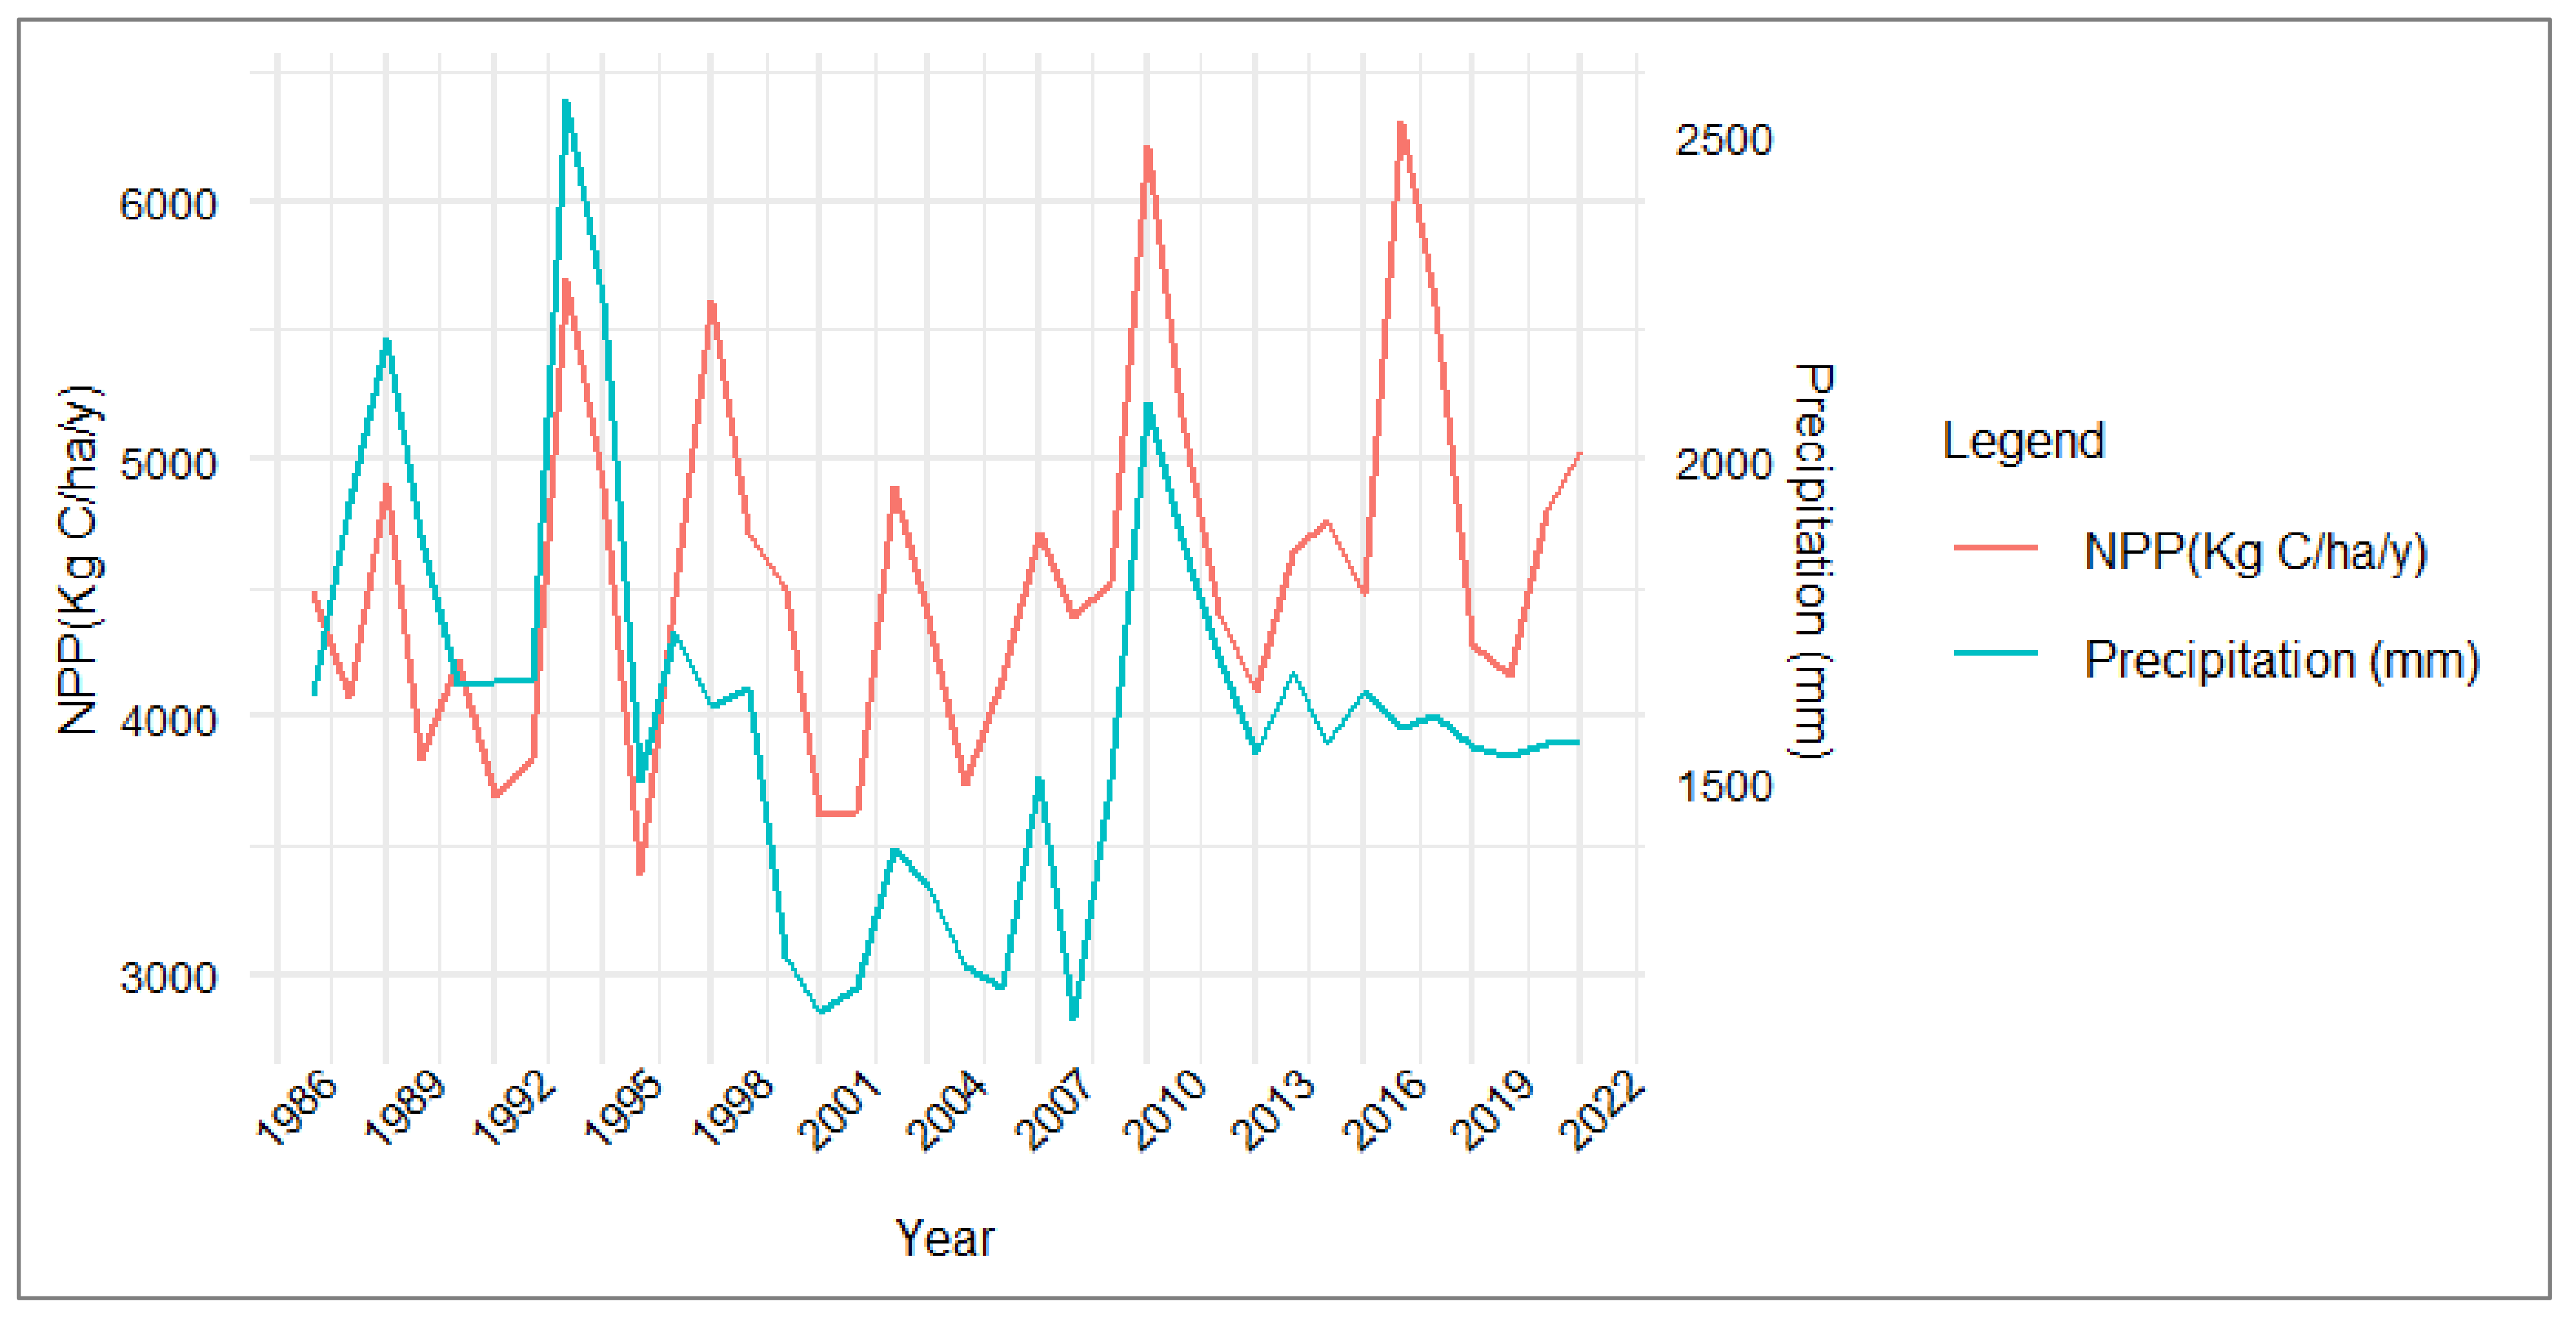
The NPP from 1987 to 2022 was estimated using the CASA model. The average annual NPP over the 36 years of the study is 4565.31 kg C.ha−1. The NPP accumulated the most in 2017 with a value of 6312.26 kg C.ha−1, while 1996 was the least productive year with 3394.29 kg C.ha−1 (Figure 3). As for the total NPP, it ranges from 19.21 Pg C in 1996 to 35.72 Pg C in 2017, with an annual average established at 25.83 Pg C.

3.1.2. Monthly Variation of NPP

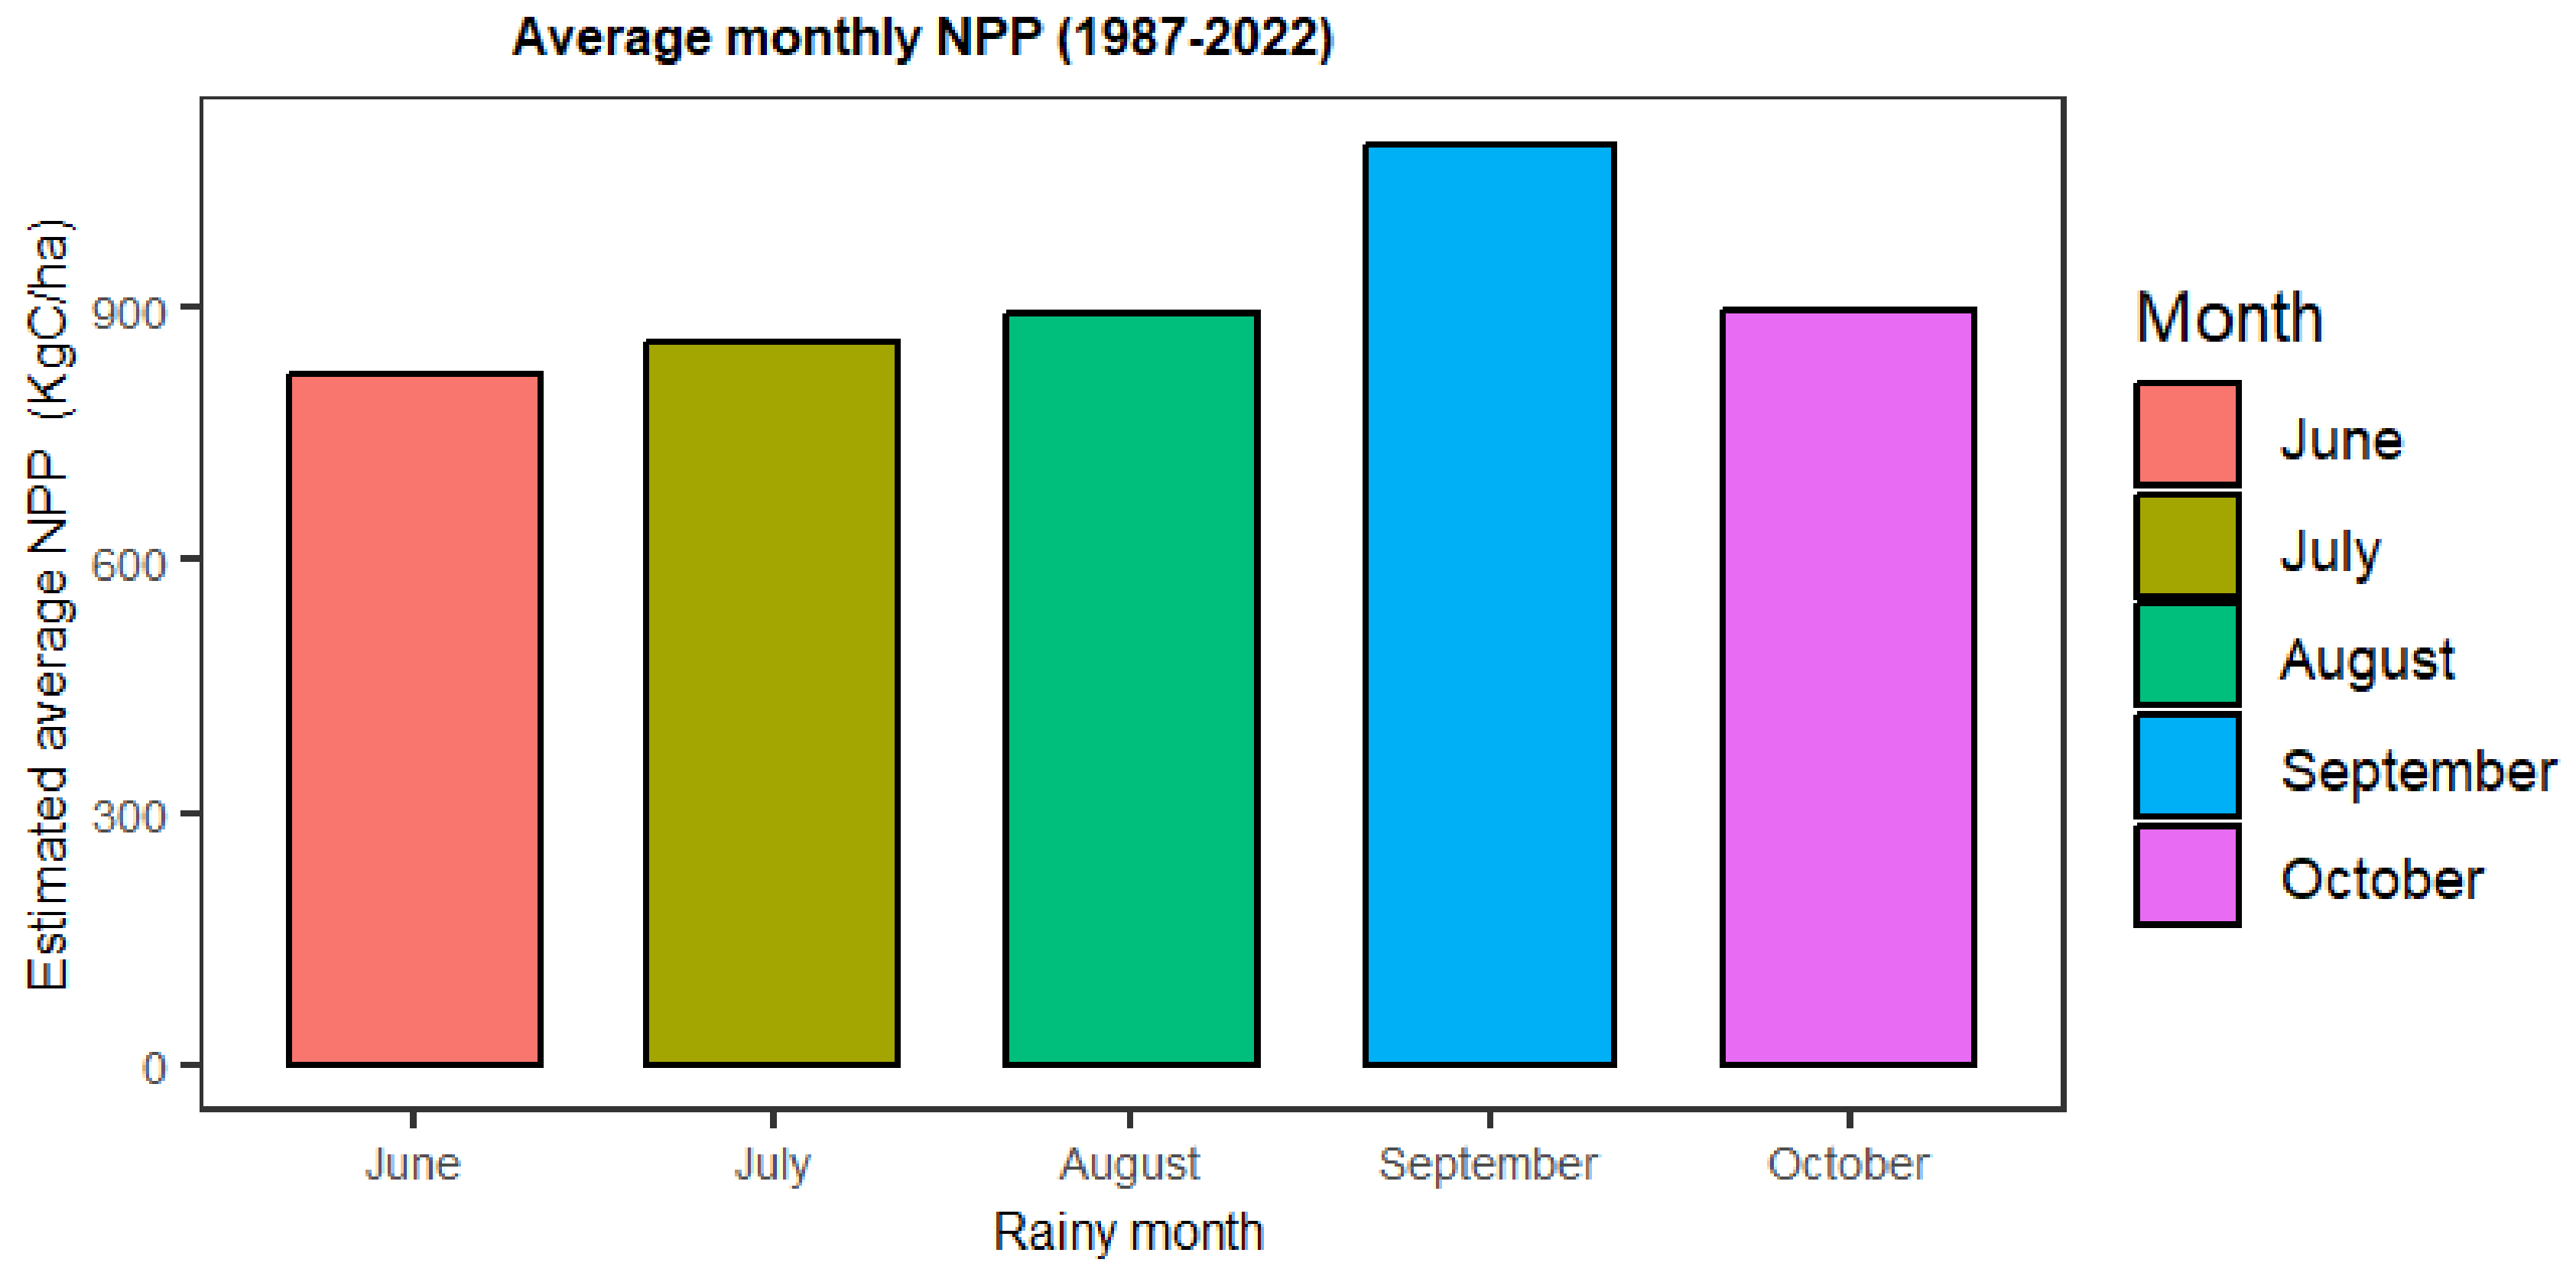
The NPP for the rainy months has been estimated. The most productive month on average is September (Figure 4) with an average of 1095.22 Kg C.ha−1, followed by the months of October, August, July, and June with, respectively, 895.92 Kg C.ha−1, 893.08 Kg C.ha−1, 859.02 Kg C.ha−1, and 822.05 Kg C.ha−1.
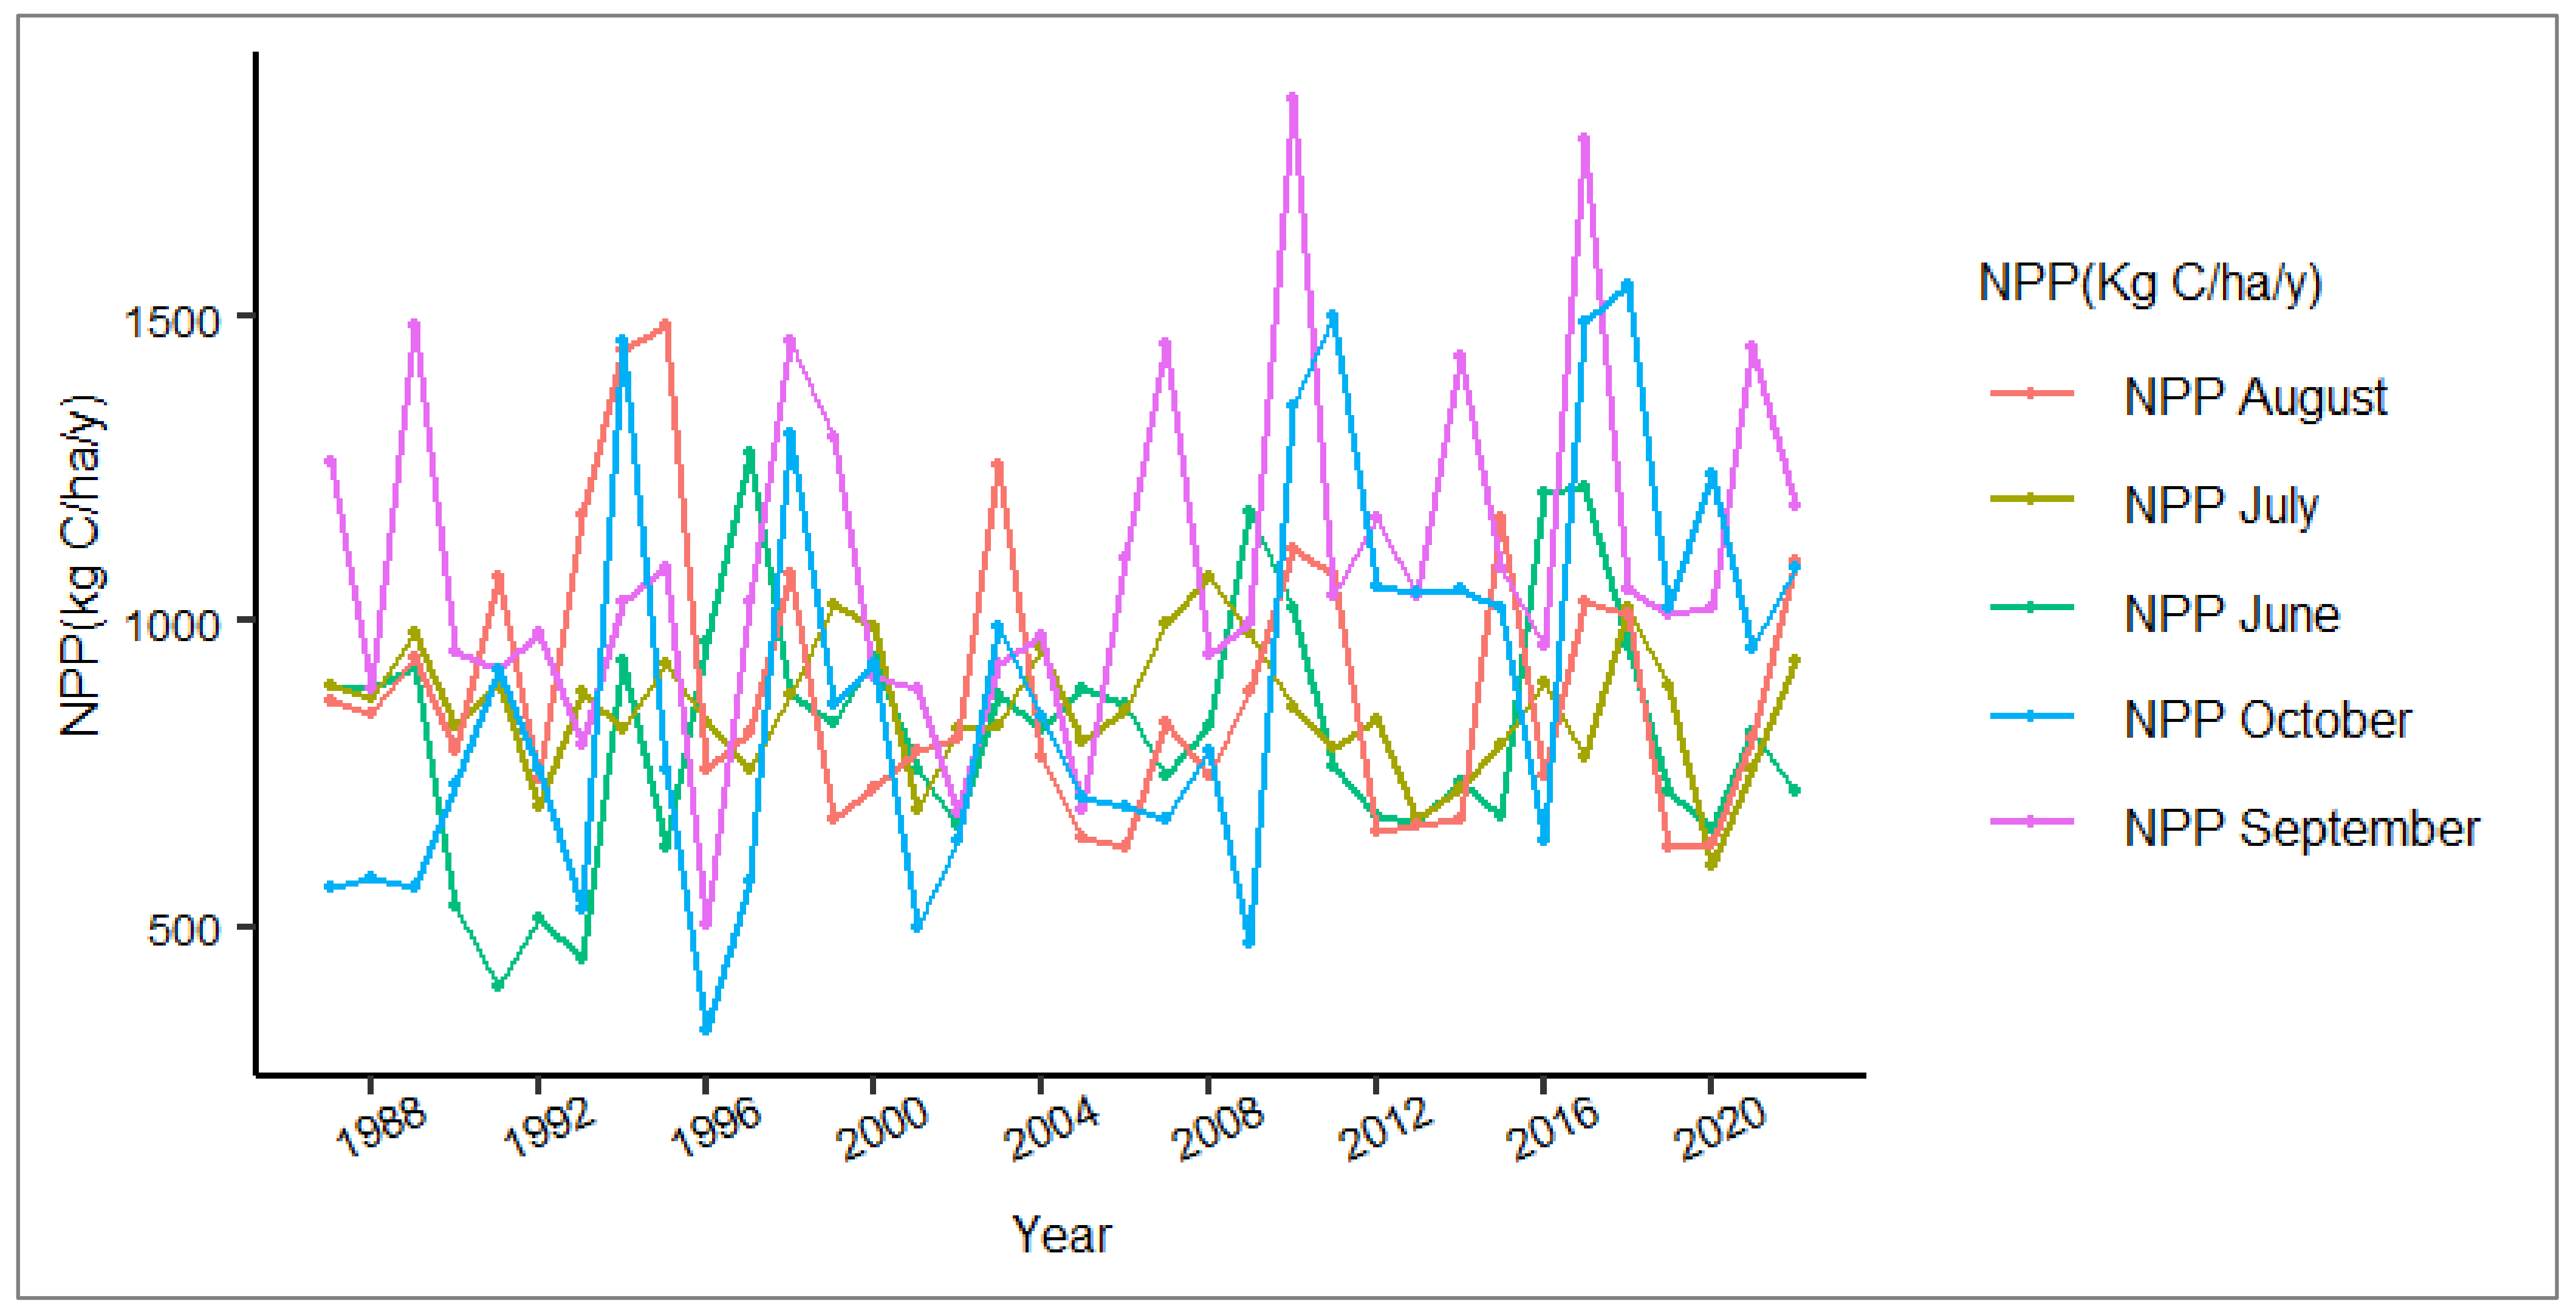
A variability in monthly NPP is observed over the years. Figure 5 illustrates the variability of the monthly Net Primary Production (NPP) from June to October over the period from 1986 to 2022. It is observed that the NPP varies significantly from year to year for each of these months, with notable fluctuations.
The month of September shows the highest NPP values, indicating particularly strong productivity. However, some years deviate from this trend, with months like August, July, or June showing higher NPP peaks. The month of October presents more moderate but also variable values from year to year.

3.2. Spatial Dynamics of Natural Productivity in Togo

3.2.1. Characteristics and Spatial Distribution of Natural Productivity in Togo

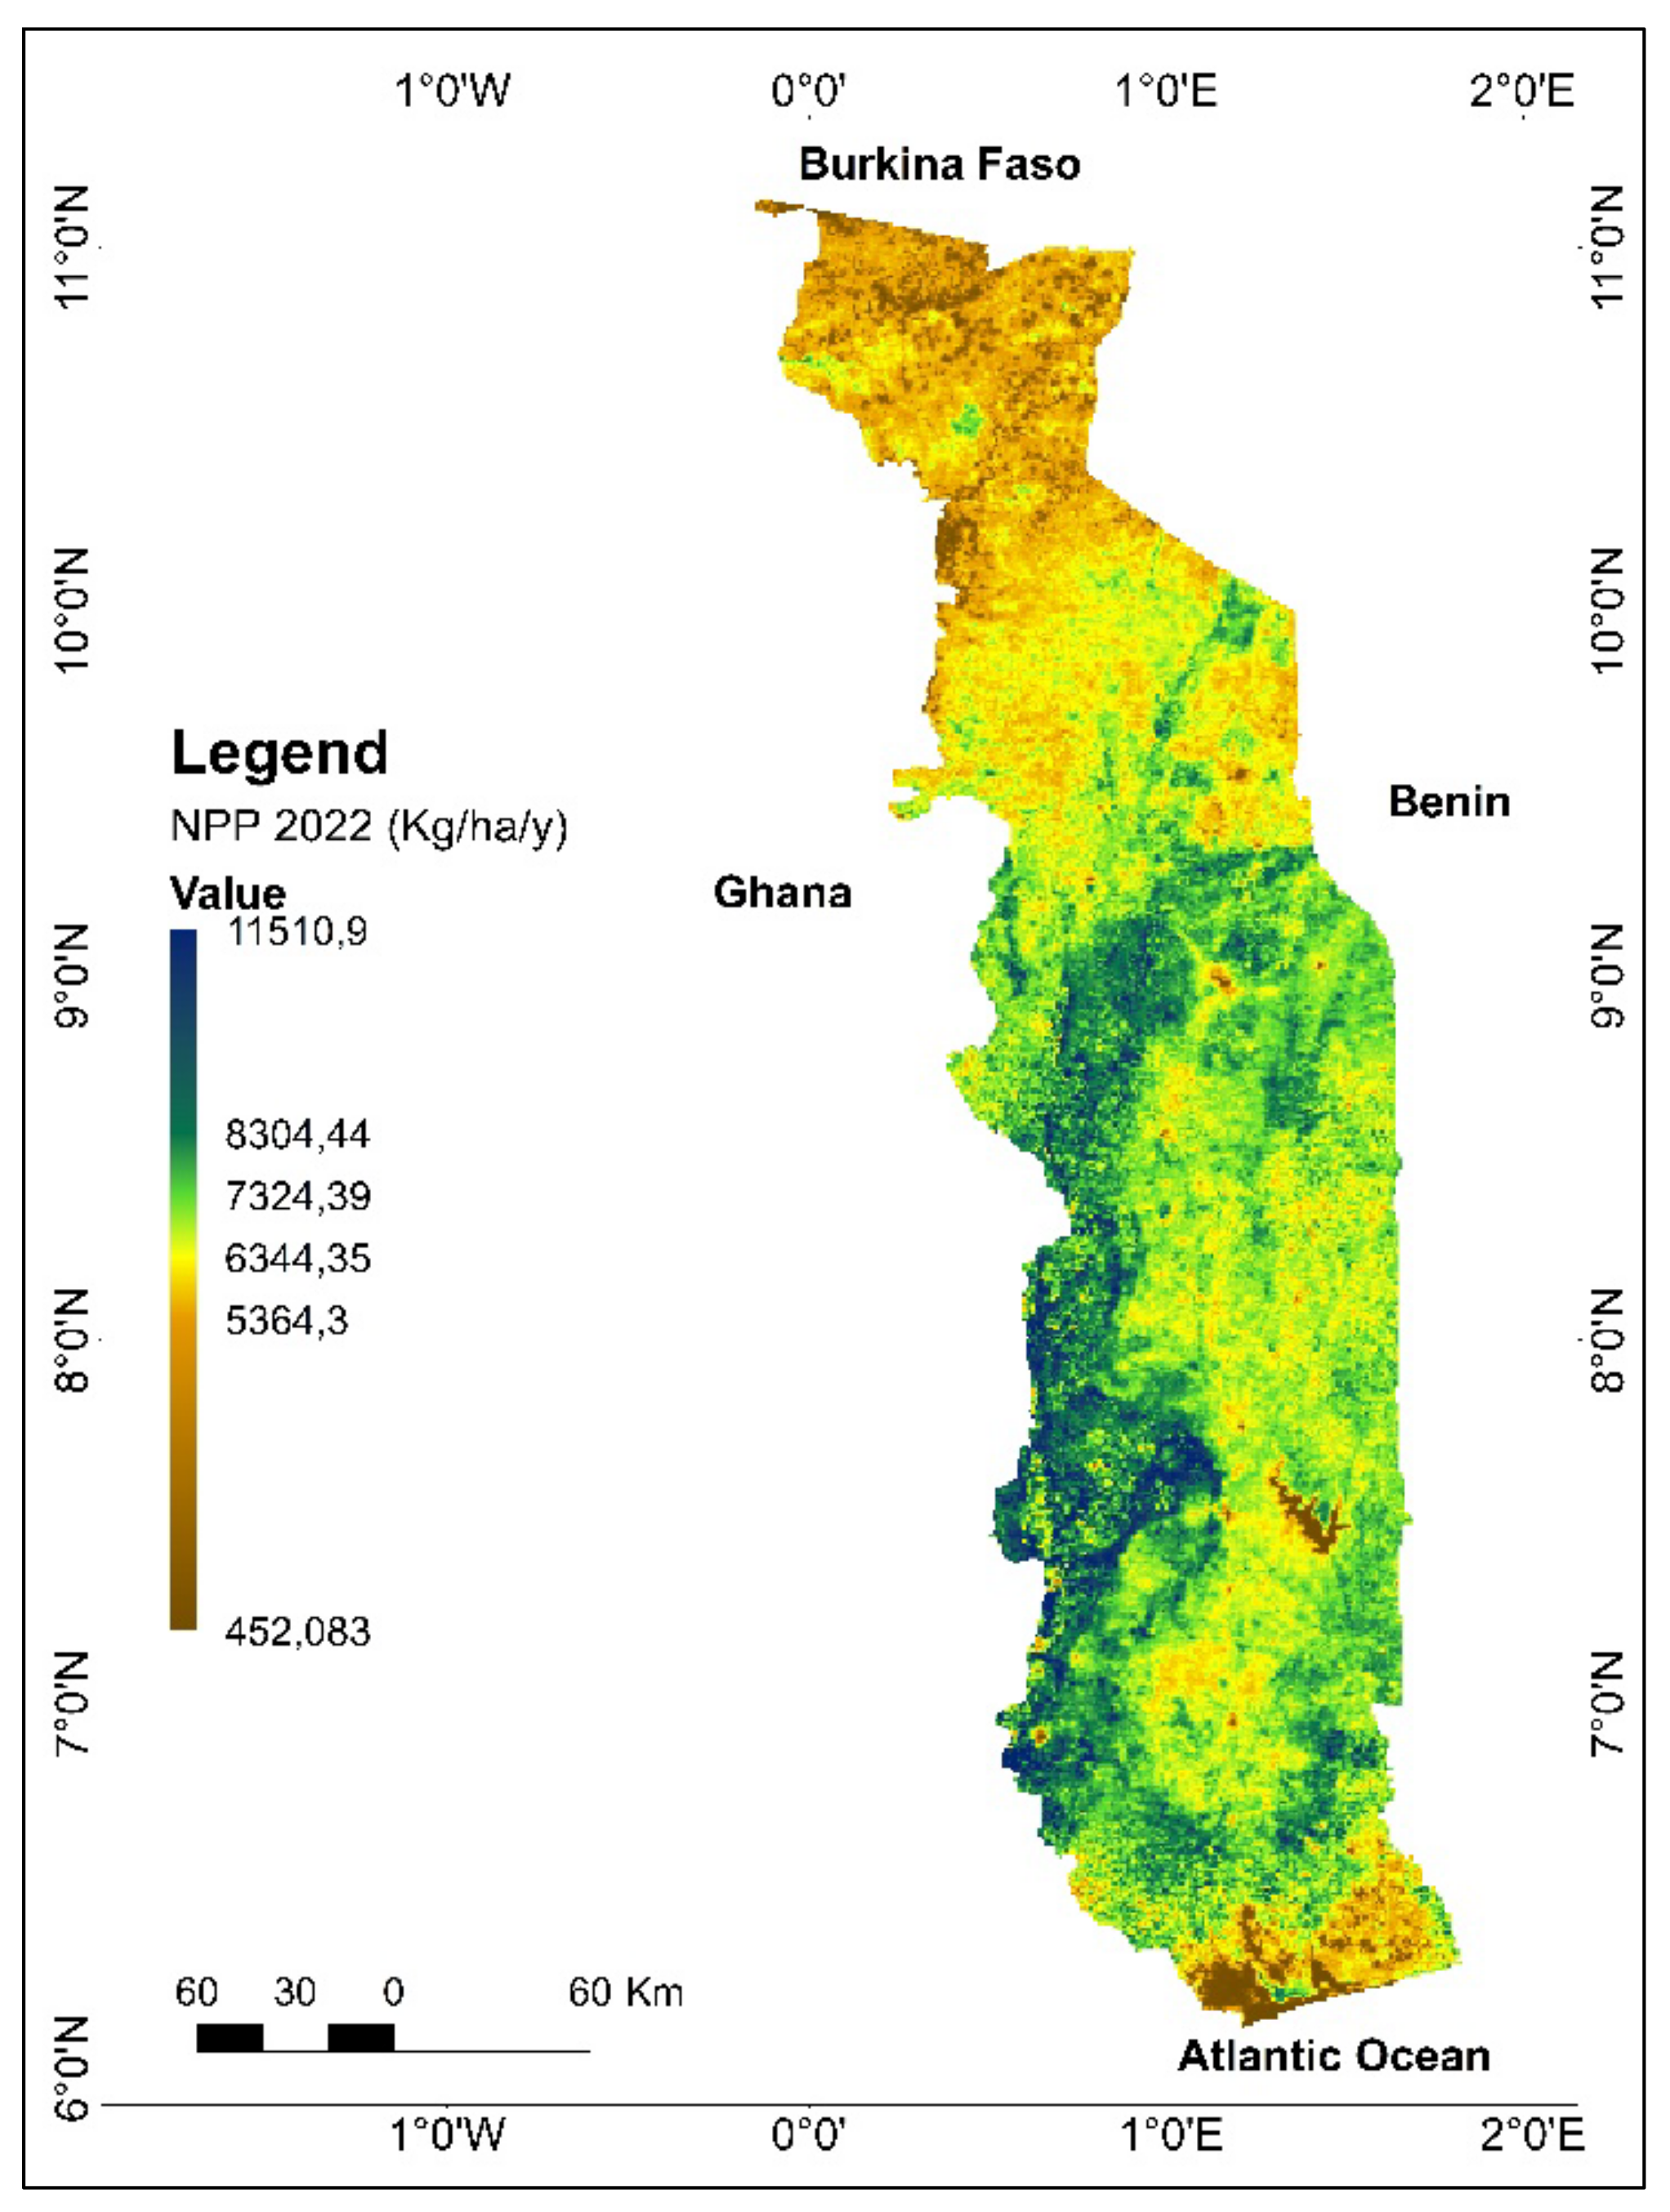
Figure 6 shows graphically the distribution of NPP in 2022. According to the figure, NPP in that year varies from 452.08 to 11,510.9 kg C.ha−1, with a total annual NPP of 28.51 Pg C.
The distribution of NPP from the South to the northeast is unevenly distributed (Figure 4). The Atakora mountain range, which crosses the country diagonally, remains the most productive area of the country. In contrast, the landscapes of the Bombouaka Cuesta, the Kara River basin, and the coastal area remain the least productive areas of the country.

3.2.2. Detection of NPP Changes in Togo

Between 2000 and 2022, productivity changes were detected at the pixel level (Figure 7). Some areas, such as the savanna region, the central-eastern zone, the Nangbéto dam area, and the lagoon area, sequester less carbon in 2022 than in 2000 (Figure 6). These landscapes have experienced a loss of NPP up to 2417.65 Kg C.ha⁻¹. Gains in terms of carbon sequestration are mainly observed in the dense semi-deciduous forest areas of the southwestern mountains. In these areas, the increase in NPP of the pixels between 2000 and 2022 goes up to 5177.24 Kg.C.ha−1.

3.2.3. Spatio-Temporal Dynamics of Ecosystem NPP

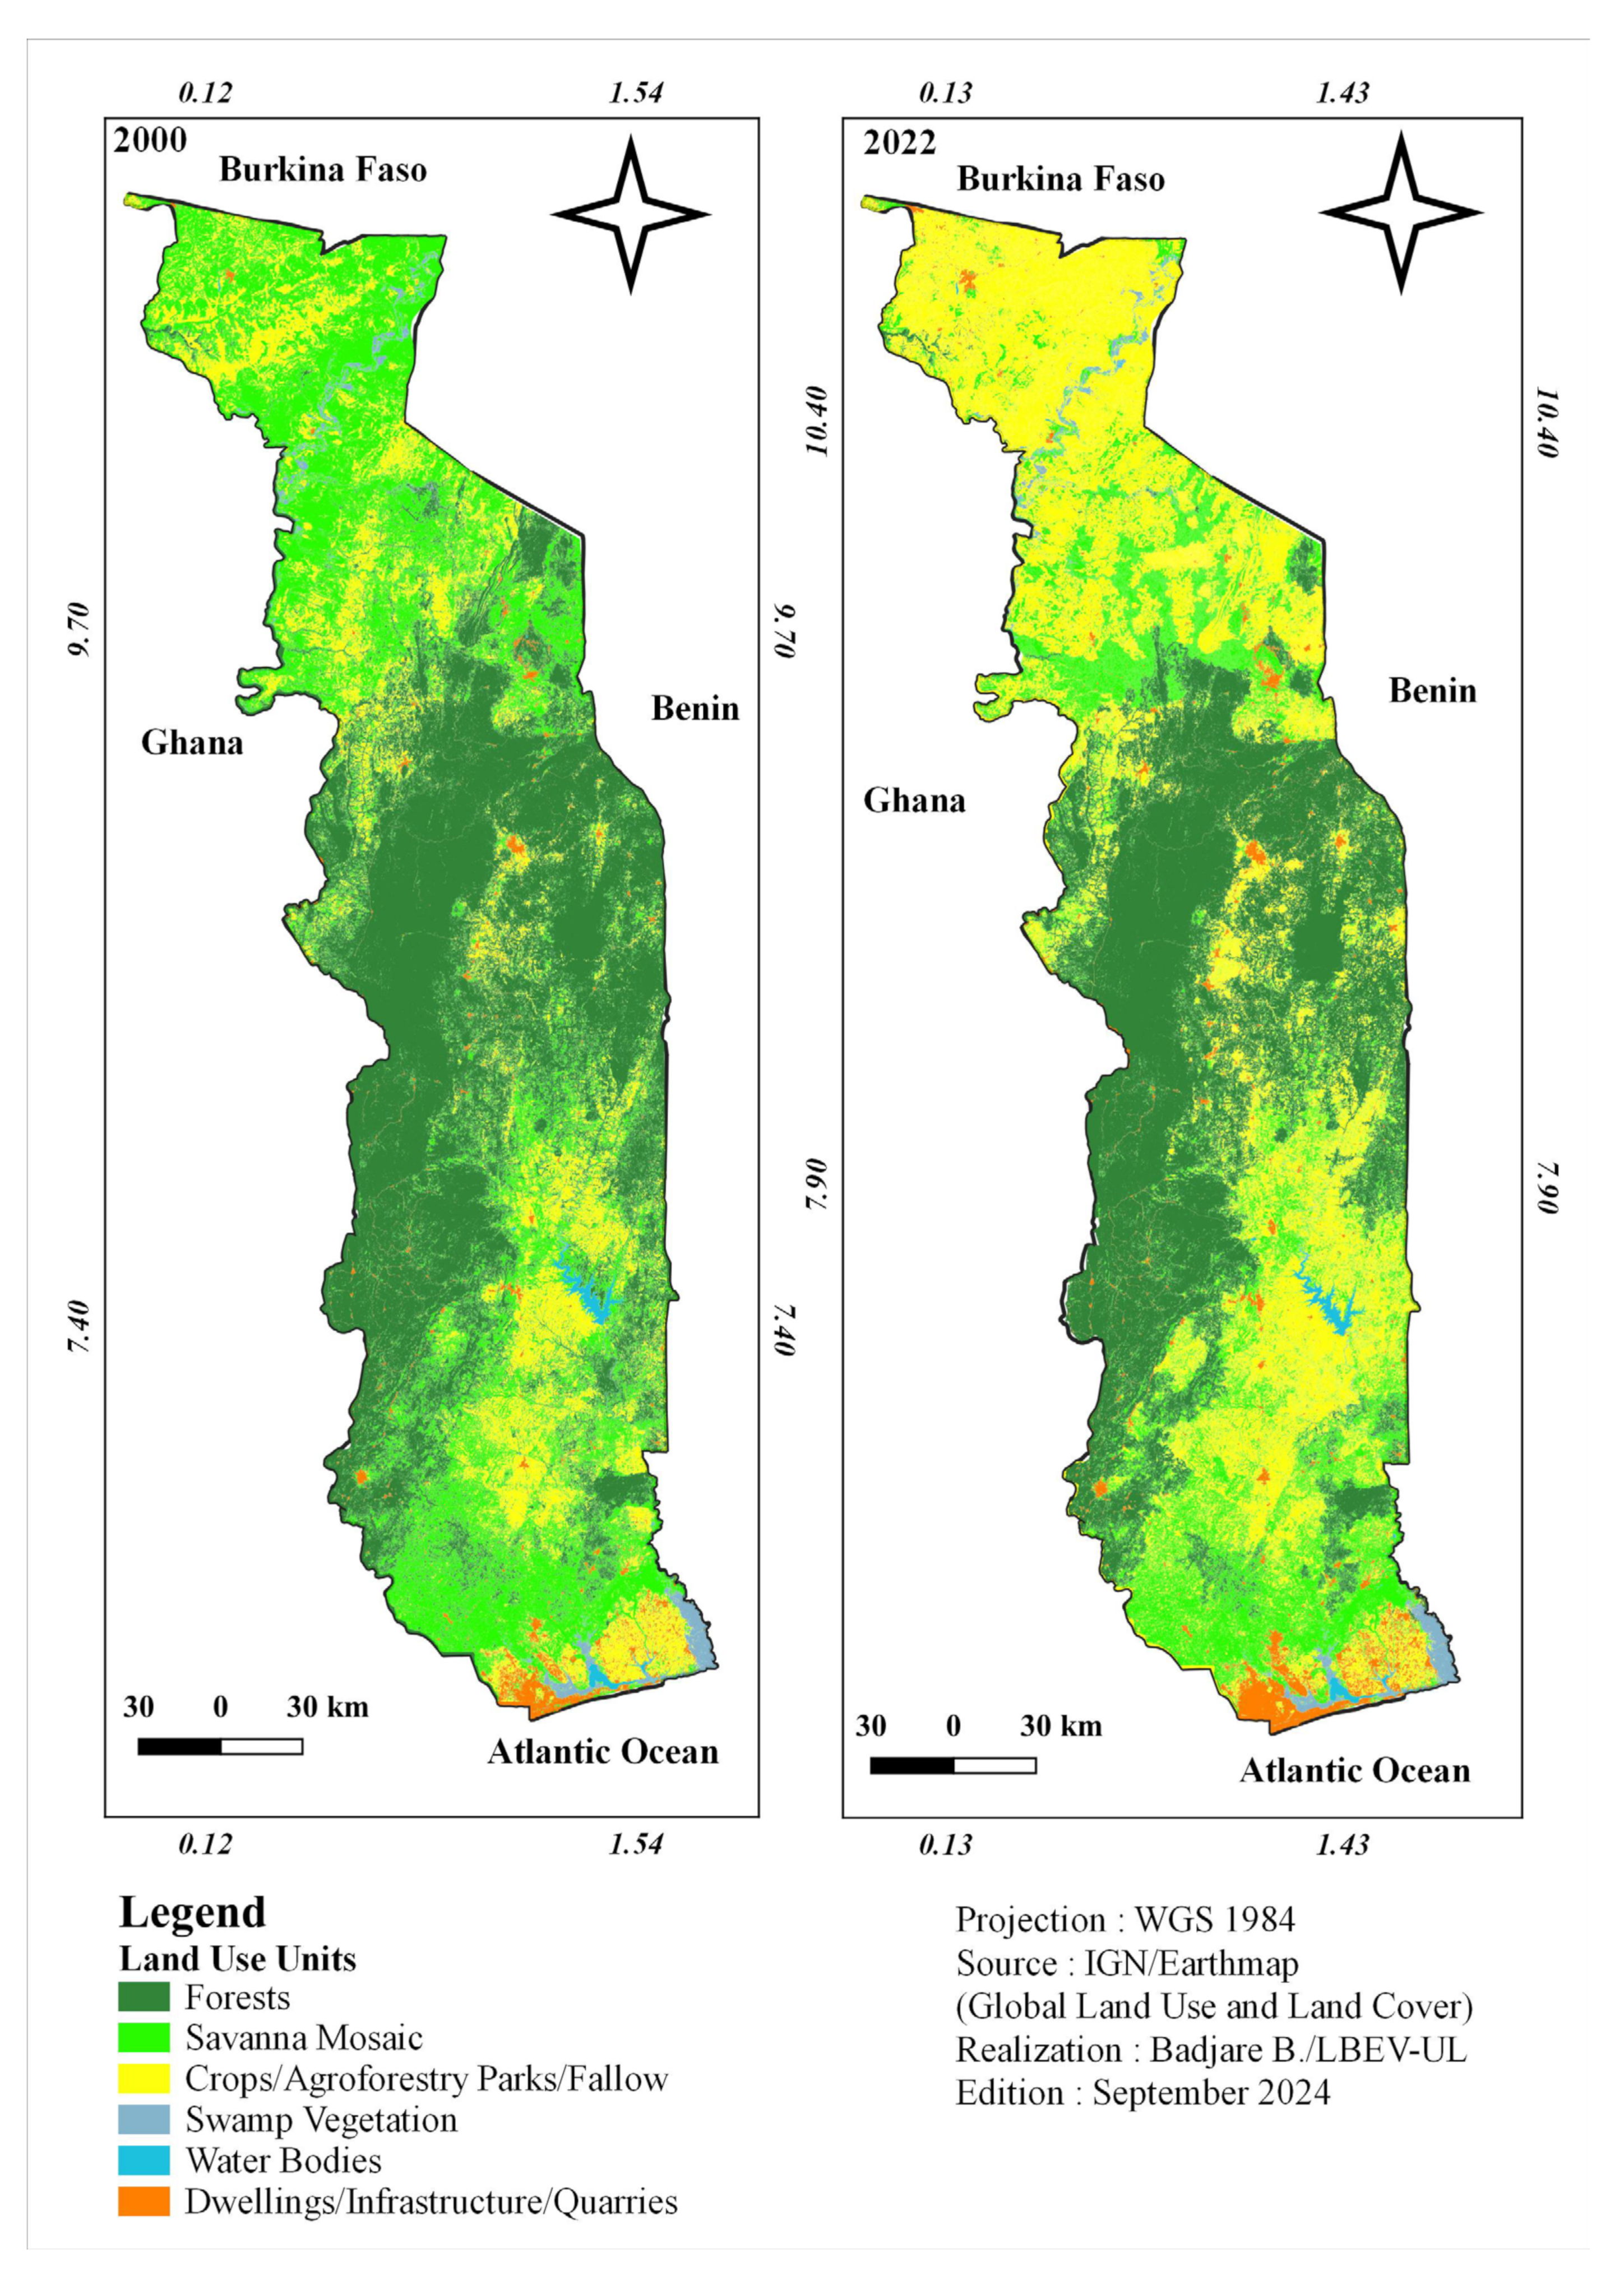
The analysis of land use types from 2000 and 2022 derived from the post-classification of GLCLU images showed that the present land cover units are Forests, Savanna Mosaics, and Crops/Agroforestry Parks/Fallow, Swamp Vegetation, Water Bodies, and Habitations/Infrastructure/Quarries (Figure 8). The statistics for the areas occupied by each land cover unit are recorded in Table 2.
The highest average annual NPP observed in 2000 was in forests, which was 4813.79 kg C.ha−1.year−1. It increased to 7050.33 kg C.ha−1.year−1 by 2022 (Table 3). Some ecosystems such as Forests, Savanna Mosaic, Swamp Vegetation, and Water Bodies saw their average annual NPP increase between 2000 and 2022, while Croplands/Agroforestry/Pastures and Residential/Infrastructure/Quarries became less productive in terms of NPP accumulation.
In general, it appears that all land use units have improved their performance in terms of NPP accumulation despite land use changes. In 2000, forests had a total annual NPP value of 12.25 Pg C.yr−1, representing 48.13% of the country’s total annual NPP. Twenty-two years later, these ecosystems saw their performance increase to 13.73 Pg C.yr−1 despite a 23.55% reduction in forest area. It is noteworthy that despite the increase in the amount of accumulated NPP, forests have lost their share, decreasing from 48.13% in 2000 to 37.95% in 2022 (Table 4).

3.3. Impacts of Climate Change and Land Use Change on Total Production

Between 2000 and 2022, 32.08% of Togo’s land area experienced changes in land use. Table 5 summarizes the areas of land use units that remained unchanged and those that underwent modifications. A significant change in the allocation of savanna mosaics is observed. Specifically, 14.31% (199,945.41 ha) and 11.18% (156,129.21 ha) of savanna mosaics have been converted, respectively, into Crops/Agroforestry Parks/Fallow Lands and into Forests. Forests converted into agricultural land represent a large proportion, with 15,689.06 ha, while the conversion of savanna mosaics into forests is also noted (156,129.21 ha), indicating reforestation efforts or natural regeneration.
During the time span 2000–2022, the estimates of NPP indicate an increase in total productivity (PT) of 3.05 Pg C. This variation in PT is influenced by climate change, which has a positive impact (58.27%), as well as changes in land use (188.63%). The intersection between these two parameters, however, negatively impacts (−146.90%) the variation in PT (see Figure 9).
Between 2000 and 2022, climate change has had a more positive impact on the variation in the productivity of Savanna Mosaics (471.74%), whereas land use changes have had a more positive impact on the variation in the productivity of Crops/Agroforestry Parks/Fallow Lands (950.39%). The intersection of these two parameters has had a more negative impact on the variation in the productivity of Settlements/Infrastructures/Quarries (−200.02%) (Table 6).

3.4. Correlations between NPP and Climatic Parameters

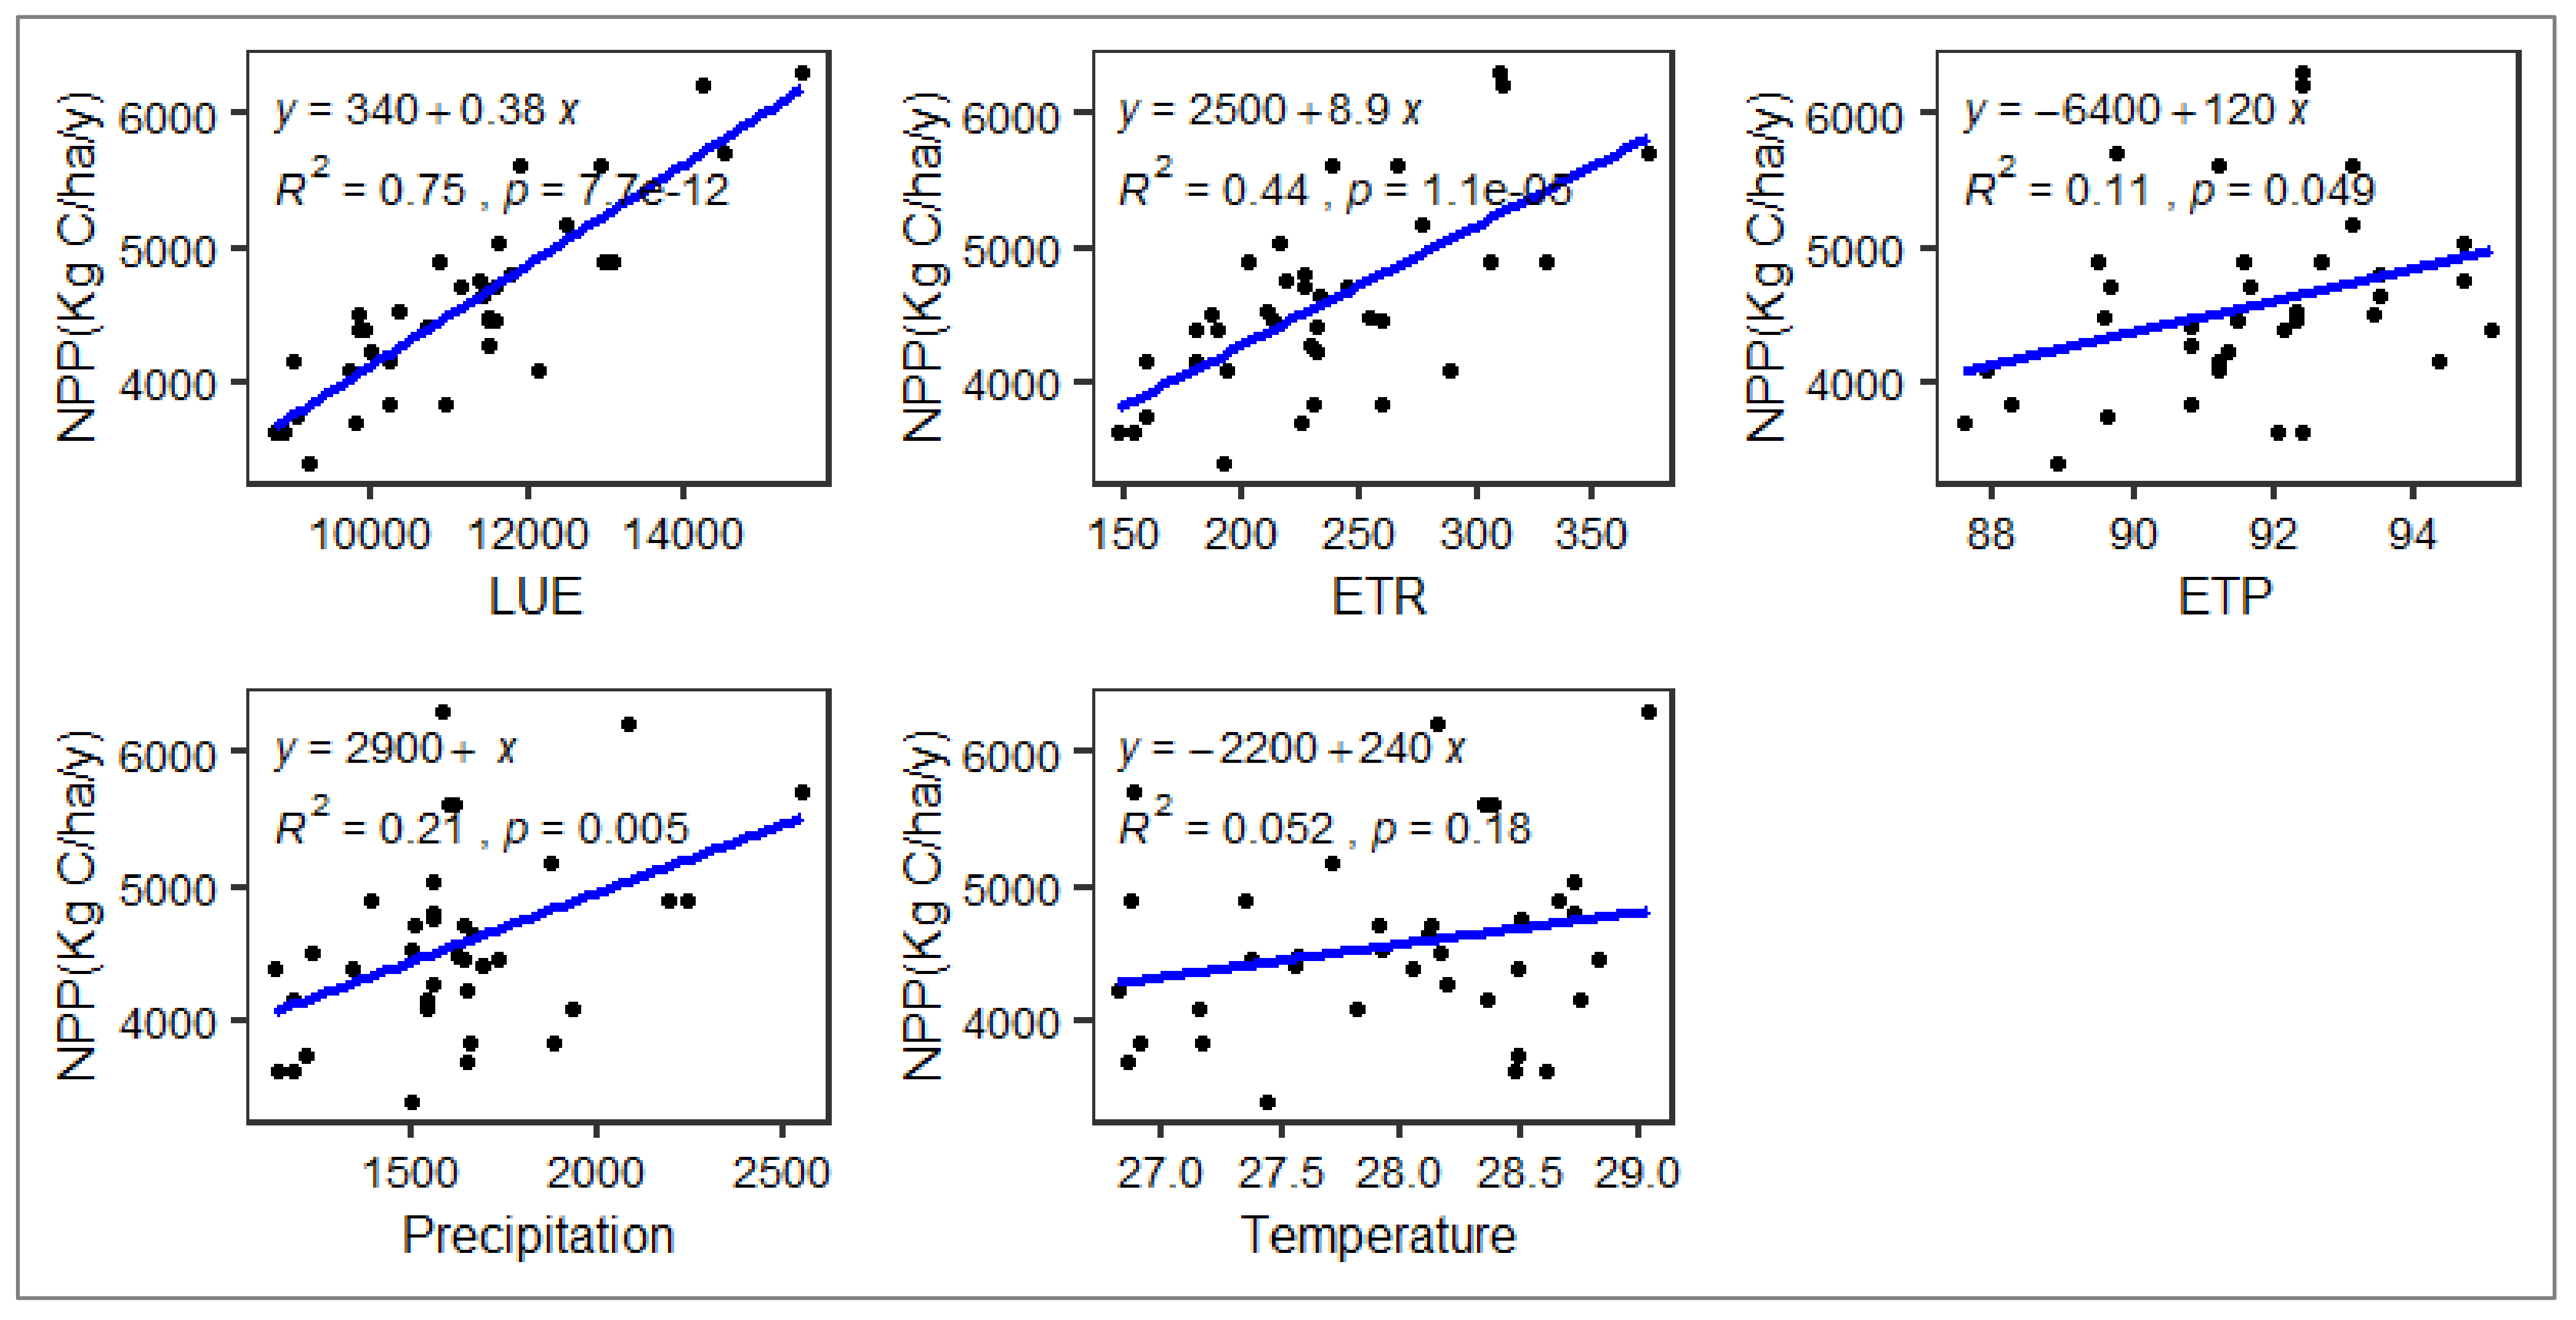
The correlation coefficients (R) between NPP and climatic parameters reveal positive links of varying intensities depending on the two types of coupled data (Figure 10). This figure presents the relationships between NPP and various climatic parameters: Light Use Efficiency (LUE), Actual Evapotranspiration (ETR), Potential Evapotranspiration (ETP), precipitation, and mean temperature. The graphs show the linear regressions associated with each relationship, with their equations and determination coefficients (R2).
NPP also shows a significant positive correlation with ETR, with an R2 of 0.44. This means that 44% of the variance in NPP is explained by actual evapotranspiration. This relationship indicates that higher levels of ETR are linked to increased productivity. A moderate positive correlation is observed between NPP and ETP, with an R2 of 0.11. Although this relationship is statistically significant (p = 0.049), it is weaker than those observed with ETR and LUE.
Precipitation shows a positive correlation with NPP, with an R2 of 0.21. This means that 21% of the variance in NPP can be explained by precipitation. This relationship suggests that precipitation influences primary productivity, but not as much as LUE or ETR. Temperature shows the weakest relationship with NPP, with an R2 of 0.052, indicating that about 5% of the variance in NPP is explained by temperature. This correlation is weak and not statistically significant (p = 0.18), suggesting that mean temperature has little direct impact on NPP compared to the other factors studied.
Figure 11 highlights the interannual variability of net primary production (NPP) and precipitation. Generally, there seems to be some correlation between variations in NPP and precipitation. For instance, peaks in precipitation in 1994 and 2016 coincide with peaks in NPP, suggesting that rainy years tend to be associated with higher net primary production. However, this relationship is not perfect. For example, in 1998, a peak in precipitation did not correspond to a peak in NPP, and in 2011, a peak in NPP is not associated with a peak in rainfall. This indicates that factors other than precipitation also influence NPP.

4. Discussion

This study has described the dynamics of NPP in Togo over a 36-year period and identified the climatic factors influencing this dynamic to varying degrees. The average annual NPP value from 1987 to 2022 is 4565.31 kg C ha−1. This value, simulated using the CASA model, falls within the range obtained by other studies using the same model, such as 349.20 g m−2 by Ogbue, Igboeli [63] in the Niger River basin; 3401.55 kg C ha−1 by Folega, Atakpama [59] in southern Togo near the Donomadé eco-village; and 462.63 g m−2 by Liu, Yang [64]. NPP exhibits variability with observed peaks. Spatial variability is noted in the performance of ecosystems (Figure 4). Performances range from 452.08 kg C ha−1 year−1 in areas with low assimilation to 11,510.9 kg C ha−1 year−1 in high-performance zones. This observation, also noted by Ogbue, Igboeli [63], is related to the nature of forest ecosystems present in these areas and their level of degradation. High-productivity zones such as Ecological Zone IV, the Atakora Chain, and certain protected areas are relatively well-preserved. They have a production ranging between 7603.38 kg C ha−1 year−1 and 11,510.9 kg C ha−1 year−1. Ecological Zone IV, an extension of the humid and semi-deciduous forests of Ghana [65], is among the high forest cover areas in Togo, while the Atakora Chain, dominated by mountainous relief and a diversity of ecosystems [43] and with its difficult access, is less disturbed. Low-productivity zones have an NPP ranging between 452.08 kg C ha−1 year−1 and 5986.45 kg C ha−1 year−1 in 2022. These include the Savannas region, the Kara River basin, the coastal zone, and some large water bodies such as the Nangbéto Dam. The detection of changes at the pixel level between the 2000 and 2022 rasters highlighted these areas as having experienced the greatest loss in productivity during this time span. These zones face environmental challenges [66] and significant human pressures. According to the results of the latest general population and housing census (5th RGPH), these areas have the highest population density in the country, reaching up to 6600 inhabitants/km2 [46]. The Savannas region, which includes the Bombouaka Cuesta, the Eburnean Shield, and many protected areas such as the Oti-Mandouri wildlife reserves, Fosse aux Lions, and Galangashi, is facing alarming degradation of forest ecosystems [67,68,69,70]. The increased anthropization of these ecosystems, especially the protected areas, has been driven by the demand for exploitable land to meet the needs of a continually growing population [71]. This result confirms the country’s achievements in terms of restoring degraded ecosystems and sustainable land management efforts undertaken by Togo with support from its technical and financial partners.
Global Land Use and Land Cover (GLULC) data from the Earthmap platform were used in this study. These publicly accessible data are globally validated and are reference information from FAO. Between 2000 and 2022, a regressive dynamic of natural formations in favor of anthropogenic formations was observed. Several studies on the spatio-temporal dynamics of vegetation in Togo have reached the same conclusion [34,43,65,69,72,73,74,75]. The distribution of NPP (Figure 4) for the year 2022 corresponds to the land cover units of the same year. These results, similar to those of [13], indicate that high forest cover areas are the zones of high productivity in Togo. The absence of primary forests leads to the growth of all ecosystems, resulting in high carbon sequestration and storage. The increase in the area of anthropogenic formations in 2022 compared to 2000 did not hinder the high average annual productivity. The promotion and adoption of good sustainable land management practices, such as agroforestry, which combines trees and crops, and endogenous protection benefiting certain species, make cultivable plot ecosystems that sequester a lot of carbon.
The increase in NPP in Togo is more influenced by changes in land use (188.63%). Studies have shown that changes in land use, such as the conversion of grasslands and mosaics of crops and natural vegetation into forests and cultivated lands, can lead to increased NPP due to the expansion of cultivated and forested lands [61,76]. Land use changes are marked by urbanization, agricultural expansion, and ecological restoration operations undertaken by the state and its partners. The increase in performance of certain land use units is responsible for these results.
Climate parameters have all shown positive correlations of varying intensities. Light Use Efficiency (LUE) (r2 = 0.75), actual evapotranspiration (r2 = 0.43), precipitation (r2 = 0.20), potential evapotranspiration (r2 = 0.10), and temperature (r2 = 0.05) contribute to the variation in NPP. These results align with those of other studies [77,78,79,80]. These authors have demonstrated that vegetation is affected by climatic variables. This influence will become even more pronounced in the coming years due to increasing climate variability [81]. The effect of precipitation and temperature on vegetation growth, and thus on productivity, justifies its positive correlation with NPP [39]. This study reveals a stronger correlation with Light Use Efficiency (LUE). LUE and actual evapotranspiration appear as the most determining factors, while temperature shows little direct influence on NPP. These results underscore the importance of light and water in ecosystem productivity. Togo’s location near the equator results in negligible temperature variation. Additionally, LUE is a key indicator providing important information on how vegetation productivity responds to environmental conditions [82].

5. Limitations and Outlook of the Study

This research focuses specifically on Togo, which may limit the generalizability of the findings to regions with different climatic and ecological conditions. While the CASA model is effective, it relies on certain assumptions regarding vegetation dynamics and may not capture the full complexity of ecosystems, potentially leading to oversimplified conclusions about ecosystem productivity. Additionally, the study covers a specific time frame (1987 to 2022), which may not fully account for long-term ecological changes or trends influencing NPP beyond this period. The lack of field data on NPP in Togo also limited our ability to validate the findings.
Future work should aim to improve data collection methods to fill existing gaps and enhance the temporal resolution of the data, enabling more robust analyses of NPP dynamics. Expanding the research to include comparative studies across different regions in West Africa could provide valuable insights into regional variations in ecosystem responses to climate change. Further refinement of the CASA model or the integration of additional ecological models could improve the accuracy of NPP estimations, better accounting for complex interactions within ecosystems. Establishing a long-term monitoring framework for Togo’s ecosystems would facilitate ongoing assessments of NPP and its relationship with climate variables, supporting the development of effective conservation strategies.
These steps will contribute to a more comprehensive understanding of ecosystem dynamics in the context of climate change and support Togo’s commitments to reducing greenhouse gas emissions.

6. Conclusions

This study analyzed the spatio-temporal dynamics, trends, and variations of Net Primary Productivity (NPP) in Togo over the last 36 years. It also detected changes in NPP, examined the dynamics within ecosystems, and investigated the climatic factors influencing NPP. The average annual NPP is 4565.31 Kg C ha−1. A variability in productivity is observed with peaks. High production areas, mainly represented by ecological zone IV and the Atakora range, are dense and relatively protected forest formations. The Savannas region, the Kara River basin, the central east, and the coastal zone, which face enormous anthropogenic pressures, accumulate less carbon. Forest formations are the land cover unit that accumulated the most carbon in 2000. They see their productivity increase in 2022 despite a decrease in their areas. Climatic parameters all showed positive relationships of varying intensities. Light use efficiency, with its highest correlation (r2 = 0.75), demonstrates the overall influence of climatic parameters. The influence of climatic factors on NPP is crucial to anticipate ecosystem behavior in the context of climate change.

Author Contributions

Conceptualization, B.B. and F.F.; methodology, F.F. and B.B.; software, B.D.M.-e. and B.B.; validation, F.F., W.K. and B.K.; formal analysis, B.B.; data curation, B.B.; writing—original draft preparation, B.B.; writing—review and editing, B.D.M.-e., F.F., L.W. and H.H.G.; visualization, B.B., B.D.M.-e. and F.F.; supervision, W.K. and B.K.; project administration, F.F. All authors have read and agreed to the published version of the manuscript.

Funding

This study did not receive any funding. It was conducted with the support of the Laboratory of Botany and Plant Ecology at the University of Lomé.

Institutional Review Board Statement

Not applicable.

Informed Consent Statement

Not applicable.

Data Availability Statement

All data used within this research are publicly available and cited accordingly.

Acknowledgments

We express our deep gratitude to the Laboratory of Botany and Plant Ecology at the University of Lomé for their invaluable support throughout this study. Their expertise, as well as the resources made available to us, have been essential to the completion of this work.

Conflicts of Interest

The authors declare no conflicts of interest.

References

  1. Cao, M.; Woodward, F.I. Dynamic responses of terrestrial ecosystem carbon cycling to global climate change. Nature 1998, 393, 249–252. [Google Scholar]
  2. Jackson, R.B.; Randerson, J.T.; Canadell, J.G.; Anderson, R.G.; Avissar, R.; Baldocchi, D.D.; Bonan, G.B.; Caldeira, K.; Diffenbaugh, N.S.; Field, C.B. Protecting climate with forests. Environ. Res. Lett. 2008, 3, 044006. [Google Scholar] [CrossRef]
  3. Peñuelas, J.; Rutishauser, T.; Filella, I. Phenology feedbacks on climate change. Science 2009, 324, 887–888. [Google Scholar] [CrossRef] [PubMed]
  4. Anderson, R.G.; Canadell, J.G.; Randerson, J.T.; Jackson, R.B.; Hungate, B.A.; Baldocchi, D.D.; Ban-Weiss, G.A.; Bonan, G.B.; Caldeira, K.; Cao, L. Biophysical considerations in forestry for climate protection. Front. Ecol. Environ. 2011, 9, 174–182. [Google Scholar] [CrossRef]
  5. Peng, D.; Zhang, B.; Liu, L.; Chen, D.; Fang, H.; Hu, Y. Seasonal dynamic pattern analysis on global FPAR derived from AVHRR GIMMS NDVI. Int. J. Digit. Earth 2012, 5, 439–455. [Google Scholar] [CrossRef]
  6. Protected Areas Map of the World. Available online: https://www.protectedplanet.net (accessed on 18 March 2020).
  7. Mao, L.; Li, M.; Shen, W. Remote sensing applications for monitoring terrestrial protected areas: Progress in the last decade. Sustainability 2020, 12, 5016. [Google Scholar] [CrossRef]
  8. Grogan, K.; Pflugmacher, D.; Hostert, P.; Verbesselt, J.; Fensholt, R. Mapping clearances in tropical dry forests using breakpoints, trend, and seasonal components from MODIS time series: Does forest type matter? Remote Sens. 2016, 8, 657. [Google Scholar] [CrossRef]
  9. Zhang, Y.; Zhang, X.; Yu, G.; Tao, J.; Yang, J.; Jiang, Y.; Wimberly, M.C.; Zhu, J. Climate-driven global changes in carbon use efficiency. Glob. Ecol. Biogeogr. 2013, 23, 144–155. [Google Scholar] [CrossRef]
  10. Van Tuyl, S.; Law, B.; Turner, D.; Gitelman, A.I. Variability in net primary production and carbon storage in biomass across Oregon forests—An assessment integrating data from forest inventories, intensive sites, and remote sensing. For. Ecol. Manag. 2005, 209, 273–291. [Google Scholar] [CrossRef]
  11. Piao, S.; Fang, J.; He, J. Variations in vegetation net primary production in the Qinghai-Xizang Plateau, China, from 1982 to 1999. Clim. Change 2006, 74, 253–267. [Google Scholar] [CrossRef]
  12. Lobell, D.; Hicke, J.; Asner, G.; Field, C.; Tucker, C.; Los, S. Satellite estimates of productivity and light use efficiency in United States agriculture, 1982–1998. Glob. Change Biol. 2002, 8, 722–735. [Google Scholar] [CrossRef]
  13. Zhang, R.; Zhou, Y.; Luo, H.; Wang, F.; Wang, S. Estimation and analysis of spatiotemporal dynamics of the net primary productivity integrating efficiency model with process model in karst area. Remote Sens. 2017, 9, 477. [Google Scholar] [CrossRef]
  14. Potter, C.; Klooster, S.; Genovese, V.; Hiatt, C.; Boriah, S.; Kumar, V.; Mithal, V.; Garg, A. Terrestrial ecosystem carbon fluxes predicted from MODIS satellite data and large-scale disturbance modeling. Int. J. Geosci. 2012, 3, 469–479. [Google Scholar] [CrossRef]
  15. Prince, S.D.; Goward, S.N. Global primary production: A remote sensing approach. J. Biogeogr. 1995, 22, 815–835. [Google Scholar] [CrossRef]
  16. Goetz, S.J.; Prince, S.D.; Goward, S.N.; Thawley, M.M.; Small, J. Satellite remote sensing of primary production: An improved production efficiency modeling approach. Ecol. Model. 1999, 122, 239–255. [Google Scholar] [CrossRef]
  17. Landsberg, J.; Waring, R. A generalised model of forest productivity using simplified concepts of radiation-use efficiency, carbon balance and partitioning. For. Ecol. Manag. 1997, 95, 209–228. [Google Scholar] [CrossRef]
  18. Yuan, W.; Liu, S.; Zhou, G.; Zhou, G.; Tieszen, L.L.; Baldocchi, D.; Bernhofer, C.; Gholz, H.; Goldstein, A.H.; Goulden, M.L. Deriving a light use efficiency model from eddy covariance flux data for predicting daily gross primary production across biomes. Agric. For. Meteorol. 2007, 143, 189–207. [Google Scholar] [CrossRef]
  19. Running, S.W.; Nemani, R.R.; Heinsch, F.A.; Zhao, M.; Reeves, M.; Hashimoto, H. A continuous satellite-derived measure of global terrestrial primary production. Bioscience 2004, 54, 547–560. [Google Scholar] [CrossRef]
  20. Veroustraete, F.; Sabbe, H.; Eerens, H. Estimation of carbon mass fluxes over Europe using the C-Fix model and Euroflux data. Remote Sens. Environ. 2002, 83, 376–399. [Google Scholar] [CrossRef]
  21. Xiao, X.; Hollinger, D.; Aber, J.; Goltz, M.; Davidson, E.A.; Zhang, Q.; Moore, B., III. Satellite-based modeling of gross primary production in an evergreen needleleaf forest. Remote Sens. Environ. 2004, 89, 519–534. [Google Scholar] [CrossRef]
  22. Ruimy, A.; Dedieu, G.; Saugier, B.J.G.B.C. TURC: A diagnostic model of continental gross primary productivity and net primary productivity. Glob. Biogeochem. Cycles 1996, 10, 269–285. [Google Scholar] [CrossRef]
  23. Potter, C.S.; Randerson, J.T.; Field, C.B.; Matson, P.A.; Vitousek, P.M.; Mooney, H.A.; Klooster, S.A. Terrestrial ecosystem production: A process model based on global satellite and surface data. Glob. Biogeochem. Cycles 1993, 7, 811–841. [Google Scholar] [CrossRef]
  24. Gamon, J.; Penuelas, J.; Field, C. A narrow-waveband spectral index that tracks diurnal changes in photosynthetic efficiency. Remote Sens. Environ. 1992, 41, 35–44. [Google Scholar] [CrossRef]
  25. Maxwell, K.; Johnson, G.N. Chlorophyll fluorescence—A practical guide. J. Exp. Bot. 2000, 51, 659–668. [Google Scholar] [CrossRef] [PubMed]
  26. Ball, R.; Aherne, F. Influence of dietary nutrient density, level of feed intake and weaning age on young pigs. II. Apparent nutrient digestibility and incidence and severity of diarrhea. Can. J. Anim. Sci. 1987, 67, 1105–1115. [Google Scholar] [CrossRef]
  27. Collatz, G.J.; Ball, J.T.; Grivet, C.; Berry, J.A. Physiological and environmental regulation of stomatal conductance, photosynthesis and transpiration: A model that includes a laminar boundary layer. Agric. For. Meteorol. 1991, 54, 107–136. [Google Scholar] [CrossRef]
  28. Von Caemmerer, S.v.; Farquhar, G.D. Some relationships between the biochemistry of photosynthesis and the gas exchange of leaves. Planta 1981, 153, 376–387. [Google Scholar] [CrossRef]
  29. Nemani, R.R.; Keeling, C.D.; Hashimoto, H.; Jolly, W.M.; Piper, S.C.; Tucker, C.J.; Myneni, R.B.; Running, S.W. Climate-driven increases in global terrestrial net primary production from 1982 to 1999. Science 2003, 300, 1560–1563. [Google Scholar] [CrossRef]
  30. Pan, Y.; Birdsey, R.; Hom, J.; McCullough, K.; Clark, K. Improved estimates of net primary productivity from MODIS satellite data at regional and local scales. Ecol. Appl. 2006, 16, 125–132. [Google Scholar] [CrossRef]
  31. Abd Wahid Rasib, A.L.I.; Cracknell, A.; Faidi, M.A. Local scale mapping of net primary production in tropical rain forest using Modis satellite data. Int. Arch. Photogramm. Remote Sens. Spat. Inf. Sci. 2008, XXXVII, 1441–1446. [Google Scholar]
  32. Li, J.; Cui, Y.; Liu, J.; Shi, W.; Qin, Y. Estimation and analysis of net primary productivity by integrating MODIS remote sensing data with a light use efficiency model. Ecol. Model. 2013, 252, 3–10. [Google Scholar] [CrossRef]
  33. Bradford, J.; Hicke, J.; Lauenroth, W. The relative importance of light-use efficiency modifications from environmental conditions and cultivation for estimation of large-scale net primary productivity. Remote Sens. Environ. 2005, 96, 246–255. [Google Scholar] [CrossRef]
  34. Fousseni, F.; Bilouktime, B.; Mustapha, T.; Kamara, M.; Wouyo, A.; Aboudoumisamilou, I.; Oyetunde, D.; Kperkouma, W.; Komlan, B.; Koffi, A. Changements d’affectation des terres et diversité structurelle de la forêt communautaire d’Affem Boussou dans la commune de Tchamba 1 (Préfecture de Tchamba, Togo). Conservation 2023, 3, 346–362. [Google Scholar] [CrossRef]
  35. Chen, Y.-Y.; Huang, W.; Wang, W.-H.; Juang, J.-Y.; Hong, J.-S.; Kato, T.; Luyssaert, S. Reconstructing Taiwan’s land cover changes between 1904 and 2015 from historical maps and satellite images. Sci. Rep. 2019, 9, 3643. [Google Scholar] [CrossRef]
  36. Olorunfemi, I.E.; Olufayo, A.A.; Fasinmirin, J.T.; Komolafe, A.A. Dynamics of land use land cover and its impact on carbon stocks in Sub-Saharan Africa: An overview. Environ. Dev. Sustain. 2022, 24, 40–76. [Google Scholar] [CrossRef]
  37. Kombate, A.; Folega, F.; Atakpama, W.; Dourma, M.; Wala, K.; Goïta, K. Characterization of land-cover changes and forest-cover dynamics in Togo between 1985 and 2020 from Landsat images using Google Earth Engine. Land 2022, 11, 1889. [Google Scholar] [CrossRef]
  38. MERF. Quatrième Communication Nationale sur les Changements Climatiques du Togo. Projet 4ème CN α 2ème RBA du Togo sur les Changements Climatiques. 2022. Available online: https://unfccc.int/sites/default/files/resource/QUATRIEME%20OMMUNICATION%20%20NATIONALE%20DU%20TOGO%20SUR%20LES%20CHANGEMENTS%20CLIMATIQUES.pdf (accessed on 5 July 2024).
  39. Xie, Y.; Ma, Z.; Fang, M.; Liu, W.; Yu, F.; Tian, J.; Zhang, S.; Yan, Y. Analysis of Net Primary Productivity of Retired Farmlands in the Grain-for-Green Project in China from 2011 to 2020. Land 2023, 12, 1078. [Google Scholar] [CrossRef]
  40. Chen, B.; Zhang, X.; Tao, J.; Wu, J.; Wang, J.; Shi, P.; Zhang, Y.; Yu, C. The impact of climate change and anthropogenic activities on alpine grassland over the Qinghai-Tibet Plateau. Agric. For. Meteorol. 2014, 189, 11–18. [Google Scholar] [CrossRef]
  41. Sun, Y.; Yang, Y.; Zhang, L.; Wang, Z. The relative roles of climate variations and human activities in vegetation change in North China. Phys. Chem. Earth Parts A/B/C 2015, 87, 67–78. [Google Scholar] [CrossRef]
  42. Li, Z.; Chen, J.; Chen, Z.; Sha, Z.; Yin, J.; Chen, Z. Quantifying the contributions of climate factors and human activities to variations of net primary productivity in China from 2000 to 2020. Front. Earth Sci. 2023, 11, 1084399. [Google Scholar] [CrossRef]
  43. Folega, F.; Woegan, Y.A.; Marra, D.; Wala, K.; Batawila, K.; Seburanga, J.L.; Zhang, C.-Y.; Peng, D.-l.; Zhao, X.-H.; Akpagana, K. Long term evaluation of green vegetation cover dynamic in the Atacora Mountain chain (Togo) and its relation to carbon sequestration in West Africa. J. Mt. Sci. 2015, 12, 921–934. [Google Scholar] [CrossRef]
  44. Ern, H. Die vegetation togos. gliederung, gefährdung, erhaltung. Willdenowia. 1979, 9, pp. 295–312. Available online: https://www.jstor.org/stable/3995654 (accessed on 12 October 2023).
  45. Adjossou, K. Diversité Floristique des Forêts Riveraines de la Zone Écologique IV du Togo; Mém DEA biologie de développement, option biologie végétale appliquée, Univ Lomé: Lomé, Togo, 2004; p. 75. [Google Scholar]
  46. INSEED. Résultats Définitifs du RGPH-5 de Novembre 2022; Institut de la Statistique et des Etudes Economiques et Démographiques-Togo: Lomé, Togo, 2022. [Google Scholar]
  47. Zhang, M. Modeling net primary productivity of wetland with a satellite-based light use efficiency model. Geocarto Int. 2022, 37, 4028–4052. [Google Scholar] [CrossRef]
  48. Guan, X.; Shen, H.; Gan, W.; Yang, G.; Wang, L.; Li, X.; Zhang, L.J.R.S. A 33-year NPP monitoring study in southwest China by the fusion of multi-source remote sensing and station data. Remote Sens. 2017, 9, 1082. [Google Scholar] [CrossRef]
  49. Sun, J.; Yue, Y.; Niu, H. Evaluation of NPP using three models compared with MODIS-NPP data over China. PLoS ONE 2021, 16, e0252149. [Google Scholar] [CrossRef]
  50. Monteith, J.L. Solar radiation and productivity in tropical ecosystems. J. Appl. Ecol. 1972, 9, 747–766. [Google Scholar] [CrossRef]
  51. Zhang, J.; Pan, X.; Gao, Z.; Shi, Q.; Lv, G. Carbon uptake and change in net primary productivity of oasis-desert ecosystem in arid western China with remote sensing technique. J. Geogr. Sci. 2006, 16, 315–325. [Google Scholar] [CrossRef]
  52. Hatfield, J.; Asrar, G.; Kanemasu, E.T. Intercepted photosynthetically active radiation estimated by spectral reflectance. Remote Sens. Environ. 1984, 14, 65–75. [Google Scholar] [CrossRef]
  53. Los, S.; Justice, C.; Tucker, C. A global 10 x 10 NDVI data set for climate studies: Part I: Derivation of a reduced resolution data set from the GIMMS Global Area Coverage product of the AVHRR. Int. J. Remote Sens. 1994, 15, 3493–3518. [Google Scholar] [CrossRef]
  54. Peng, X.; Chen, Z.; Chen, Y.; Chen, Q.; Liu, H.; Wang, J.; Li, H. Modelling of the biodiversity of tropical forests in China based on unmanned aerial vehicle multispectral and light detection and ranging data. Int. J. Remote Sens. 2021, 42, 8858–8877. [Google Scholar] [CrossRef]
  55. Jiang, Z.; Huete, A.R.; Didan, K.; Miura, T. Development of a two-band enhanced vegetation index without a blue band. Remote Sens. Environ. 2008, 112, 3833–3845. [Google Scholar] [CrossRef]
  56. Christensen, S.; Goudriaan, J. Deriving light interception and biomass from spectral reflectance ratio. Remote Sens. Environ. 1993, 43, 87–95. [Google Scholar] [CrossRef]
  57. Field, C.B.; Randerson, J.T.; Malmström, C.M. Global net primary production: Combining ecology and remote sensing. Remote Sens. Environ. 1995, 51, 74–88. [Google Scholar] [CrossRef]
  58. Thornthwaite, C.W. An approach toward a rational classification of climate. Geogr. Rev. 1948, 38, 55–94. [Google Scholar] [CrossRef]
  59. Folega, F.; Atakpama, W.; Pereki, H.; Diwediga, B.; Novotny, I.P.; Dray, A.; Gracia, C.; Wala, K.; Batawila, K.; Akpagana, K. GIS/Remote-Sensing-Based Assessment of Vegetation Health Related to Agroecological Practices in the Southeast of Togo. Appl. Sci. 2023, 13, 9106. [Google Scholar] [CrossRef]
  60. Tilton, J.C.; De Colstoun, E.B.; Wolfe, R.E.; Tan, B.; Huang, C. (Eds.) Generating ground reference data for a global impervious surface survey. In Proceedings of the 2012 IEEE International Geoscience and Remote Sensing Symposium, Munich, Germany, 22–27 July 2012; IEEE: Piscataway, NJ, USA; pp. 5993–5996. [Google Scholar]
  61. Liu, F.; Xu, C.; Yang, X.; Ye, X. Controls of climate and land-use change on terrestrial net primary productivity variation in a subtropical humid basin. Remote Sens. 2020, 12, 3525. [Google Scholar] [CrossRef]
  62. Cleophas, T.J.; Zwinderman, A.H.; Cleophas, T.J.; Zwinderman, A.H. Bayesian Pearson correlation analysis. In Modern Bayesian Statistics in Clinical Research; Springer: Cham, Switzerland, 2018. [Google Scholar] [CrossRef]
  63. Ogbue, C.; Igboeli, E.; Yahaya, I.; Yeneayehu, F.; Fu, S.; Chen, Y.; You, Y.; Wang, Y. Spatiotemporal dynamics and climatic factors affecting Net Primary Productivity in Niger River Basin, from 2000 to 2020. Appl. Ecol. Environ. Res. 2023, 21, 6003–6022. [Google Scholar] [CrossRef]
  64. Liu, Y.; Yang, Y.; Wang, Q.; Khalifa, M.; Zhang, Z.; Tong, L.; Li, J.; Shi, A. Assessing the Dynamics of Grassland Net Primary Productivity in Response to Climate Change at the Global Scale. Chin. Geogr. Sci. 2019, 29, 725–740. [Google Scholar] [CrossRef]
  65. Adjossou, K. Diversité, Structure et Dynamique de la Végétation Dans les Fragments de Forêts Humides du Togo: Les Enjeux Pour la Conservation de la Biodiversite. Ph.D. Thesis, De l’Université de Lomé, Lomé, Togo, 2009; 235p. [Google Scholar]
  66. PNUD. Situation de Référence des Paysages. Stratégie Nationale du Programme de Micro Financements du FEM pour L’utilisation des Fonds de la 6e Phase Opérationnelle (OP 6); PNUD: New York, NY, USA, 2016. [Google Scholar]
  67. Atakpama, W.; Badjare, B.; Aladji, E.Y.K.; Batawila, K.; Akpagana, K. Dégradation alarmante des ressources Forestières de la forêt classée de la fosse de Doungh au Togo. Afr. J. Land Policy Geospat. Sci. 2023, 6, 485–503. [Google Scholar]
  68. Polo-Akpisso, A.; Wala, K.; Soulemane, O.; Foléga, F.; Akpagana, K.; Tano, Y. Assessment of habitat change processes within the Oti-Keran-Mandouri network of protected areas in Togo (West Africa) from 1987 to 2013 using decision tree analysis. Sci 2020, 2, 1. [Google Scholar] [CrossRef]
  69. Folega, F.; Zhang, C.-y.; Zhao, X.-h.; Wala, K.; Batawila, K.; Huang, H.-g.; Dourma, M.; Akpagana, K. Satellite monitoring of land-use and land-cover changes in northern Togo protected areas. J. For. Res. 2014, 25, 385–392. [Google Scholar] [CrossRef]
  70. Folega, F.; Haliba, M.; Folega, A.A.; Ekougoulou, R.; Wala, K.; Akpagana, K. Diversité structurale des ligneux en lien avec l’utilisation des terres du Socle Eburneen au Togo. Ann. Rech. For. Algérie 2022, 12, 7–25. [Google Scholar]
  71. Badjare, B.; Woegan, Y.A.; Folega, F.; Atakpama, W.; Wala, K.; Akpagana, K. Vulnérabilité des ressources ligneuses en lien avec les différentes formes d’usages au Togo: Cas du paysage des aires protégées Doungh-fosse aux lions (Région des Savanes). Rev. Agrobiol. 2021, 11, 2552–2565. [Google Scholar]
  72. Koumoi, Z.; Alassane, A.; Djangbedja, M.; Boukpessi, T.; Kouya, A.-E. Dynamique spatio-temporelle de l’occupation du sol dans le Centre-Togo. AHOHO-Rev. Géographie LARDYMES 2013, 7, 163–172. [Google Scholar]
  73. Djiwa, O. Dynamique Forestière et Diagnostic de la Gestion de la Forêt Classée d’Abdoulaye au Togo; AgroParisTech: Palaiseau, France, 2008. [Google Scholar]
  74. Dimobe, K.; Wala, K.; Batawila, K.; Dourma, M.; Woegan, Y.A.; Akpagana, K. Analyse spatiale des différentes formes de pressions anthropiques dans la réserve de faune de l’Oti-Mandouri (Togo). VertigO-La Rev. Électronique En Sci. L’environnement 2012, 14. [Google Scholar] [CrossRef]
  75. Akodéwou, A.; Oszwald, J.; Saïdi, S.; Gazull, L.; Akpavi, S.; Akpagana, K.; Gond, V. Land use and land cover dynamics analysis of the Togodo protected area and its surroundings in Southeastern Togo, West Africa. Sustainability 2020, 12, 5439. [Google Scholar] [CrossRef]
  76. Yang, H.; Hu, D.; Peng, F.; Wang, Y. Exploring the response of net primary productivity variations to land use/land cover change: A case study in Anhui, China. Pol. J. Environ. Stud. 2019, 28, 3971–3984. [Google Scholar] [CrossRef]
  77. Pang, Y.; Chen, C.; Guo, B.; Qi, D.; Luo, Y. Impacts of Climate Change and Anthropogenic Activities on the Net Primary Productivity of Grassland in the Southeast Tibetan Plateau. Atmosphere 2023, 14, 1217. [Google Scholar] [CrossRef]
  78. Ge, W.; Deng, L.; Wang, F.; Han, J. Quantifying the contributions of human activities and climate change to vegetation net primary productivity dynamics in China from 2001 to 2016. Sci. Total Environ. 2021, 773, 145648. [Google Scholar] [CrossRef]
  79. Luo, Z.; Wu, W.; Yu, X.; Song, Q.; Yang, J.; Wu, J.; Zhang, H.J.R.S. Variation of net primary production and its correlation with climate change and anthropogenic activities over the Tibetan Plateau. Remote Sens. 2018, 10, 1352. [Google Scholar] [CrossRef]
  80. Luo, L.; Ma, W.; Zhuang, Y.; Zhang, Y.; Yi, S.; Xu, J.; Long, Y.; Ma, D.; Zhang, Z.J.E.I. The impacts of climate change and human activities on alpine vegetation and permafrost in the Qinghai-Tibet Engineering Corridor. Ecol. Indic. 2018, 93, 24–35. [Google Scholar] [CrossRef]
  81. Bejagam, V.; Sharma, A. Impact of climatic changes and anthropogenic activities on ecosystem net primary productivity in India during 2001–2019. Ecol. Inform. 2022, 70, 101732. [Google Scholar] [CrossRef]
  82. Li, M.; Shaoqiang, W.; Jinghua, C.; Bin, C.; Leiming, Z.; Lixia, M.; Leigang, S.; Amir, M.; Guoyi, Z.; Ze, M. Relationship between Light Use Efficiency and Photochemical Reflectance Index Corrected Using a BRDF Model at a Subtropical Mixed Forest. Remote Sens. 2020, 12, 550. [Google Scholar] [CrossRef]
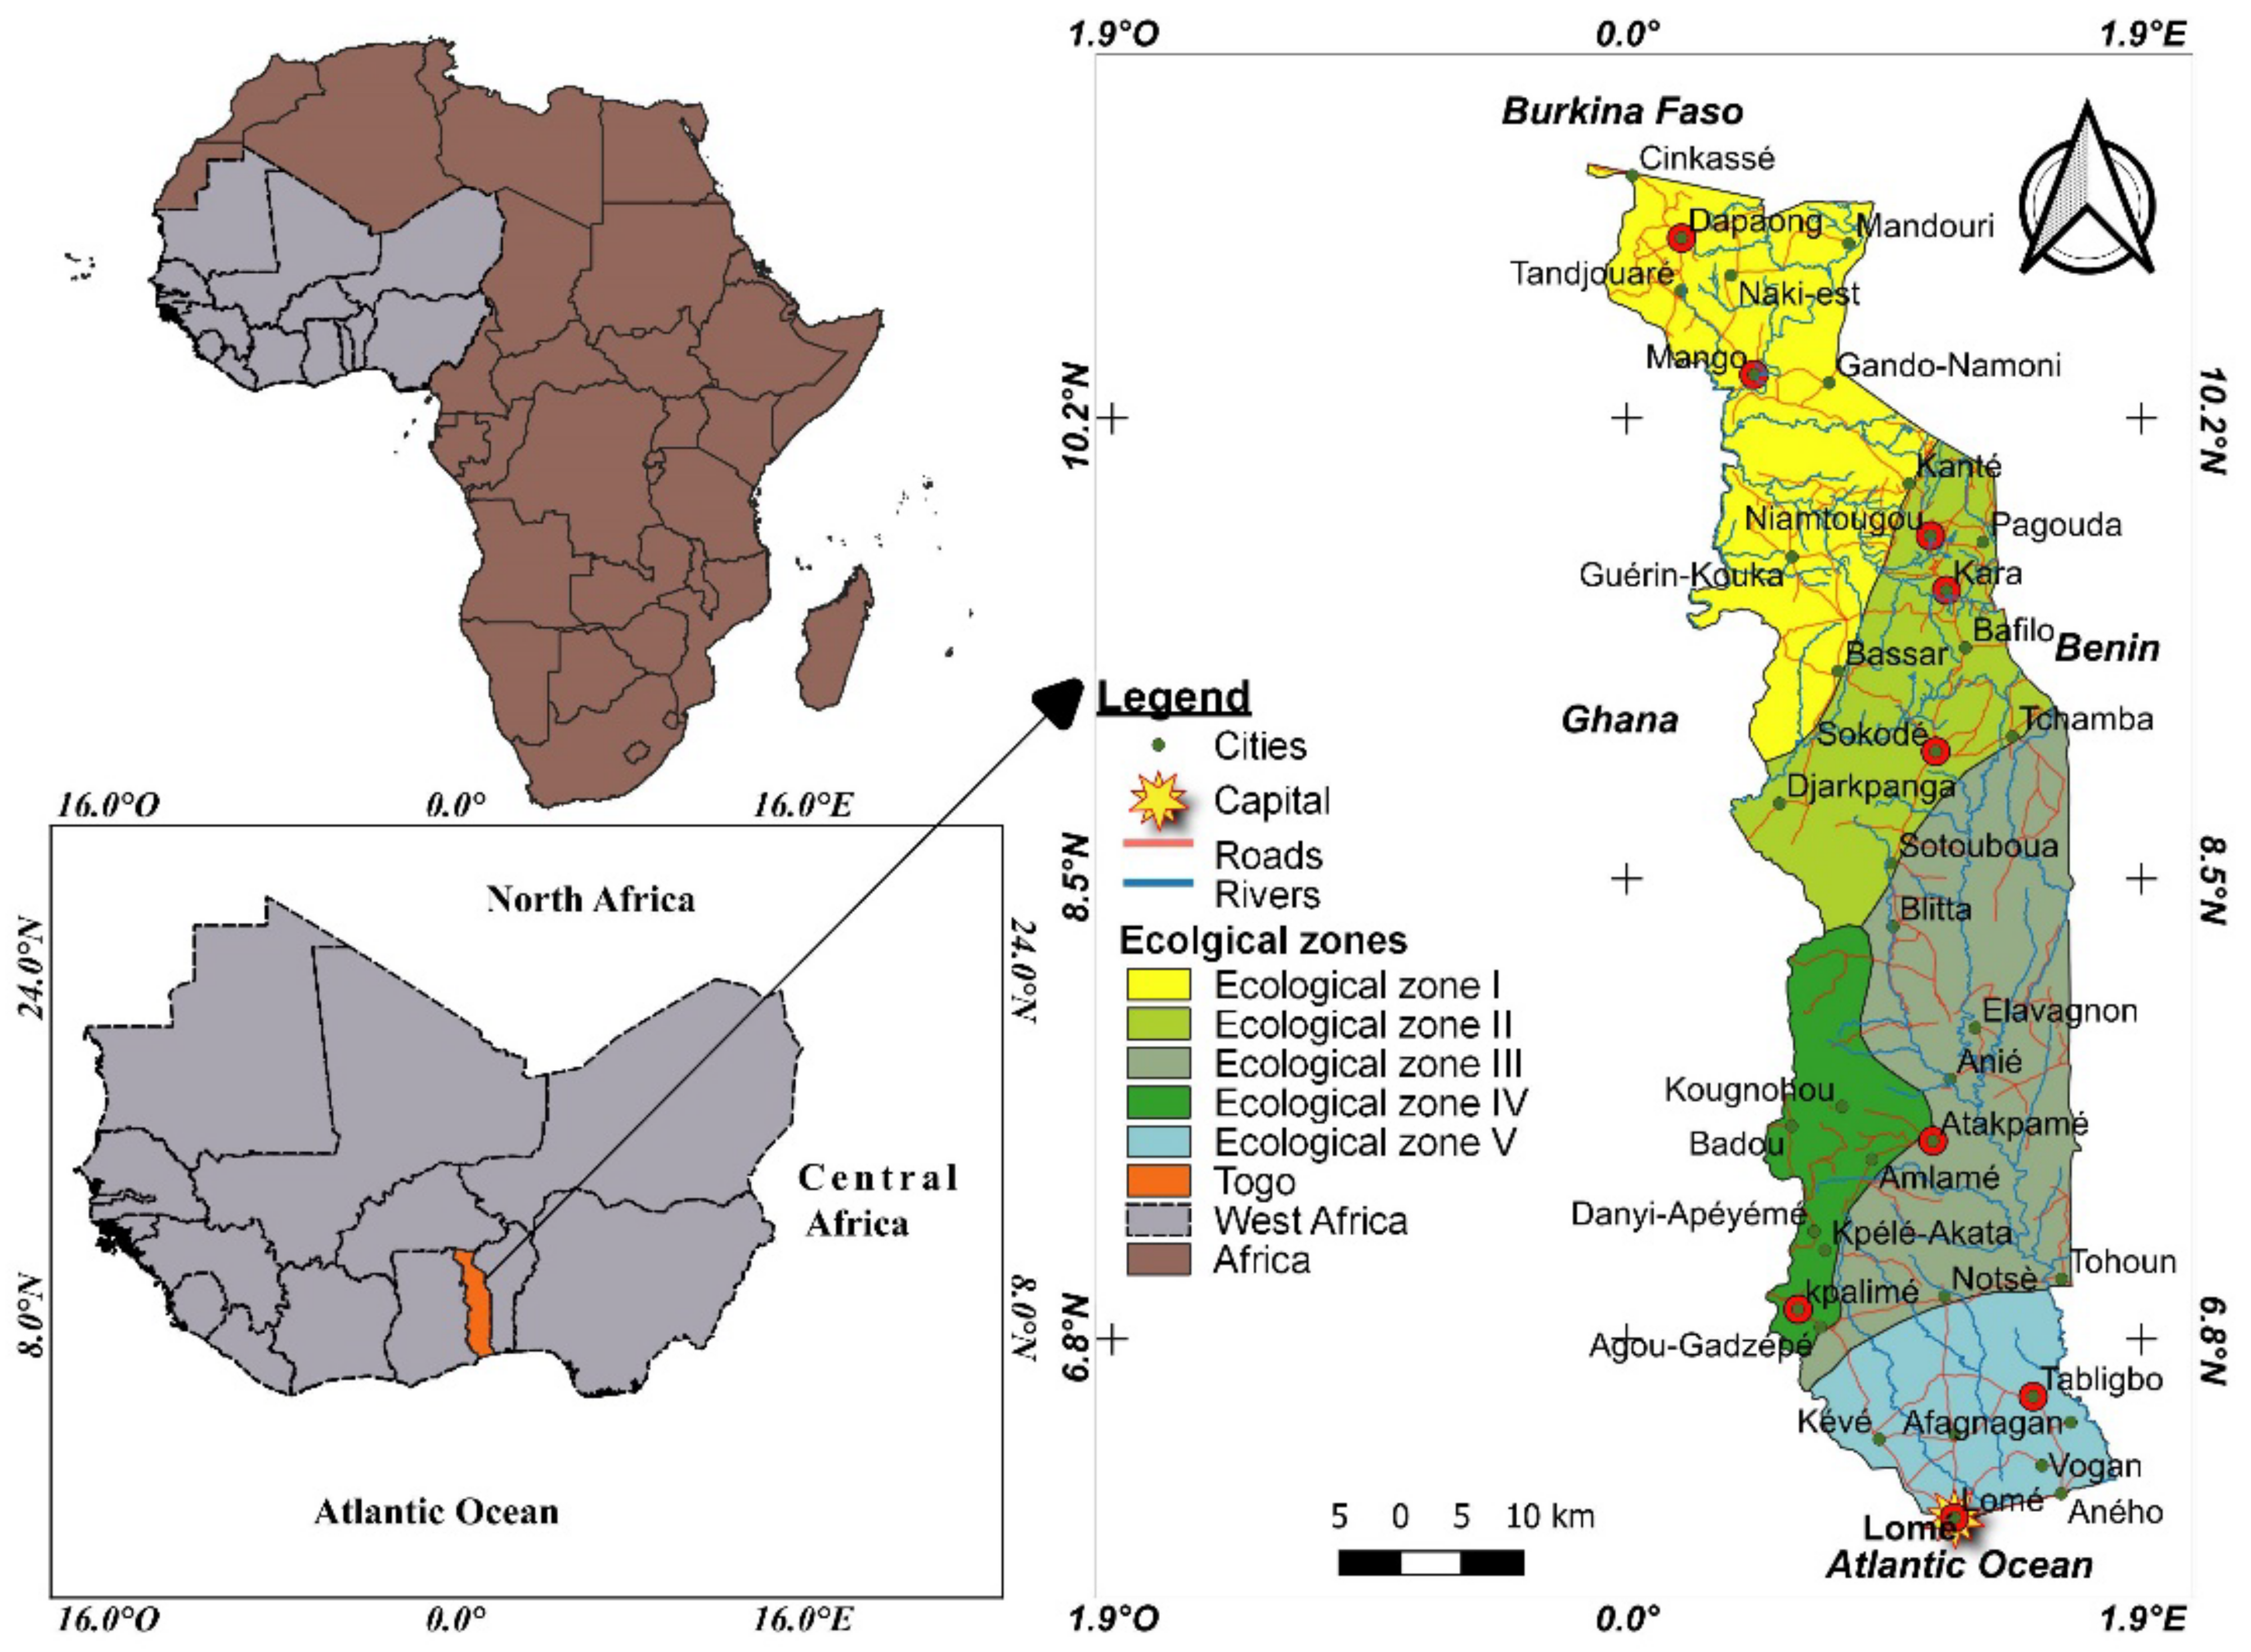
Figure 1. Location of the study area.
Geomatics 04 00018 g001
Figure 2. Comparison between the estimated NPP and the reference NPP MODA17.
Geomatics 04 00018 g002
Figure 3. Dynamics of average annual NPP from 1987 to 2022.
Geomatics 04 00018 g003
Figure 4. Average monthly NPP (1987–2022).
Geomatics 04 00018 g004
Figure 5. Monthly NPP variability.
Geomatics 04 00018 g005
Figure 6. Spatial distribution of NPP in 2022.
Geomatics 04 00018 g006
Figure 7. Detection of NPP change at the pixel level between 2000 and 2022.
Geomatics 04 00018 g007
Figure 8. Land use map of Togo in 2000 and 2022.
Geomatics 04 00018 g008
Figure 9. Impacts of climate change, land use changes, and their intersection on the variation in total production.
Geomatics 04 00018 g009
Figure 10. Results of the correlation analysis between NPP and climatic variables.
Geomatics 04 00018 g010
Figure 11. Evolution of NPP and annual precipitation from 1986 to 2022.
Geomatics 04 00018 g011
Table 1. Monthly values of the K coefficient.
North LatitudeJFMAMJJASOND
51.020.931.031.021.061.031.061.051.011.030.991.02
1010.911.031.031.081.061.081.071.021.020.980.99
Table 2. Area Statistics of Land Cover Units in 2000 and 2022.
Land Use UnitsYear 2000Year 2022Trends
km2ha%km2ha%ha%
Forests25,4642,546,44544.9919,4691,946,87634.40−599,569−23.55
Savanna Mosaic19,5271,952,73934.5013,9721,397,21824.69−555,521−28.45
Crops/Agroforestry Parks/Fallow9360936,00316.5420,0142,001,38235.361,065,379113.82
Swamp Vegetation70870,8021.2567967,8931.20−2909−4.11
Water Bodies24724,6580.4426626,5630.4719057.73
Dwellings/Infrastructure/Quarries1294129,4002.292201220,1143.8990,71370.10
56,6005,660,04710056,6005,660,046100
Table 3. Annual NPP values in different land use units.
Land Use UnitsNPP in 2000 (kg C.ha−1.year−1)NPP in 2022 (kg C.ha−1.year−1)
Forests4813.797050.33
Savanna Mosaic4336.646786.72
Crops/Agroforestry Parks/Fallow4127.762161.66
Swamp Vegetation4208.684914.66
Water Bodies2685.502791.45
Dwellings/Infrastructure/Quarries3956.092604.24
Table 4. Dynamics of NPP by Ecosystems in 2000 and 2022.
Land Use UnitsNPP in 2000 (Pg C.yr−1)%NPP in 20022 (Pg C.yr−1)%Evolution (Pg C.yr−1)
Forests12.2648.1313.7337.951.47
Savanna Mosaic8.4733.259.4824.481.01
Crops/Agroforestry Parks/Fallow3.8615.174.3332.810.46
Swamp Vegetation0.301.170.331.100.04
Water Bodies0.070.260.070.280.01
Dwellings/Infrastructure/Quarries0.512.010.573.380.06
2547100.0028.52100.003.05
Table 5. Areas of land use changes (ha) from 2000 to 2022.
Land Use UnitsForestsSavanna MosaicSwamp VegetationWater BodiesCrops/Agroforestry Parks/FallowDwellings/Infrastructure/Quarries
Forests1,912,269.2218,691.9249.079.2915,689.06339.05
98.21%0.96%0.00%0.00%0.81%0.02%
Savanna mosaic156,129.201,038,496.38564.01732.43199,945.411257.08
11.18%74.33%0.04%0.05%14.31%0.09%
Swamp Vegetation112.71691.1764,832.851510.99633.43109.94
0.17%1.02%95.50%2.23%0.93%0.16%
Water Bodies29.94316.013729.0022,234.7720.94224.59
0.11%1.19%14.04%83.73%0.08%0.85%
Crops/Agroforestry Parks/Fallow452,303.68866,538.691235.7256.06679,920.611256.41
22.60%43.30%0.06%0.00%33.97%0.06%
Dwellings/Infrastructure/Quarries19,983.7531,549.03516.98159.2541,527.15126,362.74
9.08%14.33%0.23%0.07%18.87%57.41%
Table 6. Effects of climate change, land use changes, and their intersection on the variation in total productivity of land use units.
Land Use UnitsȠclimȠlandȠintersect
Forests387.94%−196.60%−91.34%
Savanna Mosaics471.74%−237.54%−134.20%
Crops/Agroforestry Parks/Fallow−397.71%950.39%−452.68%
Swamp Vegetation140.06%−34.31%−5.75%
Water Bodies32.94%64.51%2.55%
Dwellings/Infrastructure/Quarries−285.32%585.35%−200.02%
Disclaimer/Publisher’s Note: The statements, opinions and data contained in all publications are solely those of the individual author(s) and contributor(s) and not of MDPI and/or the editor(s). MDPI and/or the editor(s) disclaim responsibility for any injury to people or property resulting from any ideas, methods, instructions or products referred to in the content.