1. Introduction
Many real-world problems, such as the evacuation planning in urban flooding, are modeled considering several factors such as evacuation time, shelter capacity, number of the individual at risk, and the distance between the risk zones and shelters. In many cases, multi-objective optimization is a way to tackle such problems. One of the ways of getting the optimal solutions to these problems is finding a set of optimal solutions known as Pareto optimal solutions [
1], through multi-objective optimization methods or metaheuristics algorithms. Over recent decades, several metaheuristics algorithms have been developed to tackle this type of optimization problem [
2]. In most cases, these metaheuristics algorithms have shown effectiveness in solving evacuation problems for a scenario of two objectives [
3]. However, real-world problems may involve more than two conflicting objectives, and scalability tests of evolutionary algorithms have shown some problems related to convergence, diversity, and computation time with more than three objective functions. In these cases, depending on the problem at hand, a multi-objective optimization approach might be required, and although this is a relatively new research area [
4], important advances have been made in recent years.
In 2009, Yang and Deb [
5] developed a powerful evolutionary algorithm called Cuckoo Search (CS). This algorithm simulates the behavior of the aggressive reproduction of some species of birds, denominated cuckoos, to find the best solution in optimization problems. Current studies have shown that the multi-objective version of the Cuckoo Search Algorithm is an efficient many-objective optimizer on various testing functions, in comparison with other algorithms [
6,
7]. This superiority is due to the use of a combination of vectorized mutation, crossover by permutation, Lévy flights, and selective elitism among the best solutions [
8].
Evacuation is a risk management strategy that may be used as a means of mitigating the effects of an emergency or disaster on a community. This process involves the movement of people to a safer location and to be effective it must be correctly planned and executed [
9]. This research focuses on the model development of the evacuation of vulnerable people of natural disasters from risk zones to safe areas.
In this study, a multi-objective spatial optimization model for evacuation planning is developed, by considering the three conflicting objectives. The model consists of optimizing the distribution of people from disaster risk zones to safe areas, using the shortest and secure paths, and minimizing the shelter’s overload. A Modified Multi-Objective Cuckoo Search (MOCS) algorithm with an integrated risk function is used to solve the evacuation-planning problem along with geographical information systems. This Discrete Multi-Objective Cuckoo Search (DMOCS) algorithm, which is an innovation of the standard MOCS algorithm, was found to be more promising than the standard MOCS for any-size problem instances. In addition, the DMOCS algorithm demonstrated a good tradeoff between the solution quality and the computational time.
The model was tested on geographical and population data of Mozambique, which is an African country localized in the sub-Saharan region and on the eastern boundary is bathed by the Indian Ocean. Its geographical location puts it in a vulnerable position to natural events. In recent years, Mozambique has been affected by several natural disasters such as hurricanes, cyclones, floods, droughts, and other natural events. For example, in 2019, Mozambique was hit by two big cyclones that killed more than 1000 people [
10,
11]. These natural phenomes continue killing many lives and destroying several infrastructures [
9]. Thus, there is an obvious need to efficiently plan evacuation as a strategy, among others, to handle emergencies and reduce the impact of disaster risks.
The risk areas across Maputo City are prone to inundations. In case of approaching floods, the population inhabiting the areas where the potential impact of a flood is expected to be catastrophic is advised to evacuate. The population is required to evacuate the emergency area in a timely manner. To direct the challenges related with emergency evacuation and facilitate the evacuation process, this research developed a mathematical model and solution algorithms for evacuation planning problems. In order to evaluate the performance of the proposed solution approaches, the formulated mathematical model and the developed solution algorithms were applied for evacuation of inundations (Maputo city, Mozambique).
To solve the problem of shelter location-allocation planning and the risk management on evacuation routes, we have identified the candidate shelters and their corresponding capacities, the origin points and their respective demands, and finally, for each pair of shelter and demand points we have determined the five shortest paths and their corresponding risks. After this data preparation, we can set up the parameters of the DMOCS whose output is the Pareto optimal set.
To test the results, we applied the hypervolume indicator, repeatability analysis, and comparative analysis. The hypervolume indicator revealed that the DMOCS is more efficient than the standard MOCS. The repeatability analysis was used to check the impact of the algorithm parameters’ variability in the evacuation plan problem. The repeatability analysis showed that the number of generations does not significantly influence the cardinality of the optimal Pareto front. We combined the graphical comparative analysis with the algorithm efficiency analysis to choose the best risk function.
This research is organized as follows.
Section 2, background, describes relevant concepts about multi-objective optimization for disaster management, introduces the main contributions in multi-objective optimization for evacuation planning, and describes the Cuckoo Search Algorithm.
Section 3, methodology, describes the case study area, data preparation, algorithm development, and evaluation and test. The introduction of the tests conducted, general results about Pareto front maps, and results of tests are presented in
Section 4. This, also, discusses the analysis and results obtained, and
Section 5 introduces the conclusions.
3. Methodology
This section covers the study area, Maputo, its geographical location, area, population, and municipal districts. In addition, we describe our approach to the data preparation. This identifies de risky zones, group them into assembly points, determine the number of vulnerable people requiring evacuation, and identify the shelters and their capacities. Discuss the mathematical model for evacuation planning. This model consists of three objectives and one of the objectives is to minimize the evacuation distance. Another objective is to minimize the risk in the evacuation process and the last objective is to minimize the shelter’s overload. The last section presents the discrete multi-objective cuckoo search algorithm for solving the evacuation planning problems.
3.1. Case Study (Mozambique, Maputo) Subsection
This research has its focus in the capital, the City of Maputo, which is geographically located in the southern region of Mozambique, occupies an area of 346.77 Km
2, an estimated population of 1,398,523 inhabitants [
30], with a population density of 4033 Habitants/Km
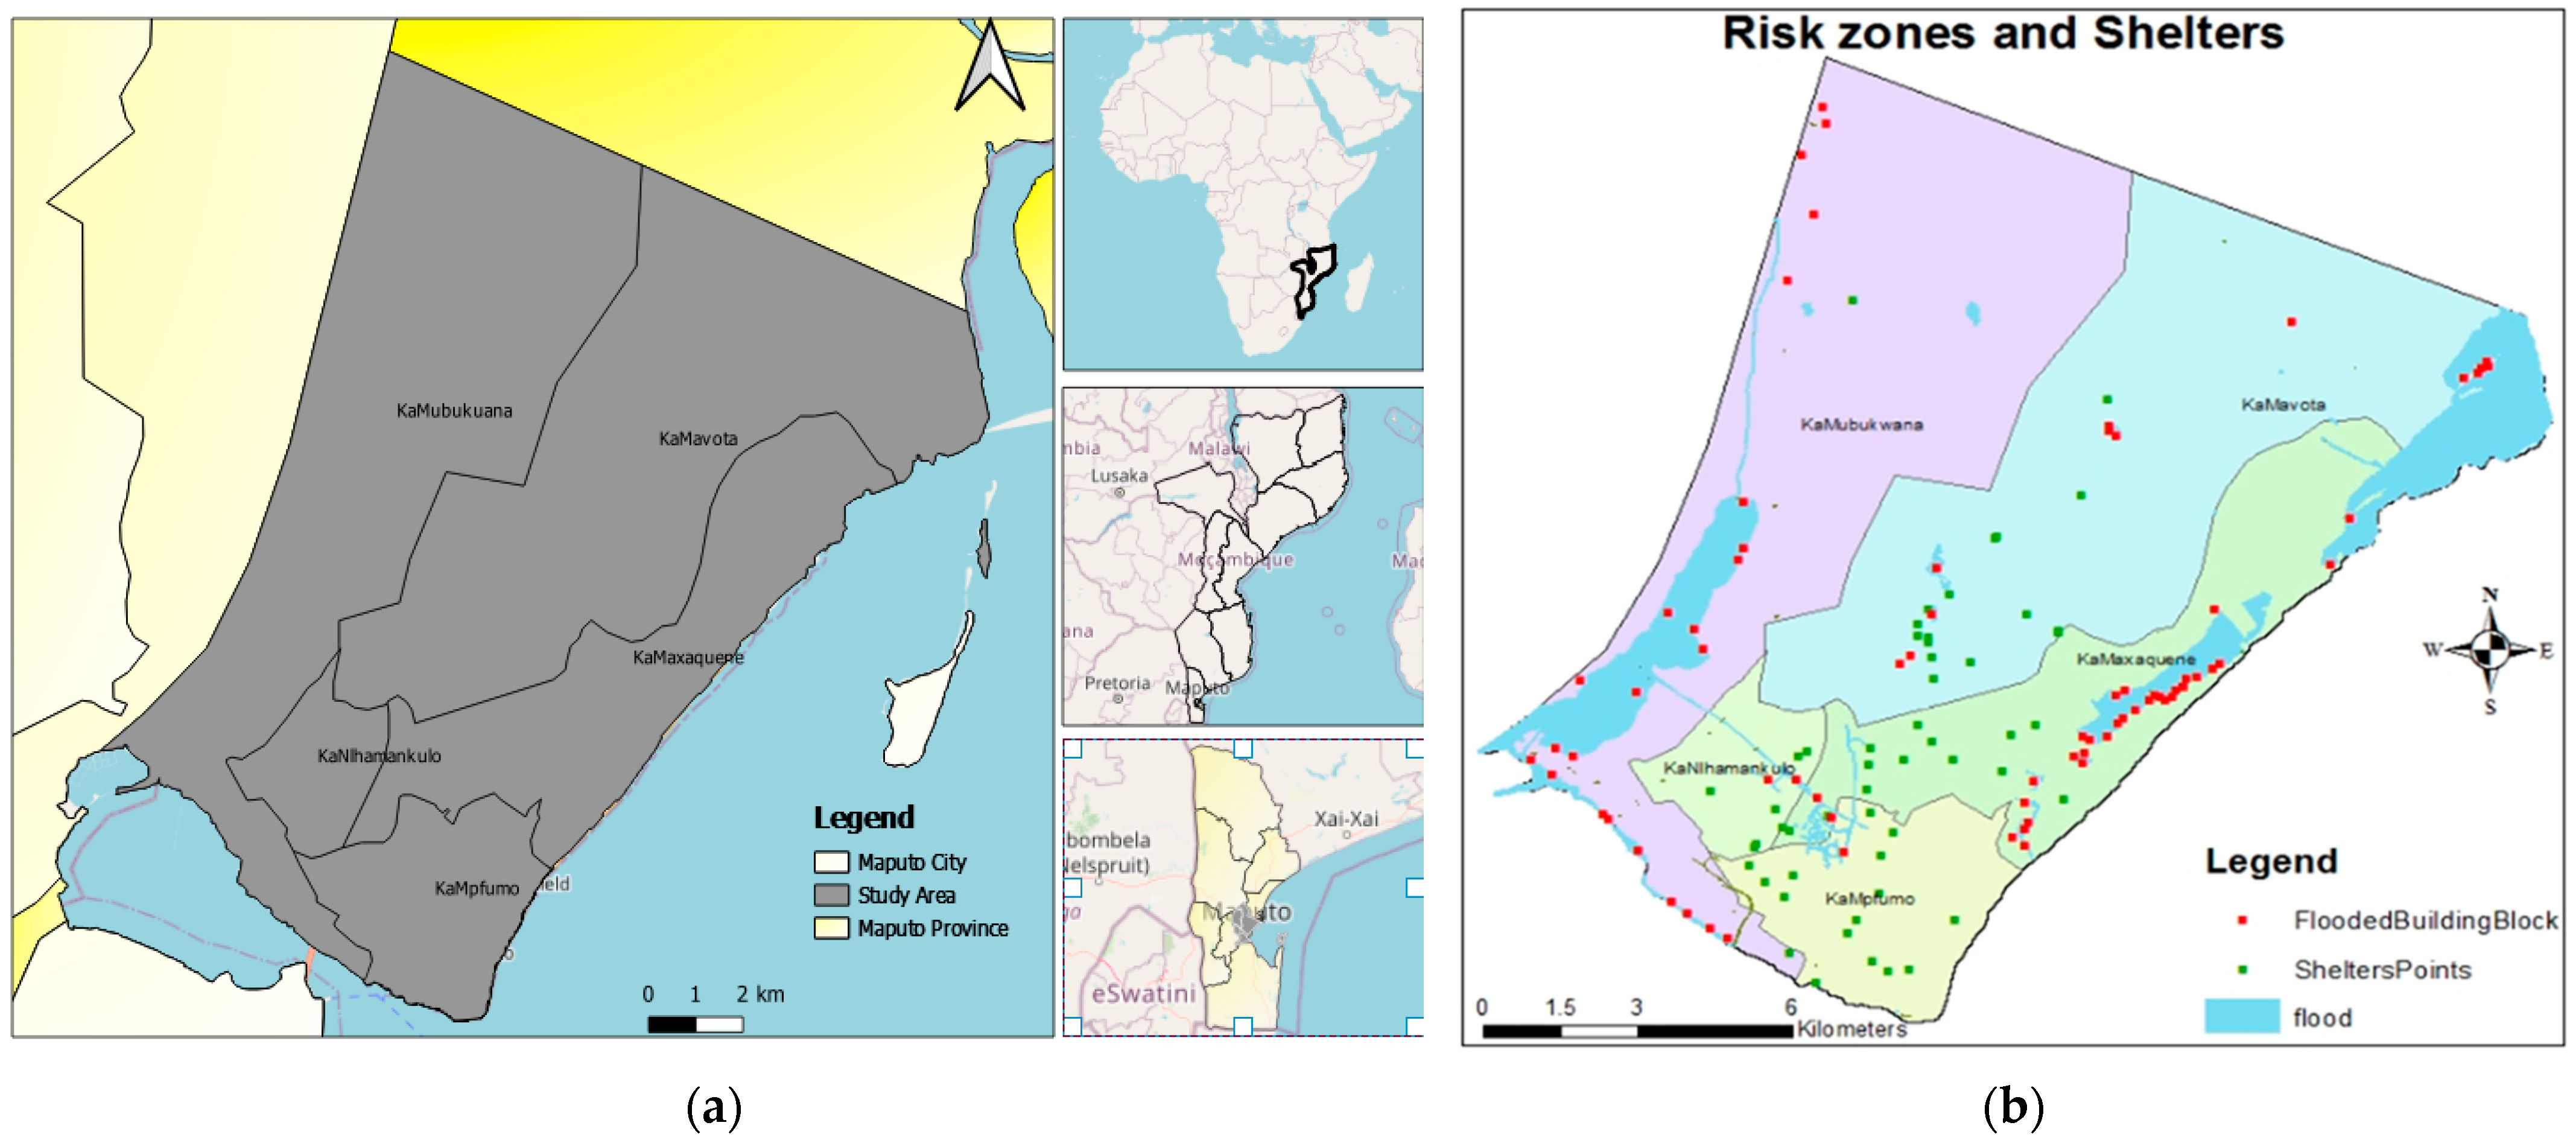
2. It extends from the KaTembe Municipal District to the Chiango (KaMavota) district in the South/North direction and from the Inhaca Island (KaNyaka District) to the Infulene Valley (kaMubukwane District, in the East/West orientation. It makes its limit with Maputo province at the north, south, and west ends and is bathed by the Indian Ocean at the east end, where the island of Inhaca is located [
31], see
Figure 1a. Recently, the city of Maputo has been facing exponential growth in habitational infrastructures and population. On the other hand, the lack of territorial ordering leads to occurrences of natural disasters such as floods, cyclones, and landslides. At the present moment, there is no evacuation planning in Mozambique in general and Maputo city in particular. Thus, there is an urgent need for evacuation planning.
3.2. Data Preparation
The data preparation comprises the selection of the safe areas, determination of their capacities and the determination of the distance matrix, and the risk associated with each route. By using GIS tools, areas such as churches, schools, pavilions, and football fields were selected to serve as shelters to evacuate people. The shelter is the household living space, including the items necessary to support daily activities (
Figure 1b). The choice of shelters followed the criterion of not being a vulnerable place to natural disasters, such as flooding or landslide. To determine the capacity of the shelter we considered that each individual occupies an area of 3.5 square meters due to the tropical climate conditions. This area per individual followed the minimum standards in humanitarian response provided by the Sphere project, which integrated humanitarian non-governmental organizations, the Red Cross, and the Red Crescent movement [
32].
In a distance matrix, , is the number of rows (building blocks), is the number of columns (shelters) and in the matrix entry, , is the row (building block), is the column (shelter) and is the entry.
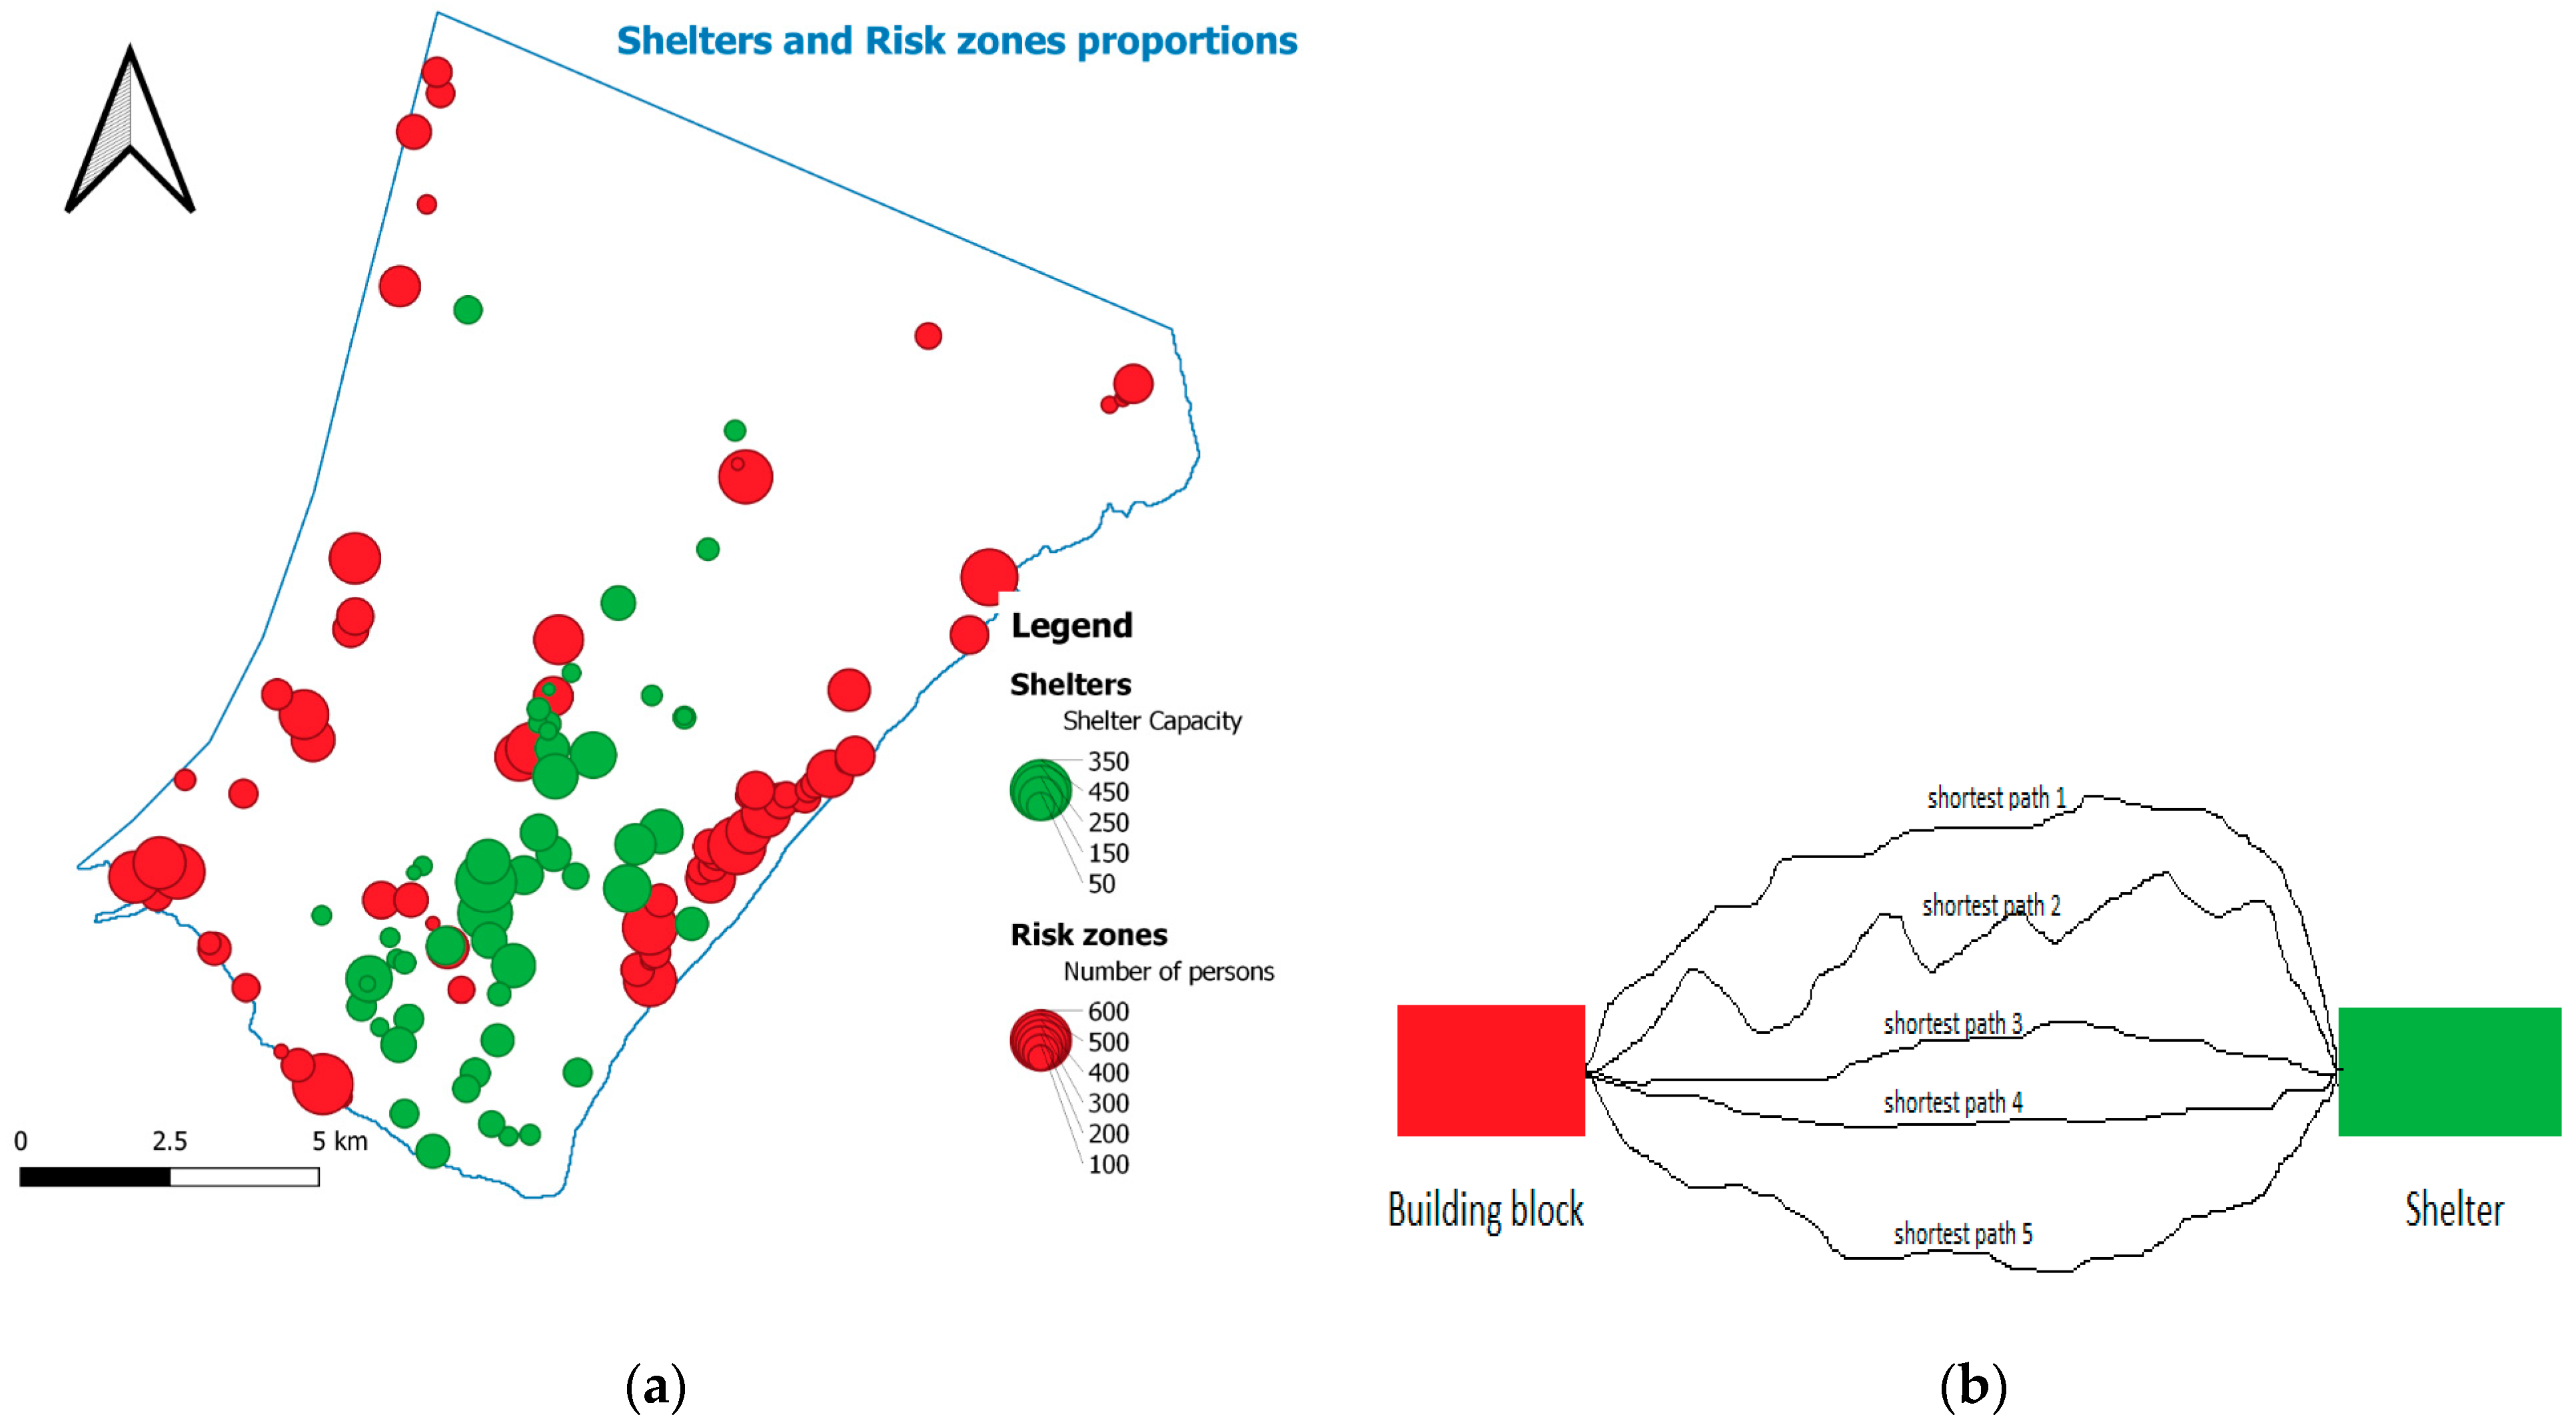
In this study, the distance matrix was computed using Dijkstra’s algorithm, each column represents a shelter and each row depicts a risk zone. Each entry of the distance matrix consists of five elements and each element expresses the distance between a risk zone and a safe area. The GIS analysis tool was used to determine the five shortest paths from each building block to each shelter (see
Figure 2b). The shortest paths in each entry of the distance matrix are mapped from one to five. For each path between the shelters and disasters prone areas, we computed the risk of the road by assessing the status of bridges. In this research, we assume that a road is risk-free if it does not have a bridge. In addition, for each shelter we determined the 5 shortest paths to each risk zone, using the ArcGIS Network Analyst extension, which uses the enhanced barrier features. Furthermore, the line barriers are covered by their geometry, scales the costs of the parts of the network covered by the geometry. Therefore, the procedure that calculates the 5 shortest paths in the Network Analyst extension, consists in solving the route from the route solution, gets the best path, this current best path is loaded as a polyline barrier with a given scale factor. We, also, defined and described the objective functions, depicted the data preparation, described the proposed algorithm (DMOCS), and we analyzed the results using some metrics such as Hypervolume indicator, convergence evaluation, parameters tuning.
Figure 2a shows the map of shelters and risk zones it also presents the shelter capacity and the number of individuals in each risk zone. The shelters are in the proportion of their capacity as well as risk zones are in the proportion of the number of persons at risk. In this research, we found 53 shelters and 73 risk zones.
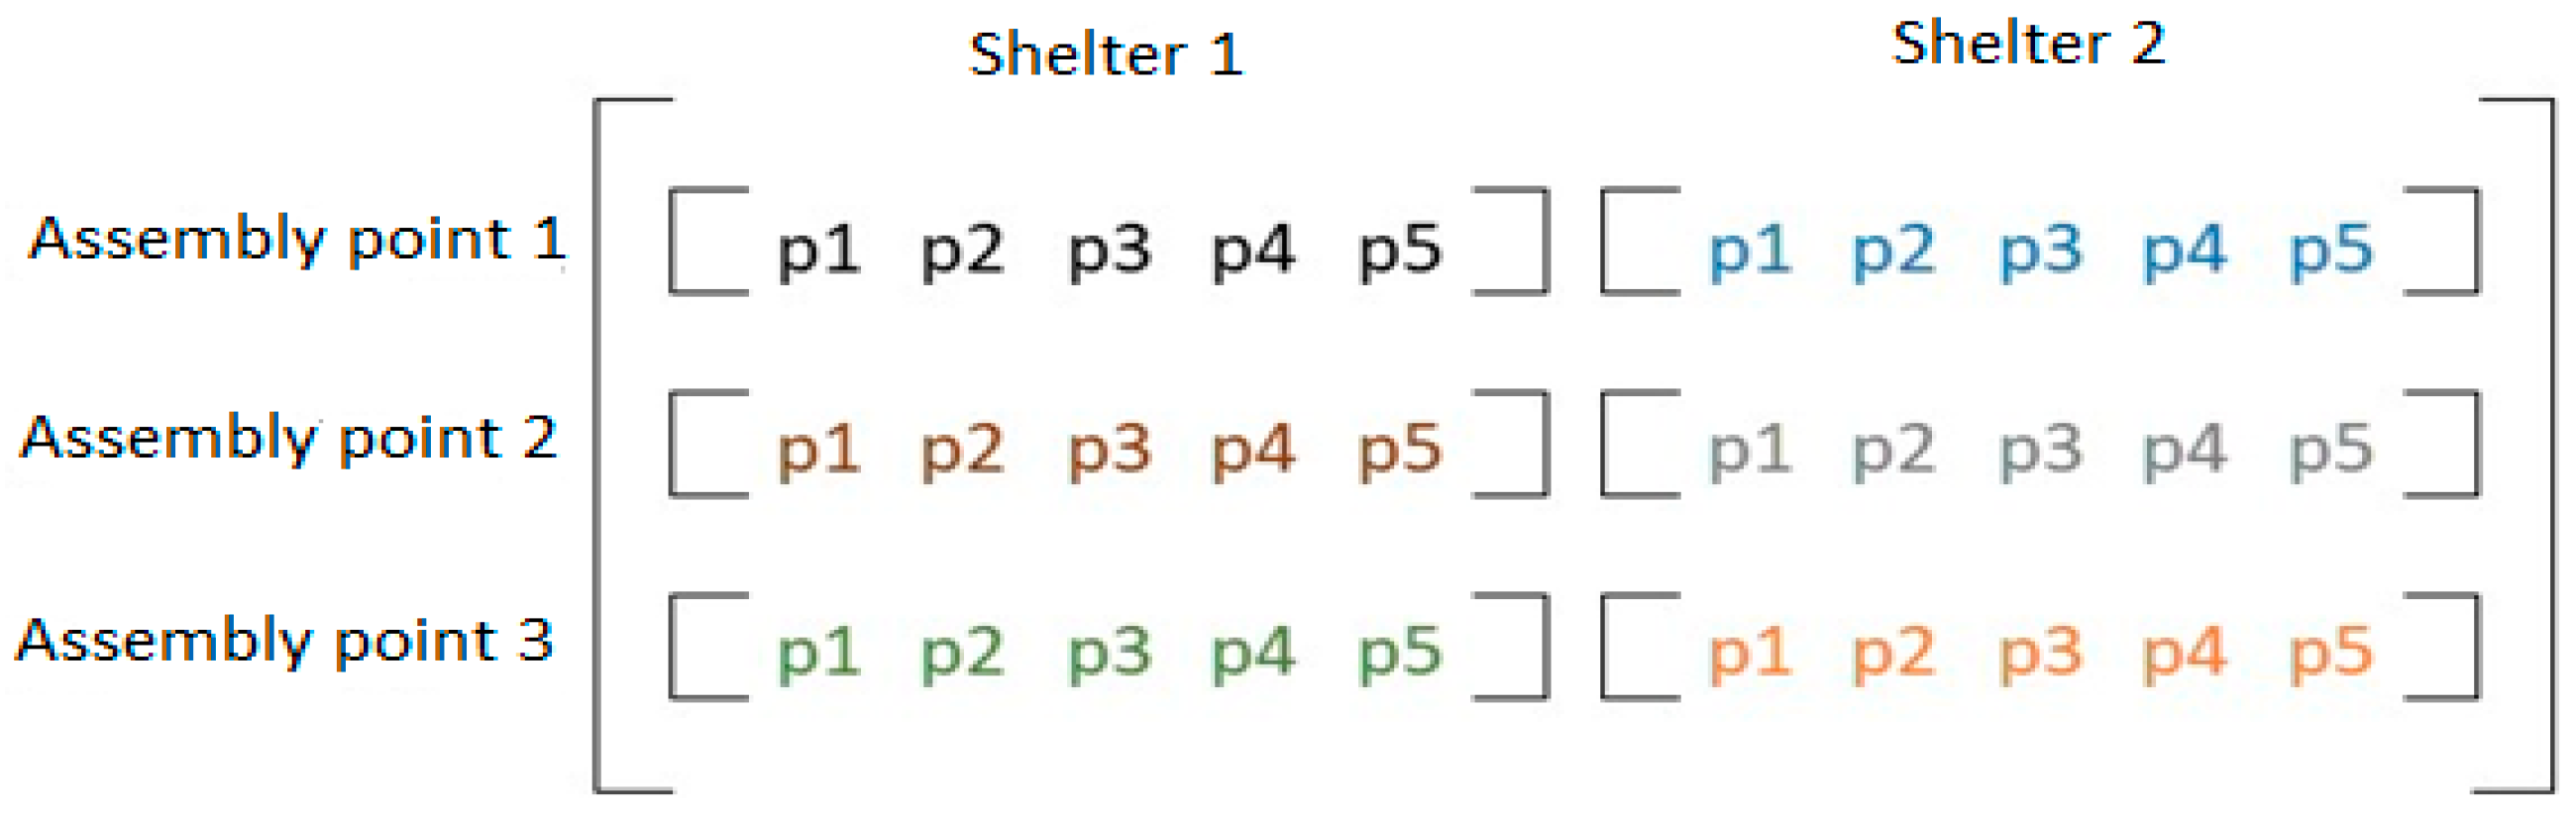
For example, considering a scenario of three building blocks and two shelters as shown in
Figure 3, a nest will have a vector format with six elements (see
Figure 4). The colors of the vector represent building blocks (risky zones). Therefore, yellow is building block one, light green is building block two and the dark green represents building block three. In each color, each position represents shelter and the entry, the number of the path used to evacuee people, for example, from the first inundated zone to the second shelter using the third path. This vector format tells us that people from the first building block are evacuated to the second shelter using the third path; people from the second building block go to the first shelter using the first path, and people from the third building block are evacuated to the second shelter using the second path. The zeros in the vector format mean that no evacuees are going from a given building block to a given shelter.
In our model, we assume that people from a given building block can only be evacuated to the same shelter to avoid the separation of individuals from the same family.
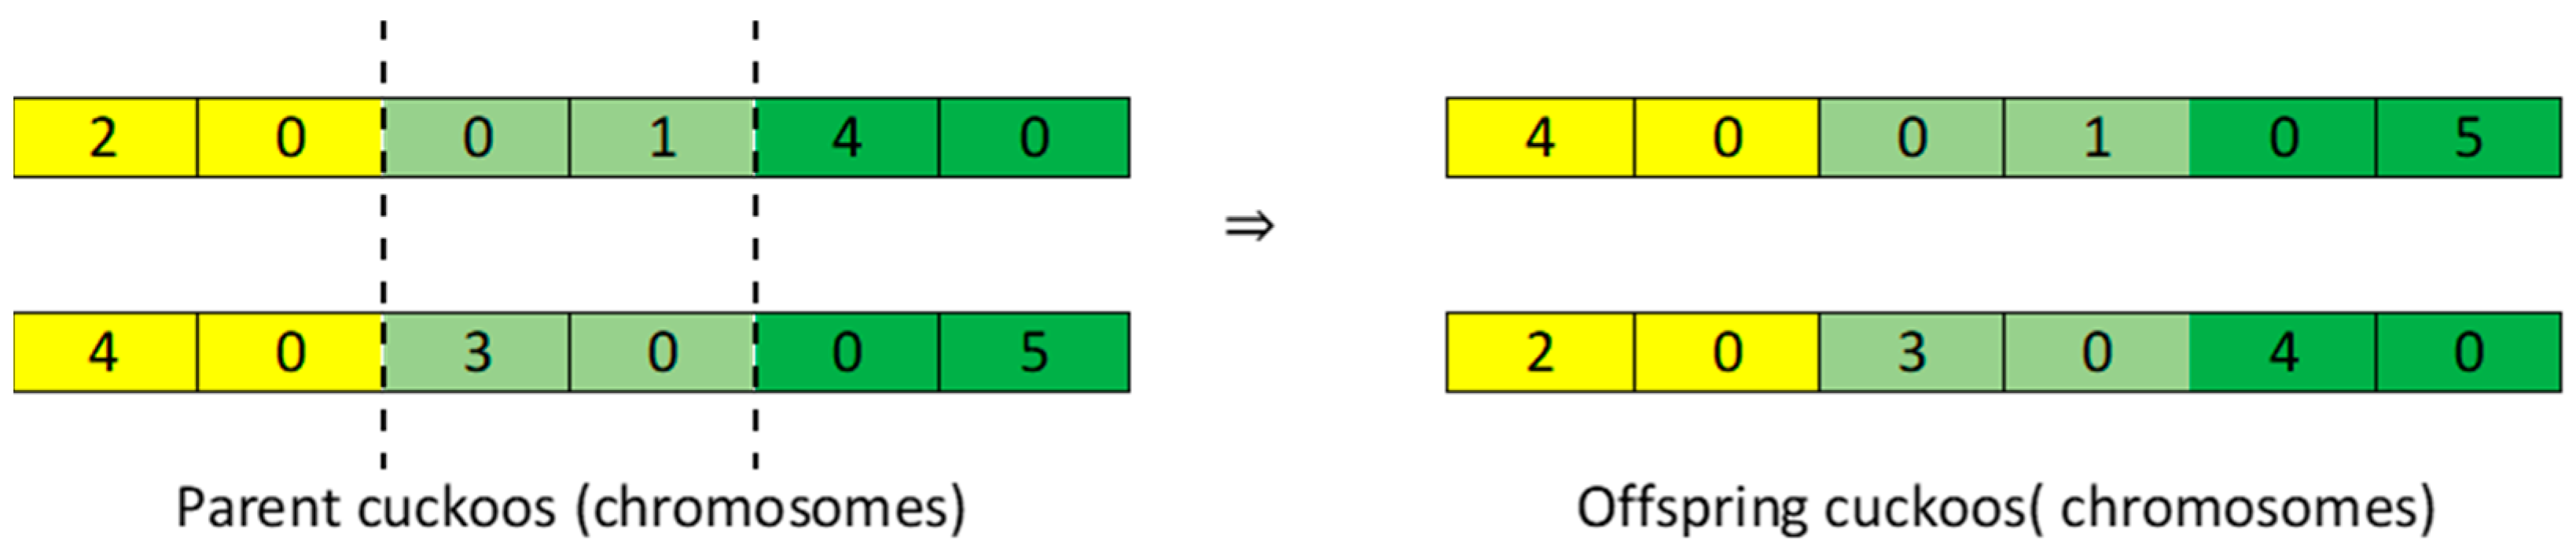
The crossover operator adopted from genetic algorithms was employed in our study for solutions modifications. As shown in
Figure 5, the crossover operator is used to exchange information between two parents to generate new offspring. It is one way to randomly or stochastically generate new solutions from an existing population and is analogous to the crossover that happens during reproduction in biology. Solutions can also be generated by cloning an existing solution, which is analogous to a reproduction. Newly generated solutions are typically before being added to the population.
3.3. Mathematical Model Development for Evacuation Planning
The multi-objective optimization for the evacuation planning problem considered in this research was formulated as a discrete mathematical model. The proposed mathematical model is as follows:
where
where
is the number of building blocks that should be evacuated to the safe area.
is the number of shelters to accommodate the evacuees.
is the total population assigned to each safe area and should be equal or less than its capacity. The absolute sign for indicates whether the total population of evacuees is more than the total capacity of the safe areas; the overload should be divided among the safe areas while trying to minimize the overload capacity for each safe area. The is the population of the ith building block that should be evacuated to the jth safe area. The represents the capacity of the jth safe area.
means that building blocks with a greater population have the priority to be assigned to the nearest safe area. Thus, more people can reach a safe area in the shortest possible time. is the distance between the ith building block and the jth safe area (along the optimum path).
denotes the total risk in the evacuation process. The
is the crashing probability of bridge
(or the damaging probability of the flooded section
) between the
ith building block to the
jth shelter. An evacuation path may contain none or many bridges or flooded lines. The bridges are assigned the risky of crossing without crushing and the flooded sections are given the risky of crossing without damaging the means of evacuation transport.
Figure 6 illustrates an evacuation path. This evacuation path may contain several bridges or risk sections. Therefore, the cumulative risky of an evacuation path, between the
ith building block to the
jth shelter is
.
The three objective functions (, , and ) have information that can be related to a location on earth (roads, bridges, shelters, and building blocks) and should be satisfied simultaneously thus the optimization problem to be addressed is spatial multi-objective optimization and is suitable to be solved using MOCS along with GIS tools.
We present another function that can model the risky in evacuation planning. Furthermore, we select the risky function that will best fit our problem. As in this study we consider an evacuation path, which may contain no one or many bridges or flooded lines. The bridges are assigned the risky of crossing without crushing and the flooded lines are given the risky of crossing without damaging the means of evacuation transport.
Figure 6 illustrates an evacuation path that presents several bridges. Let
be the crashing probability of bridge,
, or the damaging probability of the flooded line
. According to the general inclusion–exclusion formula [
33], the cumulative risky of an evacuation path,
, is
On the other hand, the probability to pass a bridge is
, if
is the crashing probability of the bridge
. Therefore, the probability to pass all the bridges is
, and the probability of not being able to pass the way through (the cumulative risky of an evacuation path,
) is
Supposing that in the evacuation process, there are many evacuation paths utilized to evacuee people from building blocks to shelters. The cumulative risky of the roads involving the whole evacuation process is
The correlation between the two risky functions is about 0.99509, which tells that both functions are strongly correlated.
Table 1 provides some data regarding the bridges crash probability as well as risk functions values computed using both functions. It shows that both functions are close.
Figure 7 provides a visual comparison of the risky functions and the conclusion is the same that both risky functions have the same behavior.
Let
an evacuation route with
bridges or flooded lines. Then, the number of operations needed to compute the risk,
, of the path using the function (3) is given by the expression
and is asymptotically equivalent to
On the other hand, the number of operations needed to compute the risk of the path, using the function (4), is given by the following expression:
where
. The expression (4) is equivalent to
.
Using the function (5), its computation time is given by , this is asymptotically equivalent to . According to the analyses of the risk functions (3) and (4), both functions are strongly correlated and the computation time of the function (1) is linear while the computation time of the function (4) is more than an exponential, . Considering the computation time, we choose to work with the risk function (3). However, the best risk function with linear computation time is the risk function (4). Therefore, we will use this function to evaluate the risk in our third objective function.
3.4. Discrete Multi-Objective Cuckoo Search to Solve the Evacuation Model
The original MOCS algorithm was designed to solve a continuous optimization problem with multi-objective functions [
8]. To solve a discrete multi-objective optimization problem, we performed some modifications on the original MOCS. Some of the studies have used MOCS with focus to find the optimal Pareto solutions [
7,
33,
34] and others used the hybridization with other optimization algorithms to reach a better performance of MOCS [
35,
36,
37].
The MOCS optimization algorithms use three parameters, (1) the probability to abandon the worst nest,
, (2) a non-negative step size,
, that should be associated with the scale of the problem, in most cases is greater than one, for evacuation planning problem the step size will be to the current solution
, and (3) the random step length,
[
38]. When generating new solutions
for, say cuckoo
, a Lévy flight which is a random walk in which the steps are defined in terms of step length, which are distributed according to a heavy probability distribution with the direction of steps being isotropic and random, and is performed as follows:
where ⊕ means entry wise multiplication, and
is the modulus arithmetic operator, and this returns the remainder of the division of each vector component by (1 + 5) to guarantee that every entry wise is between zero and five. Besides, a probability
of the worst nests can be abandoned so that new nests can be built at a new location by random walks process and mixing, which can be performed by random permutation of the solutions according to the similarity/difference to the host egg.
Each nest(or individual)
, on
Box 1, is a matrix of 73 rows corresponding to the number of building blocks and 53 columns corresponding to the number of shelters. In each row, we have one entry whose value is between 1 and 5 end points included, corresponding to one of the path used to evacuee people from a given risk zone to a given shelter, and another entries of the rows are set to zero. The nests can also be written in the row or list form.
Box 1. Step 1 MOCS initialization and parameters setting for discrete problem.
Set up the parameter values: the population size, the maximum number of generations, number of shelters and the capacity of each shelter, number of building blocks and the number of evacuees for each building blocks, five layers of the shortest distance matrix between building blocks and shelters
Randomly generate an initial population of nests xi using the random insertion method, and evaluate the fitness of objective functions f1 (x), f2 (x), f3 (x)
According to Yang (2010), the Lévy distribution can be defined as follow:
This distribution, on
Box 2, is more efficient than Brownian random walks in exploring the unknown when it comes to the large-scale search space. There are many reasons to explain this efficiency in multi-objective evacuation planning problems, and one of them is that the variance of Lévy flights increases much faster than the linear relationship of Brownian random walks. This fact of efficiency of Lévy flights, remains valid even in discrete problems.
Box 2. Step 2 Preliminaries in the main iteration.
Generate integers i and j randomly using the Lévis flights distribution in the interval [0, N], where N is the population size.
Select the ith cucko from de population we evaluate and check if it is a Pareto optimal
Select the jth nest from the population and evaluate the three objective functions
The unique feature on
Box 3 of the MOCS algorithm is an exploration by Lévy flight, mutation by a combination of Lévy flights and vectorized solution difference, crossover by selective random permutation. Therefore, cuckoo search uses a good combination of all these basic components, thus it is more powerful than algorithms using one or some of these components.
Box 3. Step 3 Check the dominance between two solutions.
Once nests are 73 × 53 matrixes, on
Box 4, the crossover operator was implemented in this way: considering two-parent nests, we swap the seconds’ rows, the fourths rows, and the sixths rows, and so on. However, in this way, we will get two new offspring nests. In the mutation operator considering a given nest, some rows are exchanged using the random insertion procedure according to a defined proportion. The analysis indicates that the best portion is 50% for multi-objective evacuation planning problems.
Box 4. Step 4 Crossover and mutation operators.
Abandon a fraction pa of worst nests and build new ones at a new locations via Lévy flights
To the abandoned worst nests we apply the crossover and mutation operators
Store the best solutions in the archive and replace the dominated nests set by new ones via Lévis flights
This research hybridizes the MOCS algorithm with the Pareto Archived Evolution Strategy (PAES), which generates diverse solutions in the Pareto optimal set [
39].
In PAES one parent nest generates by mutation, using Lévy flights, one offspring nest, on
Box 5. The offspring nest is compared with the parent nest. If the offspring nest dominates the parent nest, the offspring nest is accepted as the next parent nest and the iteration continues. If the parent nest dominates the offspring nest, the offspring nest is discarded and the new mutated solution (a new offspring nest) is generated. If the offspring nest and the parent nest do not dominate each other, a comparison set of previously non-dominated individuals is used. This strategy of PAES helped to reach a good efficiency of the Improved MOCS algorithm for evacuation planning problems. All the steps regarding the improved MOCS can be summarized in the flowchart of
Figure 8, which provides the execution order of the DMOCS.
Box 5. Step 5 Non-dominated sorting.
Apply the crossover and mutation operator to the best solutions
Apply non-dominated sorting method to the population and find the current Pareto optimal solution
Update the archive with the current Pareto optimal solution if they dominates the existing solutions, otherwise keep the old solution
4. Results and Analysis
In this study, the Distributed Evolutionary Algorithm in Python (DEAP) framework was used for MOCS implementation. The output for analysis was the determination of the number of shelters to be established. In fact, the minimization of that number is an objective of the underlying mathematical model used in this approach. The other objectives are related to path lengths, and risks associated with paths and shelter locations. In a multi-objective problem there is no best solution but an optimal solution, and, as mentioned before, the concept of an optimal solution is replaced with that of a non-dominated (efficient, or Pareto-optimal) solution.
4.1. Performance Tracking of Improved MOCS Algorithm
Figure 9 presents the comparison of the standard MOCS (dark red) and the improved MOCS (steel blue). Both algorithms were run over 500 generations and the results show that the computation time (in minutes) of the improved MOCS is below the computation time of the standard MOCS. This gain in the computation time is due to the fact that in the improved MOCS, after selecting the best solution, the crossover and mutation operators are applied to generate new individuals with better solutions to take place to in the next generation. The use of Levi’s flights to generate the individuals also improve the computation time.
We can see from this figure that the convergence of DMOCS is of a lower computation time than the standard MOCS. This again suggests that DMOCS provides better solutions in a more efficient way.
4.2. Convergence of the Improved MOCS Algorithm
To examine the convergence of the improved MOCS we have analyzed the convergence of each objective individually using the geometry smooth object that aids the eye in seeing patterns in the presence of over plotting. Using the geometry smooth object displays a surface that shows the graph of a target’s fitness score against iteration progress. This shows how DMOCs converge over time (see
Figure 10).
The convergence is the degree or point at which lines or objects converge. The deviation is the amount by which a single measurement differs from a fixed value such as the mean or the convergence object. In this convergence analysis, we collected the minimum of fitness values in each generation and found that the difference is minimal. This means that in decision-making, one can sacrifice the overload of shelters or distances, and minimize the risk. As well, risk and distance can be sacrificed, minimizing the overload of shelters. On the other hand, one can sacrifice the overload of shelters and risk, minimizing distances. According to
Figure 10, for very large intervals between generations, there is an increasing trend of deviation. On the other hand, the deviation is not homogeneous for generations with close-range values.
4.3. Parameters Setting Analysis of the Improved MOCS
In order to lead the numerical analysis, a set of input parameters is required for the improved MOCS mathematical model and the solution algorithms. This study primarily relied on the data available through public databases. This section provides detailed information regarding the following aspects: (1) vulnerable population to flood, (2) number of generations, (3) crossover probability, (4) number of shelters, (5) capacity of each shelter, and (6) the fraction to abandon the worse nest.
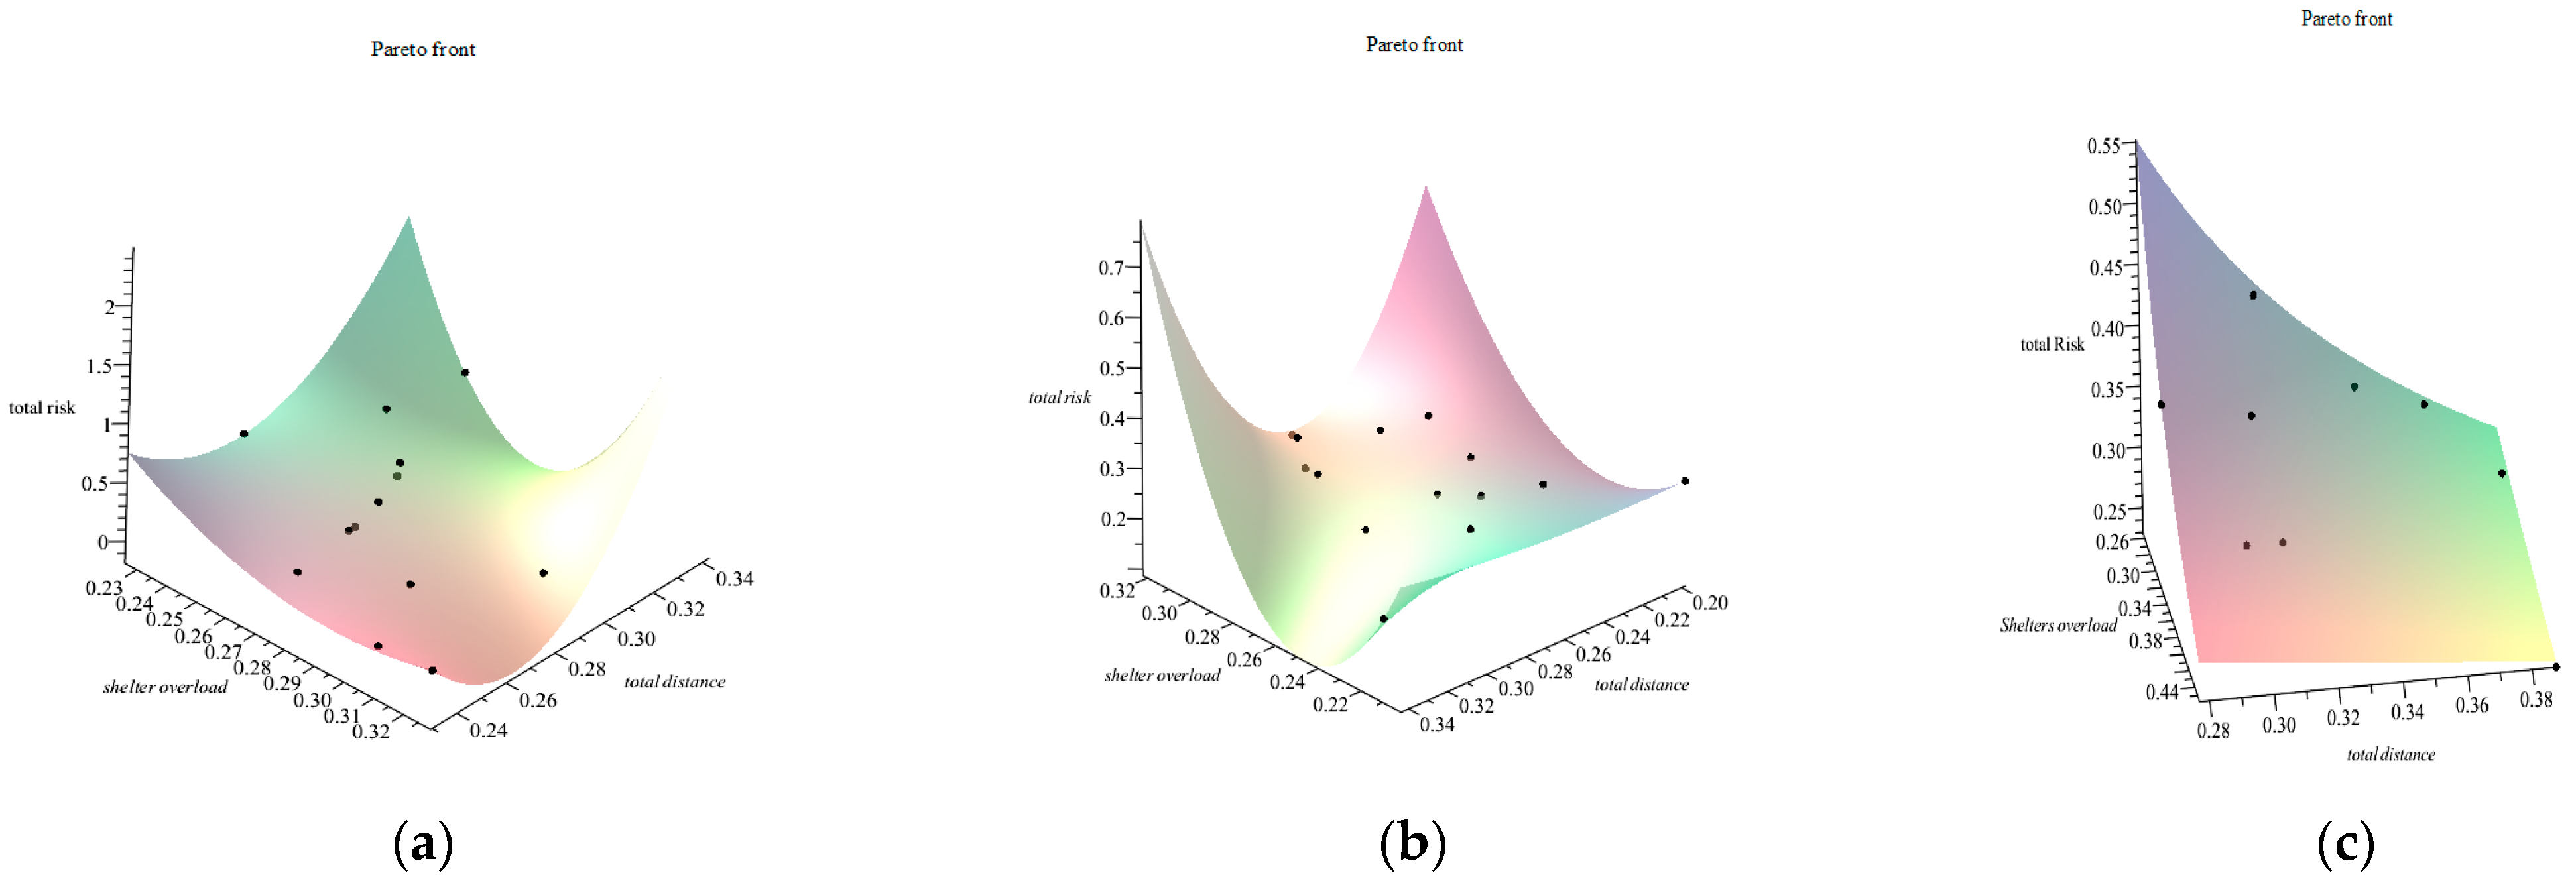
In
Figure 11, the three Pareto fronts are presented in three dimensions. To obtain these results it was fixed the population size and varied the number of generations. The population size was set to 200, the crossover probability to 1, the fraction to abandon the worse nest to 0.25, and the mutation probability was set to 0.10.
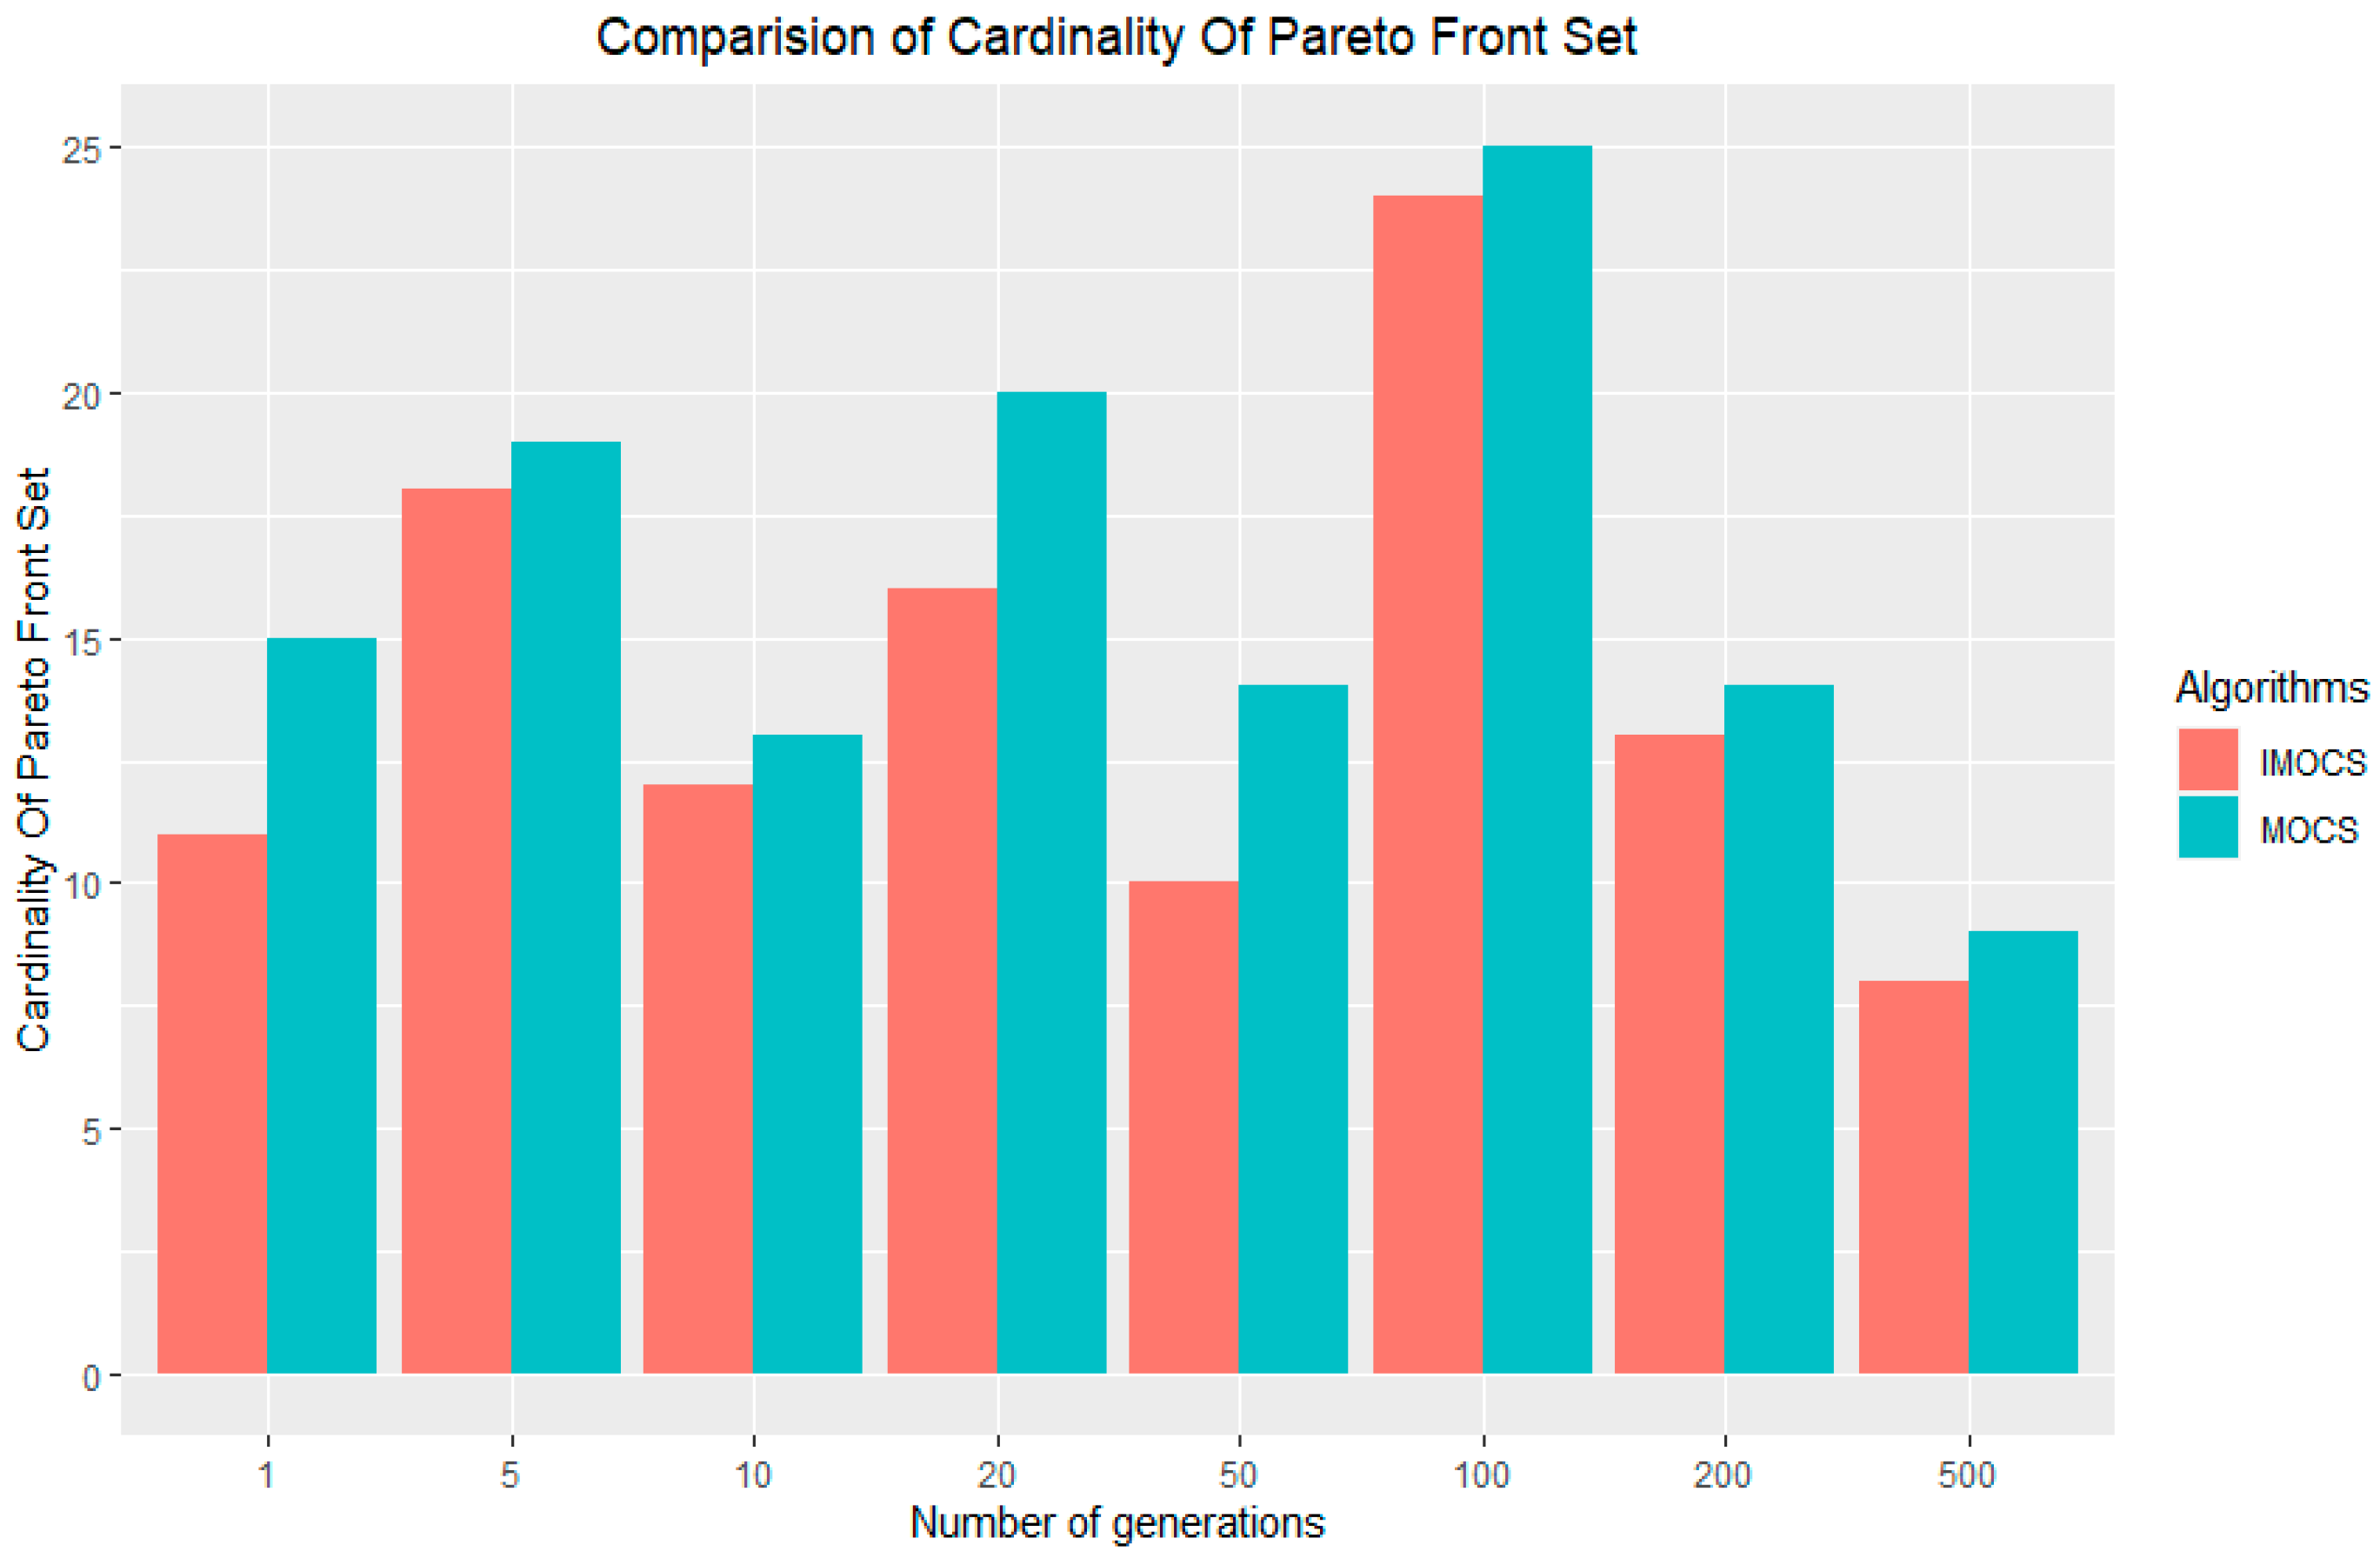
When analyzing the evolution of the quality of the Pareto front of the DMOCS algorithm as a function of the number of generations, it appears that there is a trend towards an improvement in the quality of the Pareto front solution, see
Figure 12.
Figure 12 shows the comparison of the cardinality of the Pareto front set and we can see that in any generation, the cardinality of the Pareto front set from an Discrete multi-objective cuckoo search algorithm is less than the cardinality of the standard Multi-objective Cuckoo Search Algorithm. However, this is not a significant difference as the Pareto front size could change based on different parameter settings and run time of an algorithm.
Table 2 compares the execution time of the DMOCS and standard MOCS algorithms. Note that the DMOCS runtime is better than the standard MOCS runtime. The difference between the objective functions is minimal. These results were obtained based on a population size of 200, considering 500 generations.
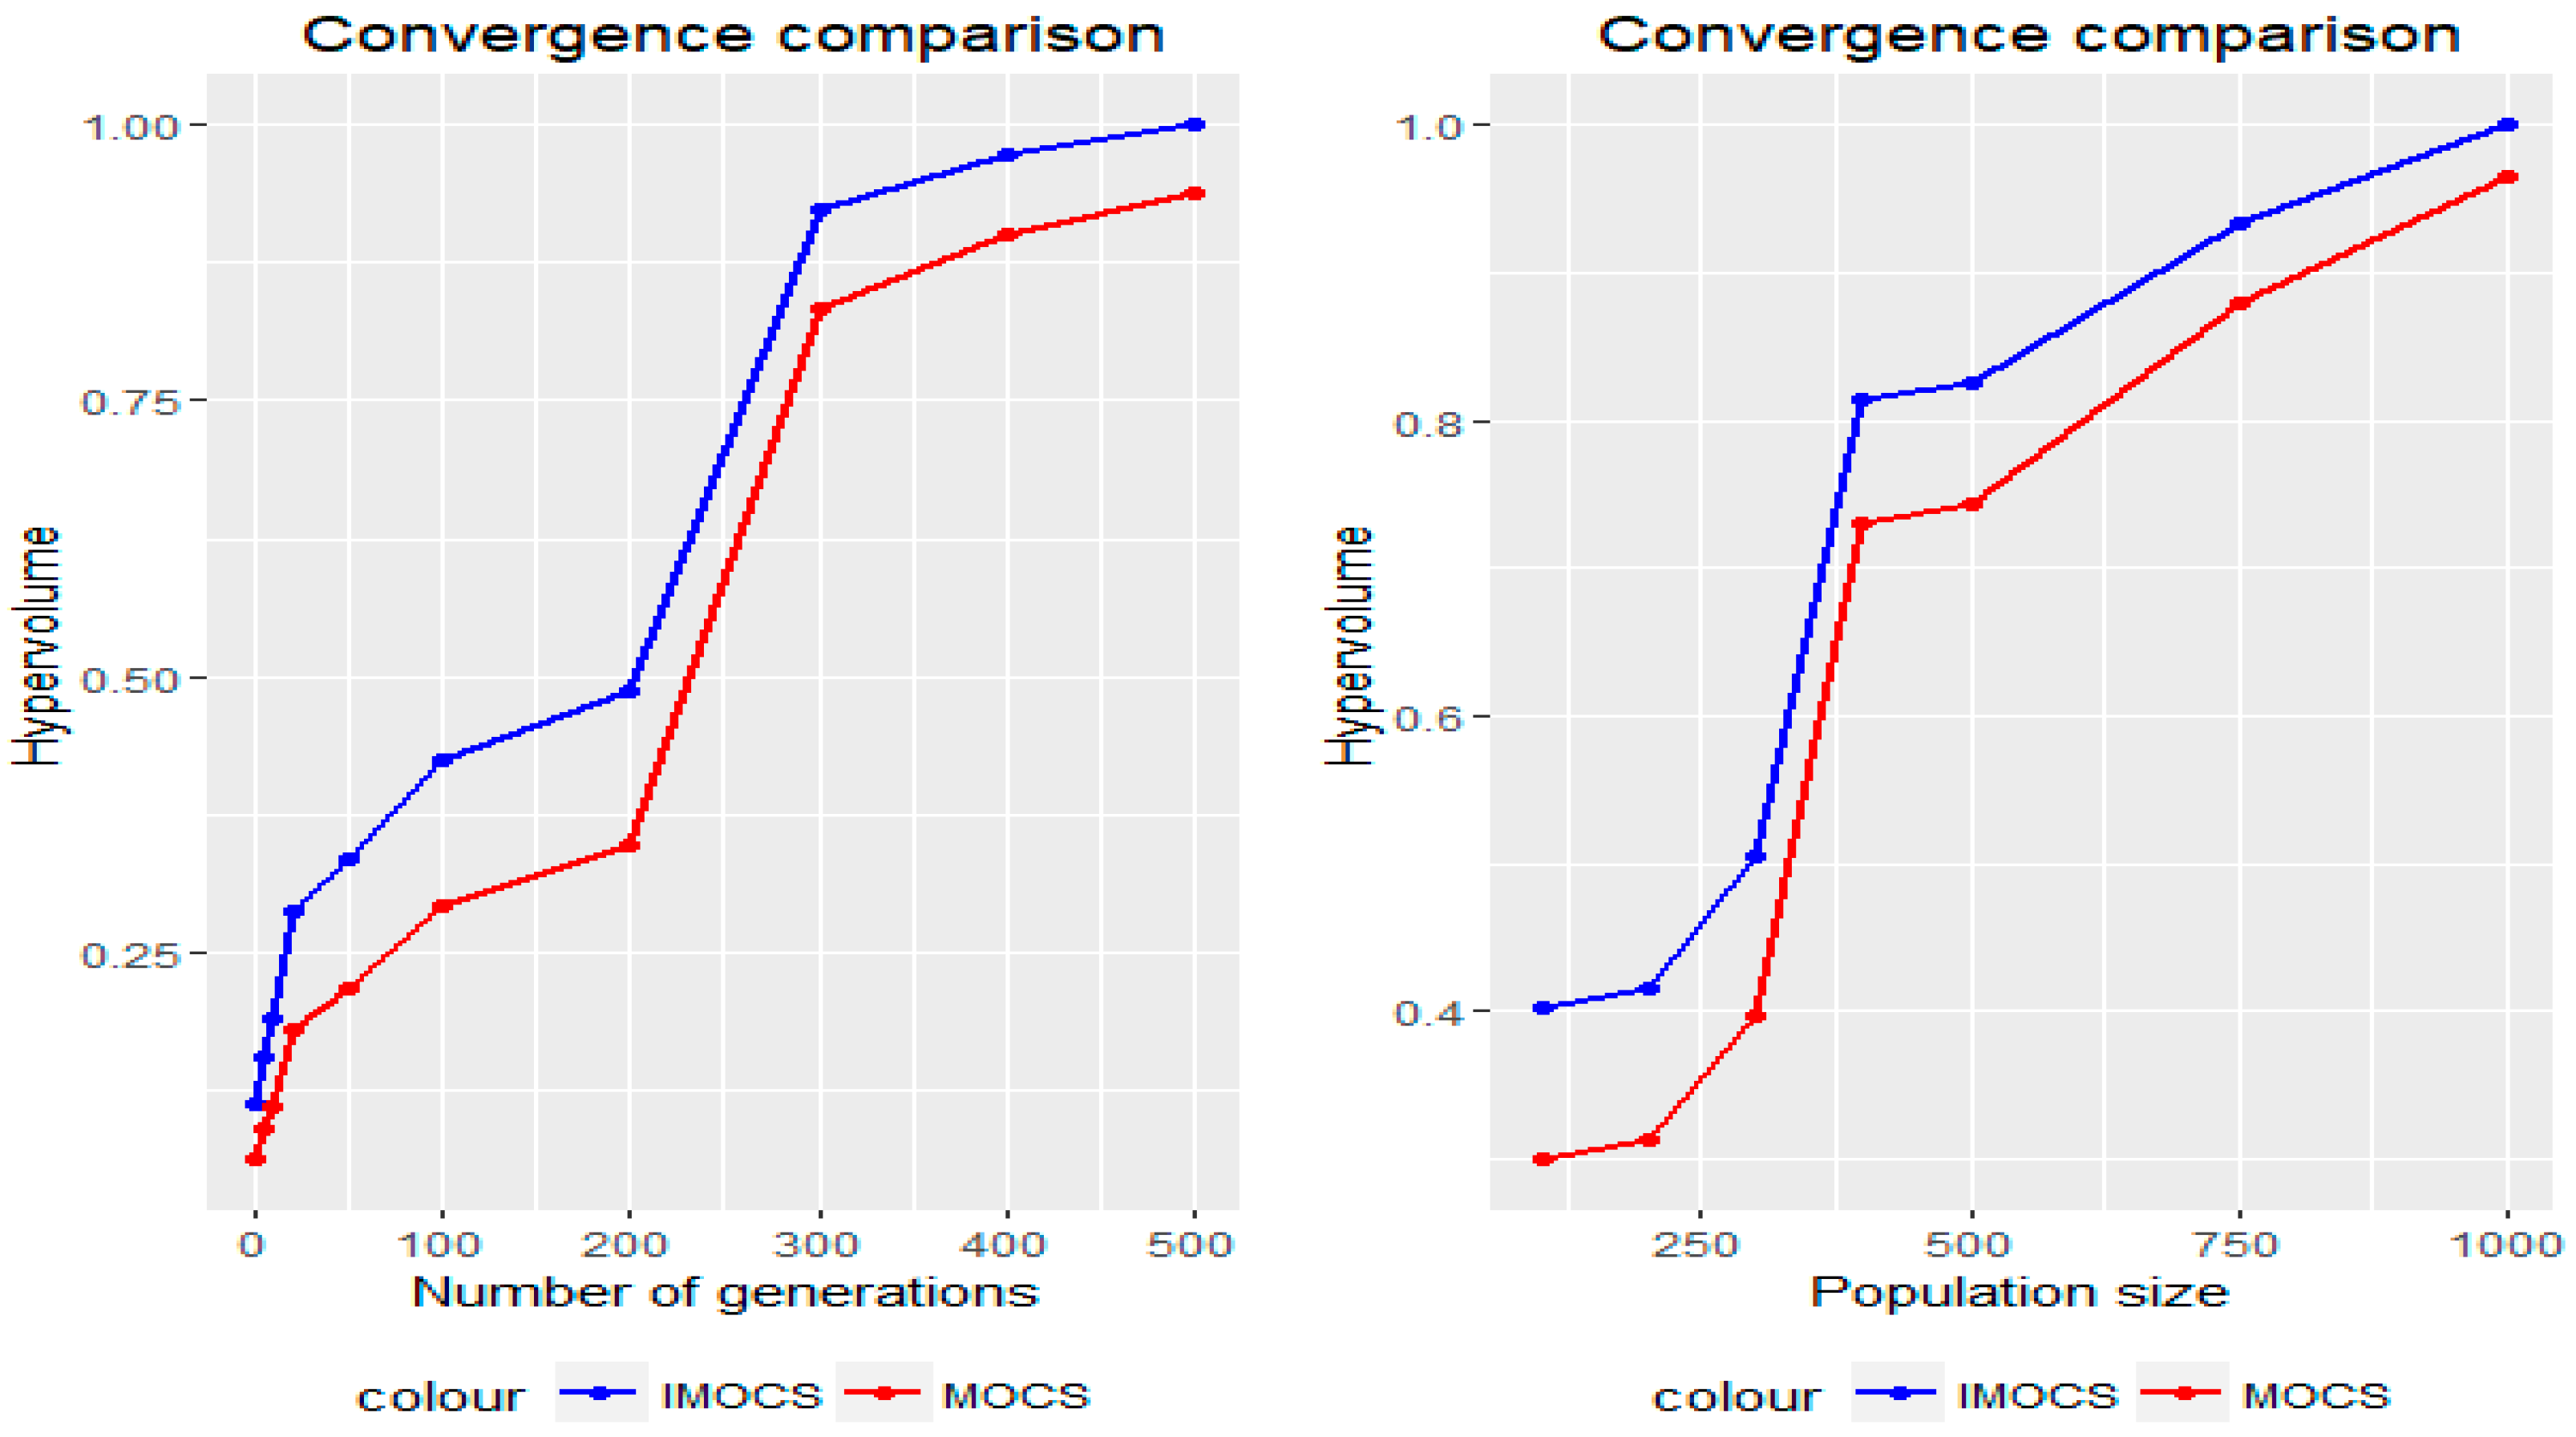
The hypervolume indicator was employed in this study in order to assess the performance of DMOCS against the standard MOCS in terms of Pareto front quality [
40]. The hypervolume indicator is a popular measure of the quality of an approximated Pareto front, it measures the size of the space enclosed by all solutions on the Pareto front and a user-defined reference point. For all performance indicators shown so far, a target set needs to be known. For hypervolume, only a reference point needs to be provided. The hypervolume, for three objective functions, calculates the volume, which is dominated by the provided set of solutions with respect to a reference point [
41].
Therefore, according to the comparison of the hypervolume presented in
Figure 13, the improved MOCS algorithm shows a high value of the hypervolume than that of the standard MOCS algorithm. This case concludes that the DMOCS has better performance than MOCS.
4.4. Sensitivity Analysis
Sensitivity Analysis (SA) is a method that measures how the impact of uncertainties of one or more input variables can lead to uncertainties on the output variables [
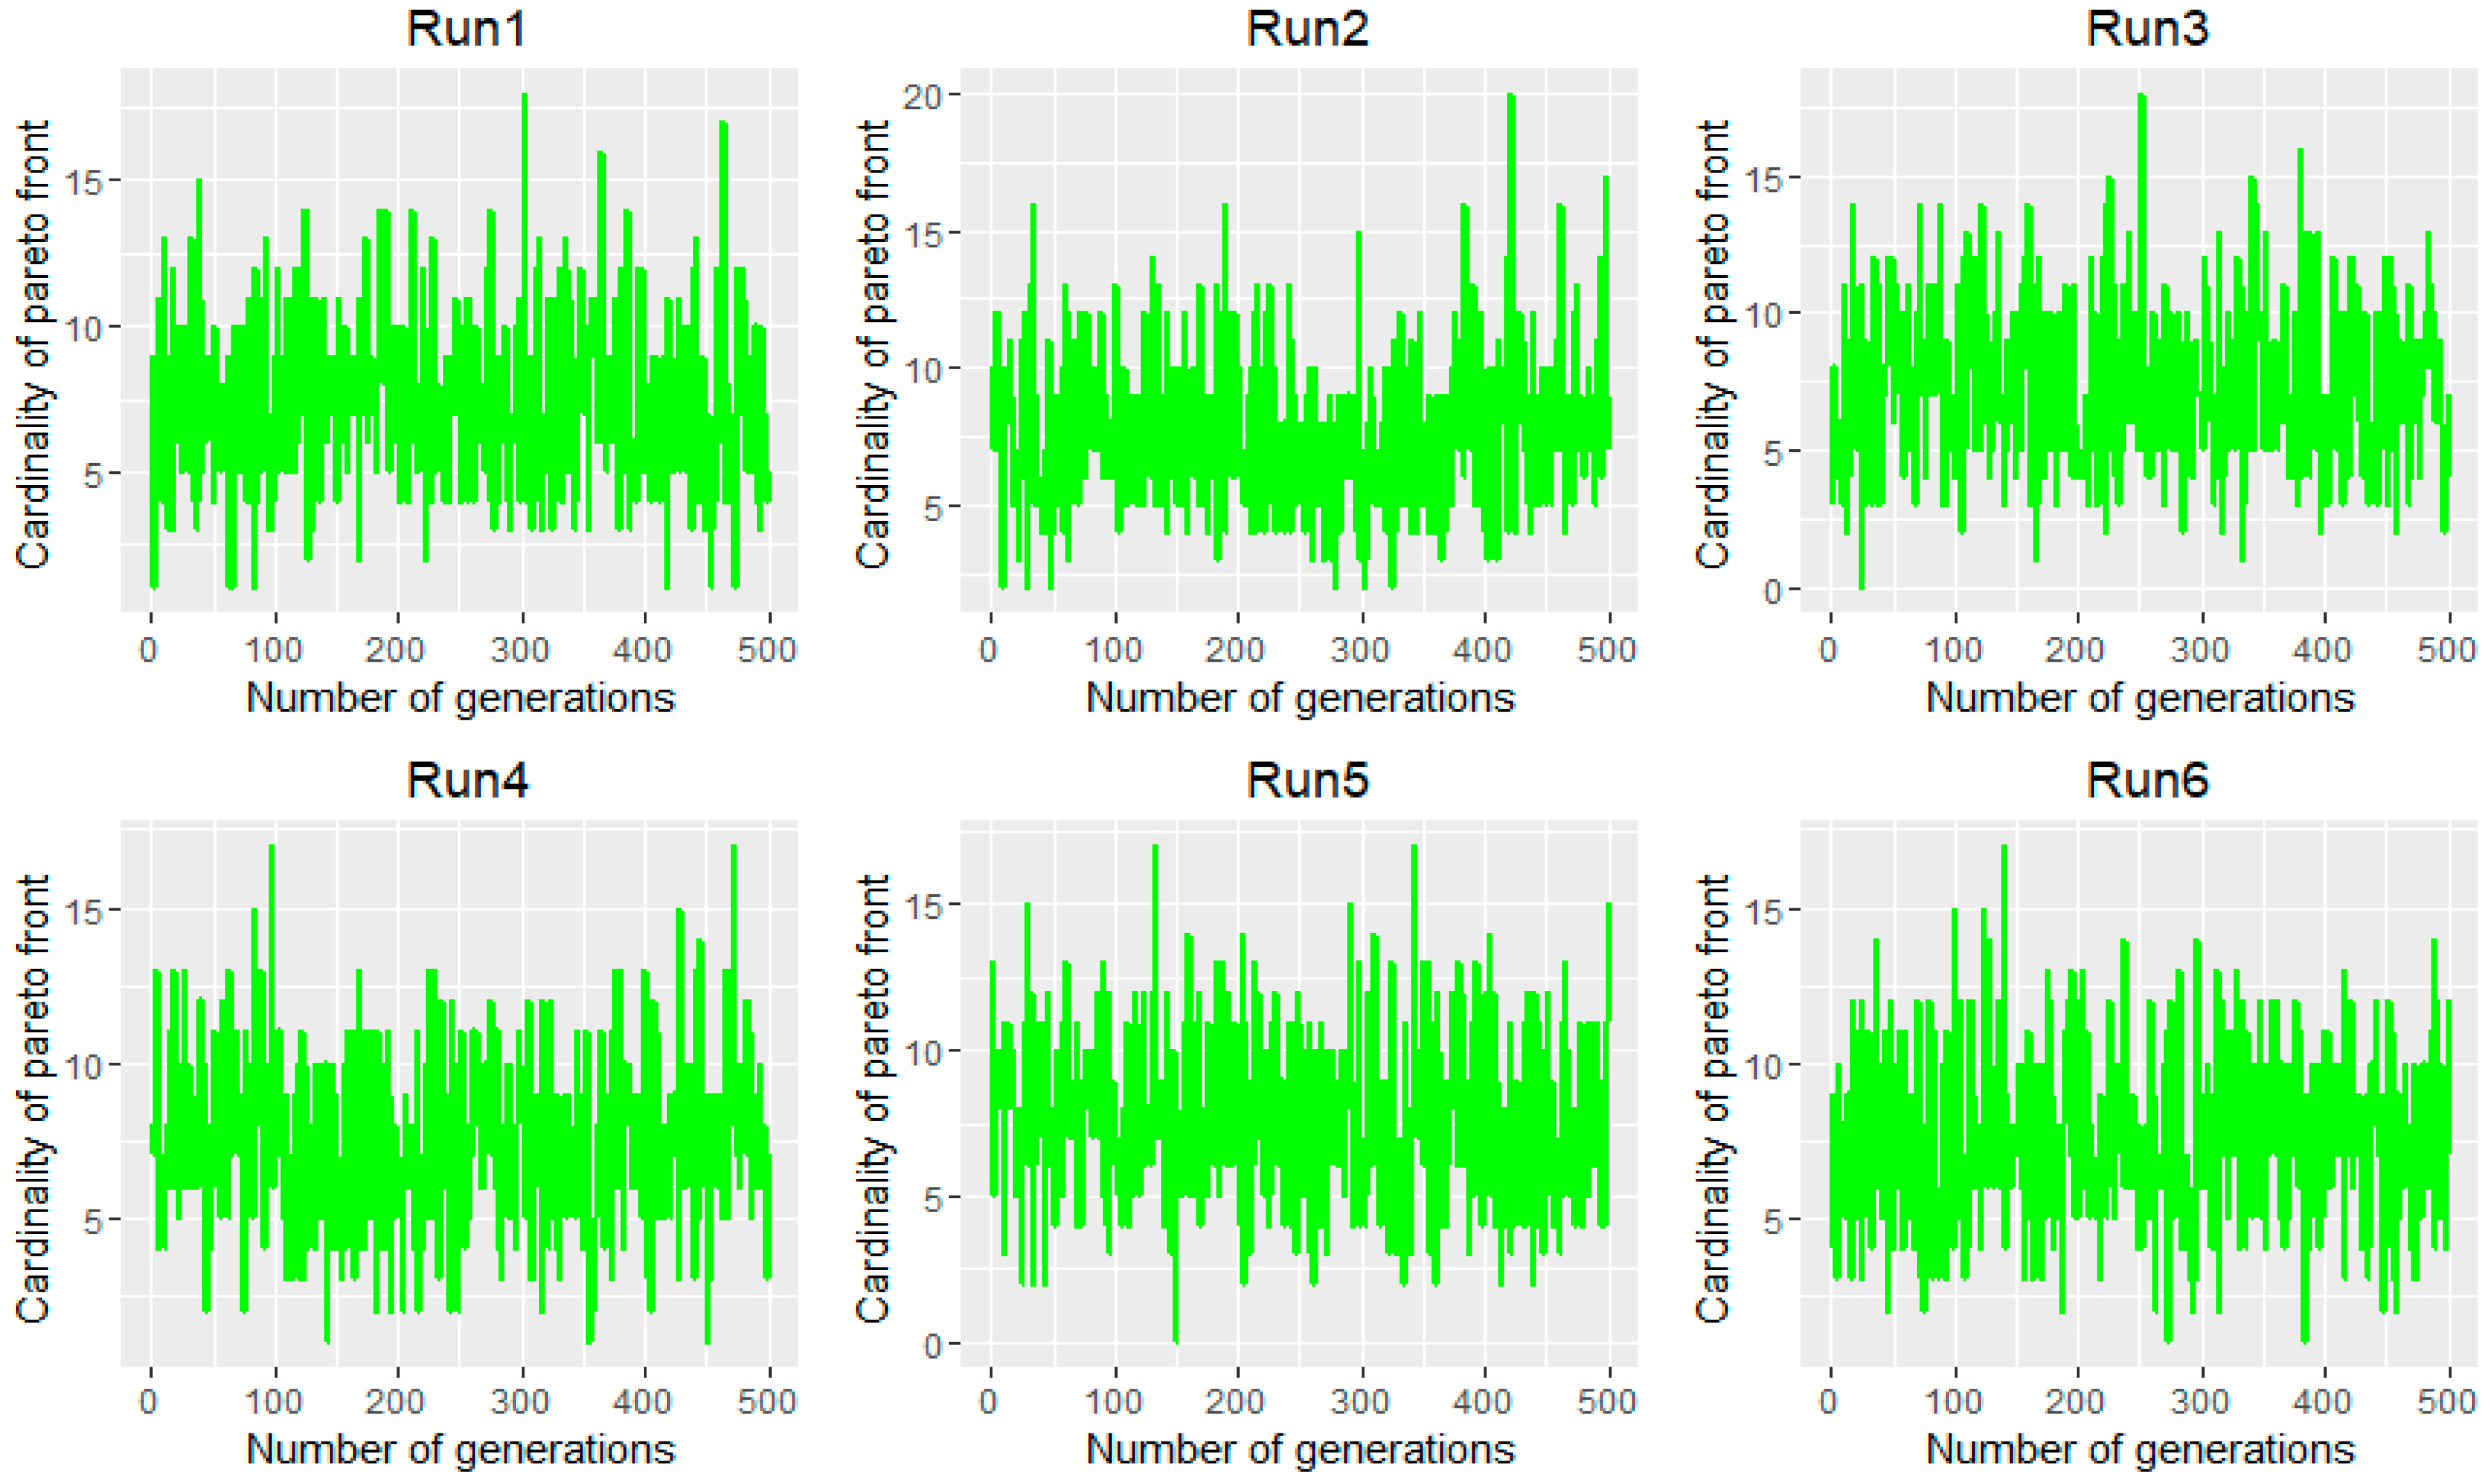
42]. In
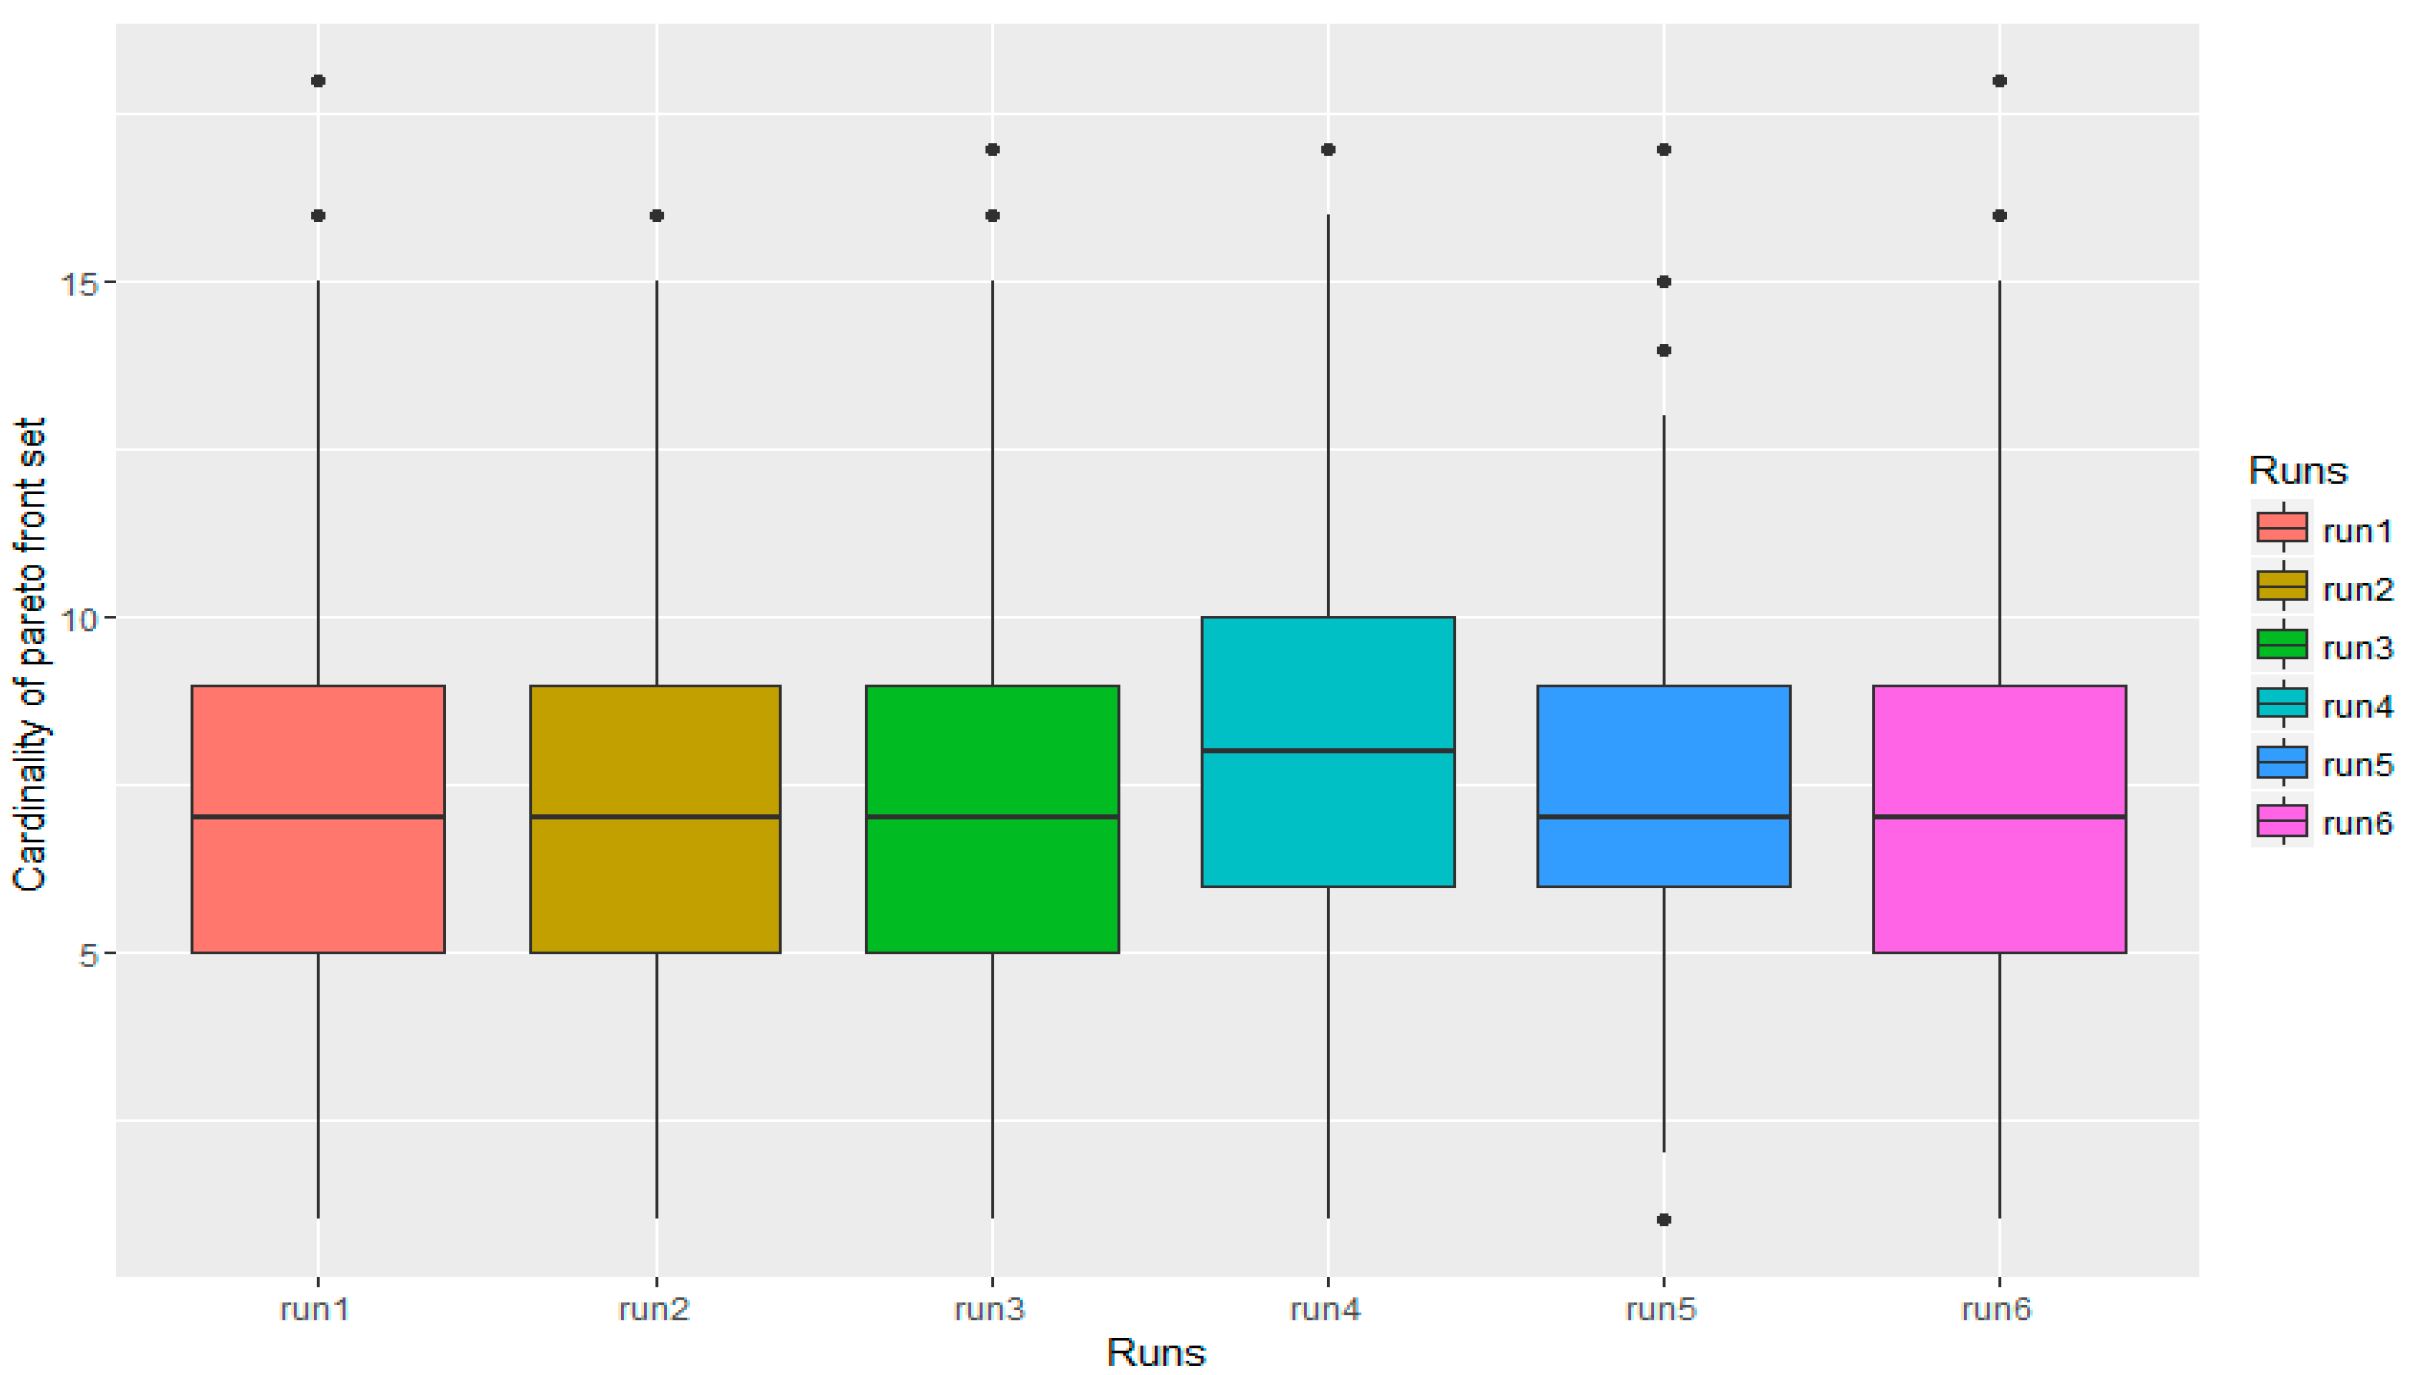
Figure 14, we measure the cardinality of the Pareto front set along with the generations. We could see that in any run of the DMOCS algorithm, the mean of the Pareto front set cardinality is almost equal in any run. This is due to the variance analysis, which gave us an F (Fisher–Snedecor distribution) value of 1.59 and a probability of 0.16, which allow us to accept the hypothesis that the means of Cardinality of the Pareto front Set are equal for different runs with a confidence level of 95%.
We also applied the Tukey multi comparison test [
43] to reinforce that the mean of the cardinality of the Pareto front sets is the same with 95% of confidence, this can also be seen in
Figure 15. This analysis shows that the cardinality of the Pareto front set does not depend on the number of generations.
In
Figure 16, we evaluate the repeatability of the three objective functions, shelter overload, total distance, and total risk according to the number of generations. From generation 50 up to 500, it can be seen that a small change in number of generations corresponds to small variations in the objective functions. In addition, the convergence of the objective functions is graphically clear. These results from the repeatability analysis lead us to conclude that the discrete multi-objective cuckoo search algorithm is stable. Clearly, we say that an algorithm is stable if changes in calibration of the algorithm, result in a slight change in the output. This kind of algorithm stability is particularly relevant when analyzing and visualizing time-varying data.
In addition, the repeatability analysis is useful because it improves the prediction of the model or reduces it by studying qualitatively and/or quantitatively the model response to change in input variables in general, and the number of generations in particular, or by understanding the phenomenon studied by the analysis of interactions between variables. However, the target of interest must not be the model output per se, but the question that the model has been called to answer [
44].
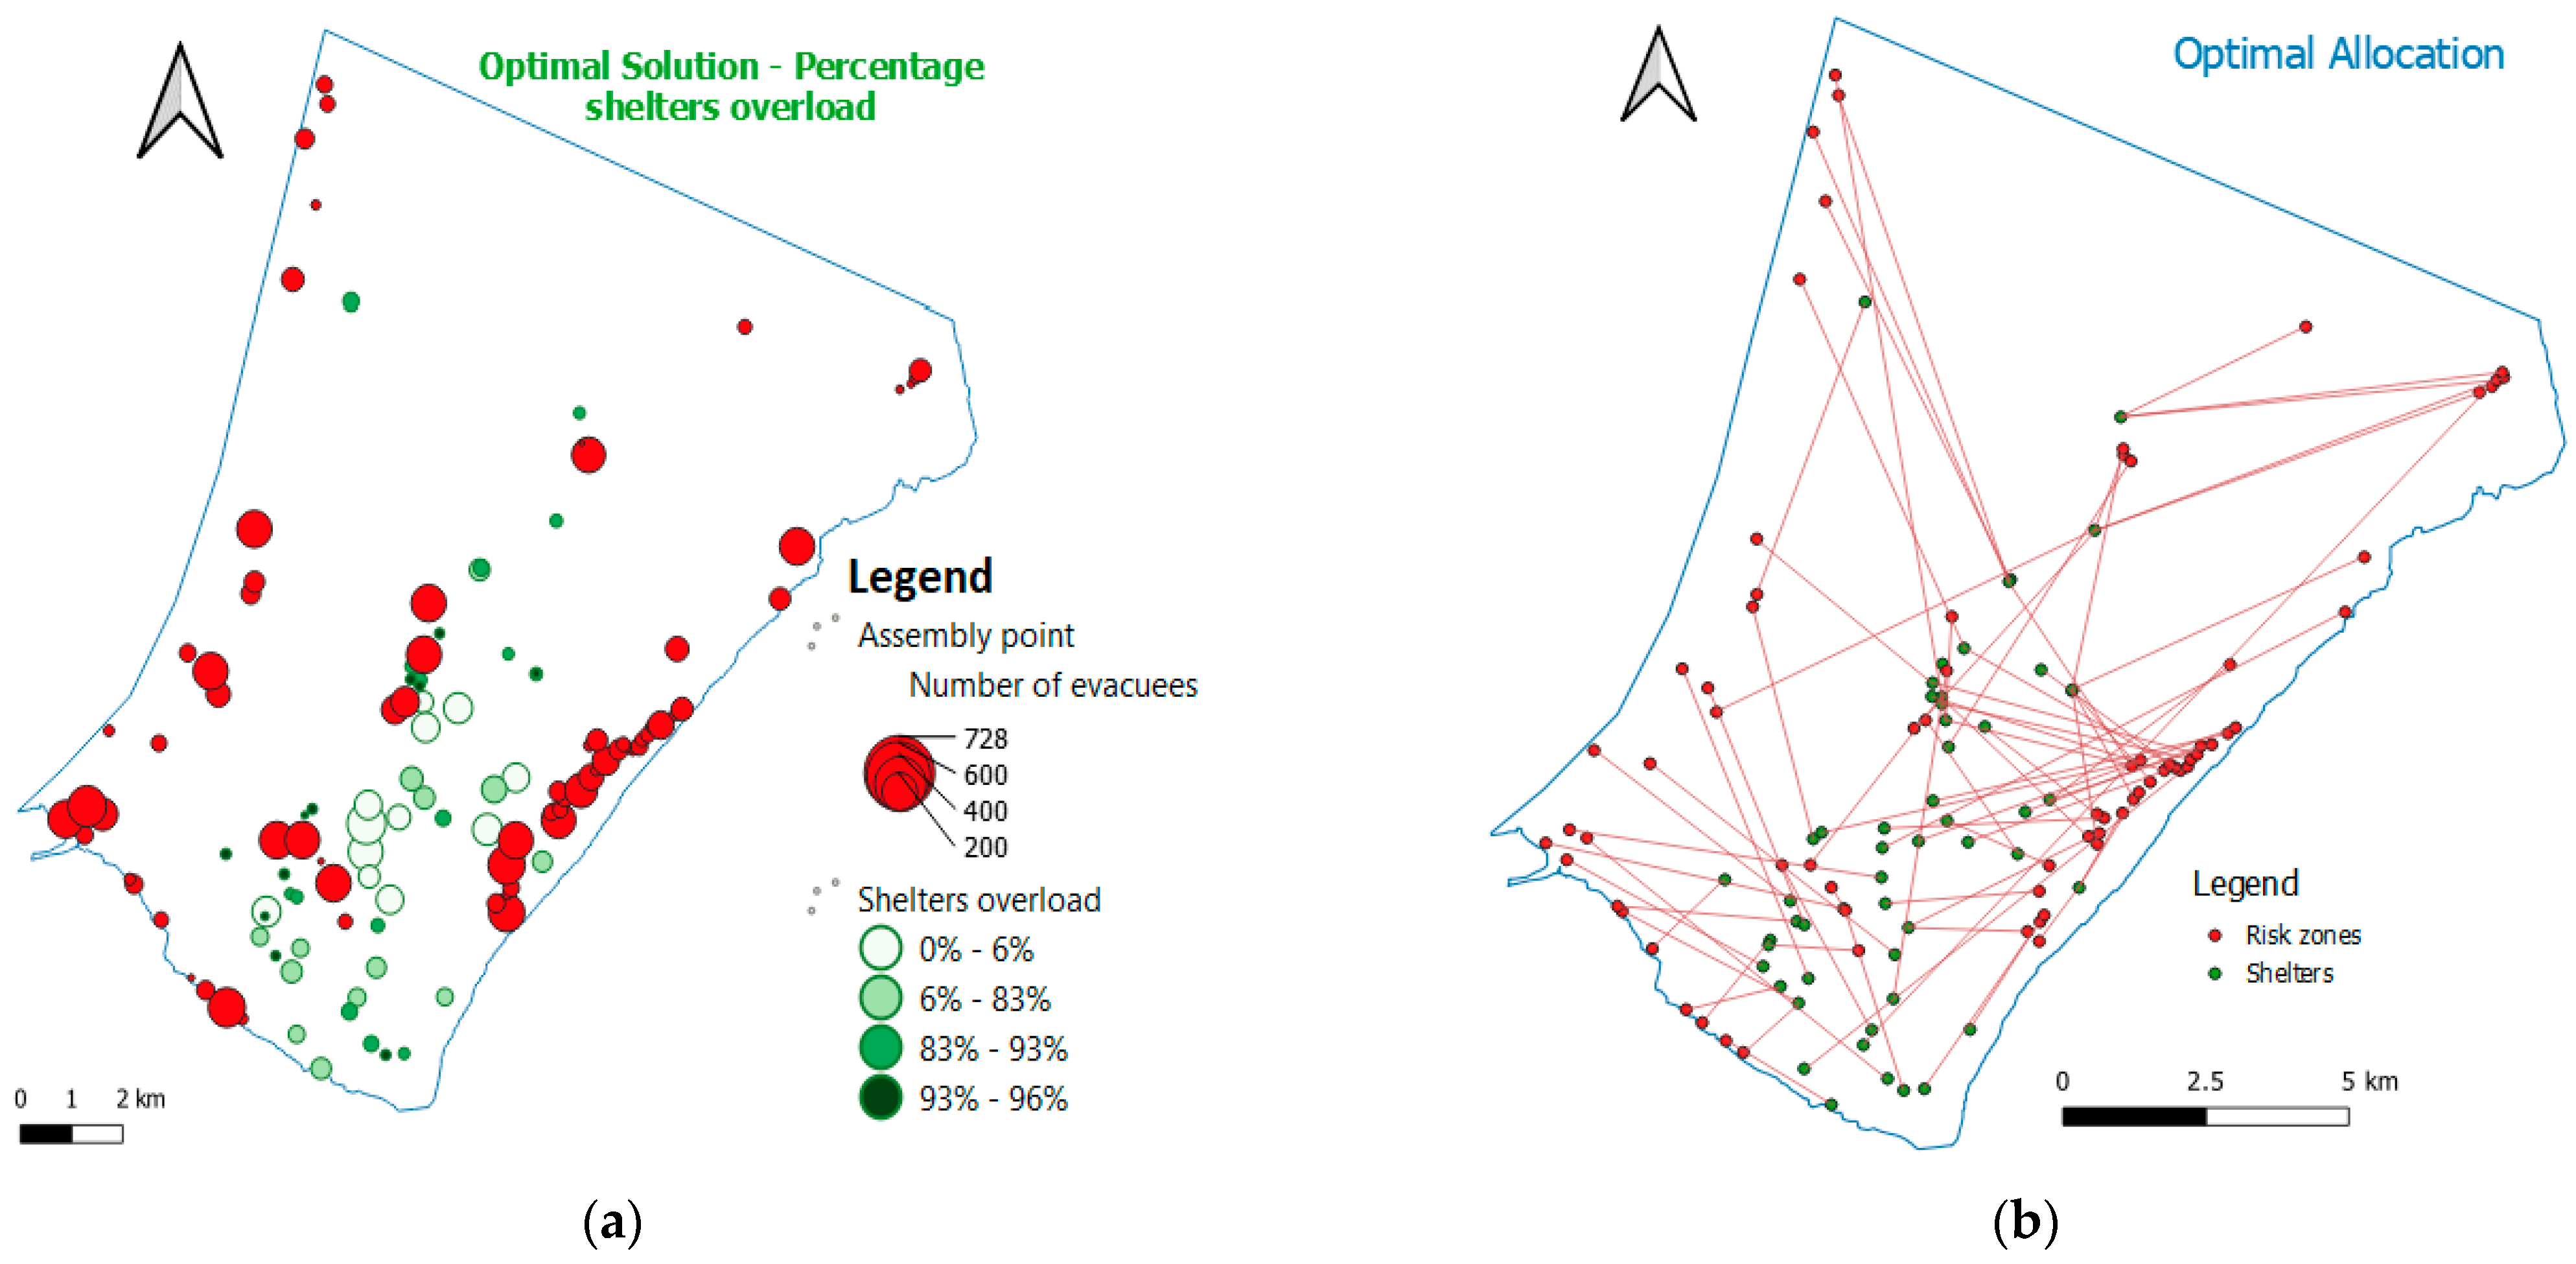
From
Figure 17, it can be observed that certain shelters, which are closer to Risk zones, were not fully utilized, while the shelters farther from the risk zones were fully or close to fully utilized. The latter finding can be justified based on the fact that the DMOCS heuristic assigned evacuees in groups to high-capacity shelters, while the smaller-capacity shelters were used to accommodate the remaining evacuees, who were not assigned to the larger shelters due to the capacity constraints.
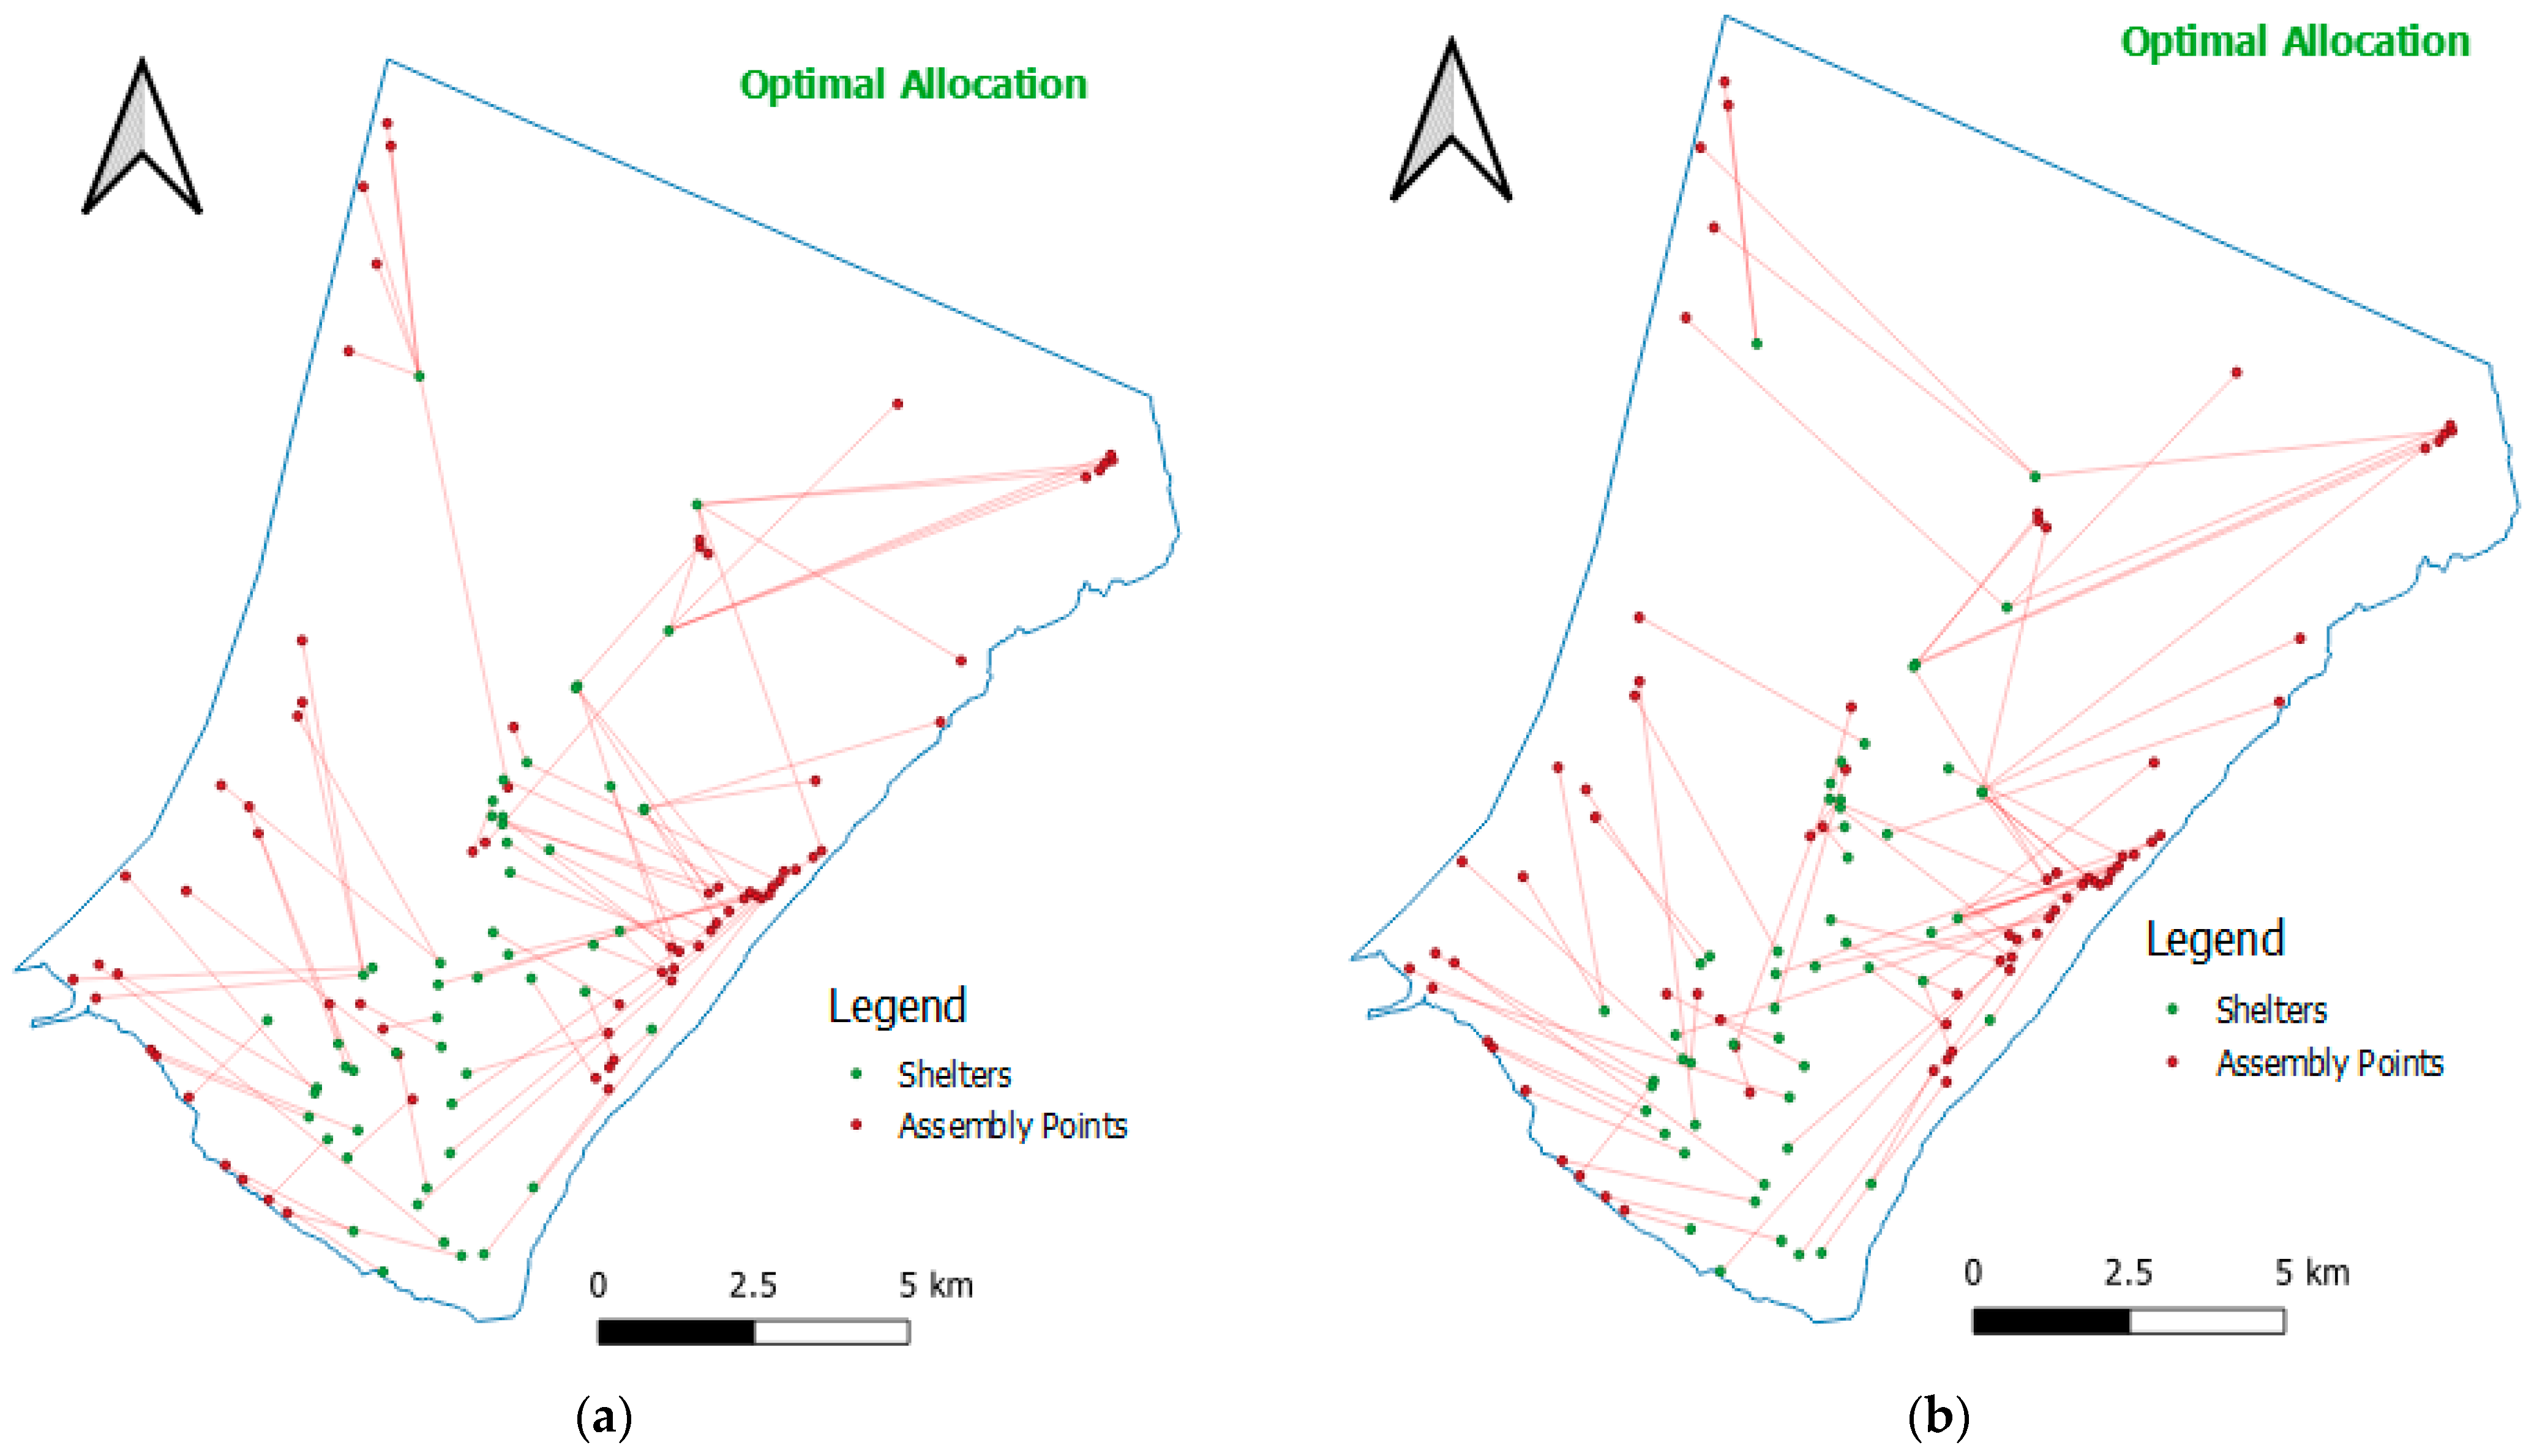
One of the optimal solutions in the evacuation plan process is shown in
Figure 18b. This shows shelters with their respective risk zones. Those with more people who need evacuation care are directed to shelters with larger accommodation capacity, distance and risk factors are also taken into account to minimize.
Figure 17 and
Figure 18, present some scenarios of optimal allocation solutions.
Figure 17b considered a scenario in which the main objective is to obtain the least possible shelters overload.
Figure 18a presents a scenario for choosing a solution whose total evacuation distance is as short as possible.
Figure 18b shows a scenario of choosing a solution whose risk is as small as possible.
Among several scenarios of the optimal solutions, managers of natural disasters are able to choose according to the availability of the resources. In an event of an evacuation process, it is also possible to choose solutions that balance the total risk, the total distance, and the total overload of the shelters.
The risk areas across Maputo city are prone to flooding. In case of approaching floods, the population, inhabiting the areas where the potential impact of a flood is expected to be devastating, is advised to evacuate. The population is required to evacuate the emergency area in a timely manner. However, evacuees are generally advised to use one of the five provided evacuation routes and are assigned to a specific emergency shelter, which minimizes the overload. The latter causes congestion on some of the evacuation routes and inefficient utilization of the available emergency shelters. Specifically, in many cases, evacuees tend to use the same evacuation route, which may further cause route congestion due to the limited capacity of the evacuation routes and significantly delay the evacuation process. Emergency evacuation is even more challenging for vulnerable population groups, who may require additional time in order to evacuate the hazard zone as a result of an approaching natural hazard.
To address the challenges associated with emergency evacuation and facilitate the evacuation process, this research developed a mathematical model and solution algorithms for evacuation planning problems. In order to assess the performance of the proposed solution approaches, the formulated mathematical model and the developed solution algorithms were applied for evacuation of flooding (Maputo city, Mozambique). A set of numerical experiments was conducted to evaluate the proposed algorithms in terms of both solution quality and computational time for the generated problem instances.
5. Conclusions
We have presented DMOCS, a nature-inspired multi-objective optimization metaheuristic for solving evacuation planning problems. The experimental results highlighted that DMOCS algorithm is more efficient algorithm to solve the multi-objective evacuation problem, when compared to the standard MOCS. This was demonstrated by the Hypervolume indicator, which showed that the DMOCS has a better performance than the standard MOCS. The repeatability analysis showed that the DMOCS is stable in relation to the number of generations. The crossover and mutation operators described in Steps 4 and 5 of the DMOCS algorithm are the core of the efficiency gain of the algorithm when compared to the standard MOCS. The aim of modifying these two operators was to obtain more diversification of the individuals.
The Discrete multi-objective cuckoo search algorithm was found to be more promising than the standard MOCS for any-size problem instances. Furthermore, the DMOCS algorithm demonstrated a good tradeoff between the solution quality and the computational time. Findings from this research provide a number of insights regarding emergency evacuation routes and shelter utilization as well as the total traveling risk of evacuees throughout the evacuation routes. National Institute for Disaster Management can use the proposed mathematical model and heuristic algorithms as efficient practical tools in improving the utilization of emergency evacuation routes and emergency shelters, reducing or eliminating risk on roadways during an emergency evacuation, and reducing the travel distance. Moreover, the developed decision support tools are expected to improve the overall effectiveness of the emergency evacuation process and ensure the safety of evacuees, including vulnerable population groups.
The experimental results show that the DMOCS has better and consistent performance as compared to the standard MOCS in most cases in terms of execution time; however, the performance of MOCS is still within acceptable ranges. For future works in this line of research includes the following extensions: A comparative study of the DMOCS and other metaheuristic algorithms.


 ,
, 


