1. Introduction
The Calgary Municipal Building has been the center for civic administration for the City of Calgary, Alberta, since it opened in 1985. This landmark building is a large, triangular structure designed around a 12-storey atrium, and supported by two steel transfer trusses which span 100-feet over the 1960s administration building below.
In order to meet the current building safety codes, with respect to structural safety, the connections in these two trusses required major upgrading. To utilize the full strength of the truss members, repairs were needed to increase the capacity of the truss joints. The upgrading work was done by adding heavy doubler plates to the existing steel W shaped members at the joints. This work required field welding of the heavy plates at the joints in the trusses while the trusses must be substantially relieved of the existing stress until the upgrades were complete.
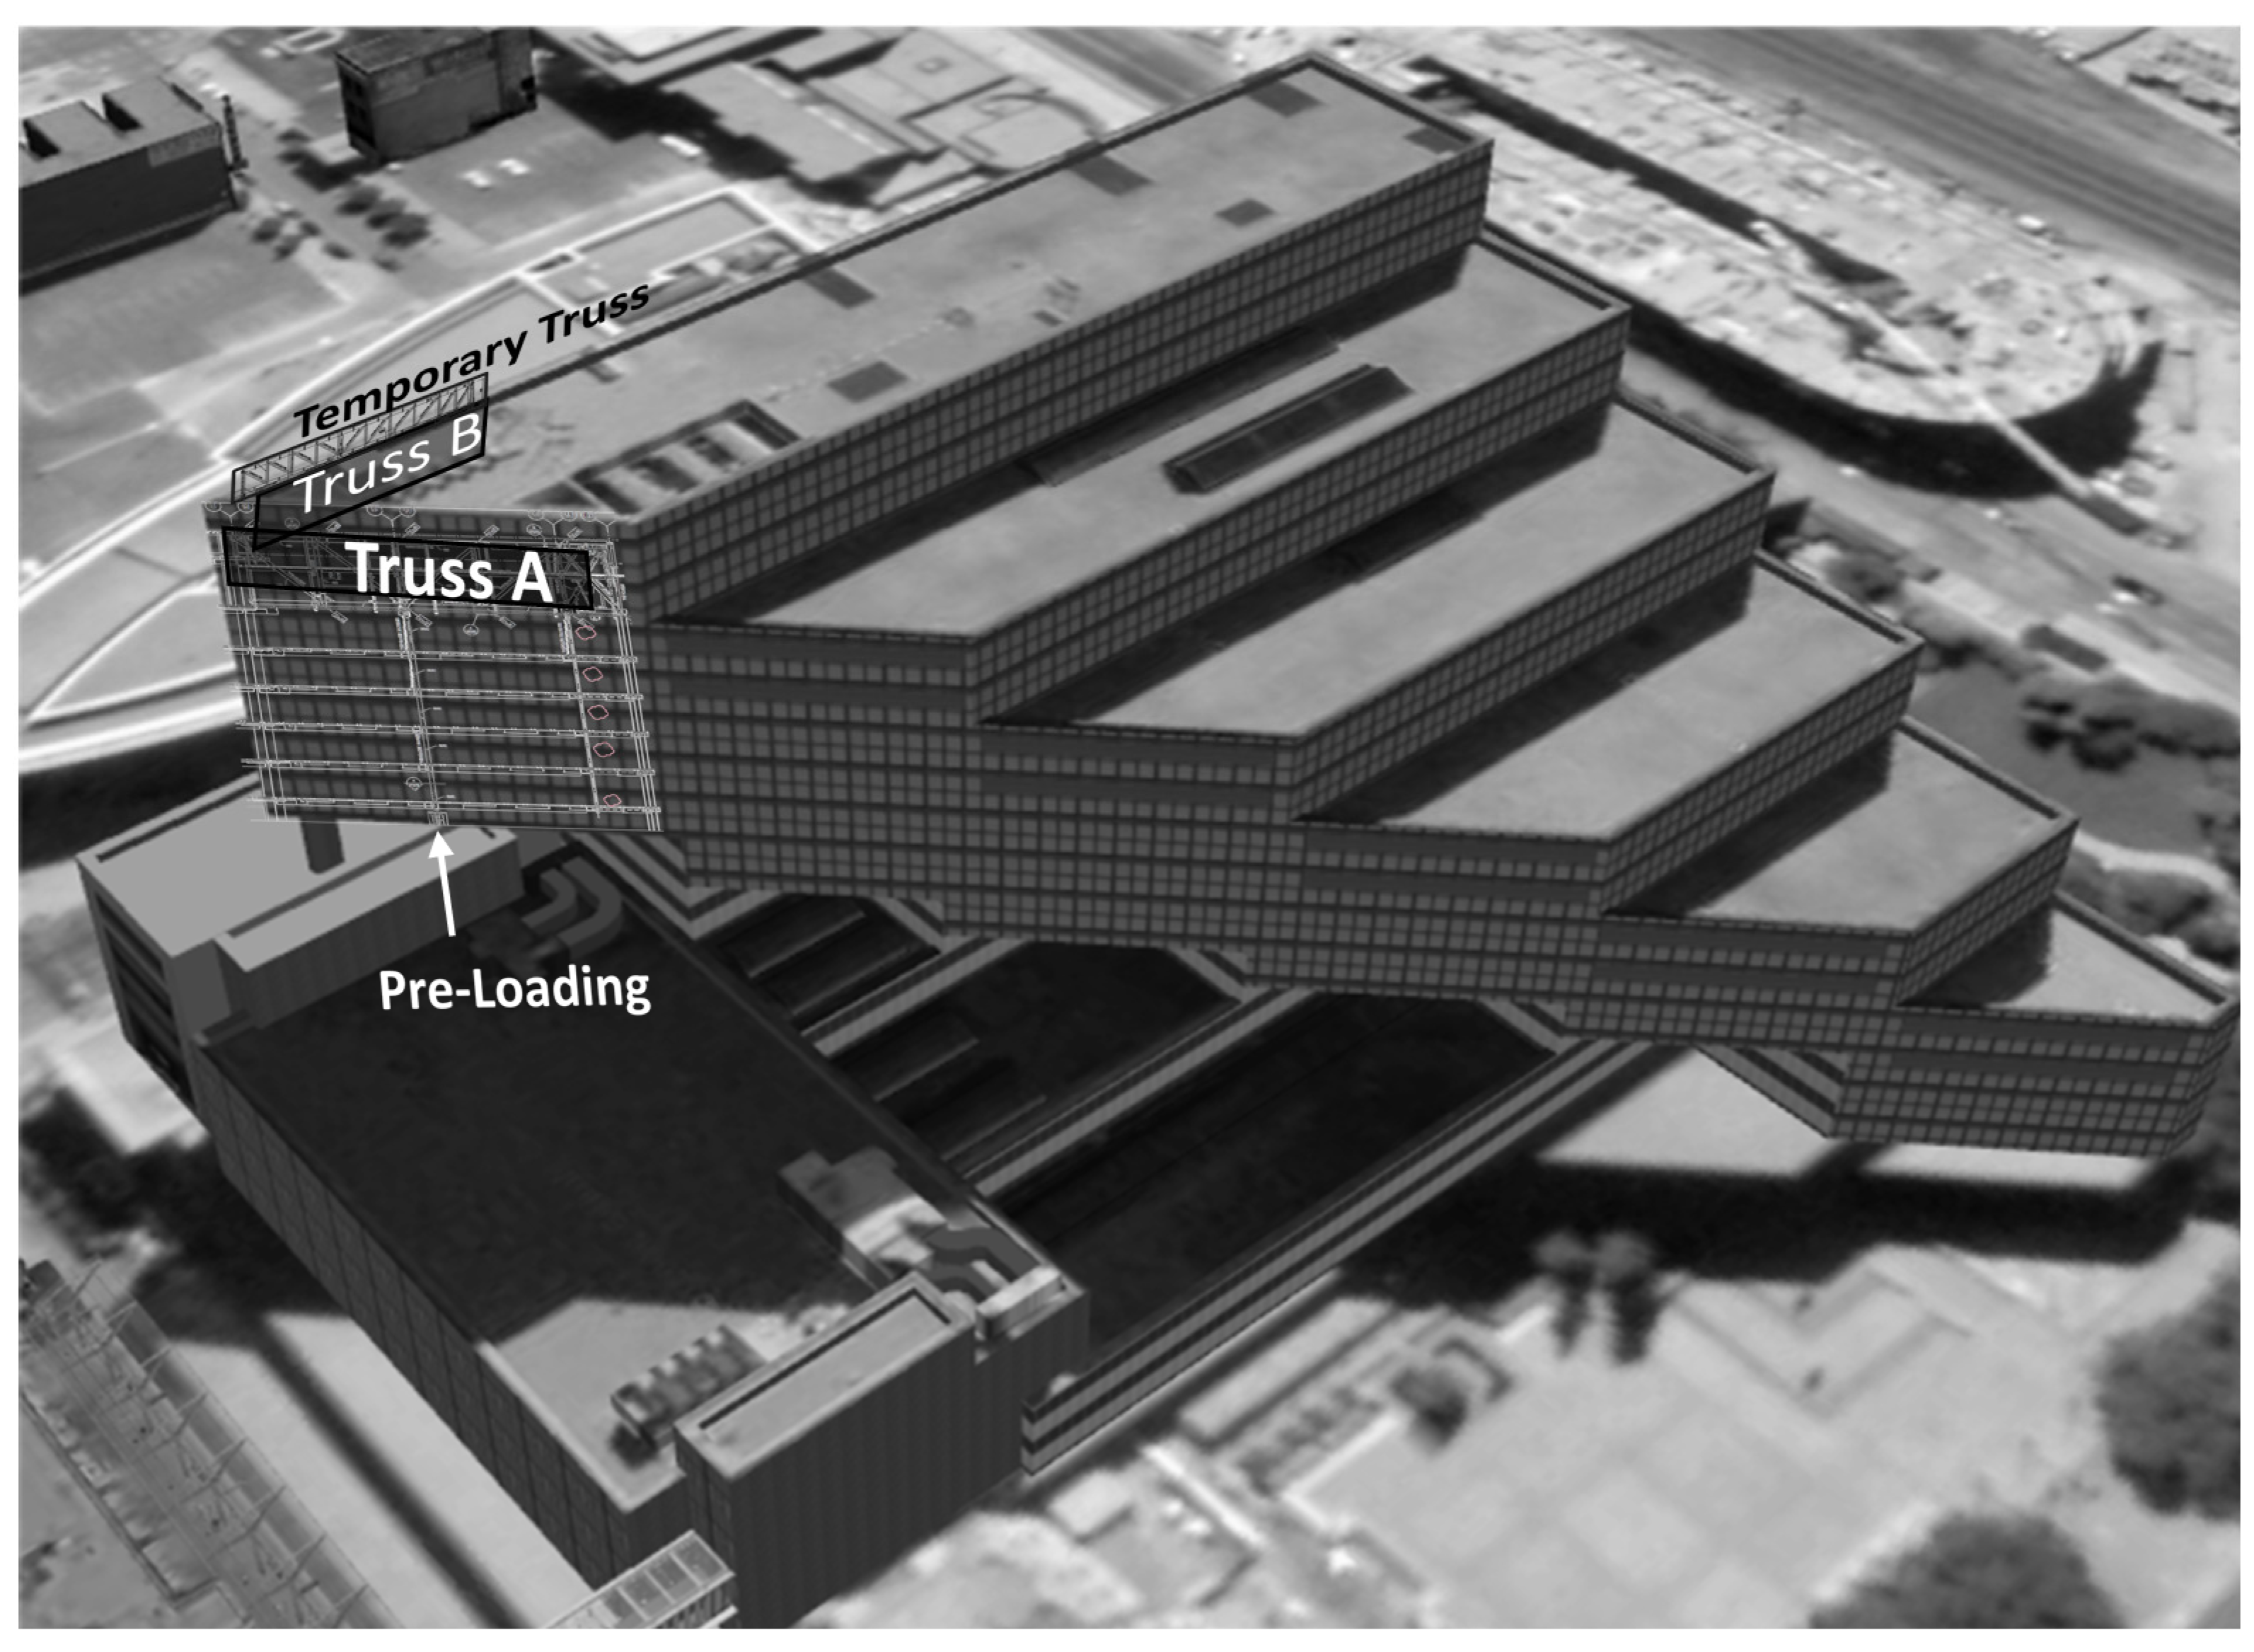
The larger truss, Truss A, was preloaded by the simultaneous pre-tensioning of a newly installed diagonal member on the truss and the jacking of said truss against the existing administrative building below. The smaller truss, Truss B, was preloaded by post-tensioning the rods that connect the temporary truss just above it. Detailed computer analysis was carried out on the process to ascertain the forces, moments, stresses on the joints, and predicted deflections placed on and experienced by the trusses during the upgrade work. To ensure that the repairs took into account the results of this analysis, the trusses were monitored separately using strain gauges and cameras to detect any deflections. This was necessary to track the effect of the pre-loadings and welding operations on the trusses. Furthermore, upon the removal of the pre-loadings, it was important to know that the upgrades achieved the desired results [
1].
Figure 1 shows the approximate position of the main features of this project.
The successful completion of the upgrades was made possible with the authors’ Internet of Things (IoT) solution, which maintained the live monitoring of the critical forces and deflections of the trusses during the eight-month construction process. While the critical pre-loading (or jacking) process to slowly unload the trusses was underway, the strain gauges and cameras provided real-time monitoring of the changes in the truss member forces and deflections. These changes, which were viewed on an on-site computer and could be immediately checked against the predicted results, were invaluable in guiding the critical pre-loading operations. Pre-loading operations were only carried out if the measured and predicted results were in acceptable agreement.
In general, deflection measurements could be classified into traditional measurements and automated measurements [
2]. The traditional measurement methods for deflection were manual measurements, such as dial gauges, leveling, and total stations. The automated measurements methods were non-directional sensor systems, such as inclinometers and long-gauge fiber optic sensors [
3,
4]. Other automated measurements are image processing [
5,
6,
7,
8], photogrammetry [
5,
9], and terrestrial laser scanners [
10] where the observations are performed away from the specimen’s surface. The implemented deflection monitoring entailed precise engineering work in difficult conditions of crowded, fully functional mechanical spaces in an occupied building. Due to automation difficulties, site-induced limitations regarding installation (e.g., location and the necessity for multiple cameras to be set-up), and the nature of predicted deformations of the trusses (one-dimensional vs. three-dimensional displacement), a photogrammetric approach was disregarded. Also, leveling and dial gauges on several stages of the project were temporarily used, but they could not be incorporated into the IoT platform that maintained the eight-months observation period of the project.
The deformation piece was designed and implemented using correlation- based object recognition for distinct retro-reflective targets. This method is classified as a digital image correlation (DIC) technique, as introduced by Ackerman [
5] in 1984, and is used for 2D and 3D estimation of stress and deformations [
5,
6,
8]. In this approach, each camera is positioned such that its optical axis is as close to being perpendicular to the specimen surface as possible. A general assumption of this technique is that the specimen surface is typically flat. Prior to any deformation or displacement, the camera first records a reference image of the object of interest followed by a multitude of images from the object while it is being deformed or displaced. To illuminate the texture on the surface, which could be natural or artificial (e.g., sprayed paint), of the object, a fixed light source is utilized. A common practice is to study subsets of the reference image centered on illuminated features; these subsets in the reference image will then each be matched to subsets in the images of the deformed/displaced object using cross-correlation. The results are deformation or displacement vectors in image space [
11]. The a-priori knowledge of the principal distance of the camera and the depth distance to the object is then used to calculate the object space counterparts of these vectors.
The general application of DIC considers the displacement of the texture/features on the surface of a specimen as a set of vectors, the proposed approach is focused on a single object comprising a multitude of sub-areas of the image covering the retro-reflective target. As such, many of the complexities allocated to texture/feature detection, matching, and sub-pixel registration are eliminated and, thus, instead of providing a large set of vectors that shows the deformation pattern on the surface, the proposed method will provide a single movement (deflection) vector per target.
The main concern regarding the authors’ approach in the event of a displacement, was the empirical accuracy of the displacement measurement. After detailed empirical assessment over a span of the eight months of observation, this study concluded that the DIC methodology achieved accuracy to a subpixel level.
Another concern were the effects of the variations in light source on the results. In conclusion, having multiple targets would considerably reduce the chances of errors being made due to variations in sources of light.
This article provides some general information regarding the setup and the calibration process as well as the pros and cons of the implemented method based on authors’ experience in an industrial context. This simpler approach provided the opportunity to apply an Industrial Internet of Things (IIoT) grade solution with less than 0.1 Hz observation frequency. It also ventures upon achieved sub-millimeter accuracy, robustness of measurements, and long-term deflection measurement capability of the DIC method and its correlation with environmental parameters.
2. Materials and Methods
The Calgary Municipal Building trusses upgrade required real-time deflection monitoring at a high frequency level of 0.1 Hz for several hours during loading and unloading campaigns, as well as the long-term data acquisition at lower frequencies of twice daily, for eight months. Since manual observations would have been overly problematic, due to these specific requirements, an IIoT solution was suggested by the authors. Industrial Ethernet-based cameras (specifications are provided in
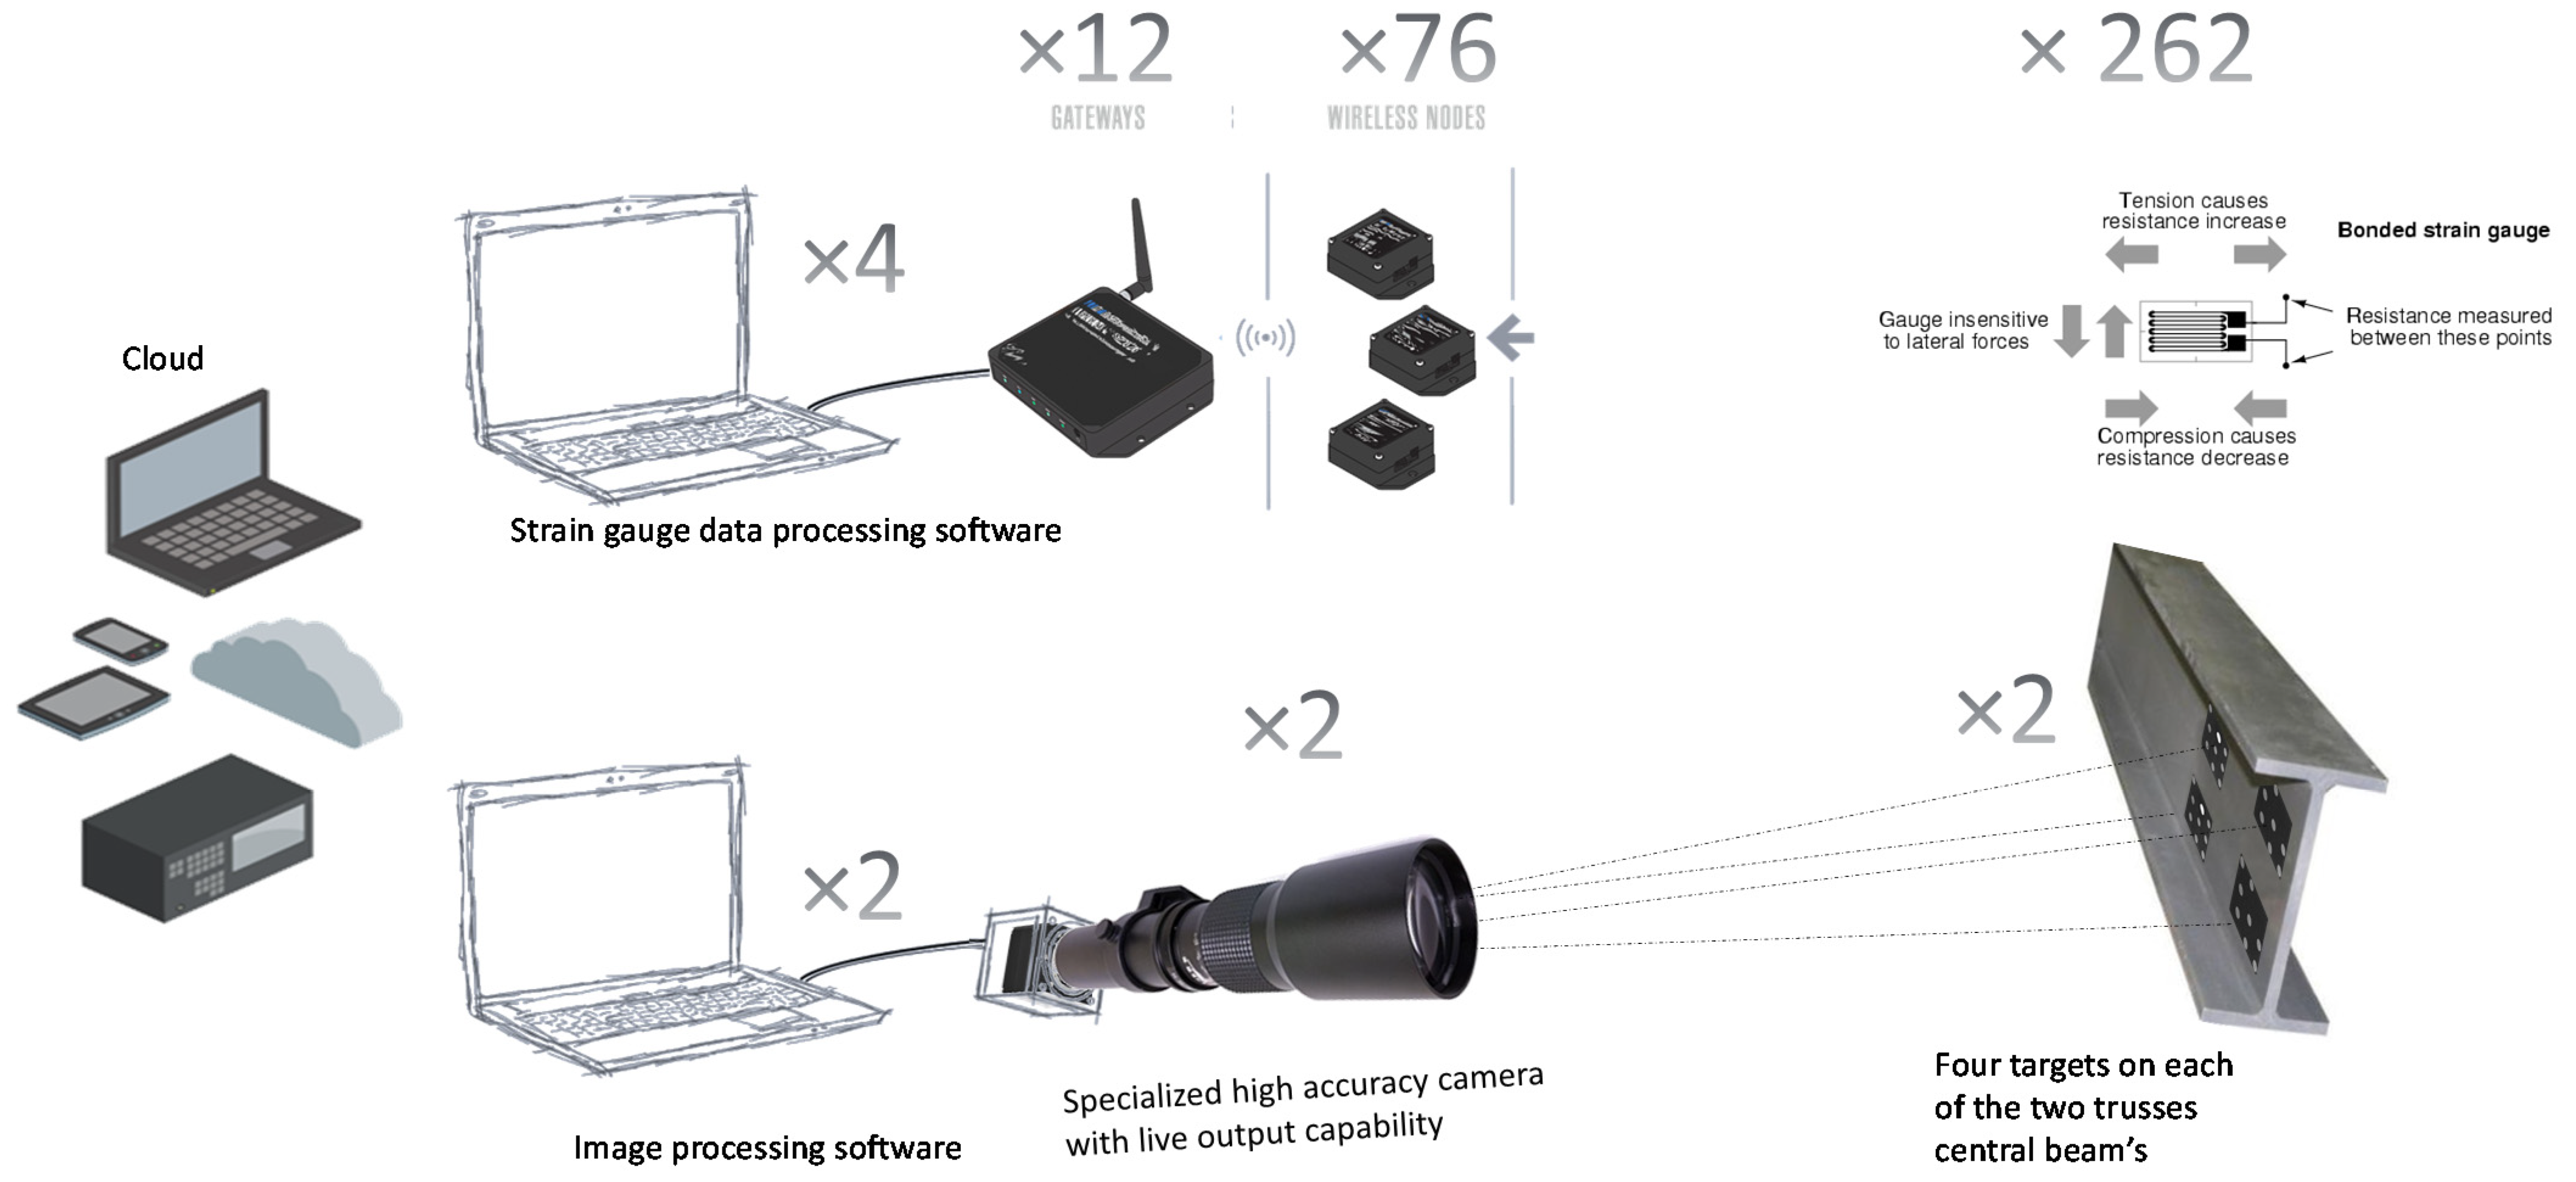
Appendix A) captured images at predefined intervals and sent the data through a TCP/IP protocol to the computers. In each computer (one each for the two trusses), images were archived and processed, and the calculated deflections uploaded to the cloud. At the height of the observations, 262 strain gauges were installed on different members and joints of the trusses. Each strain gauge was connected with low-resistance wires to its data logger (nodes). Each node could accommodate up to four strain gauges on the network which, at its peak, had 76 wireless nodes. Theoretically, one gateway could accommodate all the wireless nodes but, due to the communication limitations, 12 gateways were installed on different rooms, levels, and buildings. The frequency of strain gauge observations was designed at 16 Hz using the bandwidth and processing power of four, moderate- to high-processing capacity laptops. In total, six laptops simultaneously processed strain gauges and camera deflection data and uploaded the results to the cloud.
Figure 2 shows the high-level schematics of the IIoT structure used for this project.
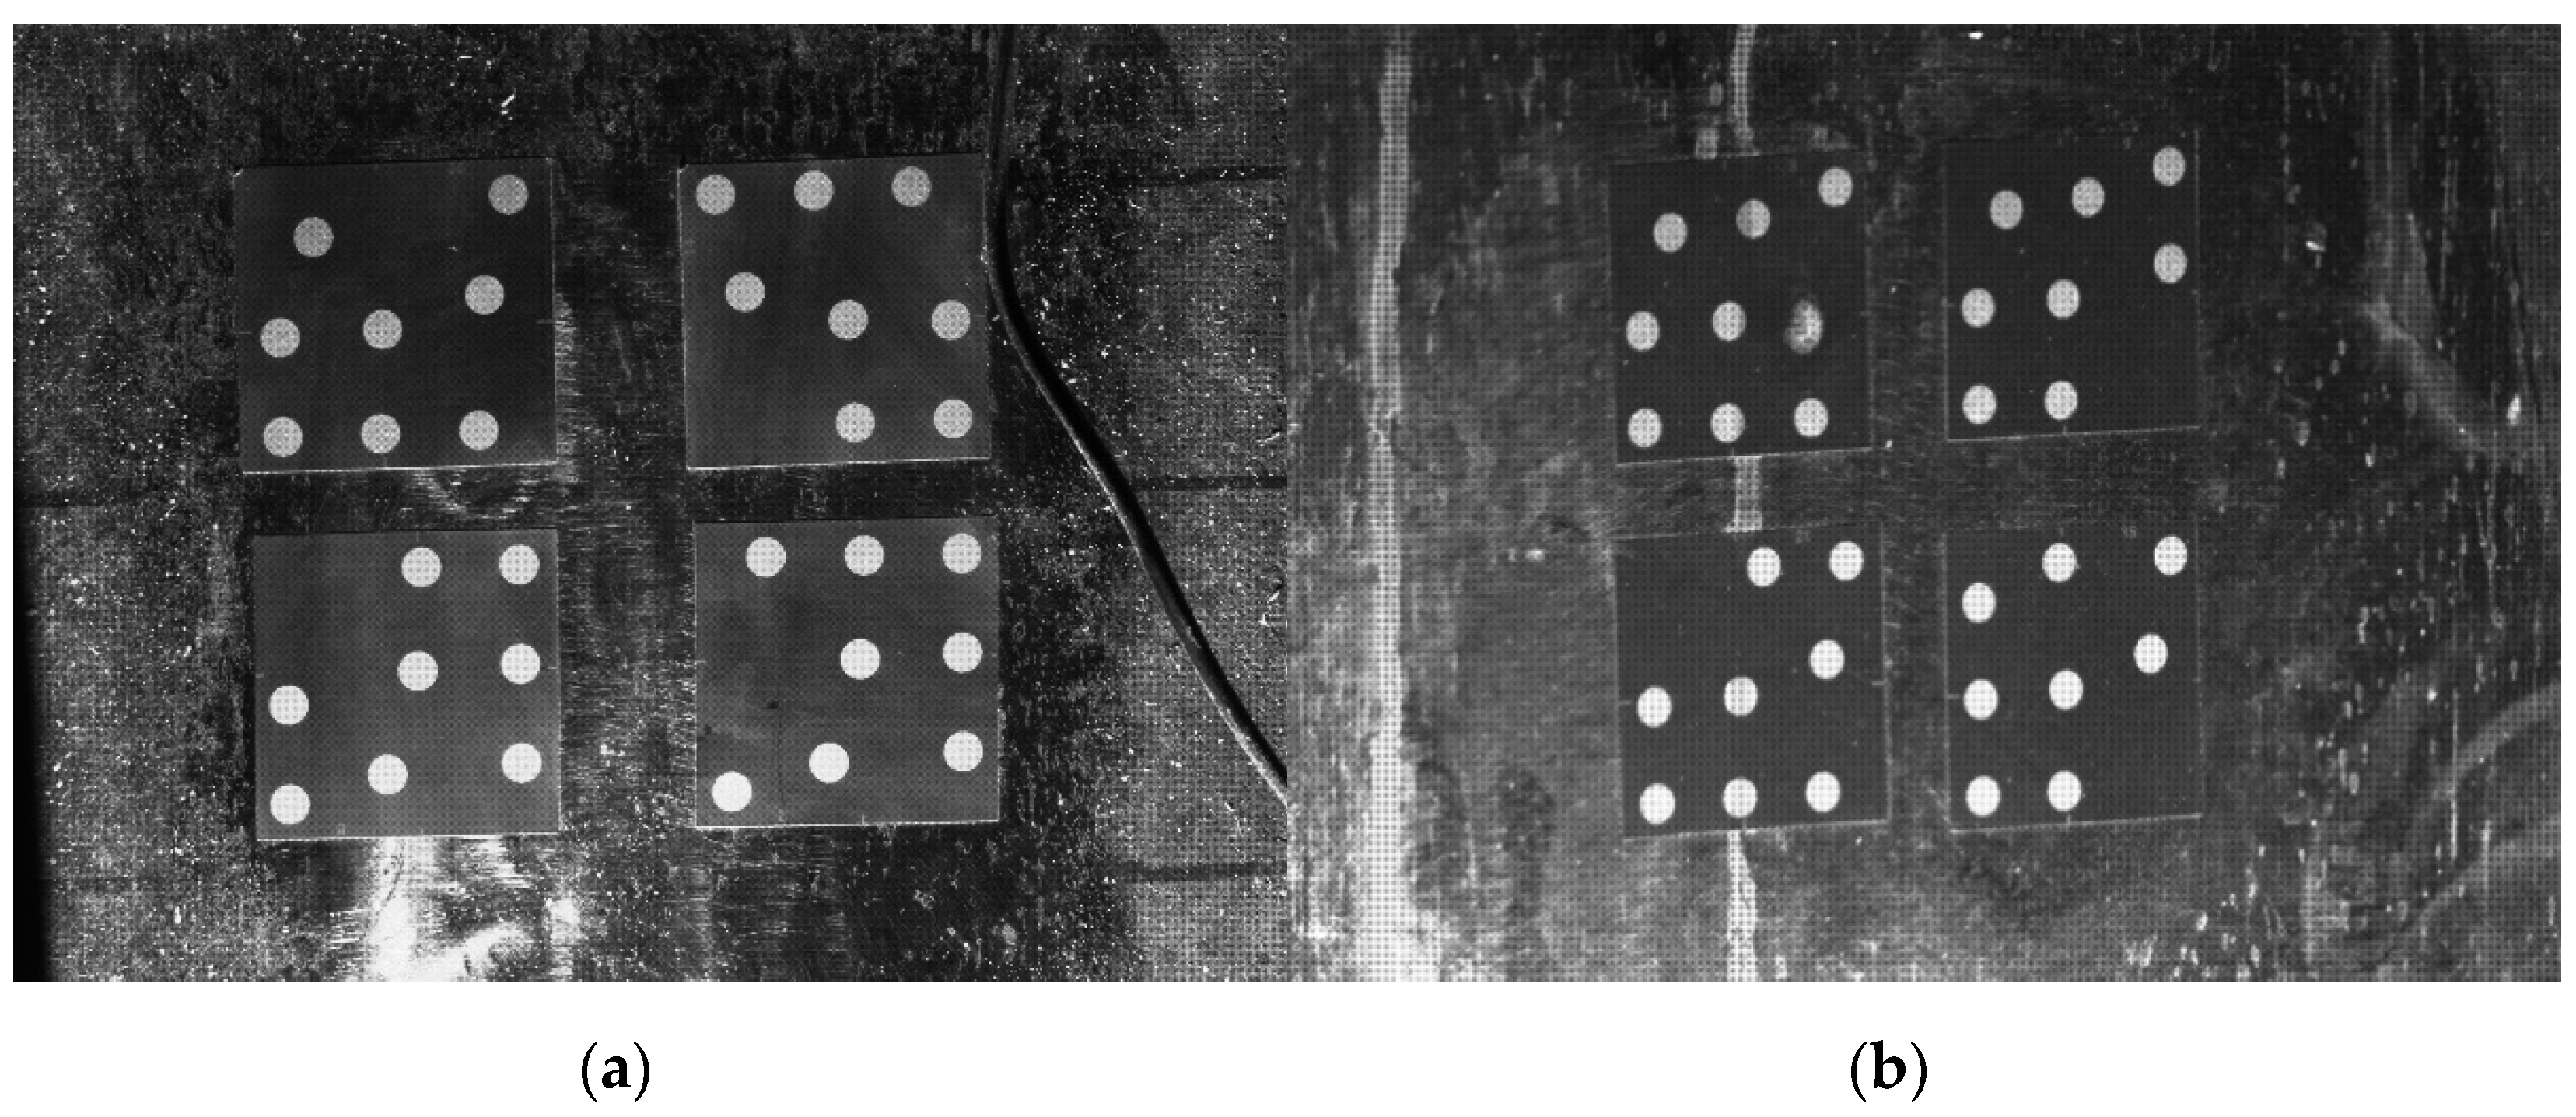
Each camera was focused on a set of four retro-reflective targets (sample targets can be seen in
Figure 3b,c); the arrangement of the four targets can be seen in upper side image on
Figure 4. As shown in
Figure 3, the masks for each of the targets (
Figure 3b,c)) were generated from the reference image (
Figure 3a).
The image coordinate of each target on the reference image would define the local coordinate origin of the corresponding target. Each new processing thread would automatically download the mask images for separate targets, as well as overwrite the reference image on the first image on the thread’s folder. Then, the processing code would start with a bilateral filtering. This filter was selected to remove the noise while maintain the sharp edges on the image. After filtering, each new capture was processed against the reference image. The correlation function would define the new location of each target on the new captures. The distance between the new location and the origin would define the amount of deflection measured in pixel numbers. The kernel used for the correlation was CV_TM_CCOEFF from OpenCV. This correlation method matched a template relative to its mean against the image using a cross-correlation function. The normalized version of this method can, to some extent, reduce the effects of changes in light intensity and local changes of contrast [
12]. Since this 2D DIC was not invariant to imaging scale, rotation, and perspective distortions, it needed the following steps to convert from pixels of the image coordinate to millimeters of the object coordinate system.
Internal calibration parameters were calculated by putting a mini checkerboard on the field of view of the camera. At 15-m, the field of view was roughly 25 cm by 15 cm with a specially ordered, 6mm square board (12 × 9) checkerboard used for the internal calibration. At least one image frame was captured from the checkerboard installed on the surface of the specimen itself. MATLAB’s Camera Calibrator module and, in some cases, functions were modified to perform the calibrations. Internal calibration parameters were used to later remove lens distortions on every image taken during the lifespan of the project. The image geometry, due to telephoto lenses, abided skinny triangle trigonometry.
Figure 5 shows the geometric relationship between the image coordinates and the world coordinates.
In
Figure 5, the sine law dictates:
where image space measurement is m pixels; and s is the scale between the pixels and the metric measurement on the object space (i.e., specimen). Since the specimen surface is a flat plane, only two dimensions needed to be considered: One for horizontal
; one for vertical
.
In order to avoid calculation complexities and uncertainties regarding the skinny triangle effects on the external calibration parameters, the following steps were taken:
The camera was mounted on the same elevation as the targets (reducing the vertical share of the α angle to zero, ).
The camera was as perpendicular as possible to the surface of the targets (reducing the horizontal portion of the α angle to zero, ).
The camera was mounted at the minimum distance design of 15 m from the targets (reducing both horizontal and vertical portions of the β angle to zero, ).
Therefore, the Equation (1) was simplified as follows:
In order to calculate and , the horizontal and vertical scale factors, images of a ruler were taken in the horizontal and vertical axes, respectively. The number of pixels in the image ( corresponding to the distance measured in the horizontally or vertically oriented ruler’s ( image, was measured to calculate the scale factors from Equation (2).
The Micro Four Thirds (MFT) camera which was used had 5.5 × 5.5 µm pixel size. A 150–600 mm F5-6.3 lens with 2.0× converter and Four Thirds to full frame adaptor concluded the final tele setup for this camera. The focal length of MFT camera was double the full frame camera; therefore, the theoretical maximum focal length of this setup was as follows:
with a 4.2 m focal length and a 5.5 µm pixel size, the Thales’ (intercept) theorem produced a spatial resolution of 0.03 mm at 15 m (i.e., average estimation error). Although this resolution was finer than the mandated accuracy for the deflection measurement of 0.1 mm at 15 m, it was necessary to observe the performance of the designed 2D DIC deflection measurement system and to calculate the expected error pocket based on field tests. The setup included the camera with its lens apparatus installed on a rigid platform, taking pictures from a caliper 15 m away from the camera. Several sets of images with and without the retro-reflective targets were captured.
Figure 3 shows the sample images on the left-hand side (
Figure 3a) and the corresponding image templates used for cross-correlation on the right-hand side (
Figure 3b,c). The values read by the caliper were compared to the observed values in the written code. The difference between the two consecutive caliper readings and the estimated deflection between two consecutive images by the 2D DIC code was estimated for all the sets. The accuracy of the caliper itself was 0.02 mm and the 2D DIC results had a mean value of 0.03 mm with standard deviation of ±0.08 mm.
Cameras were mounted on a sheer wall on a sperate building away from the displacements; the cameras were fixed, and their relative orientation and position did not change for the duration of the project. Theoretically, the only changing factors displayed on the images were those of the displacement/deformations of the specimens, as well as external parameters affecting the processing code. Since the forces and predicted deflections during the loading and unloading campaigns were based on propriety calculations out of the scope and permissions of the authors, this paper only focusses on the long-term data acquisition between the campaigns.
3. Results and Discussions
3.1. The Effect of Illumination Changes
The effectiveness of any images-based observation systems is very sensitive to light and shadow in the field of view. For example, in the template matching correlation methods, it is common, for simplification of the code and improvement of the calculation speed, that the energy content of the location in the image would be ignored [
12]. When the local change of contrast (change in the light intensity or orientation) occurs, the local energy content would inadvertently change. Since the energy content is not incorporated to the estimation, this change may affect the results of the cross-correlation.
The first hypothesis was that the retro-reflective targets would be distinctive enough in comparison to their surrounding that there would be no effect from the change in the direction or the intensity of light in the correlation calculation and if the correlation failed, the location would be drastically different from the expected value. This was due to the fact that the authors used correlation to find the global maximum and, if it was not successful, the likelihood of the local maxima in close vicinity would be considerably small.
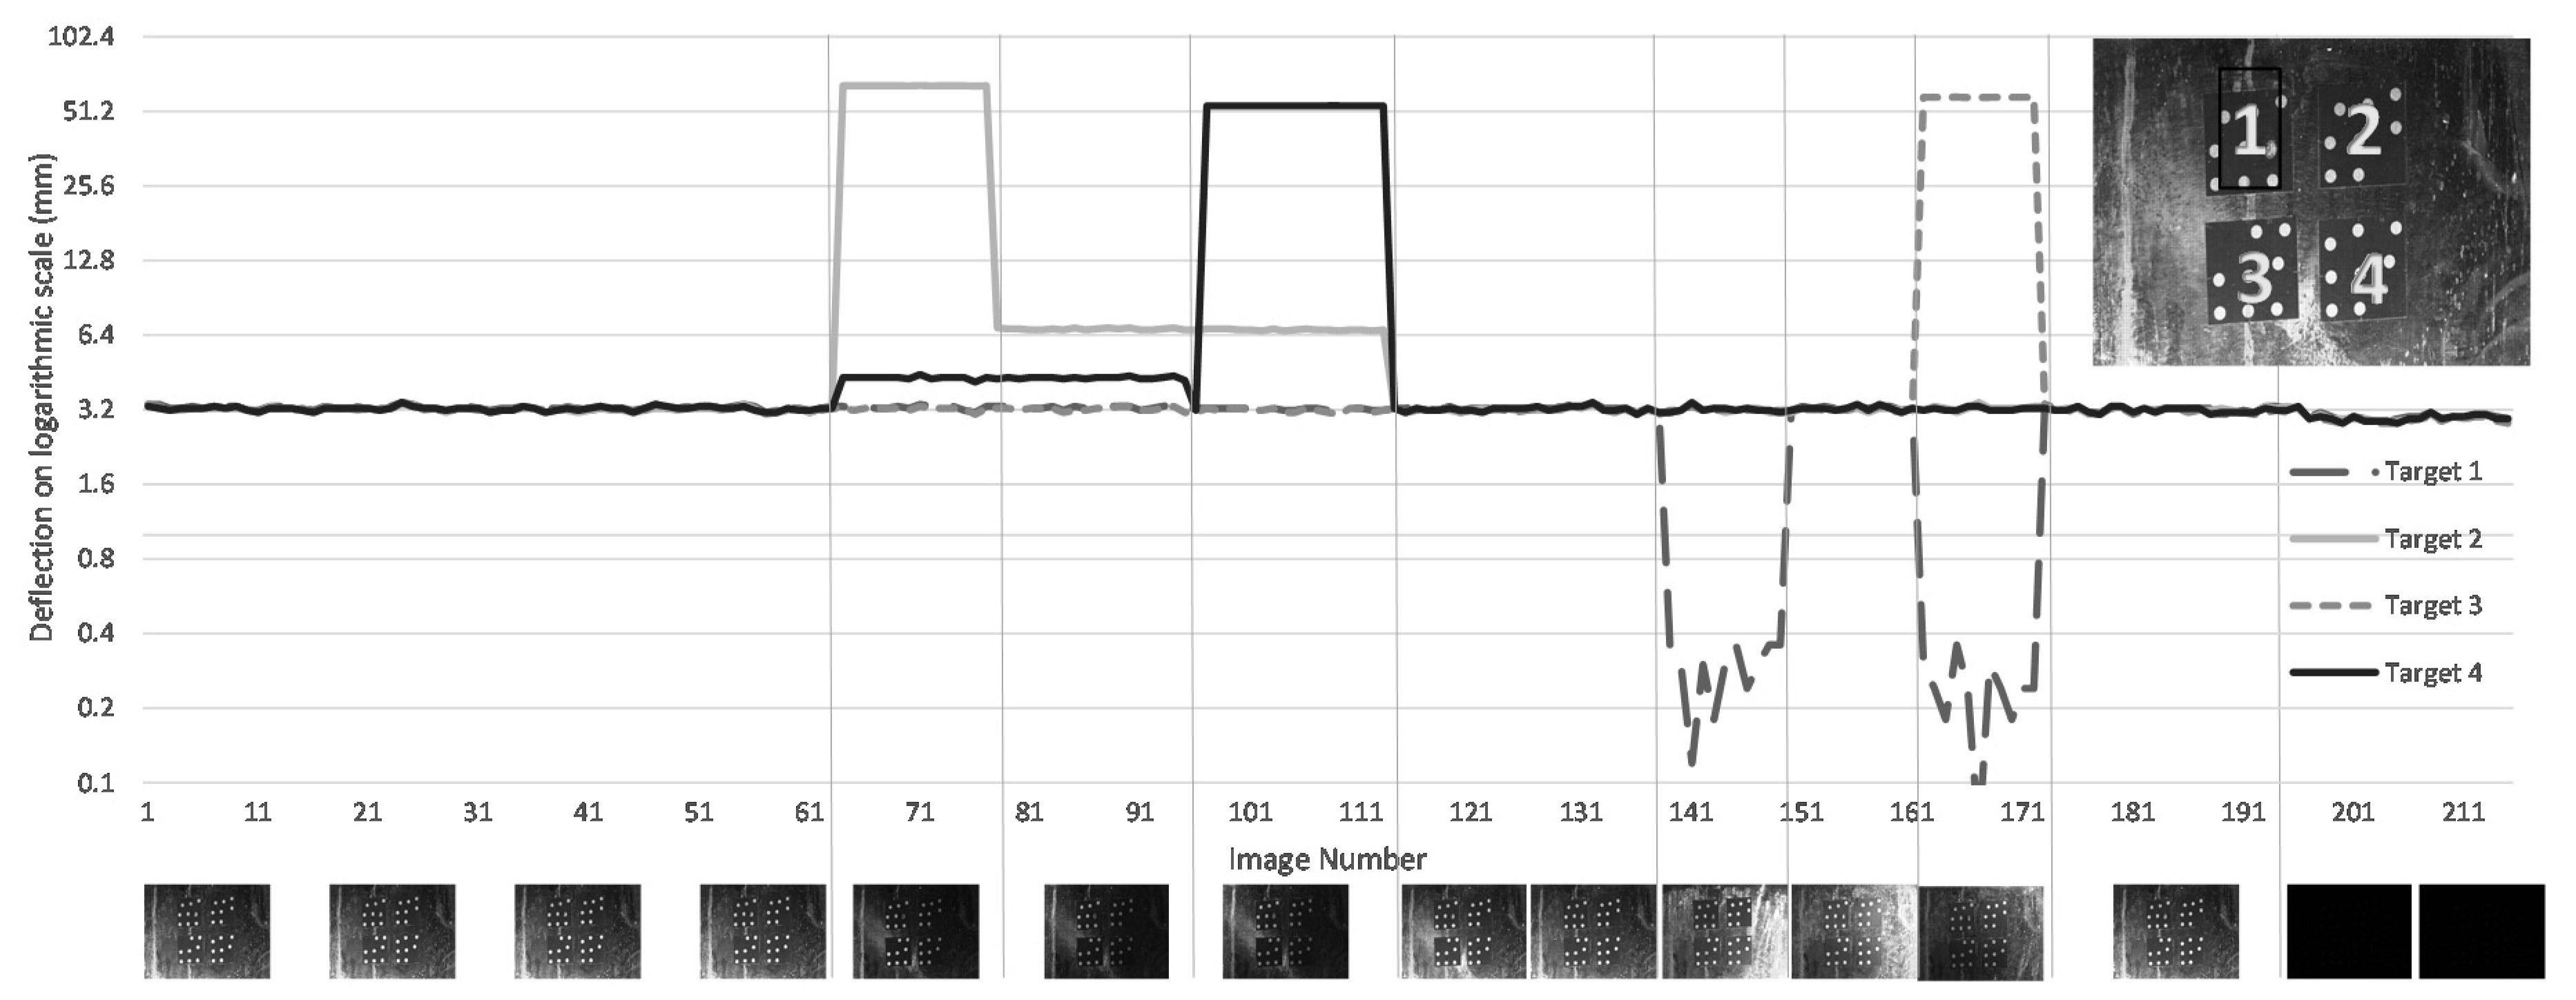
The authors further hypothesized that the specialized retro-reflective targets would provide enough features for the correlation function to correctly locate the targets in the near-total darkness. Testifying to this second hypothesis, during the eight-month span of the project, the full shutdown of light sources occurred several times. Even in the absence of the light, the correlation was able to accurately locate at least one target (out of four) for the full duration of the project, therefore, any alternative observations could legitimately be flagged as outliers. Of-course, the second hypothesis was a special case of the first hypothesis: The results of the experiment on all four targets testing these hypothesized circumstances are presented in
Figure 6.
At the time of the experiment, the deflection of the structure was at 3.21 mm ± 0.08 mm and there was no construction activity. During this hour-long test, various incidence angles and ranges between the specimens’ surfaces and the light source were tested. The observations showed that incident angle would certainly affect the correlation, and, in all the affected cases, it would be significantly bigger than the error pocket of ±0.08 mm. At least two targets at each time maintained the proper deflection values. The full absence of the light source still provided enough features for the correlation to detect all the targets (i.e., image numbers 193 to 213). The reason that all targets produced the same values even without the light might be due to the absence of any sort of light in the scene. This would provide the proper contrast for the retro-reflective targets to produce one maximum instead of few local maxima. The concern with the results shown in
Figure 6 were the areas where the deflection values were close to (but not exactly) 3.2 mm. This included target #4 in images 64 to 95 (4.3 mm), as well as target #1 (0.36 to 0.12 mm) in images 139 to 150, and, images 162 to 173 (0.30 to 0.06 mm). As mentioned before, two to three targets maintained the exact value of 3.21 mm ± 0.08 mm even in those images. The performance of each target is presented in
Table 1.
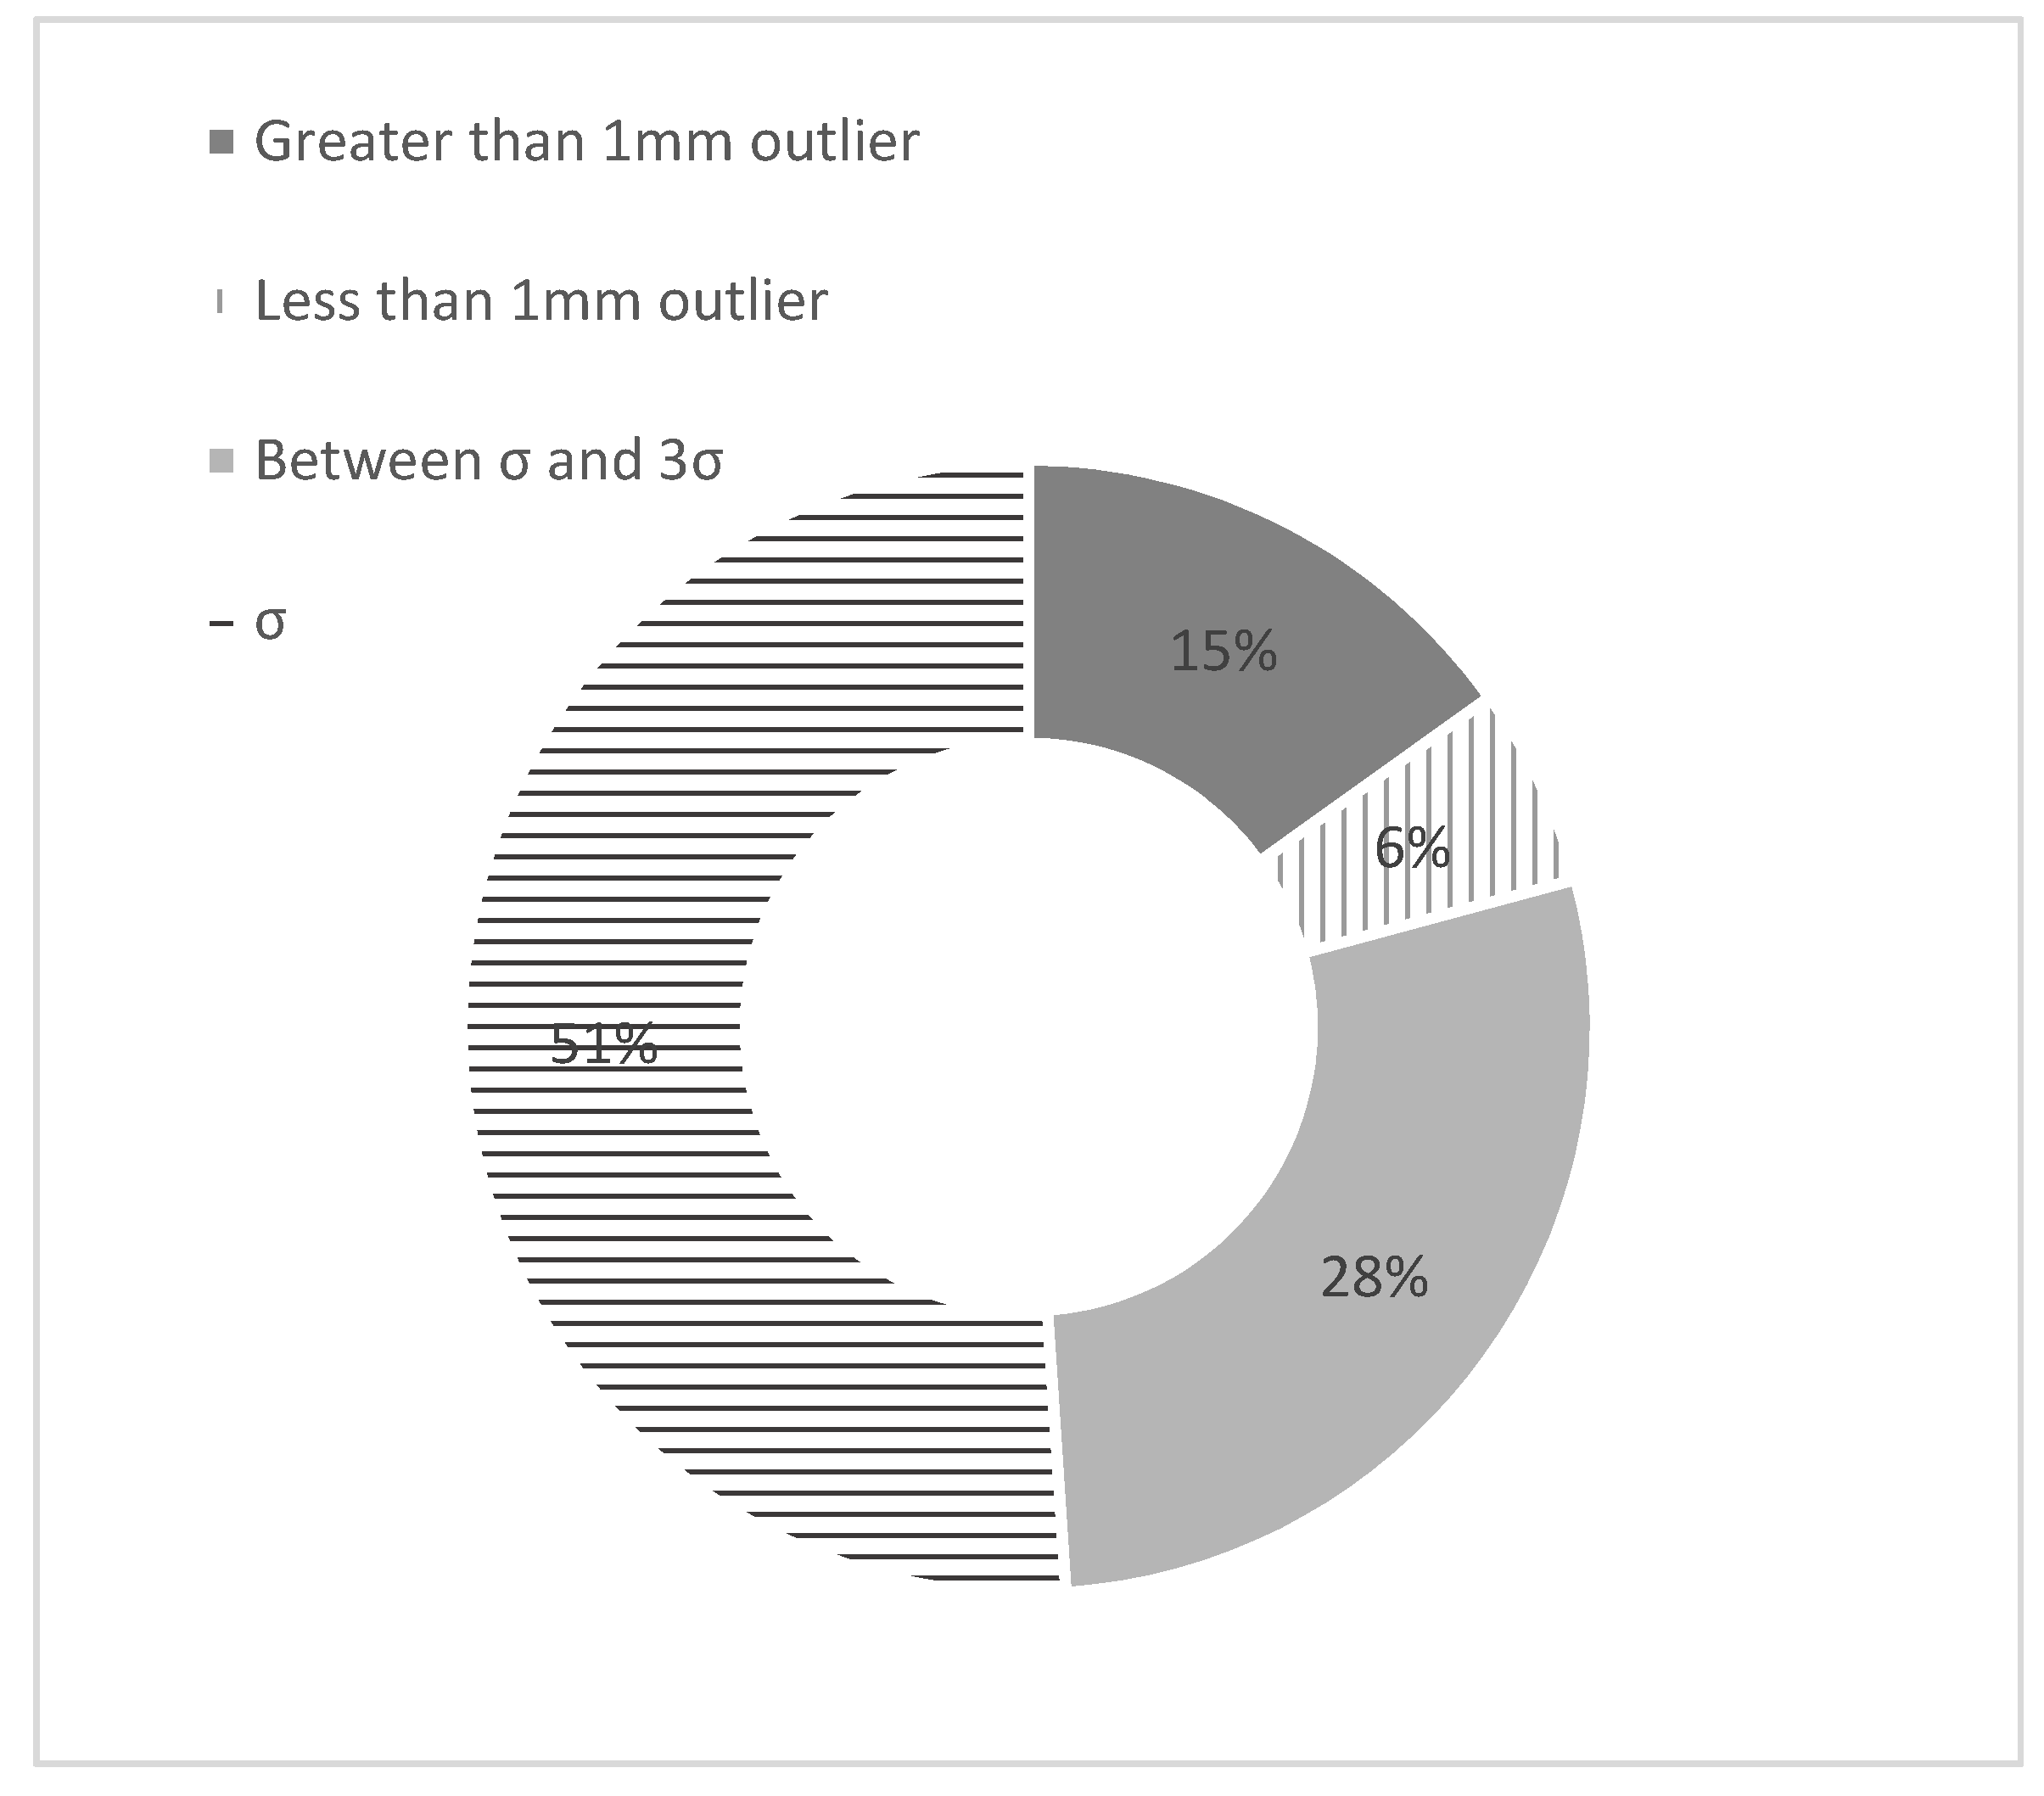
The overall percentage is presented in
Figure 7. Only 6% of the images were in the 1 mm outlier area, therefore, they were not distinctive enough. The other outliers that could have been easily identified using the data history were accumulating 15% of the data and 79% of the data are in 3σ probability region.
This section may be divided by subheadings. It should provide a concise and precise description of the experimental results, their interpretation, as well as the experimental conclusions that can be drawn.
3.2. Environmental Parameters
Deflection and deformation monitoring are often necessary for structural implementation, maintenance, and/or repairs. To avoid sudden jerks, the upgrades must be done gradually. Therefore, the environmental parameters, such as temperature which has minuscule displacement effects on structures (due to contraction and expansion), needed to be incorporated into deflection monitoring. This study provided some analysis of the deflection time series on different time scales (e.g., daily to monthly) and identified the influential environmental parameters.
The environmental parameters were accessed and downloaded from Environment and Climate Change Canada website, as provided by Meteorological Service of Cana-da. Due to their proximity to Calgary Municipal Building, three weather stations were considered for obtaining the relevant data for the City of Calgary. Calgary International Airport (Calgary INTL A), which was the closest station to the project site (at a distance of approximately 9.2 km), was selected as the source of environmental data. Data acquired were those provided in hourly, daily, and monthly temporal resolutions, with each observation representing the average observation of lower temporal resolutions.
The long-term daily deflections from cameras were recorded two times a day at 6:00 a.m. and 6:00 p.m. with +/−30 min temporal accuracy; therefore, only hourly measurements from 6:00 a.m. and 6:00 p.m. from each day have been compared to the deflection values.
This case study was for the central beam connection of two trusses installed on the top floor of Calgary’s triangular Municipal Building designed around a 12-storey atrium. The axial forces on the two members and their deflection were monitored and measured by strain gauges during the experimentation period and have been incorporated inside this analysis. Over 40 climate parameters, such as humidity, wind speed, solar radiance, and, especially, temperature, were analyzed with a signal decomposition approach. For example, the displacement signal had a correlation coefficient of above 0.8 with the temperature outside and, thus, showed the considerable effect of external heat outside of the building on to the internal structure of an energy-efficient building. Long term environmental parameters are presented by Equation (4).
The long-term observations for Truss B were made twice a day for 104 days, from the end of July through to November, 2017 (see Equation (5)). Except for reinforcing the joints during this time, no special construction activity was performed.
where
stands for any deflection measurement in Truss B;
i is the date;
is all the measurements for the Truss B deflections from 31 July to 11 November 2017.
The observations for Truss A started on 7 September 2017, after the re-calibration of camera (see Equation (6)).
where
stands for any deflection measurement in Truss A; and
i is the date.
are Truss A deflections after 7 September 2017.
The correlation coefficient between the two trusses in the absence of construction activities was 0.88. The hypothesis that temperature was the main proponent in the variations of deflection on the non-construction state was tested. The corresponding climate data was an hourly observation, two times per day, as provided by the Government of Canada [
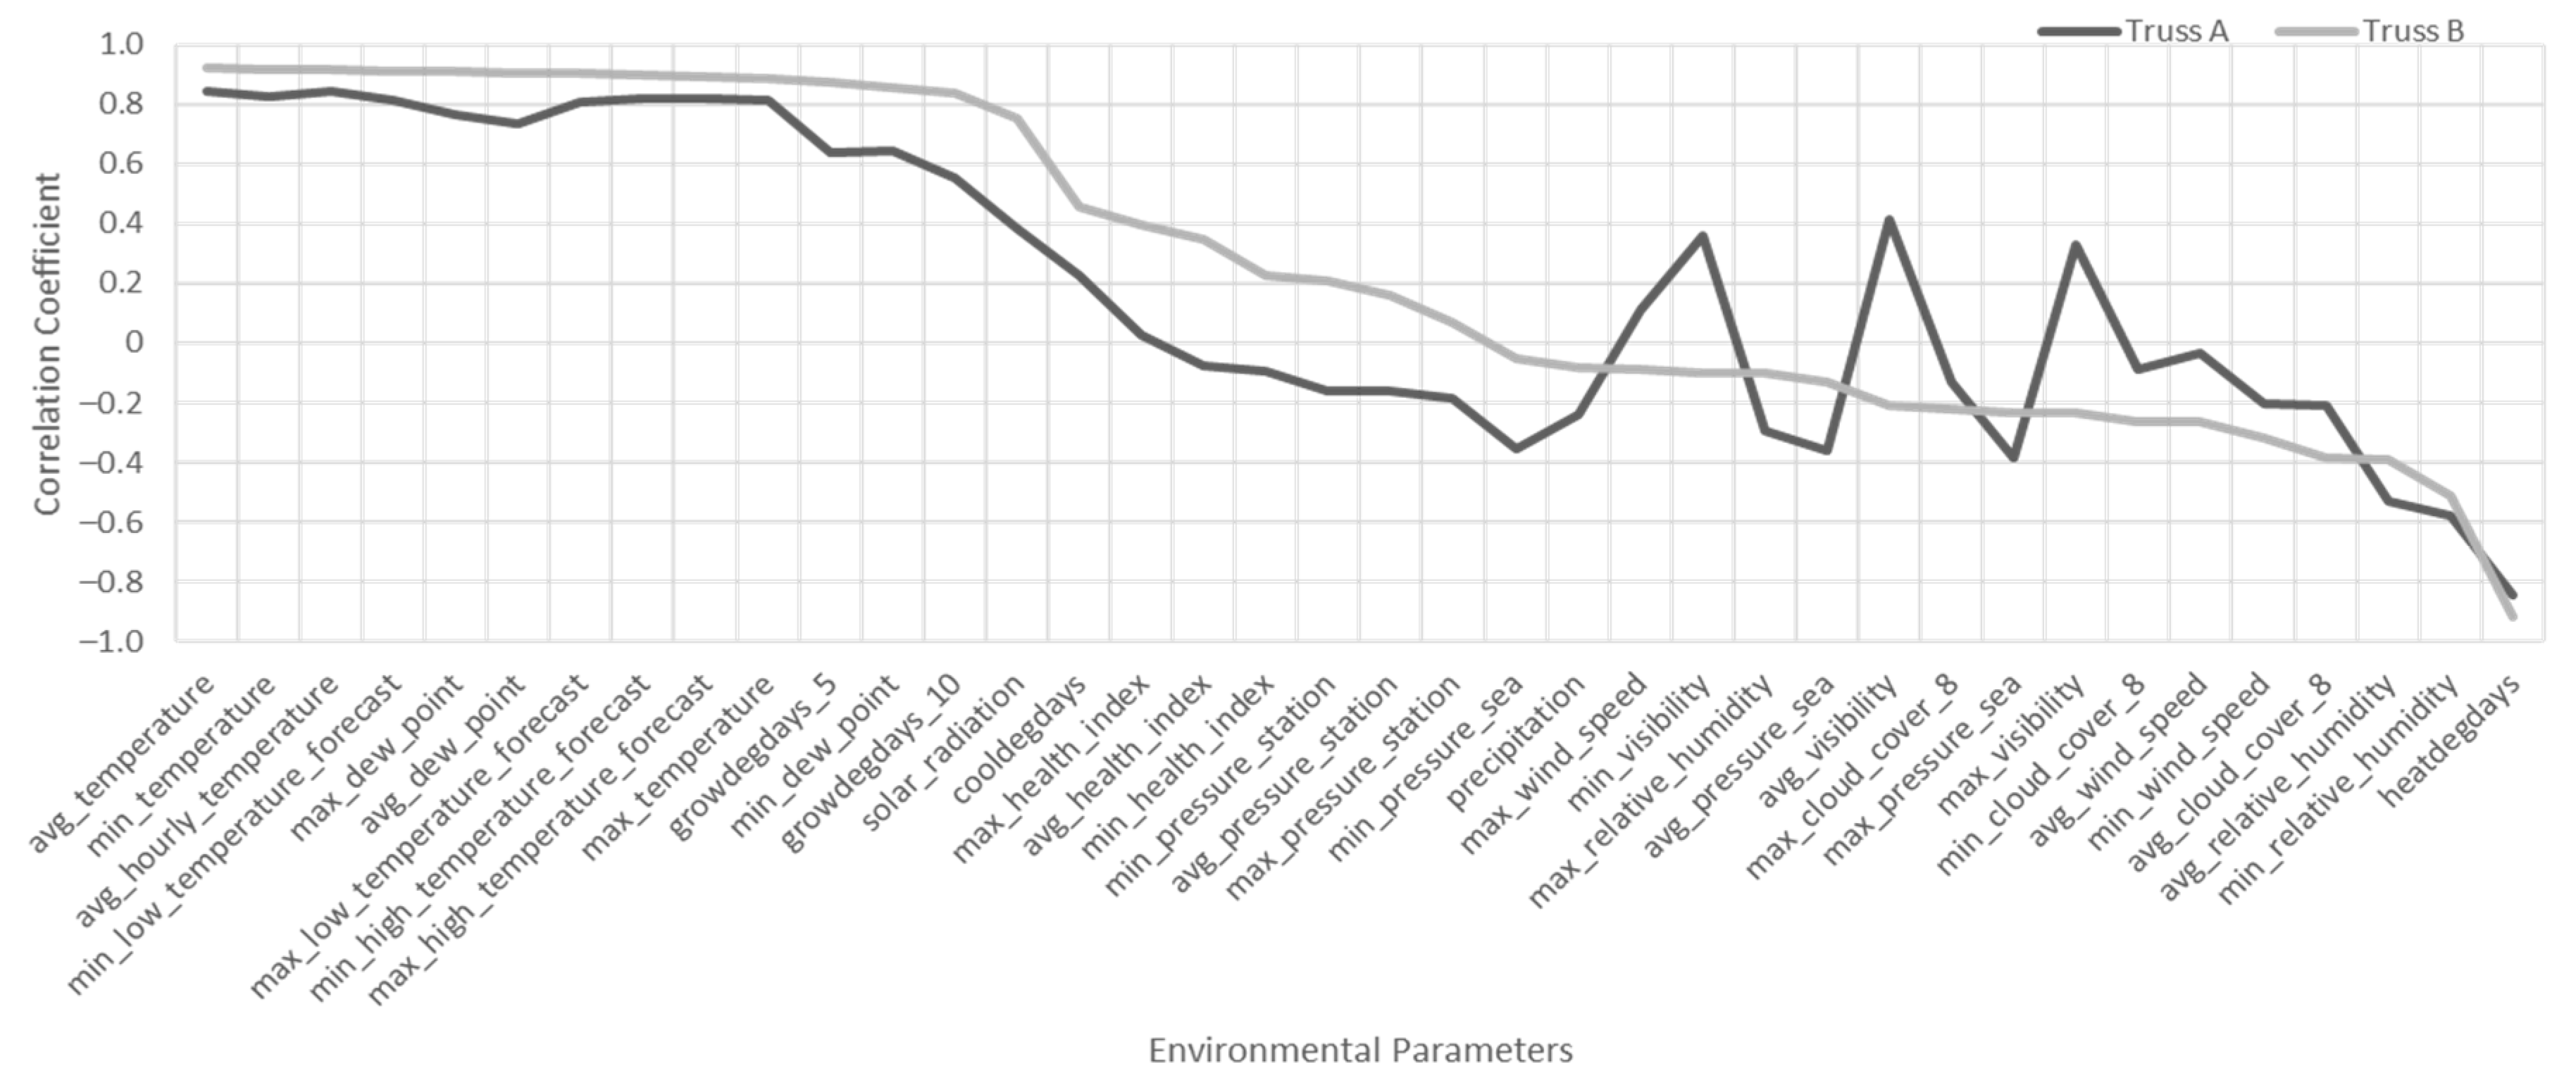
13]. Against 58 climate parameters measured on an almost daily bases, “average hourly temperature” had the highest correlation on both trusses, with a correlation of 0.92 for Truss B and 0.84 for Truss B.
Table 2 shows the climate variables that have correlation coefficients with the deflection readings of above 0.5 for both trusses.
Table 2.
Environmental parameters correlations with deflections. The results are sorted based on Truss A, and correlation class is assigned based on both Trusses.
Table 2.
Environmental parameters correlations with deflections. The results are sorted based on Truss A, and correlation class is assigned based on both Trusses.
| Environmental Parameter Name | Truss A | Truss B | Correlation Class |
|---|
| Truss A deflection | 1 | 0.88 | Strong
(0.70–0.89) [14] |
| Truss B deflection | 0.88 | 1 |
| Average hourly temperature | 0.84 | 0.91 |
| Heat-degree-days | −0.84 | −0.92 |
| Average temperature | 0.84 | 0.92 |
| Minimum temperature | 0.83 | 0.92 |
| Minimum high temperature forecast | 0.82 | 0.90 |
| Maximum high temperature forecast | 0.82 | 0.90 |
| Minimum low temperature forecast | 0.82 | 0.92 |
| Maximum low temperature forecast | 0.81 | 0.91 |
| Maximum temperature | 0.81 | 0.89 |
| Maximum dew point | 0.76 | 0.91 |
| Average dew point | 0.73 | 0.90 |
| Sunset time | 0.72 | 0.94 |
| Snow on the ground | −0.68 | −0.87 | Moderate
(0.40–0.69) [14] |
| Sunlight | 0.65 | 0.92 |
| Grow-degree-days-5 | 0.64 | 0.87 |
| Minimum dew point | 0.64 | 0.85 |
The climate data have different biases and scales than the deflection dataset. Therefore, a normalized scaled, biased approach was used following the formula below:
where
P is the environmental parameter in the study mentioned in Equation (4);
is the normalized value. In Equation (7), after removing the bias
(average of
) from daily normalized values
, the result is scaled and biased by the dimensions of the deflections of the truss that it is being compared to.
The results presented in
Table 2 and
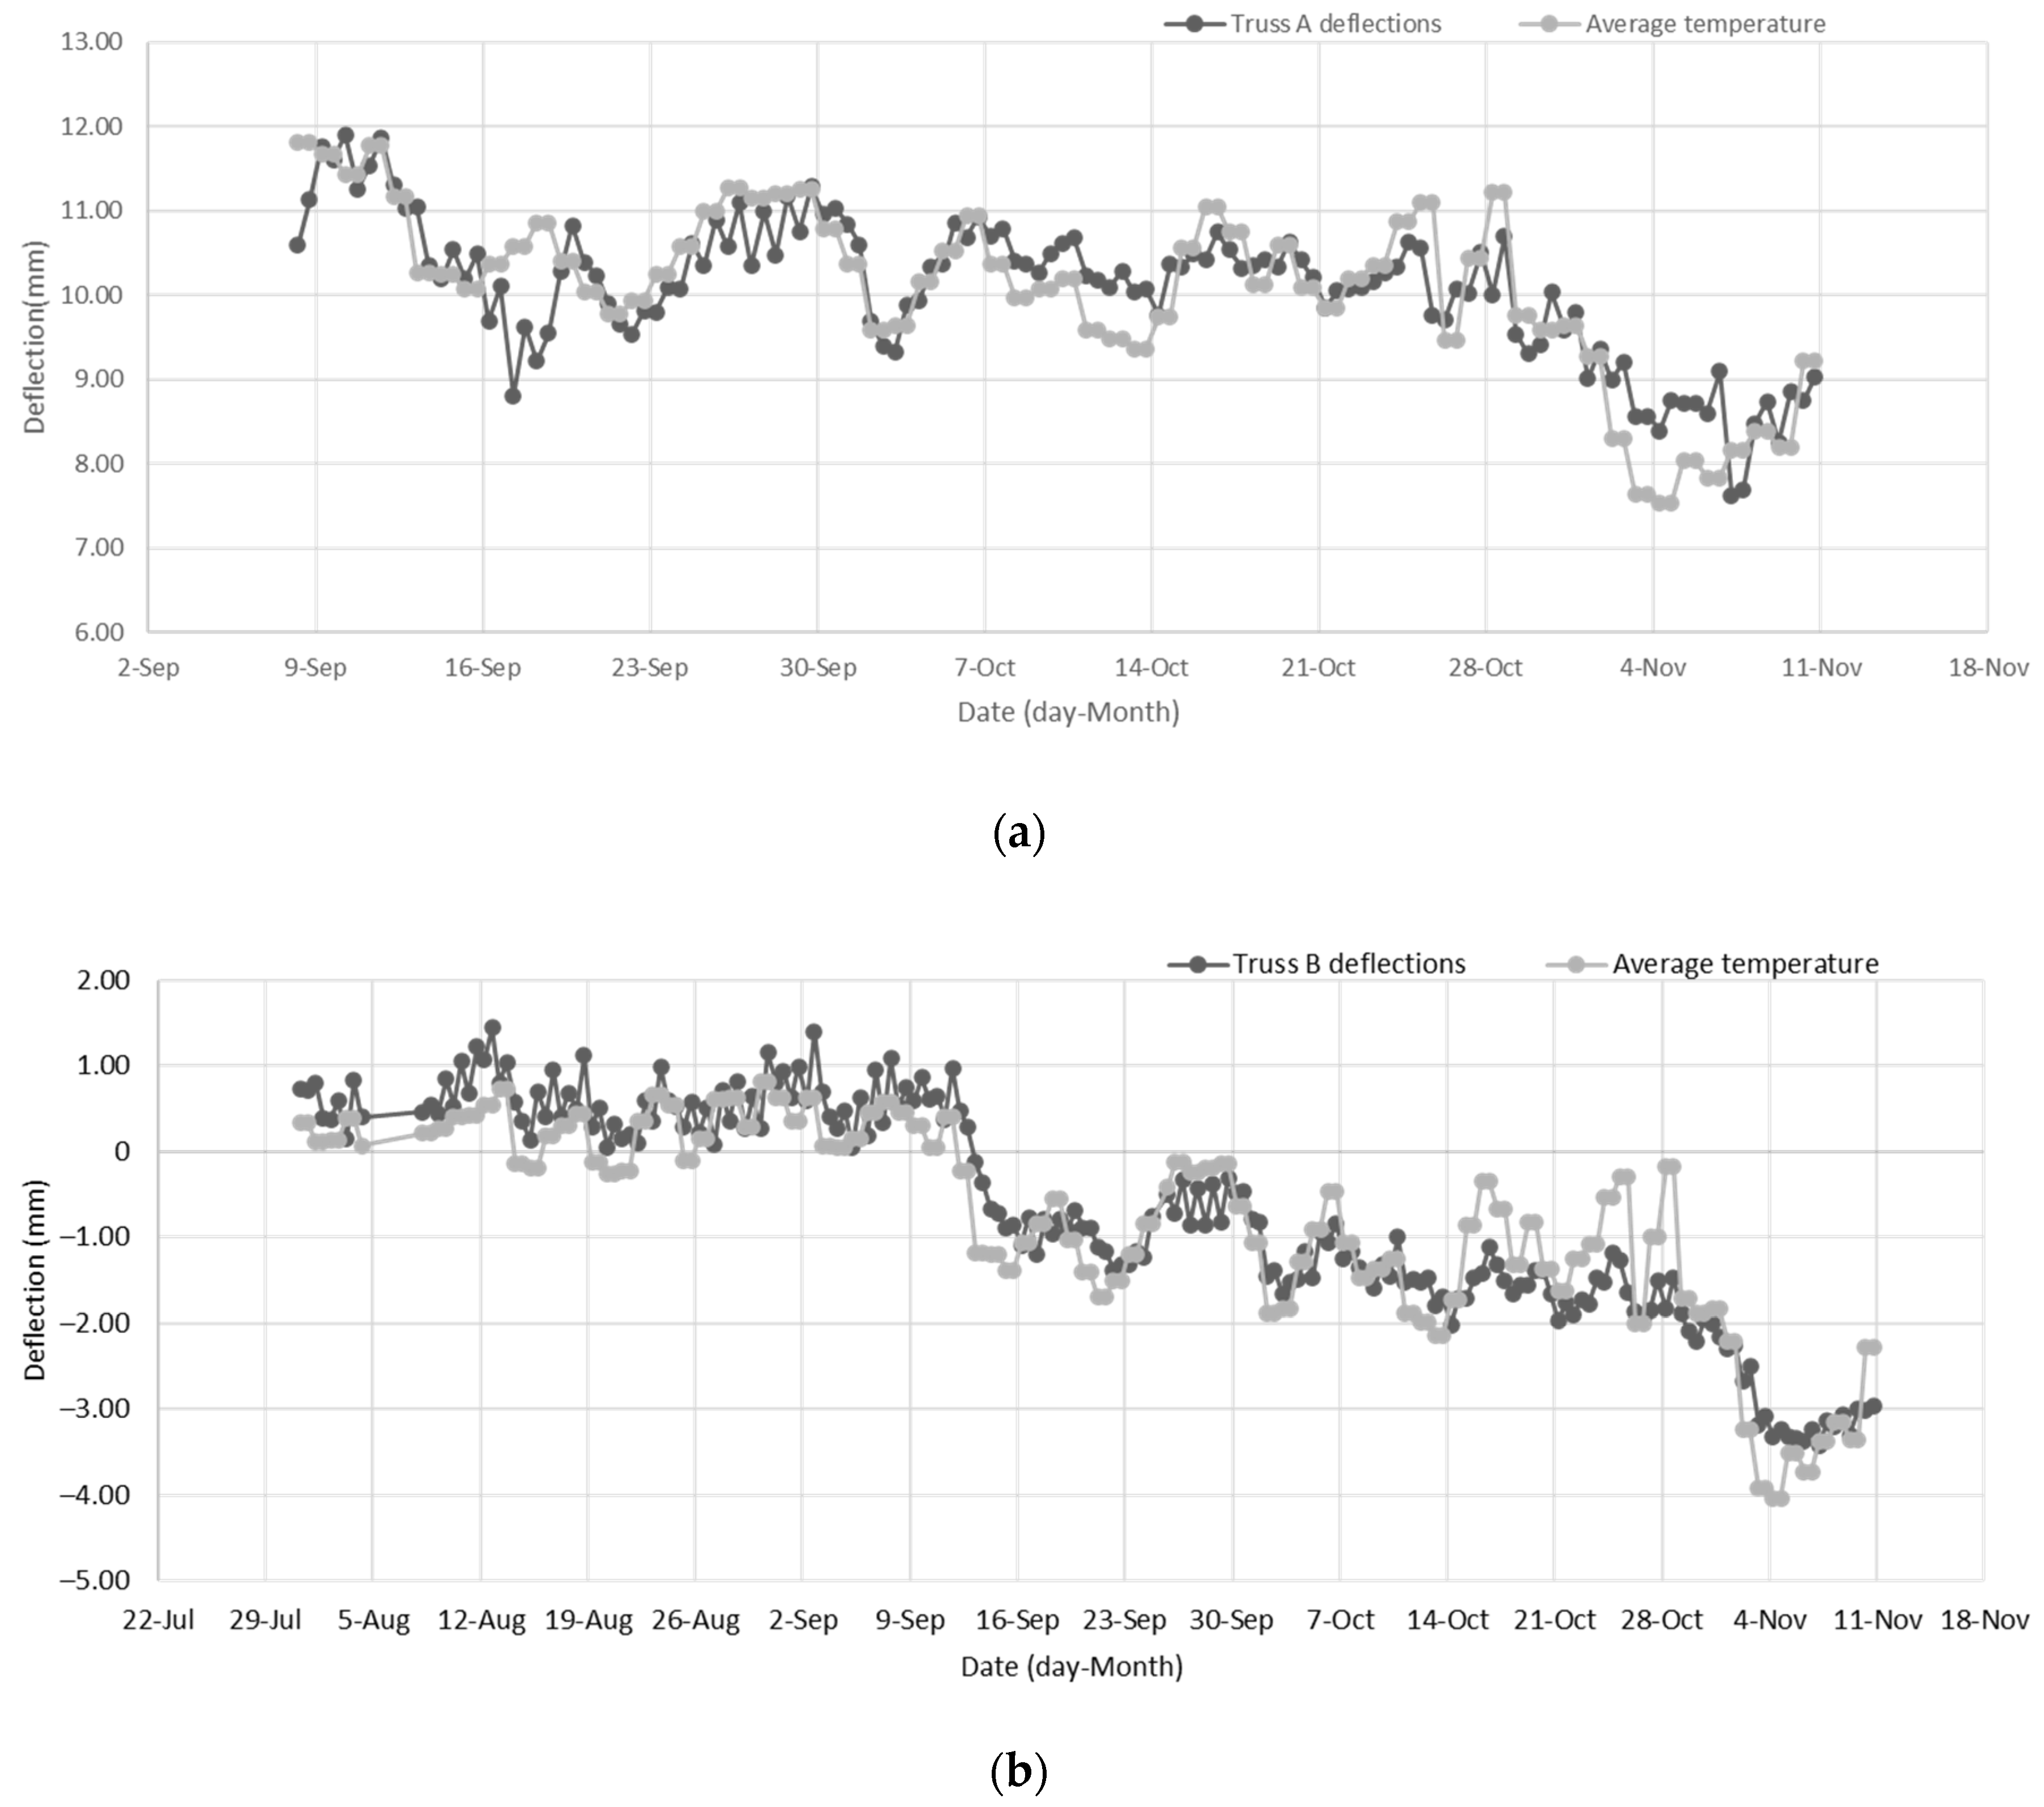
Figure 8 show a correlation coefficient of 0.92 for Truss B and 0.84 for Truss A, in regard to average temperature. This is a considerable value and could be visually observed in
Figure 9.
Figure 9 shows how closely the twice daily deflection observations were following the twice daily temperature variations.
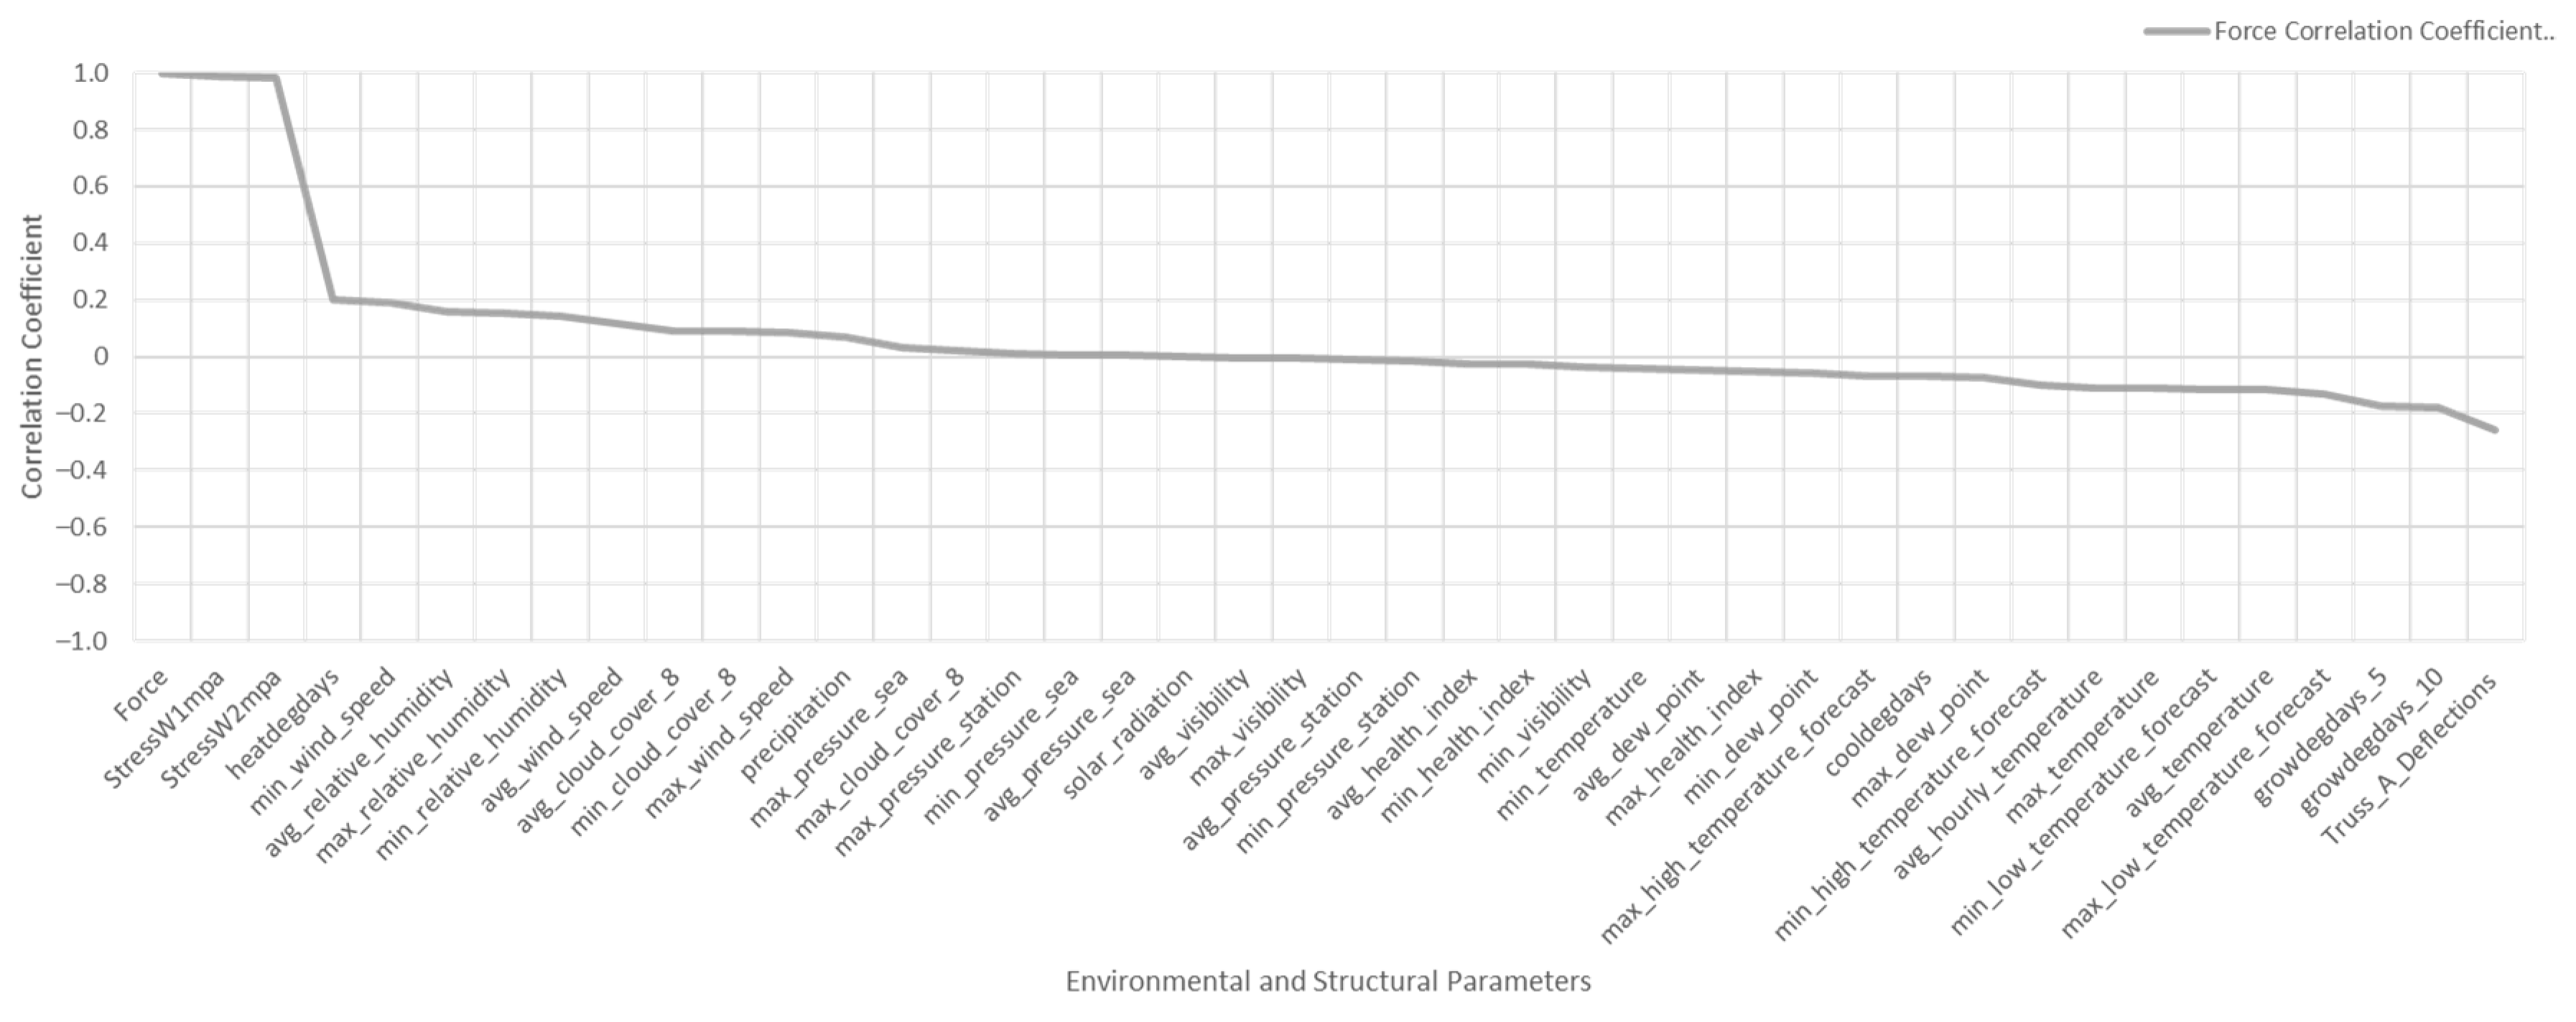
The internal forces, stresses, and strains were a much more complicated system than the deflections. The reason for this may lie in their highly localized behavior. So, the question was “does the same temperature variation-induced effects be visible on a strain gauge data, stresses, or the forces?” To analyze this hypothesis, the force values measured on the main I-beam from Truss A (the same beam that had the targets for Truss A) were compared against all the environmental parameters and the deflections.
Except for the stress values on the web and the force itself, all the other correlation coefficients show no connection. As it was expected, even the deflections values do not correlate with the measured forces. A simple explanation for this is that the forces inside a structure should follow an equilibrium, while the deflections are free from this equilibrium.
Figure 10 shows that none of the environmental factors or even the deflections were a dominant factor on the measured forces.
4. Conclusions
In this paper, a special case of DIC with retro-reflective targets was implemented to measure the deflections of the trusses of the Calgary Municipal Building during upgrading. The technique used, as is with many DIC solutions [
9,
15], came with a set of restrictive assumptions; the surface of the specimen needed to be flat; the camera’s optical axis was normal to it; and no out-of-plane translations or rotations existed. The proposed method was both fast and accurate enough to match the requirements of the task. The simplicity of the equations and the fast processing of the correlation coefficient template matching method facilitated the speed and efficiency of the process (i.e., image capture, image processing, and upload of the data to the cloud took under 10 s). The accuracy was 0.03 mm, with standard deviation of ±0.08 mm at a 15-m distance between the specimen and the camera. Also, the robustness of the solution was investigated by changing the light orientation and intensity; unexpectedly good results were observed through testing and, empirically, throughout the project. Based on the tests, only 6% of the data collected were in the range which suggested that deflections would provide a false alarm and that could not be detected as a blunder. Other blunders had been identified throughout the project using simple moving median filtering. These results made the solution a perfect match for the IIoT solution incorporated in the upgrade of the Calgary’s Municipal Building trusses.
The long-term deflection data, relatively free from the construction activities, are a rare dataset. After verifying the data through the aforementioned testing regiment, the variations observed in the deflections were representative of the structure’s natural behavior. So, against the variations in the environmental parameters, variations of the deflections were studied. The result was the dominance of the outside temperature on the deflections measured from both trusses. Interestingly, both trusses were completely housed inside the building and had no exposure to the external temperature variations. Calgary’s Municipal Building is an energy efficient temperature-controlled building all around the year. The deflections on the trusses, reflecting the behavior of the whole structure, were the result of the temperatures outside of the building; expansions and contractions matching the rise and fall of daily ambient temperatures.
Digital image correlation with retro-reflective targets can be used for monitoring in any harsh environment where light and dust are of concern. Real-world applications need a displacement-free location for the camera and could be used in construction projects, bridges, sensitive upgrading projects, mining, and tunnel construction. For instance, if the setup proposed in this paper was used for bridge deflection monitoring, the first 15 m of a bridge would be measured with a level of accuracy of 0.08 mm, while at 150 m, the level of accuracy would decline to 0.8 mm.
Multiple research opportunities and suggestions have come from this study. For instance, the further modeling of the temperature effect on the trusses would be beneficial as would understanding the underlying physical reasons as to why forces were not affected by the temperature while deflections were, and the difference between the level of accuracy of the prediction models used for the deflections versus the actual deflections measured.
The most immediate future work would be the parametrization of the DIC. Such a process would remove the restrictive assumptions regarding orthogonality of the cameras’ optical access in respect to the specimens’ surface and the introduction of out-of-plane rotations and translations. Furthermore, the vertical deflections’ external temperature effects have been mostly ignored in the design of high rises; however, modeling of such needs extensive research and case studies.
