Article

Using Machine Learning to Identify Educational Predictors of Career and Job Satisfaction in Adults with Disabilities

1
School of Data Science, University of Virginia, Charlottesville, VA 22903, USA
2
Department of Psychology, University of Virginia, Charlottesville, VA 22904, USA
*
Author to whom correspondence should be addressed.
Disabilities 2025, 5(2), 56; https://doi.org/10.3390/disabilities5020056
Submission received: 26 March 2025 / Revised: 16 May 2025 / Accepted: 4 June 2025 / Published: 10 June 2025

Abstract

Purpose: This study explored the potential long-term effects of academic-related variables, including academic satisfaction, college degree attainment, unmet academic accommodation needs, and demographic characteristics on the job and career satisfaction of adults with disabilities using modern machine learning techniques. Method: Participants (n = 409) completed an online survey assessing these constructs. All had a disability or chronic health condition, had attended school in the U.S. throughout their K-12 education, and were between 19 and 86 years of age. Results: The random forest models had 68.6% accuracy in correctly identifying job satisfaction and 72.5% accuracy in correctly identifying career satisfaction. When using mean decrease in impurity (MDI) and permutation importance to identify statistical predictors, academic satisfaction was the most important predictor of job satisfaction in both MDI and permutation importance, while unmet academic accommodations was the fourth highest predictor for MDI behind academic satisfaction, disability level, and age, but ahead of other demographic variables and college degree status, and the second highest predictor of job satisfaction in permutation importance. For career satisfaction, academic satisfaction accounted for the highest MDI, while unmet academic accommodations ranked fourth. For permutation importance, academic satisfaction ranked first, and unmet academic accommodations ranked fifth behind academic satisfaction, age, college degree status, and disability level. Discussion: Meeting the academic accommodation needs of disabled students is linked with lasting vocational success. This study underscores the associations between unmet academic accommodation needs and future job and career satisfaction, illuminated using novel machine learning techniques. To our knowledge, this is the first investigation of the potential long-term associations between unfulfilled accommodation needs and future job and career satisfaction.

1. Introduction

1.1. Workforce Disparities Among Disabled Adults in the U.S.

More than one in four adults (28.7%) in the U.S. experience some form of disability [1]. Individuals with disabilities are widely underrepresented in various societal domains, including the workforce. In 2024, 65.5% of non-disabled U.S. adults were employed, whereas only 22.7% of individuals with a disability were employed [2]. Individuals with disabilities also face a limited range of career options, disproportionately occupying service or labor-intensive roles, whereas their non-disabled counterparts are more likely to hold administrative or managerial positions [3]. These disparities reflect challenges for individuals with disabilities to achieve their full career potential, negatively impacting job and overall career satisfaction [4,5,6]. For example, after controlling for demographic and workplace characteristics, workers with disabilities had 49% lower odds of reporting high job satisfaction compared to non-disabled workers, highlighting the need for more in-depth research on the specific variables that influence job and career satisfaction among this population [7].

1.2. Sociodemographic Predictors

A range of sociodemographic characteristics predict job and career satisfaction among individuals with disabilities. While job and career satisfaction generally increase with age in the non-disabled population [8], previous studies have found varied associations among individuals with disabilities, with some linking older age to decreased job satisfaction [9] and others linking it to increased career satisfaction [10]. While rurality has little to no impact on overall job satisfaction levels, it has been shown to affect satisfaction with fiscal-related factors in the workforce such as benefits and job security [11]. Similar to findings in the non-disabled population, both women with disabilities and racial/ethnic minorities with disabilities often report lower job and career satisfaction compared to men and White individuals, respectively [12,13,14,15]. These disparities may arise from women and racial/ethnic minorities having less positive workplace experiences [16]. Similarly, existing studies show that transgender individuals with disabilities experience unique gender minority stressors affecting their overall career development, which may potentially reduce job and career satisfaction [17]. For both individuals with and without disabilities, higher academic competence and more formal education have been associated with greater job and career satisfaction [10,18,19].

1.3. Disability Level

An increased disability level has been shown to negatively impact overall life satisfaction [20,21,22]; however, it is unclear if these effects extend to job and career satisfaction. While research on the impact of disability level on job and career satisfaction is limited, studies indicate that a greater disability level is linked to higher perceptions of workplace discrimination, which may contribute to decreased job and career satisfaction [20]. One study examining career satisfaction among employed individuals with multiple sclerosis found that the only disability-related factor associated with career satisfaction was the duration of illness, while measures of disability level—such as cognitive impairment, self-perceived disability level, number of symptoms, and mobility limitations—were not significantly related [12].

1.4. Academic Satisfaction and Unmet Academic Accommodation Needs

Academic satisfaction is an important predictor of students’ well-being, showing associations with depression, anxiety, stress, overall life satisfaction, and even job and career satisfaction years later [23,24,25]. For non-disabled students, low academic satisfaction is linked to negative mental health outcomes, such as depression, anxiety, and stress [23]. Additionally, individuals who are highly satisfied with their college education are 4.56 times more likely to experience career satisfaction [26]. However, the relationship between academic and job/career satisfaction is still unclear among individuals with disabilities, who may require different types of support to be fully successful. Prior research indicates that students with disabilities thrive when they receive academic and psychological support in their educational environments [27,28]. Thus, students with disabilities who receive academic accommodations demonstrate higher levels of academic satisfaction compared to those who do not [29]. Similarly, individuals with disabilities who request workplace accommodations exhibit higher levels of both job performance and job satisfaction [30].

1.5. Purpose of the Current Study

The purpose of this study was to investigate the long-term impact of academic-related variables, such as academic satisfaction, college degree attainment, and unmet academic accommodation needs, on the job and career satisfaction of adults with disabilities above and beyond the potential effects of demographic characteristics and disability level. The random forest feature importance machine learning technique was employed for several reasons: (1) This method allows us to evaluate the predictive power of academic-related variables on job and career satisfaction in out-of-sample observations rather than conducting statistical inferences solely on training data. As a result, we gain valuable insight about whether these relationships generalize to new individuals. (2) The model includes built-in variable importance metrics that support this analysis. (3) This method is assumption free and allows us to capture both linear and nonlinear relationships—going beyond what traditional linear regression-based approaches can achieve. Employing this machine learning technique to assess how the early academic environment affects career and job satisfaction in disabled adults can help academic institutions create more inclusive academic settings, ultimately promoting increased career and job satisfaction later in life for adults with disabilities in the U.S.

2. Method

2.1. Participants

Participants (n = 409) had a disability or chronic health condition, had attended a school in the U.S. throughout their K-12 education, and were between 19 and 86 years of age. Participants completed a 30 min online survey with quality control checks after completing a brief screening survey. The survey was approved by the Institutional Review Board of the respective university. See Table 1 for the demographic data of the sample.

2.2. Procedure

The survey was administered as part of a larger project with variables beyond those presented in the current study in a two-fold procedure through the Prolific participant recruiting platform, which provides access to a large, national pool of individuals with disabilities. Firstly, because existing Prolific screening criteria do not account for individuals having a disability or chronic health conditions while attending K-12 school in the U.S., an initial sample (n = 970) completed a one-minute screening survey to establish their eligibility. The second part of the procedure entailed a 30 min survey on Qualtrics, which was disseminated to the eligible participants (n = 652). Participants had to be at least 18 years old and were provided with an information sheet containing a description of the purpose of this study. As compensation for participating in the study, participants received USD 6.14 in total, where USD 0.14 was received after completion of the initial screening procedure and the remaining USD 6 was given for the submission of the full survey. Responses were closed once 419 full responses had been received.
A single open-ended question was used at the end of the study as a validity check (“In one sentence or less, what did you think was the purpose of the survey?”). The survey contained quality control processes, such as asking the sample to verify their age at the start and end of their survey. Ten participants were removed from the survey, resulting in a finalized total of four-hundred and nine participants. Specifically, seven were removed for not passing the quality control checks and the remaining three were removed because they indicated that they did not have a disability or chronic health condition in the full survey, despite stating the opposite during the screening process.

2.3. Measures

2.3.1. Demographics

Demographic factors that were taken into consideration when answering the survey included age, gender, race/ethnicity, educational attainment, and urbanicity. To fit our machine models, we grouped participants by creating binary categories. We grouped gender into men vs. women or trans/nonbinary, race/ethnicity into White vs. another race, educational attainment into college degree attainment of any kind vs. not, and urbanicity into rural vs. suburban and urban.

2.3.2. Disability

We assessed disability status using the guidelines from the Centers for Disease Control and Prevention Disability Health Promotion website [31] in order to characterize the broad categories of participants’ disabilities (i.e., vs. asking participants to write in their specific disability or health condition and then the researchers having to collapse and recategorize terms). Participants answered questions based on six items for the assessment of impairment, including deaf or difficulty hearing; blind or serious difficulty seeing; difficulty concentrating, remembering, or making decisions; difficulty walking or climbing stairs; difficulty dressing or bathing; and difficulty completing errands alone such as visiting a doctor’s office or shopping. Accordingly, we utilized the modified Pain Disability Index [32] to assess disability level, a 10-point Likert scale featuring seven areas: family/home responsibilities, recreation, social activity, occupation, sexual behavior, self-care, and life-support activities.

2.3.3. Academic Satisfaction

We measured educational experiences through the Academic Satisfaction Scale [33], an 11-item scale that measures total satisfaction in academics within several categories, including coursework, educational quality, and career preparation. The latter two categories were changed to reflect the past and present tense to make the scale applicable and pertinent to both those who had completed their education and were currently in school. The individual item scores were summed to create a final score.

2.3.4. Accommodations Received

Accommodations received were assessed through the education accommodation questions from the 2022 version of the Canadian Survey on Disability [34]. The scale calculates the levels of accommodations needed and received by asking whether individuals (a) needed and (b) received specific accommodations from a list of common academic accommodations. The score is usually calculated by measuring the percentage of the total accommodations needed that were received by dividing the sum of received accommodations by the sum of needed accommodations. However, this can create a division by 0 for participants who received accommodations and do not need them. Therefore, we adjusted the measure by calculating the total, by subtracting the sum of received accommodations from the sum of needed accommodations, with a positive score indicating an unmet accommodation need. We reassigned individuals with a negative score to 0, stipulating no unmet accommodation need.

2.3.5. Job and Career Satisfaction

Two measures were utilized for job and career satisfaction: the Job Satisfaction of Persons with Disabilities Scale [35] and the Career Satisfaction Scale [36]. The Job Satisfaction of Persons with Disabilities Scale is a 14-item scale measured through a 5-point Likert-type scale, with the aim of measuring job satisfaction through tangible and intangible benefits for employees with disabilities. The Career Satisfaction Scale is a 12-item scale measured through a 5-point Likert-type scale assessing the level of satisfaction with respect to achieving multiple career goals. We utilized the sum of each scale to procure an overall Job and Career satisfaction level. Subsequently, we used a median split to divide participants who had scored a value of the median or below into a lower level of job or career satisfaction and those above the median into a higher level of job or career satisfaction.

2.4. Data Analysis

We used Python 3.11.5 to conduct all analyses. We calculated the descriptive statistics using the Python packages Pandas and Numpy. Models were used to predict binary job satisfaction (1 = above the median in job satisfaction, 0 = at or below the median in job satisfaction) and binary career satisfaction (1 = above the median in career satisfaction, 0 = at or below the median in career satisfaction). We utilized the Python package scikit-learn to train the random forest models we used in this study. Random forests are machine learning models that fit many decision trees based on a random selection of features (e.g., variables) from a bootstrapped sample of the training data. By fitting on a stochastic selection of features and observations, the model reduces overfitting. Decision trees divide feature values from the training data into segments, guiding the model to accurately classify each observation. We used an 80/20 train/test split for building our random forests, which is common practice and allowed us to assess feature importance, or the relative value of each feature for correctly classifying observations, for both training and testing prediction. We found that the default parameters for random forests in scikit-learn were optimal for this analysis. Overfitting can be a concern in random forests. The default parameters combat this in several ways: (1) The model fits 100 trees and averages the predictions from each tree. Generally, a higher number of trees prevents the model from being too sensitive to each training set. (2) Each tree only considers the square root of the number of features, or 3 in this case, at each split. This reduces correlation between trees and promotes diversity. (3) Bootstrapping a sample to fit each tree introduces variance within trees and improves generalization. To show model performance on out-of-sample data, we report the accuracy on the test set.
We used two measures of feature importance in predicting job and career satisfaction: mean decrease in impurity (MDI) and permutation importance. MDI compares the loss value between trees that use and do not use the feature of interest, and then sums the decrease in training loss associated with the given feature across all trees in the forest [37]. Because of limitations inherent in any single measure of feature importance, both MDI and permutation importance were used. For example, MDI is only assessed on the training set, which does not fully capture the usefulness of each feature for predicting unseen observations. MDI is biased toward high cardinality features [38], or features with many possible values, such as age or disability level. Conversely, permutation importance is only based on the test set and is less biased toward high cardinality features [39,40,41]. Permutation importance measures the average decrease (or increase) in accuracy on the test set when we randomly change, or permute, the values of the feature of interest [37]. Both measures of feature importance use higher values to indicate more importance but do not imply the direction of a relationship between a feature and the outcome of interest. Permutation importance can be positive or negative, where a negative value indicates that the model is more accurate without including that feature. Both feature importance measures used in this study do not use measures of statistical significance, but instead rely on the comparison of different importance scores of features across the model. Because of the lack of directionality inference in a random forest, an overall bivariate correlation matrix between participant characteristics and outcome variables was run first along with descriptive statistics.

3. Results

3.1. Descriptive Statistics

Table 1 shows the average Academic Satisfaction Scale score in our study, the proportion of participants who had received a college degree, and the proportion who had had unmet academic accommodations. There was a large amount of variability in participants’ satisfaction with their academic experience, but moderate satisfaction on average. Table 2 shows the bivariate correlations among the predictor variables and the outcome variables (asterisks reflect p < 0.050). Table 3 shows the data summary based on the median split classification of job and career satisfaction along with the predictive accuracy, precision, recall, F1 scores, and area under the curve achieved by the random forest model on the test set. As seen in this table, the random forest models for both job and career satisfaction had much higher levels of predictive accuracy than would be expected by a chance guess based on the median split classification. Random forests often fit the training data perfectly, as was the case with both of our models in this study. Due to our ability to predict job and career satisfaction being far better than random chance in training and test sets, we can accurately study the feature importance of our explanatory variables.

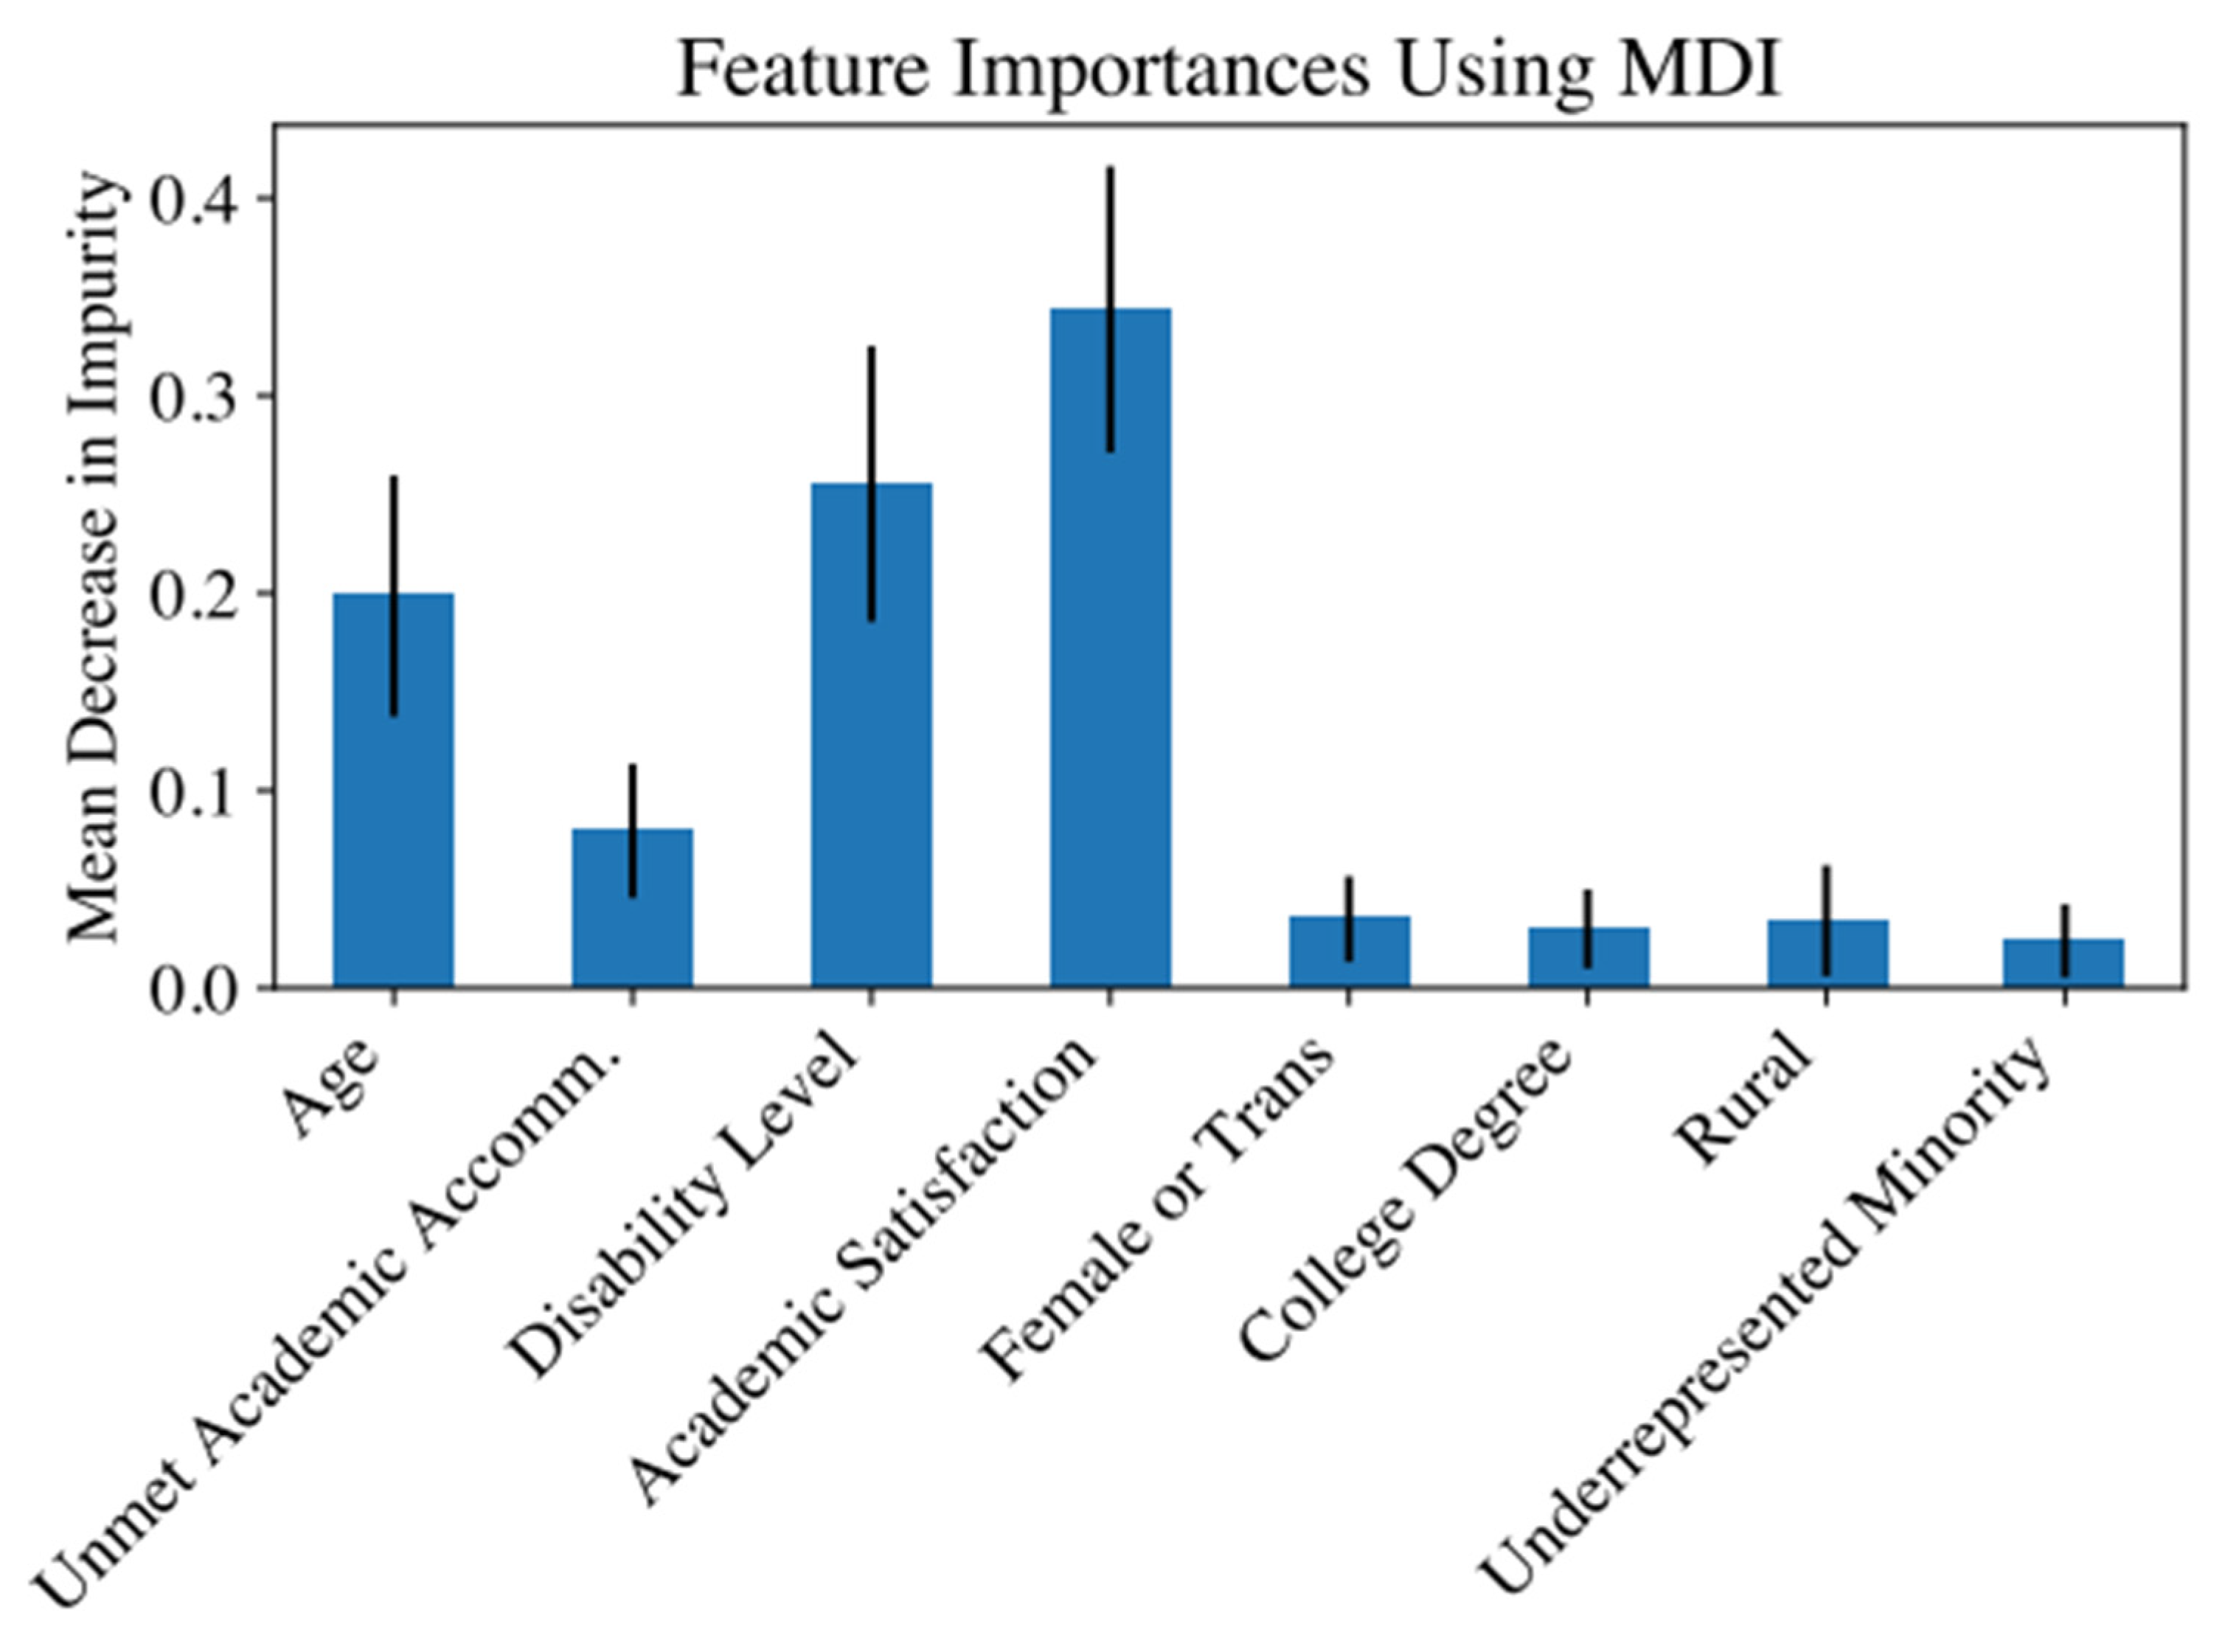
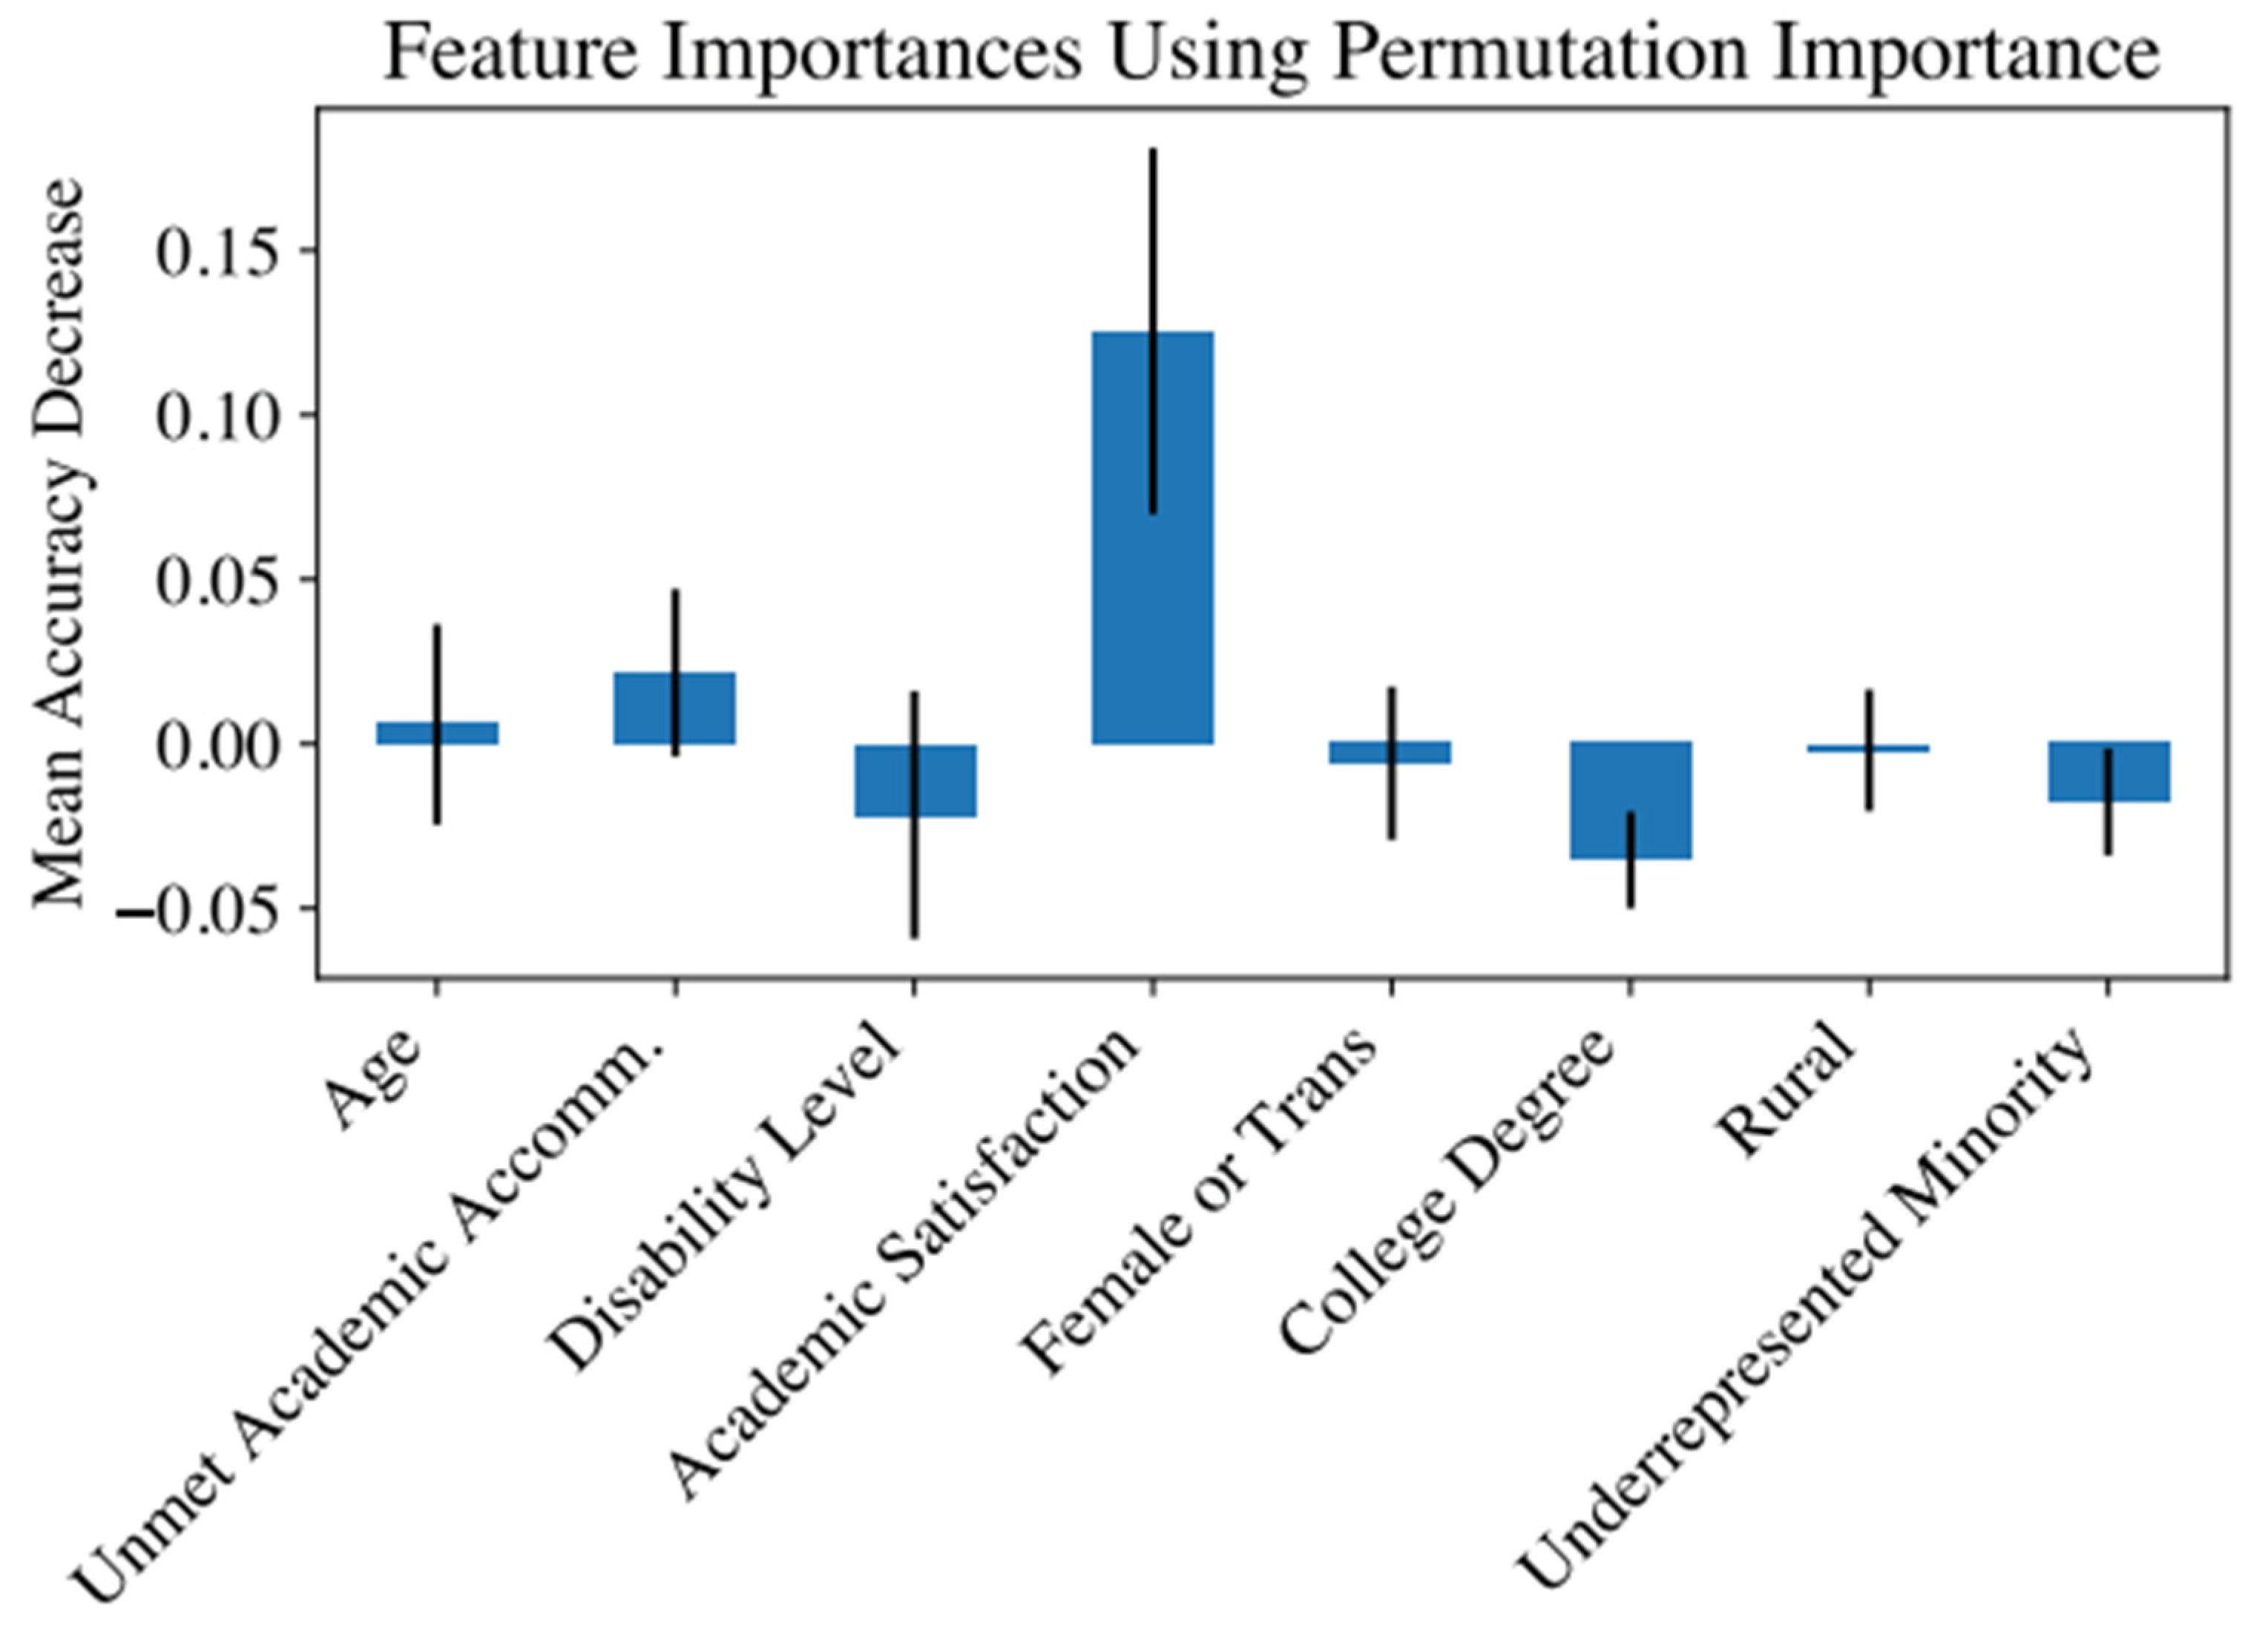
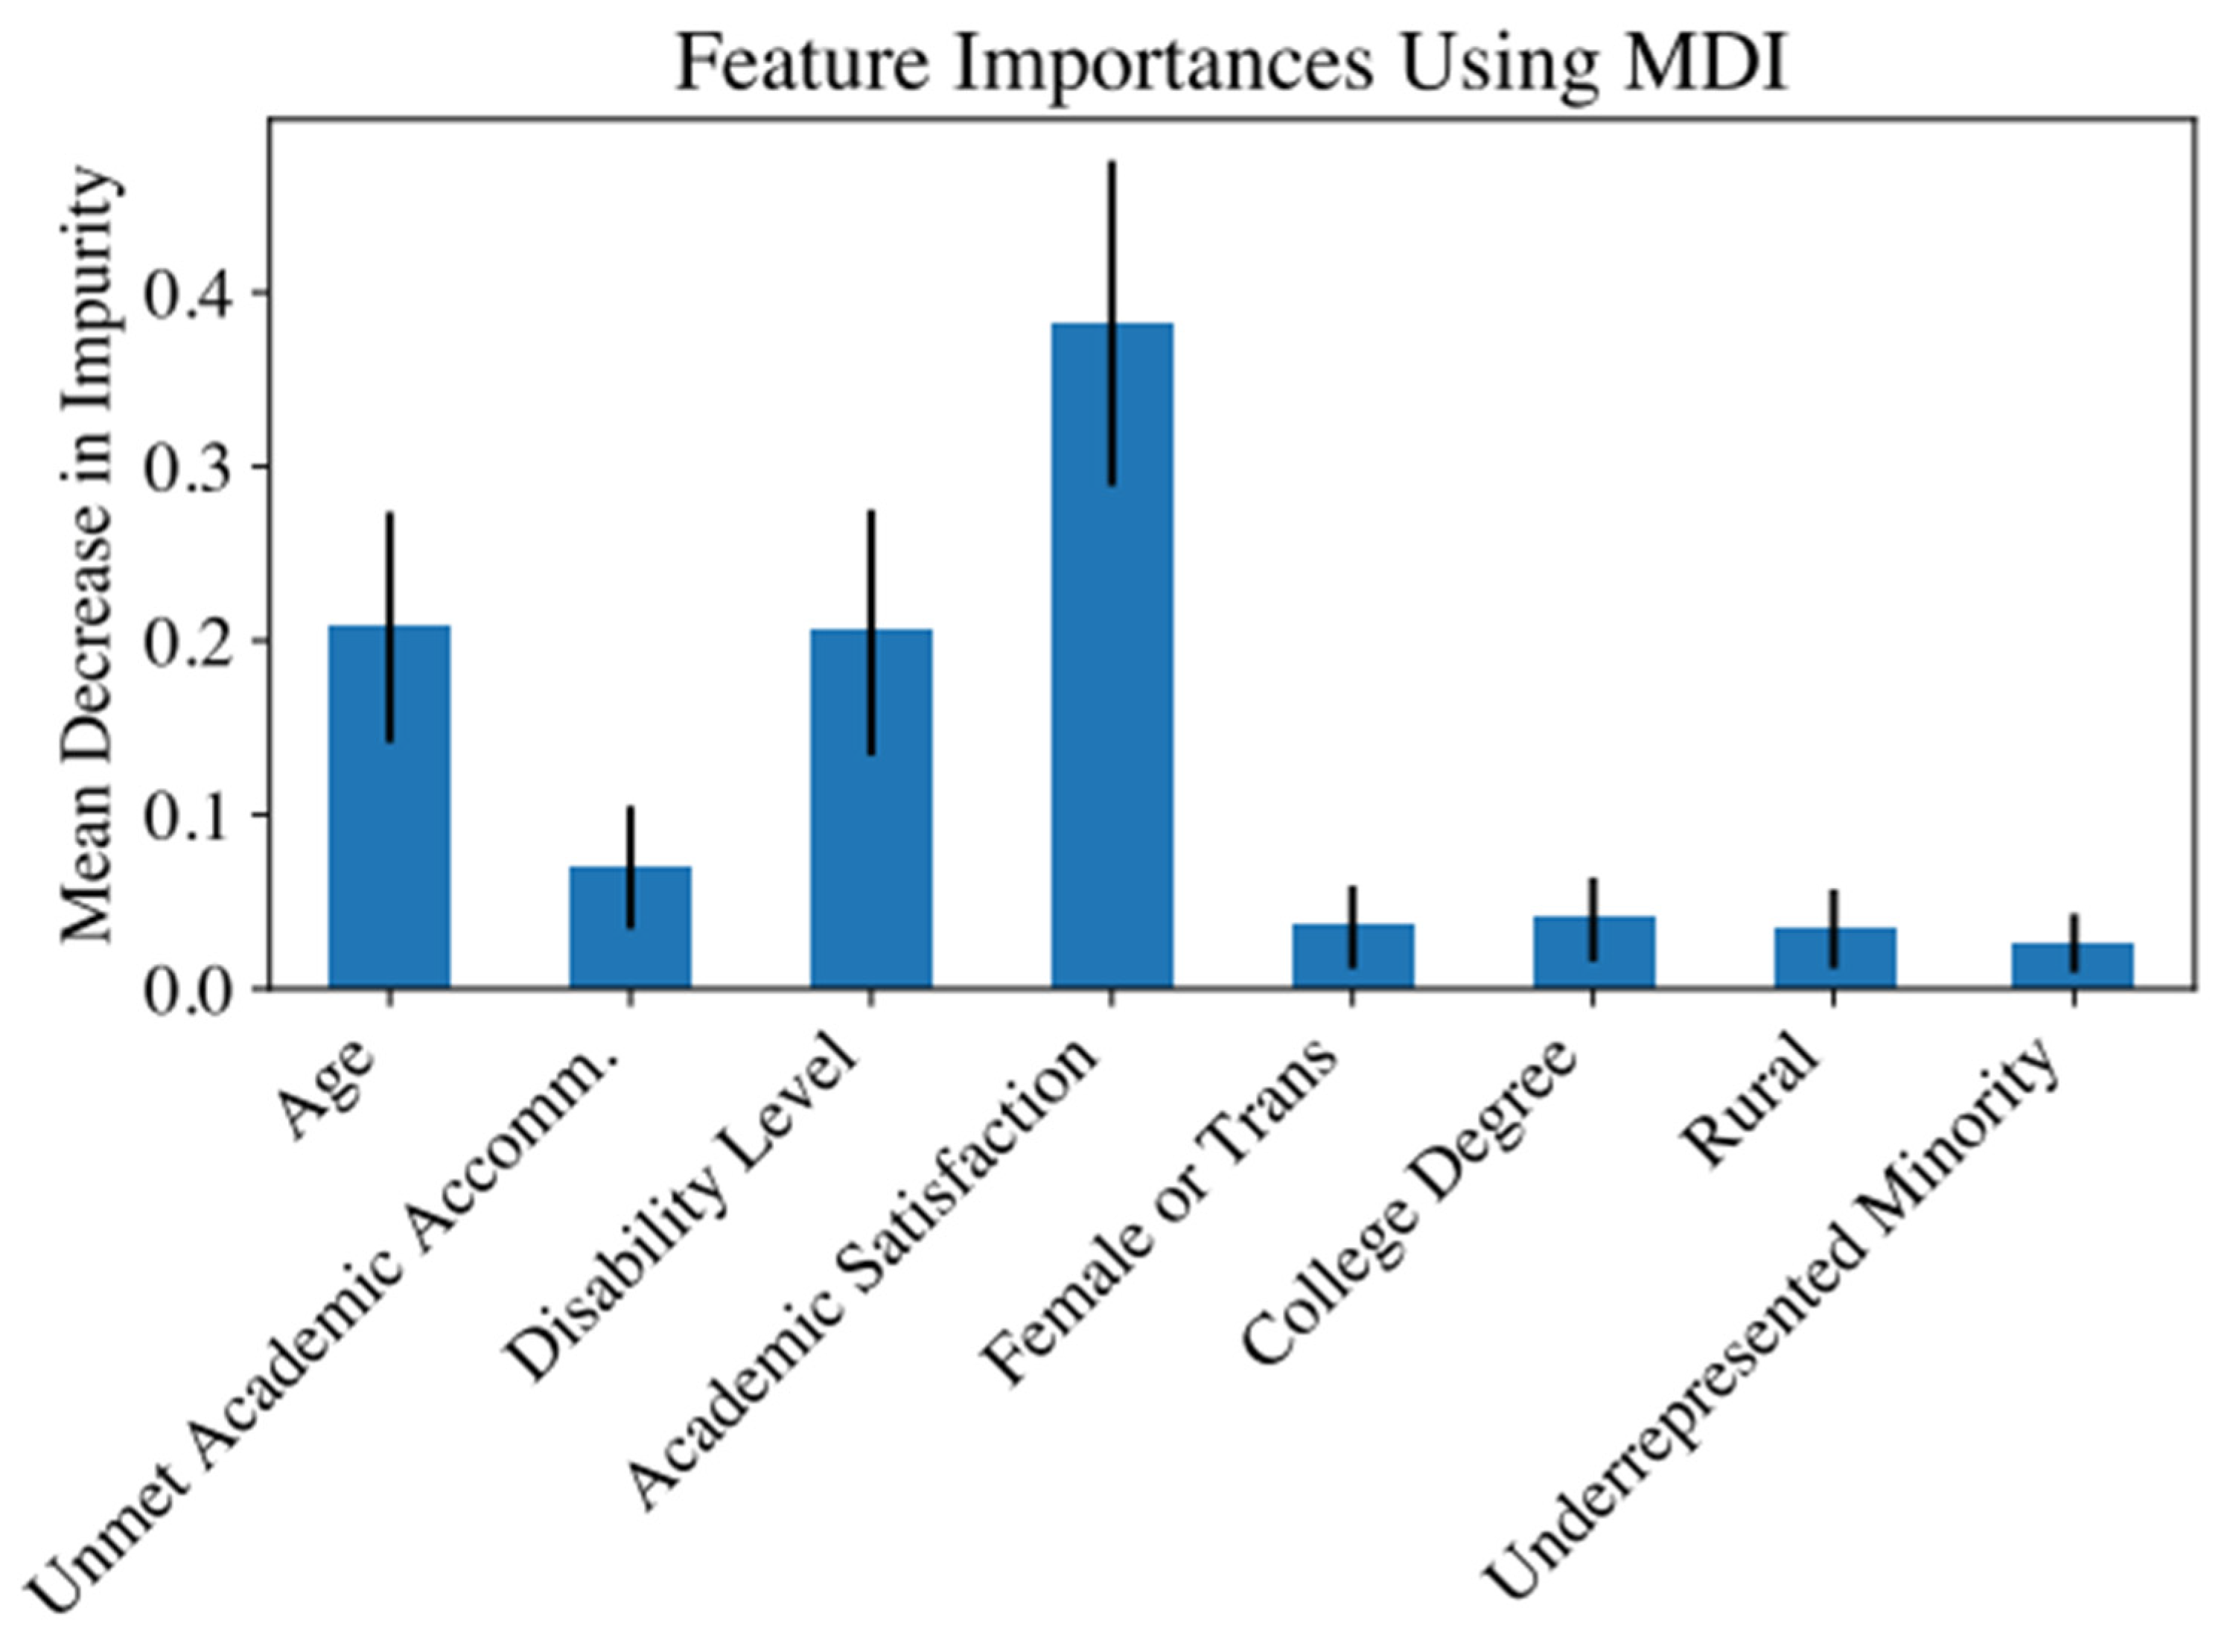
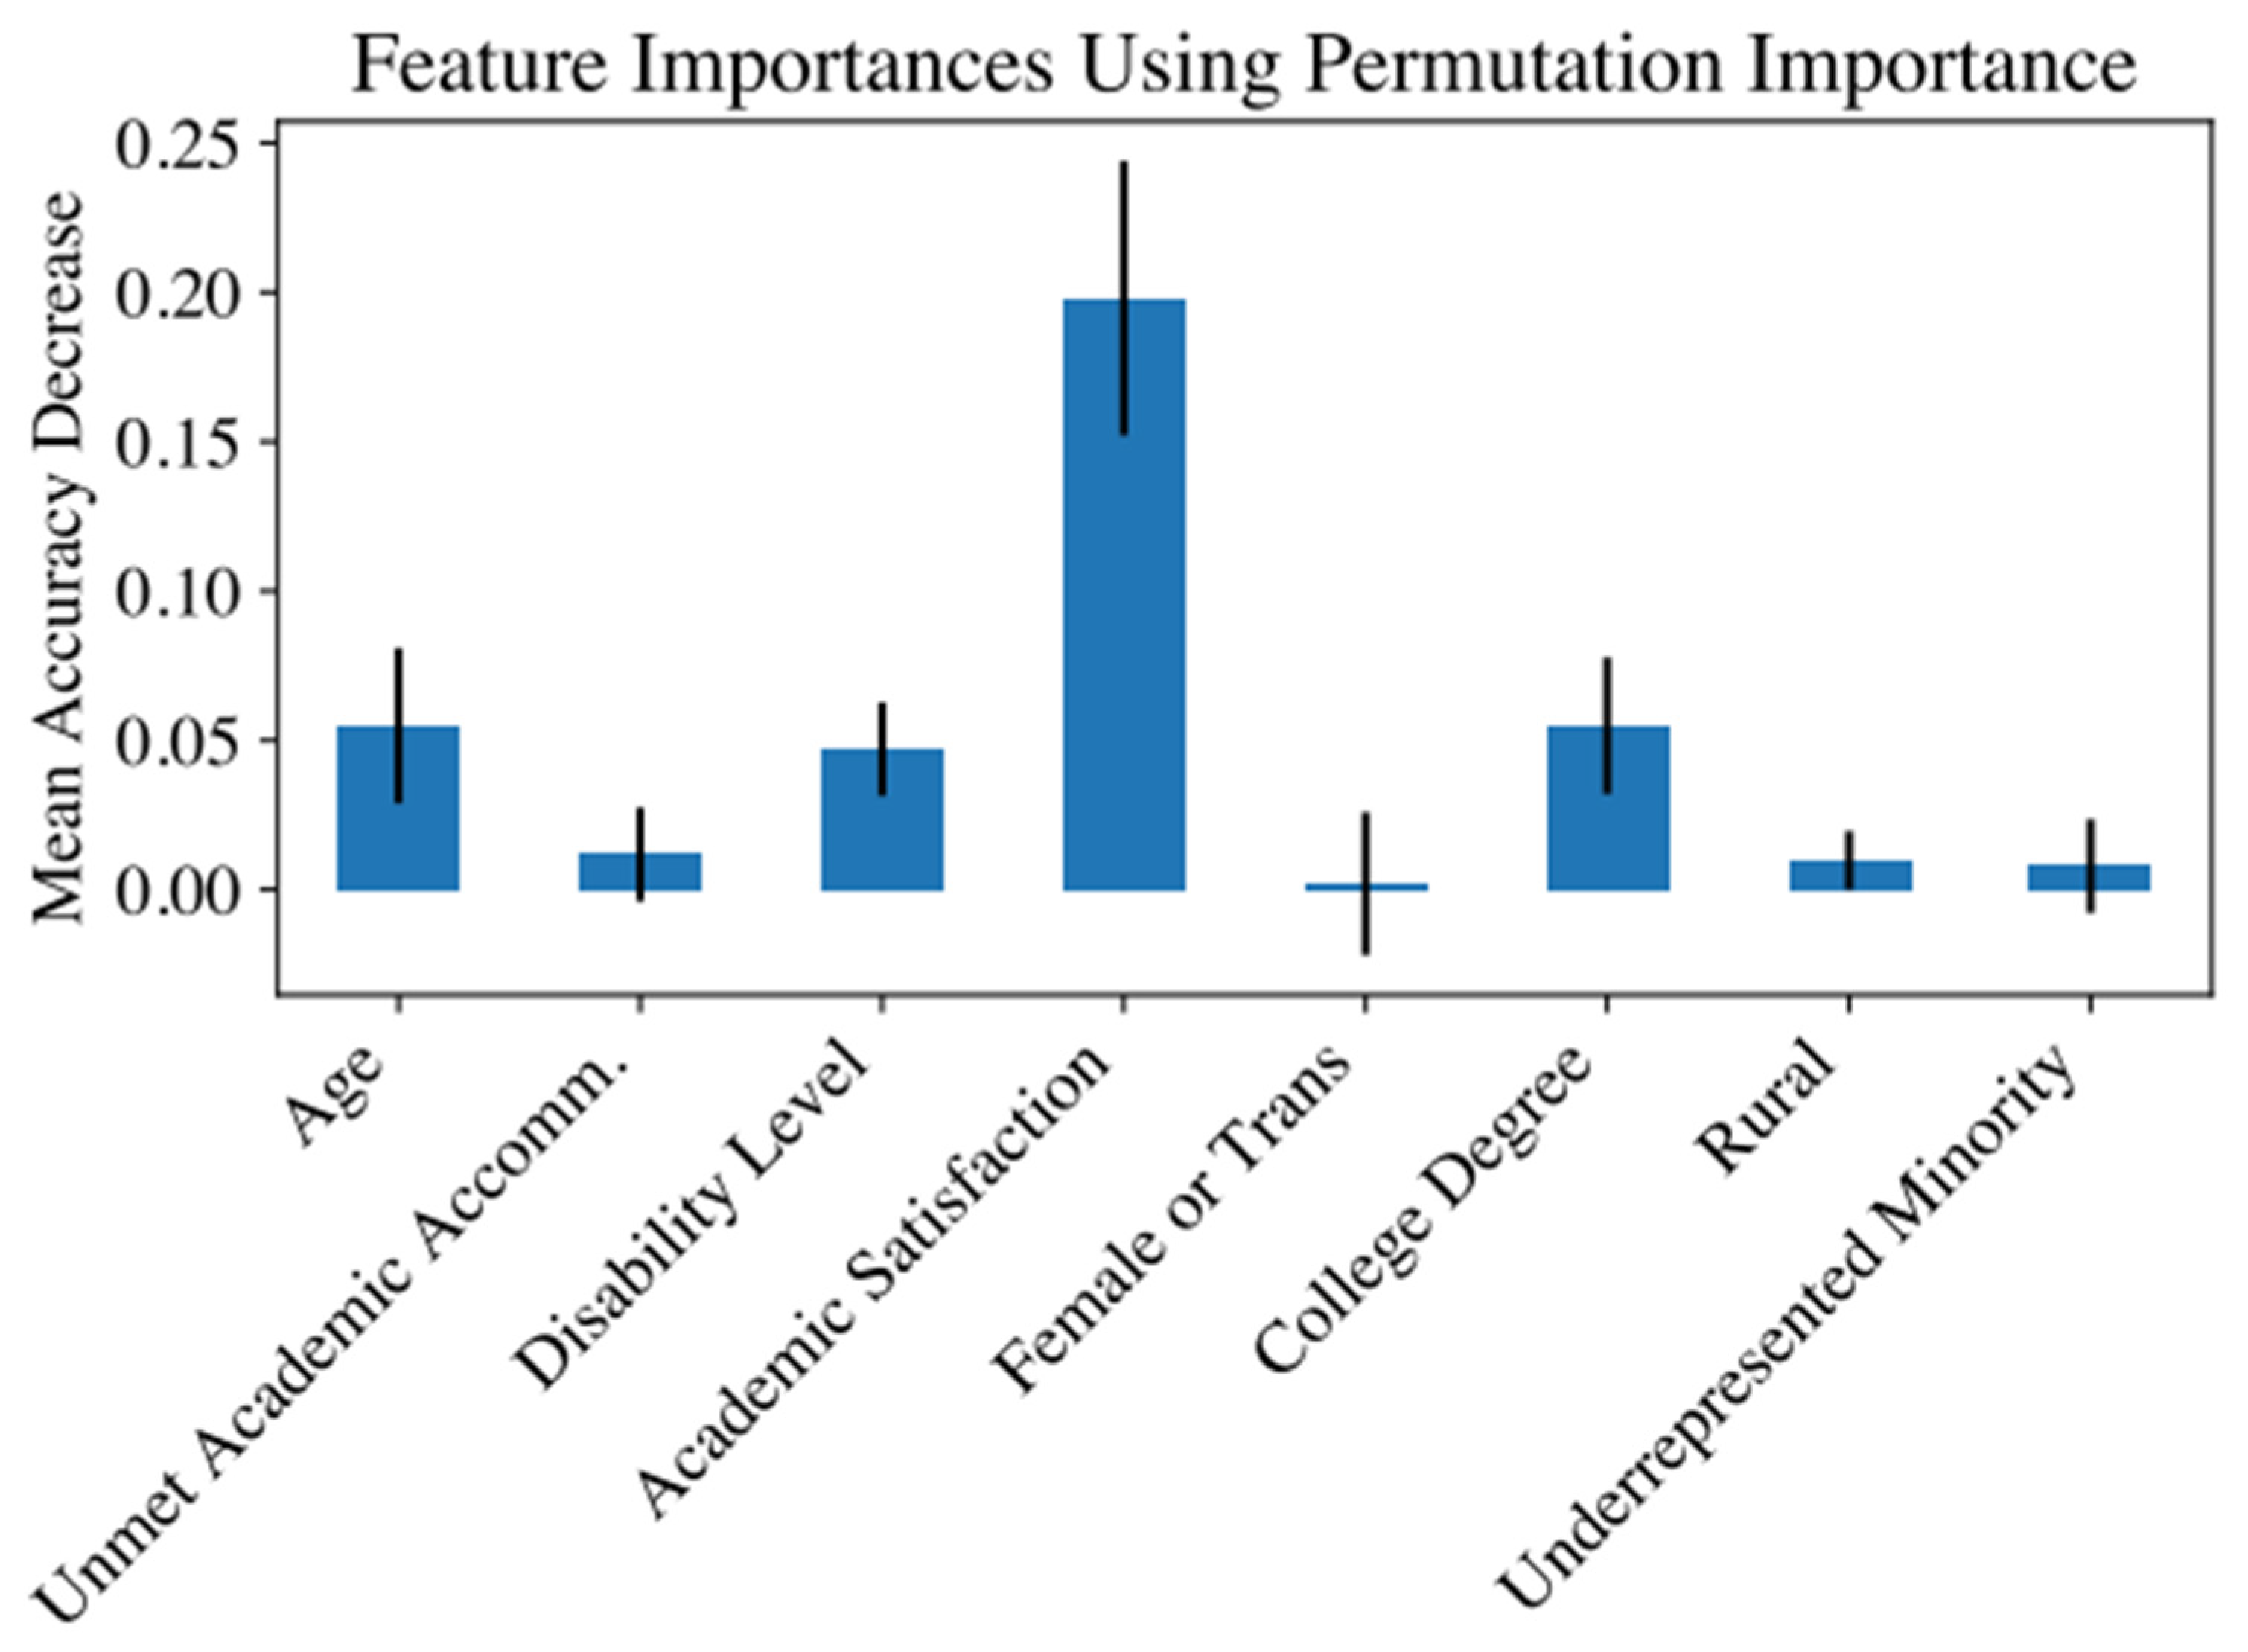
3.2. Random Forest Feature Importance

3.2.1. Job Satisfaction

Figure 1 and Figure 2 display the MDI and permutation importance for each feature (error bars represent one standard deviation in the sampling distribution), as calculated using our random forest model, to predict job satisfaction. Figure 1 shows that academic satisfaction had the highest MDI and unmet academic accommodations accounted for the fourth highest MDI, behind academic satisfaction, disability level, and age. Still, though, it was ahead of other demographic factors (gender, underrepresented minority status, urbanicity, and college degree status). Figure 2 shows that, through permutation importance, academic satisfaction and unmet academic accommodations ranked first and second, respectively. Age, disability level, gender, college degree status, urbanicity, and underrepresented minority status corresponded to either small or negative values, indicating that these features did not have a clear relationship with job satisfaction in disabled people. In both measures of feature importance, academic satisfaction and unmet academic accommodation were important for job satisfaction. Academic satisfaction was the most important predictor of job satisfaction using both metrics of importance.

3.2.2. Career Satisfaction

Figure 3 and Figure 4 depict the MDI and permutation importance, which we calculated based on the random forest model used to predict career satisfaction. Figure 3 shows that academic satisfaction accounted for the highest MDI, and unmet academic accommodations once again ranked fourth in MDI, behind academic satisfaction, disability level, and age. Unmet academic accommodations also ranked higher in MDI when compared to demographic factors (gender, underrepresented minority status, urbanicity, and college degree status). In terms of permutation importance, Figure 4 shows that academic satisfaction ranked first, and unmet academic accommodations ranked fifth, behind academic satisfaction, age, college degree status, and disability level. Permutation importance for underrepresented minority status, urbanicity, and gender were all quite small. In MDI, feature importance for unmet academic need was noticeable, but small for permutation importance. Academic satisfaction was the most important predictor in both measures of feature importance.

4. Discussion

This study explored the potential long-term associations among academic-related variables, including academic satisfaction, college degree attainment, unmet academic accommodation needs, and demographic characteristics, with the job and career satisfaction of adults with disabilities using machine learning techniques. There was large variability in participants’ satisfaction with their academic experience, with an average of moderate academic satisfaction. The machine learning approaches had a 68.6% accuracy in correctly identifying job satisfaction and a 72.5% accuracy in correctly identifying career satisfaction. Academic satisfaction was the most important statistical predictor of job satisfaction in both MDI and permutation importance, while unmet academic accommodations was the fourth highest statistical predictor for MDI behind academic satisfaction, disability level, and age, but ahead of other demographic variables and college degree status, and the second highest statistical predictor of job satisfaction in permutation importance. Demographic variables and college degree status were not important features of job satisfaction using permutation importance. For career satisfaction, academic satisfaction accounted for the highest MDI, while unmet academic accommodations ranked fourth behind the same variables as above. For permutation importance, academic satisfaction ranked first and unmet academic accommodations ranked fifth behind academic satisfaction, age, college degree status, and disability level.

4.1. Academic Satisfaction

Academic satisfaction was the most important statistical predictor of both job and career satisfaction: participants who reported higher levels of academic satisfaction had more job and career satisfaction. This is consistent with a study of a small sample of adults with a language disorder that found higher academic satisfaction was associated with higher occupational outcomes including job satisfaction [42]. Although few studies have looked at the association between academic and career or job satisfaction among disabled individuals, a higher level of education is associated with increased job and career satisfaction among individuals with multiple sclerosis and spinal cord injury; higher levels of education could be an indicator of academic satisfaction [10]. Further, in a study of disabled workers, inclusive education, extensive and early vocational education, and continuing post-secondary education (all markers that could indicate academic satisfaction) were associated with high levels of satisfaction with work environments and tasks [43].

4.2. Disability Level

Disability level was the second most important statistical predictor of job and career satisfaction in MDI and the fourth most important statistical predictor of career satisfaction in permutation importance. Disability level was negatively correlated with both job and career satisfaction in bivariate analyses. These findings are consistent with a study of workers with physical disabilities that found those with a higher disability level had lower job satisfaction [44]. Among those with acquired disability, the disability level had a negative relationship with vocational self-efficacies, a potential marker of job and career satisfaction [45]. One potential mediator of the negative relationship between disability level and job or career satisfaction may be workplace discrimination, as workers with disabilities who experience workplace discrimination have lower levels of job satisfaction [20].

4.3. Age

Age was the third most important statistical predictor of job and career satisfaction in all four models, with older participants experiencing higher levels of job and career satisfaction. This is consistent with a study that found that older workers with disabilities had greater satisfaction in job characteristics (such as wages, tenure, and private sector work) compared to non-disabled workers [9]. Similarly, a study that found older workers with multiple sclerosis or spinal cord injury had higher career satisfaction compared to younger workers [10]. However, in a study of 8345 disabled people, older age was linked to lower job satisfaction [46], indicating a perhaps more complicated relationship that necessitates future research.

4.4. Unmet Accommodation Needs

Unmet academic accommodation needs ranked between second and fifth in importance for job and career satisfaction, with participants who had not had their accommodation needs met while in school experiencing lower levels of job and career satisfaction. This is consistent with findings that disabled individuals who receive academic accommodations experience higher levels of academic satisfaction [29], and that those who request workplace accommodations have higher levels of job performance and job satisfaction [30]. In a sample of workers with learning disabilities, those who had requested and received workplace accommodations had higher employment satisfaction [47]. The successful use of university disability services may result in accommodations to assist in both academic and employment success, even if needed accommodations differ [48].

4.5. College Degree Status

College degree status was only an important statistical predictor of career satisfaction using permutation importance, with those with a college degree having higher career satisfaction. Consistent with these findings, a study of graduates with learning disabilities found high employment satisfaction, hypothesized to be due to employment self-efficacy [47]. Furthermore, having a college degree is associated with large increases in annual earnings among individuals with various disabilities [49]. Other research has found that among individuals with multiple sclerosis and spinal cord injury, those who had higher levels of educational attainment also experienced higher levels of career satisfaction [10].

4.6. Educational Implications for Students with Disabilities

Considering that unmet educational needs robustly predicted future career and job satisfaction, even many years later, schools and educators should work to provide disabled students with sufficient accommodations to support their future occupational success. Although the Individuals with Disabilities Education Act (IDEA) ensures an appropriate and free public education and Section 504 of the Rehabilitation Act provides protections for disabled students [50,51], the criterion of appropriate accommodation currently used in schools may not be setting disabled students up for future job and career success. Therefore, across the developmental span from elementary school to college/university, schools should strive to ensure their disabled students’ accommodation needs are met. In 2024, only 22.7% of disabled people were employed, whereas the employment population ratio for those without a disability was 65.5% [2] (Bureau of Labor Statistics, 2024). This broad discrepancy in employment rates highlights the need for interventions to narrow this gap. Given the importance of unmet accommodation needs for future job and career satisfaction shown in this study, providing adequate accommodations throughout disabled students’ educational journeys could generate large dividends to both the vocational achievement of disabled people and the U.S. economy overall.

4.7. Limitations and Future Directions

There are several limitations to this study. First, we do not know the specific disabilities participants had beyond the categories listed in Table 1, using the CDC disability categories. Future studies might ask about specific disabilities or chronic health conditions to allow comparisons based on disability types. Second, the present study did not obtain data on the exact timing of the unmet accommodation (e.g., elementary school, middle school, high school, college). Therefore, we could not explore whether the timing of unmet academic accommodations disparately impacted future job and career satisfaction. Future research should compare the impact of unmet academic accommodations across educational development periods. Third, participants were recruited through Prolific and completed the survey on a first come, first serve basis. We recognize that this is a convenience sample and may limit generalizability to individuals with disabilities who do not regularly complete surveys for compensation. Table 1 shows that the sample was predominantly well-educated, female, White, urban/suburban, well-educated, and not representative of the overall presence of different disability categories. Future studies should consider larger and more diverse samples, which may help with generalizability. Additionally, this would prevent the need to oversimplify dummy codes, which was needed in the current study to accommodate extremely small subsamples (e.g., White vs. another race, etc.). Fourth, given the retrospective-reporting design of the study, the current job and career satisfaction of participants may have influenced their perspectives on their childhood or academic experiences. Future longitudinal studies could explore the possible influences of unmet accommodation needs on career and job satisfaction using cross-logged panel designs to infer causality. Fifth, because our models used quantitative machine learning approaches, we had to have a numerical index as a predictor of the degree to which academic accommodation needs were unmet. Future research would benefit from delving into the specific types of accommodation needs that were unmet and how those specific types might be associated with job and career satisfaction. Finally, although variables such as workplace accommodations, employment sector, and job characteristics are known to influence job satisfaction, these were not included in the original survey instrument and were therefore unavailable for analysis. This highlights an opportunity for future research to explore the predictive capabilities of these additional factors.

5. Conclusions

Notwithstanding these limitations, this study underscores the associations between unmet academic accommodation needs and future job and career satisfaction, illuminated using novel machine learning techniques. To our knowledge, this is the first investigation of the potential long-term associations between unfulfilled accommodation needs and future job and career satisfaction. Our research indicates that there is a potential relationship between meeting the academic accommodation needs of disabled students and lasting vocational success, emphasizing the importance of continued research and support in this area.

Author Contributions

Conceptualization, B.R.C., P.B.P. and B.L.; methodology, B.L., B.R.C. and P.B.P.; formal analysis, B.L.; investigation, B.R.C., P.B.P. and B.L.; data curation, B.R.C.; writing—original draft preparation, B.L., B.R.C., B.E., O.C. and R.P.; writing—review and editing, B.L. and P.B.P.; visualization, B.L.; supervision, P.B.P.; project administration, B.R.C. All authors have read and agreed to the published version of the manuscript.

Funding

This research received no external funding.

Institutional Review Board Statement

This study was conducted in accordance with the Declaration of Helsinki and approved by the Institutional Review Board of the University of Virginia (protocol code 5640, date of approval: 26 June 2023).

Informed Consent Statement

Informed consent was obtained from all subjects involved in the study.

Data Availability Statement

Due to privacy issues, data are available from the corresponding author upon request.

Conflicts of Interest

The authors declare no conflicts of interest.

References

  1. CDC Disability Impacts All of Us Infographic|CDC. Available online: https://www.cdc.gov/disability-and-health/media/pdfs/disability-impacts-all-of-us-infographic.pdf (accessed on 7 June 2025).
  2. U.S. Bureau of Labor Statistics. Persons with a Disability: Labor Force Characteristics—2024; U.S. Bureau of Labor Statistics: Washington, DC, USA, 2024.
  3. McDaniels, B. Disproportionate Opportunities: Fostering Vocational Choice for Individuals with Intellectual Disabilities. J. Vocat. Rehabil. 2016, 45, 19–25. [Google Scholar] [CrossRef]
  4. Schur, L.; Han, K.; Kim, A.; Ameri, M.; Blanck, P.; Kruse, D. Disability at Work: A Look Back and Forward. J. Occup. Rehabil. 2017, 27, 482–497. [Google Scholar] [CrossRef] [PubMed]
  5. Kulkarni, M.; Gopakumar, K.V. Career Management Strategies of People with Disabilities. Hum. Resour. Manag. 2014, 53, 445–466. [Google Scholar] [CrossRef]
  6. Villanueva-Flores, M.; Valle, R.; Bornay-Barrachina, M. Perceptions of Discrimination and Distributive Injustice among People with Physical Disabilities: In Jobs, Compensation and Career Development. Pers. Rev. 2017, 46, 680–698. [Google Scholar] [CrossRef]
  7. Brooks, J.D. Just a Little Respect: Differences in Job Satisfaction Among Individuals with and Without Disabilities. Soc. Sci. Q. 2019, 100, 379–388. [Google Scholar] [CrossRef]
  8. Dobrow, S.R.; Ganzach, Y.; Liu, Y. Time and Job Satisfaction: A Longitudinal Study of the Differential Roles of Age and Tenure. J. Manag. 2018, 44, 2558–2579. [Google Scholar] [CrossRef]
  9. Pagan, R. Ageing and Disability: Job Satisfaction Differentials across Europe. Soc. Sci. Med. 2011, 72, 206–215. [Google Scholar] [CrossRef] [PubMed]
  10. Krause, J.S.; Dismuke-Greer, C.E.; Jarnecke, M.; DiPiro, N.D. Career Satisfaction among Working Age Individuals with Multiple Sclerosis or Spinal Cord Injury. J. Vocat. Rehabil. 2022, 57, 33–40. [Google Scholar] [CrossRef]
  11. Yasin, Y.M.; Kerr, M.S.; Wong, C.A.; Bélanger, C.H. Factors Affecting Job Satisfaction among Acute Care Nurses Working in Rural and Urban Settings. J. Adv. Nurs. 2020, 76, 2359–2368. [Google Scholar] [CrossRef]
  12. Li, J.; Roessler, R.T.; Rumrill, P.D.; Ahmed, E.R. Factors Influencing Job Satisfaction for Employed Adults with Multiple Sclerosis. Rehabil. Couns. Bull. 2017, 61, 28–40. [Google Scholar] [CrossRef]
  13. Okpara, J.O.; Squillace, M.; Erondu, E.A. Gender Differences and Job Satisfaction: A Study of University Teachers in the United States. Women Manag. Rev. 2005, 20, 177–190. [Google Scholar] [CrossRef]
  14. Pagan, R.; Malo, M.Á. Performance Appraisal and Job Satisfaction for Workers Without and with Disabilities by Gender. Soc. Indic. Res. 2021, 153, 1011–1039. [Google Scholar] [CrossRef]
  15. Yap, M.; Cukier, W.; Holmes, M.; Hannan, C.-A. Career Satisfaction: A Look behind the Races. Relat. Ind. 2010, 65, 584–608. [Google Scholar] [CrossRef]
  16. Pattani, R.; Burns, K.E.A.; Lorens, E.; Straus, S.E.; Hawker, G.A. Effect of Race, Gender Identity, and Their Intersection on Career Satisfaction: A Cross-Sectional Survey of Academic Physicians. Med. Teach. 2022, 44, 614–621. [Google Scholar] [CrossRef]
  17. Goldberg, A.E.; Matsuno, E.; Beemyn, G. “I Want to Be Safe…And I Also Want a Job”: Career Considerations and Decision-Making Among Transgender Graduate Students. Couns. Psychol. 2021, 49, 1147–1187. [Google Scholar] [CrossRef]
  18. Hojat, M.; Kowitt, B.; Doria, C.; Gonnella, J.S. Career Satisfaction and Professional Accomplishments. Med. Educ. 2010, 44, 969–976. [Google Scholar] [CrossRef]
  19. Sundar, V.; Brucker, D.L. Personal and Organizational Determinants of Job Satisfaction for Workers with Disabilities. Rehabil. Couns. Bull. 2018, 62, 170–179. [Google Scholar] [CrossRef]
  20. Moore, M.E.; Konrad, A.M.; Yang, Y.; Ng, E.S.W.; Doherty, A.J. The Vocational Well-Being of Workers with Childhood Onset of Disability: Life Satisfaction and Perceived Workplace Discrimination. J. Vocat. Behav. 2011, 79, 681–698. [Google Scholar] [CrossRef]
  21. Stålnacke, B.-M. Life Satisfaction in Patients with Chronic Pain—Relation to Pain Intensity, Disability, and Psychological Factors. Neuropsychiatr. Dis. Treat. 2011, 7, 683–689. [Google Scholar] [CrossRef]
  22. Tan, J.H.; Abdin, E.; Shahwan, S.; Zhang, Y.; Sambasivam, R.; Vaingankar, J.A.; Mahendran, R.; Chua, H.C.; Chong, S.A.; Subramaniam, M. Happiness and Cognitive Impairment Among Older Adults: Investigating the Mediational Roles of Disability, Depression, Social Contact Frequency, and Loneliness. Int. J. Environ. Res. Public Health 2019, 16, 4954. [Google Scholar] [CrossRef]
  23. Franzen, J.; Jermann, F.; Ghisletta, P.; Rudaz, S.; Bondolfi, G.; Tran, N.T. Psychological Distress and Well-Being among Students of Health Disciplines: The Importance of Academic Satisfaction. Int. J. Environ. Res. Public Health 2021, 18, 2151. [Google Scholar] [CrossRef]
  24. Mirhosseini, S.; Bazghaleh, M.; Basirinezhad, M.H.; Abbasi, A.; Ebrahimi, H. The Relationship between Depression and Academic Satisfaction in Medical Science Students. J. Ment. Health Train. Educ. Pract. 2020, 16, 99–111. [Google Scholar] [CrossRef]
  25. Zalazar-Jaime, M.F.; Moretti, L.S.; Medrano, L.A. Contribution of Academic Satisfaction Judgments to Subjective Well-Being. Front. Psychol. 2022, 13, 772346. [Google Scholar] [CrossRef]
  26. Turan, A.; Tunç, A.Ö.; Göktepe Aydın, E. Explaining Career Satisfaction on the Basis of Alumni Satisfaction, Gap Period and Gender: Evidence from Turkish Higher Education. Asian Soc. Sci. 2015, 11, 229. [Google Scholar] [CrossRef]
  27. Troiano, P.F.; Liefeld, J.A.; Trachtenberg, J.V. Academic Support and College Success for Postsecondary Students with Learning Disabilities. J. Coll. Read. Learn. 2010, 40, 35–44. [Google Scholar] [CrossRef]
  28. Walter, O.; Hazan-Liran, B. Psychological Capital, Social Support, and Academic Adjustment of Students with Learning Disabilities: The Value of Institutional Support Centers. Am. J. Health Behav. 2024, 48, 462–470. [Google Scholar] [CrossRef]
  29. Troccoli, A. Attitudes Toward Accommodations and Academic Well-Being of College Students with Disabilities. Ph.D. Thesis, Rowan University, Glassboro, NJ, USA, December 2017. [Google Scholar]
  30. Dong, S.; Guerette, A.R. Workplace Accommodations, Job Performance and Job Satisfaction Among Individuals with Sensory Disabilities. Aust. J. Rehabil. Couns. 2013, 19, 1–20. [Google Scholar] [CrossRef]
  31. CDC Disability and Health Data System (DHDS) Status and Types|CDC. Available online: https://www.cdc.gov/dhds/data-guides/status-and-types.html (accessed on 7 June 2025).
  32. Tait, R.C.; Chibnall, J.T.; Krause, S. The Pain Disability Index: Psychometric Properties. Pain 1990, 40, 171–182. [Google Scholar] [CrossRef]
  33. Schmitt, N.; Oswald, F.L.; Friede, A.; Imus, A.; Merritt, S. Perceived Fit with an Academic Environment: Attitudinal and Behavioral Outcomes. J. Vocat. Behav. 2008, 72, 317–335. [Google Scholar] [CrossRef]
  34. Pianosi, R.; Presley, L.; Buchanan, J.; Lévesque, A.; Savard, S.-A.; Lam, J. Canadian Survey on Disability, 2022: Concepts and Methods Guide; Reports on Disability and Accessibility in Canada; Statistics Canada: Ottawa, ON, Canada, 2023; ISBN 978-0-660-68203-7.
  35. Brooks, J.M.; Iwanaga, K.; Chan, F.; Lee, B.; Chen, X.; Wu, J.-R.; Walker, R.; Fortuna, K.L. Psychometric Validation of the Job Satisfaction of Persons with Disabilities Scale in a Sample of Peer Support Specialists. Psychiatr. Rehabil. J. 2021, 44, 93–98. [Google Scholar] [CrossRef]
  36. Seibert, S.E.; Kraimer, M.L.; Holtom, B.C.; Pierotti, A.J. Career Satisfaction Scale [Database record]. APA PsycTests 2012. [Google Scholar] [CrossRef]
  37. Breiman, L. Random Forests. Mach. Learn. 2001, 45, 5–32. [Google Scholar] [CrossRef]
  38. Strobl, C.; Boulesteix, A.-L.; Zeileis, A.; Hothorn, T. Bias in Random Forest Variable Importance Measures: Illustrations, Sources and a Solution. BMC Bioinform. 2007, 8, 25. [Google Scholar] [CrossRef]
  39. Nicodemus, K.K.; Malley, J.D.; Strobl, C.; Ziegler, A. The Behaviour of Random Forest Permutation-Based Variable Importance Measures under Predictor Correlation. BMC Bioinform. 2010, 11, 110. [Google Scholar] [CrossRef] [PubMed]
  40. Szymczak, S.; Holzinger, E.; Dasgupta, A.; Malley, J.D.; Molloy, A.M.; Mills, J.L.; Brody, L.C.; Stambolian, D.; Bailey-Wilson, J.E. r2VIM: A New Variable Selection Method for Random Forests in Genome-Wide Association Studies. BioData Min. 2016, 9, 7. [Google Scholar] [CrossRef]
  41. Ziegler, A.; König, I.R. Mining Data with Random Forests: Current Options for Real-World Applications. WIREs Data Min. Knowl. Discov. 2014, 4, 55–63. [Google Scholar] [CrossRef]
  42. Felsenfeld, S.; Broen, P.A.; McGue, M. A 28-Year Follow-Up of Adults with a History of Moderate Phonological Disorder. J. Speech Lang. Hear. Res. 1994, 37, 1341–1353. [Google Scholar] [CrossRef]
  43. McAfee, J.K.; McNaughton, D. Transitional Outcomes: Job Satisfaction of Workers with Disabilities Part Two: Satisfaction with Promotions, Pay, Co-Workers, Supervision, and Work Conditions. J. Vocat. Rehabil. 1997, 8, 243–251. [Google Scholar] [CrossRef]
  44. Do, J.-H.; Yoo, E.-Y.; Jung, M.-Y.; Park, J.-H.; Hong, I.; Lee, S. Predictive Factors Associated with Trajectory of Job Satisfaction of Workers with Physical Disabilities: A Latent Growth Curve Analysis. Work 2023, 75, 625–637. [Google Scholar] [CrossRef]
  45. Tenenbaum, R.Z.; Byrne, C.J.; Dahling, J.J. Interactive Effects of Physical Disability Severity and Age of Disability Onset on RIASEC Self-Efficacies. J. Career Assess. 2014, 22, 274–289. [Google Scholar] [CrossRef]
  46. Keating, B.W.; Keramat, S.A.; Waller, I.; Hashmi, R. Job Satisfaction Dynamics: How Do They Impact Employment Mode Choice for People with a Disability? Heliyon 2022, 8, e11076. [Google Scholar] [CrossRef] [PubMed]
  47. Madaus, J.W.; Zhao, J.; Ruban, L. Employment Satisfaction of University Graduates with Learning Disabilities. Remedial Spec. Educ. 2008, 29, 323–332. [Google Scholar] [CrossRef]
  48. Huber, M.J.; Oswald, G.R.; Webb, T.; Avila-John, A. Degree Completion and Employment Outcomes among Graduates with Disabilities. J. Vocat. Rehabil. 2016, 45, 241–247. [Google Scholar] [CrossRef]
  49. Maroto, M.; Pettinicchio, D. Disability, Structural Inequality, and Work: The Influence of Occupational Segregation on Earnings for People with Different Disabilities. Res. Soc. Stratif. Mobil. 2014, 38, 76–92. [Google Scholar] [CrossRef]
  50. U.S. Congress. Individuals with Disabilities Education Act|20 U.S.C. Available online: https://uscode.house.gov/view.xhtml?path=/prelim@title20/chapter33&edition=prelim (accessed on 7 June 2025).
  51. U.S. Department of Labor Section 504, Rehabilitation Act of 1973. Available online: https://www.dol.gov/agencies/oasam/centers-offices/civil-rights-center/statutes/section-504-rehabilitation-act-of-1973 (accessed on 7 June 2025).
Figure 1. Feature importances using mean decrease in impurity (MDI) for job satisfaction. Error bars represent one standard deviation in the sampling distribution.
Disabilities 05 00056 g001
Figure 2. Feature importances using permutation importance for job satisfaction. Error bars represent one standard deviation in the sampling distribution.
Disabilities 05 00056 g002
Figure 3. Feature importances using MDI for career satisfaction. Error bars represent one standard deviation in the sampling distribution.
Disabilities 05 00056 g003
Figure 4. Feature importances using permutation importance for career satisfaction. Error bars represent one standard deviation in the sampling distribution.
Disabilities 05 00056 g004
Table 1. Sample demographic characteristics and descriptive statistics.
VariableMeanSD
Age3912.5
Academic Satisfaction Scale (out of 55)35.410.1
Disability Index (DI) (out of 70)30.213.3
Frequency (n)Percentage (%)
Category of Disability
  Deaf or Difficulty Hearing4711.5
  Blind or Serious Difficulty Seeing4210.3
  Difficulty Concentrating, Remembering, or Making Decisions27968.2
  Difficulty Walking or Climbing Stairs11728.6
  Difficulty Dressing or Bathing5713.9
  Difficulty Completing Errands Alone23256.7
Number of Unmet Academic Accommodation Needs
  019547.7
  17317.8
  25713.9
  3379.0
  4163.9
  5122.9
  671.7
  741.0
  841.0
  920.5
  1020.5
Gender
  Man15337.4
  Woman20850.9
  Transman71.7
  Transwoman41.0
  Gender nonbinary/non-conforming348.3
  Other30.7
Race/Ethnicity
  American-Indian/Native-American/Alaska-Native41.0
  Asian/Asian-American/Pacific Islander133.2
  Black/African-American4410.8
  Latina/o/x or Hispanic235.6
  Multiracial/Multiethnic245.9
  White/European-American30073.3
  Other 10.2
Educational Attainment
  Grade school (elementary or middle)51.2
  High school/General Educational Development4912.0
  Some college (no degree)11127.1
  2-year/technical degree5413.2
  4-year college degree15136.9
  Master’s degree358.6
  Doctorate degree41.0
Urbanicity
  Urban13132
  Suburban18745.7
  Rural9122.2
Table 2. Correlation matrix among primary study variables.
Variable123456789
1. Job Satisfaction
2. Career Satisfaction0.70 *
3. Age0.19 *0.24 *
4. Unmet Academic Accommodation Needs−0.14 *−0.19 *−0.03
5. Disability Level−0.24 *−0.15 *−0.050.32 *
6. Academic Satisfaction0.46 *0.48 *0.17 *−0.40 *−0.29 *
7. Female or Trans−0.16 *−0.20 *−0.070.12 *0.12 *−0.10 *
8. College Degree0.050.120.26 *−0.07−0.15 *0.29 *−0.13 *
9. Rural−0.010.030.020.08−0.030.02−0.070.06
10. Underrepresented Minority0.100.11 *−0.16 *0.010.02−0.020.05−0.030.19 *
Note. * p < 0.050.
Table 3. Employment status, poverty, area under the receiver operating characteristic curve (AUC), and model predictive accuracy.
VariablePercentage of Sample (%)Precision (%)Recall (%)F1AUCAccuracy (%)
Job Satisfaction48.665.470.868.073.468.6
Career Satisfaction49.077.365.470.873.972.5
Disclaimer/Publisher’s Note: The statements, opinions and data contained in all publications are solely those of the individual author(s) and contributor(s) and not of MDPI and/or the editor(s). MDPI and/or the editor(s) disclaim responsibility for any injury to people or property resulting from any ideas, methods, instructions or products referred to in the content.

