Abstract
Background: Visual impairment is a global problem and, regardless of the cause, it substantially impacts people’s daily lives. Navigating towns and cities can be one of the most difficult tasks for someone with a visual impairment. This is because our streetscapes are often inaccessible for navigating safely and independently by people with a visual impairment. Barriers include street clutter, bollards, pavement parking, and shared spaces. Methodology: Participants with varying levels of diabetic retinopathy (DR) and retinitis pigmentosa (RP) were recruited. Each participant completed a clinical visit and a 1-mile walk. Participants discussed confidence, anxiety, difficulty, and any barriers encountered while completing the walkaround. Participants completed quality of life (RetDQol), diabetes distress scales, and a study questionnaire. They also underwent retinal imaging and visual function testing. Retinal imaging and visual function results were compared with confidence, difficulty, and anxiety levels during the walkaround using Spearman’s correlation. Results: Thirty-three participants took part in the study, 22 with diabetes and 11 with RP. Results showed that average confidence was correlated with visual acuity, RetDQol, mean visual fields, and vertical peripheral diameter visual fields. Average difficulty was associated with visual acuity, RetDQol, dark adaptation, mean visual fields, percentage of the retina, and both horizontal and vertical diameter visual fields. In addition, some of the barriers discussed were pavement issues, bollards, parked cars, uneven pavements, alfresco dining, light levels, and street features such as tree roots, poles, A-boards, and street clutter. Conclusions: People with RP and treated DR faced common barriers while navigating the walkaround. The removal of these common barriers would make our streetscapes more accessible for all and will allow for more independence in those with visual impairments.
1. Introduction
There are an estimated 2.2 billion people with visual impairments worldwide [1]. While the causes of visual impairment may differ, people often experience similar issues with loneliness, socio-economic issues, and completing daily tasks. Vision loss is known to have one of the biggest impacts on the quality of life [2], causing global concern [3,4]. It is one of the four contributing factors for the loss of independence and can lead to mental health issues (such as depression), a reduction in the quality of life, social deprivation, and social isolation [2,4,5,6,7,8,9,10,11].
It is well documented that people with diabetic retinopathy (DR) and retinitis pigmentosa (RP) have difficulty completing daily life tasks, including getting around the built environment [8,9,10,11]. One of the tasks people fear most is going out into towns and cities to travel to work, social events, or even to get groceries. For the best possible quality of life, it is important that people feel comfortable in their own homes and can navigate towns, cities, and streetscapes comfortably [12]. Our current urban streetscapes are often described as ‘not fit for purpose’ or ’hostile’ for people with conditions and circumstances affecting their mobility [13,14]. Previous studies show that people with a visual impairment are uncomfortable with moving around current urban streetscapes [15,16] as the built environment is designed by sighted individuals without appropriate consideration to barriers for people with visual loss [17]. These barriers create a more difficult streetscape and cause non-engagement by people with a visual impairment due to both real and imagined barriers [16].
Some of the most frequently reported barriers in streetscapes are noise [17], street clutter, bollards, pavement parking, shared spaces [18,19,20], stairs, traffic junctions, slippery walkaways, and hanging obstacles [21]. Inappropriate public transport and lighting [22] cause further isolation especially in the hours of darkness. Although several studies have investigated the effects of visual impairment socially, economically, and emotionally, there is still a scarcity of literature on the impact of the built environment on people with a visual impairment. Very few current studies physically take visually impaired users into the environment and assess how they walk around and cope [23,24]. Havik et al. conducted a study that assessed visually impaired people (14 of which were blind) navigating shared space areas in Groningen, the Netherlands. Campisi et al. gathered information through questionnaires and walking areas within the city of Enna, Southern Italy. The participants were all registered as sight or severely sight impaired. Despite this, no study so far has correlated the navigation of the built environment with retinal imaging, visual function, quality of life, and other chronic illness distresses [23].
The research question for the study is, therefore, ‘Does vision loss and function due to diabetes and retinitis pigmentosa affect independent mobility and navigation in urban environments?’
2. Materials and Methods
This study was undertaken in Belfast, Northern Ireland, UK by Queen’s University Belfast (QUB) and was conducted in accordance with the principles outlined in the Declaration of Helsinki. Participants took part in the study between May 2021 and May 2022. Research ethics permission was granted by Queen’s University Belfast (MHLS_20_67) and WalesREC5 (20/WA/0350).
People with diabetes mellitus (DM) and retinitis pigmentosa (RP) were recruited into the study (Figure 1). The rationale for including people with RP as a comparator group was that their peripheral vision loss is well characterised and correlated to barriers in the built environment [25,26,27]. The pattern of their peripheral visual loss/pathology is similar to laser treated DR (TDR). Figure 2 shows the heatmaps of pathology graded on Optos retinal images from people with TDR and RP to show the similarity of peripheral pathology. It was therefore postulated that there may be similar issues in people with RP and TDR in navigating the built environment.
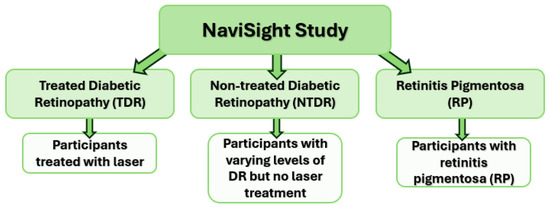
Figure 1.
NaviSight Study arms. (TDR = treated diabetic retinopathy, NTDR = non-treated diabetic retinopathy, RP = retinitis pigmentosa).
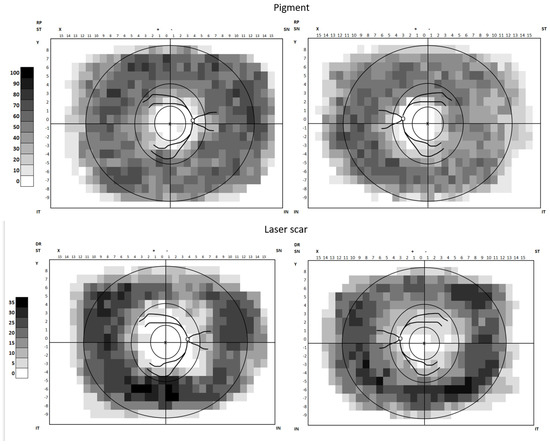
Figure 2.
Heatmaps of pathology graded on Optos retinal images from people with TDR and RP.
2.1. Inclusion Criteria
- Participants with a diagnosis of diabetes (with or without retinopathy) or retinitis pigmentosa (RP).
- Age 18 and over.
- No other known eye conditions (other than cataract).
- Able to move around the pre-defined study route in Belfast with or without the use of mobility aids (participant’s choice).
2.2. Exclusion Criteria
- Any other eye disease apart from RP and diabetes related eye disease.
- Any condition that precluded a clear view of the retina.
- Lack of mental capacity to give consent.
- Unable to speak English sufficiently to understand the study and complete appointments.
- Anyone who cannot walk the pre-defined study route in Belfast.
Participant visits consisted of questionnaires, retinal imaging, and visual function testing at the Northern Ireland Clinical Research Facility (NICRF) and a walkaround of a pre-defined 1-mile area.
2.3. NICRF Methodology—Visual Function, Retinal Imaging and Questionnaires
Questionnaires—All participants completed the NaviSight Study Questionnaire (Supplementary File S1), which collected demographic information, medical history, and questions regarding experiences moving around towns and cities. Medical history questions were related to common diabetes complications. In addition, a section on sight loss and navigating the built environment was included using the previous literature and a pilot study (Supplementary Table S1) [28]. Additional information on the NaviSight Questionnaire can be found in Supplementary Table S1. Participants completed the Retinopathy Dependent Quality of Life (RetDQOL) (Health Psychology Research). This questionnaire was completed by all participants as there was a scarcity of comparable RP-related quality of life questionnaires. The term ‘diabetic eye disease’ was replaced with ‘eye disease’. Participants with diabetes also completed the Diabetes Distress Questionnaire (DDS17) to assess any diabetes distress.
2.4. Visual Function Measurements
Habitual visual acuity was measured in the right eye, left eye, and bilaterally using the ETDRS chart, and all measurements were recorded in LogMAR. Habitual contrast sensitivity was collected in the right eye, left eye, and bilaterally using their own glasses. Contrast sensitivity was assessed using the app PeekCS (London, UK) on a Sony Xperia Z Compact smartphone (Tokyo, Japan) and was shown to be comparable to the Pelli-Robson Contrast Sensitivity Test [29]. All measurements were recorded in log contrast. These measurements were collected habitually because this is how participants would normally see while navigating. Contrast sensitivity was measured because different eye conditions can cause contrast loss, which can cause issues when navigating the built environment [27]. This can be a particular problem with the colours of pavements, stairs, and roads.
Visual fields were assessed using the Metrovision ‘Mix-30’ protocol (Metrovision, Pérenchies, France), which assesses both the peripheral visual field with kinetic perimetry and the central field with FAST (Fiber Adapted Static Testing Perimetry) perimetry (94 points). Assessment was completed in the right eye and left eye. Visual field was recorded using mean deficit in decimals. Visual fields were tested due to previous research into the barriers to people with RP [25,26] in navigating the built environment and the likelihood that visual field impacts navigation. The mean deficit visual field was used for analysis. Vertical and horizontal visual field degrees was used for analysis—according to each visual field map.
The dark adaptation assessment was completed on the AdaptDX (Maculogix, Harrisburg, PA, USA). The right and left eyes were tested separately, and participants were not dark adapted before to show how participants would function going from light to dark (often as they would in towns and cities from day- to night-time). Dark adaptation measurements were recorded with rod-cone intercept times. Dark adaptation was measured due to known issues with night vision and adaptation in people with retinitis pigmentosa and potentially diabetic retinopathy.
Widefield imaging was completed using the Optos California P200DTx (Optos plc, Dunfermline, Scotland). OCT and OCTA were captured with Heidelberg Spectralis Imaging (Heidelberg Engineering, Heidelberg, Germany).
2.5. Walkaround Methodology
To assess any issues, problems, or barriers faced by participants in the built environment, participants walked a pre-planned route around an area of Belfast (Figure 3). This route was chosen due to its access to public transport, proximity to the City Hospital (where the research facility is located), and the presence of many types of streetscapes. We used a walking interview method, which allowed better understanding of participants’ lived experiences and perceptions [30] and empowered participants [31,32,33]. Participants were accompanied by two researchers and were encouraged to talk about any issues or barriers they encountered. No specific prompts or questions were asked for free flow of conversation, and notes on the discussion were taken. Participants were also asked to assess the level of difficulty, confidence, and anxiety they felt at each point (assessing the section in between two points) along the route on a Likert scale. Each participant received the following explanation regarding the definition of difficulty, confidence, and anxiety:
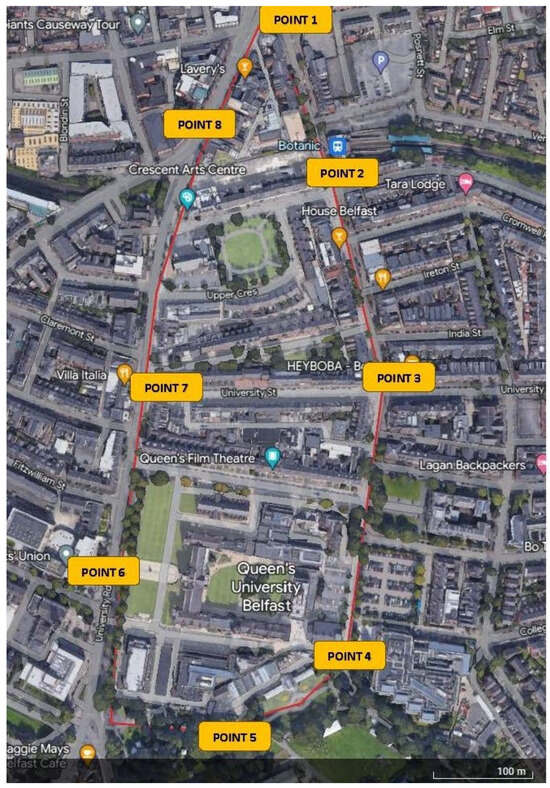
Figure 3.
Participant walkaround route, Queen’s Quarter Belfast (Source: Google Earth). Points where measurements were taken are in yellow, and the route is marked in red.
- Difficulty was deemed when barriers or issues were faced during the walk (1 = not difficult and 5 = very difficult).
- Confidence related to how confident and comfortable they felt in walking that section, especially independently (1 = low confidence and 5 = high confidence).
- Anxiety was explained as anything in that section that made them nervous, anxious, or fearful (1 = no anxiety and 5 = high anxiety).
2.6. Streetscape Variability:
- Botanic Avenue (Point 1–Point 4)—a very busy street with students, student life, cafés, outdoor dining, traffic, and an abundance of street furniture including advertisement boards.
- QUB McClay Library to Botanic Gardens (between points 4–5)—shared space area where cars, bikes, scooters, and pedestrians move around.
- Botanic Gardens (points 5–6)—open green space with varying light levels and tree shade; busy pedestrian spot with bikes and scooters.
- University Road (points 6–7)—wide pavement area with little street furniture except bollards; also a cobblestoned area. A contrast to Botanic Avenue.
- University Road (between points 7–8)—busier streetscape, narrow footpaths, trees on pavements, traffic is busy and loud, one-way streets, and pedestrian crossings.
Each section was chosen to allow information to be captured on each type of streetscape as mentioned above.
Light and noise measurements were taken at each point because they have been shown to affect people with visual impairments while navigating [34]. Light and noise measurements were taken on an iPhone 7 using apps called Luxmeter (light), designed by Velux ©, Praha, Czechia and Decibel X, designed by SkyPaw© in Hanoi, Vietnam.
2.7. Statistical Analysis
Qualitative analysis was conducted using Braun and Clarke’s thematic analysis methods [35]. As there were no large transcripts, qualitative walkaround data was analysed by counting the frequency of similar barriers during the walkaround, which was used to create a word cloud. Any additional comments or longer phrases were used as further barriers and specific barrier anecdotes.
Comparative analysis: Data were grouped into people with RP (n = 11), people with treated DR (TDR) (n = 9), and people with non-treated DR (NTDR) (n = 13). The Stata Statistical Package Version 17 was used to find any significant correlations between walkaround variables and clinical/grading variables. Statistical analysis was conducted on visual fields using the mean visual field score from both eyes because it was found that there was no difference in using the mean visual field or the best visual field score. The Spearman correlation coefficient was primarily used on all data to explore the association between variables. When significant variables were identified from Spearman’s correlation, they were entered into a multivariate linear regression analysis to ascertain which variables were still significant. Due to the exploratory nature of this study and the small sample, a Bonferroni adjustment of the p-value was not used.
2.8. Image Grading Methods
Widefield images—Following quality assessment, Optos widefield images were graded using a grading form and MATLAB Boston (The MathWorks Inc., Natick, MA, USA) and Manchester Grids. Diabetes images were graded for microaneurysms, blot haemorrhages, exudates, new vessels, venous loops, venous beading, retinal haemorrhage, venous reduplication, pre-retinal or vitreous haemorrhage, cotton wool spots, fibrosis, laser scars, and IRMA (intraretinal microvascular abnormality). RP images were graded for white dots, pigment, atrophy, scars, and other pathology. The Manchester Grid covers the retina with 754 squares that are equivalent to one average optic disc area size (1.7 mm2). During grading, each square was assessed for the presence (1) or absence (0) of the different pathological features outlined above. A square was defined as ungradable if more than 50% of the square area was impossible to assess. In addition, image quality, vessel attenuation, cup to disc ratio, and disc pallor were assessed by the grader. The percentage area of the retina was calculated using the number of squares affected compared to the total number of 754.
2.9. Optical Coherance Tomography (OCT)
After quality assessment, OCTs were graded for image quality, vitreomacular adhesions (VMA), vitreomacular traction (VMT), epiretinal membrane (ERM), sub and intraretinal fluid and presence, and a count of the hyperreflective foci on the foveal scan. In addition, the outer layers (from the outer nuclear layer to Bruch’s Membrane) and inner layers (from outer plexiform layer to the internal limiting membrane) were measured at the fovea, 500 μm, 1000 μm, and 3000 μm nasal and temporal using the measurement tools in Heyex software (https://business-lounge.heidelbergengineering.com/us/en/) as shown in Figure 4. A choroidal measurement was taken at the fovea.

Figure 4.
Layer measurements on OCT.
3. Results
3.1. Demographics and Medical History
Thirty-three people participated in the study with retinal imaging and visual function tests available for 64 eyes (due to two blind right eyes). Of these, 22 (66.7%) had diabetes and 11 (33.3%) had RP. A majority of participants were male (69.7%) and 30.3% were female. The mean age was 49 years (SD 17.6). There was no statistically significant difference in age of people with RP and DR (p = 0.185). The mean ages of participants with NTDR, TDR, and RP were 49 years (SD 21), 49 years (SD 11.1), and 45 years, respectively (SD 15). Medians were 51 (IQR 45.5), 51 (IQR 18), and 41 (IQR 23) years, respectively. Sixteen of those with diabetes had type 1 (72.7%) and five (22.7%) had type 2 diabetes. One participant was in diabetes remission. The range of diabetes duration was 2–67 years, with a mean diabetes duration of 25 years (S.D 17.9).
All declared co-morbidities were by people with diabetes except for one person with RP having foot problems. All those who currently or previously smoked had diabetes and three participants with diabetes had hearing loss. Medical history information for all participants can be found in Figure 5.
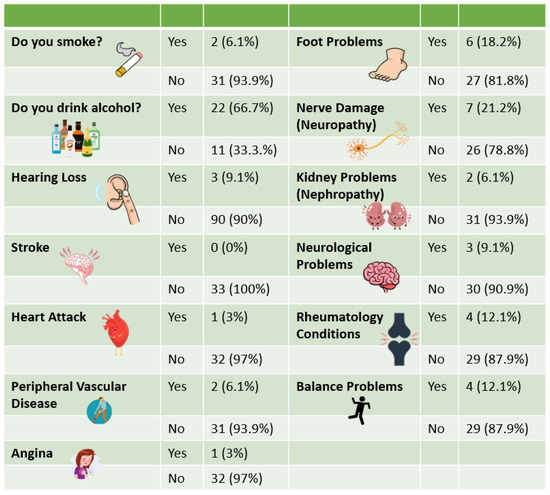
Figure 5.
Medical history.
3.2. Questionnaire Results
3.2.1. Retinopathy Dependent Quality of Life
Results from the RetDQol (Figure 6) showed that there was a large range of scores from those with NTDR and most were around the 0.0 mark (no impact). Despite this, there were some with worse levels of retinopathy that showed some level of impact on their quality of life (Figure 7). People with TDR had a larger impact on quality of life with some levels mirroring people with RP. People with RP, as expected, showed worse levels of quality of life. Anomalies were participant NAVI005, who had very little vision loss, was young, and still able to drive, and NAVI013, who was less independent and was living with severe sight impairment. Analysis showed that quality of life was significantly more reduced in people with RP (p = 0.000) and TDR (p = 0.021) than those without NTDR.
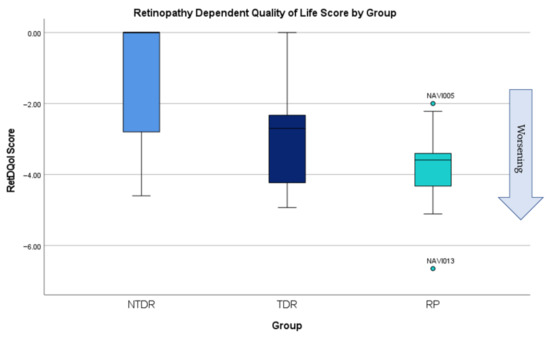
Figure 6.
RetDQol scores according to group.
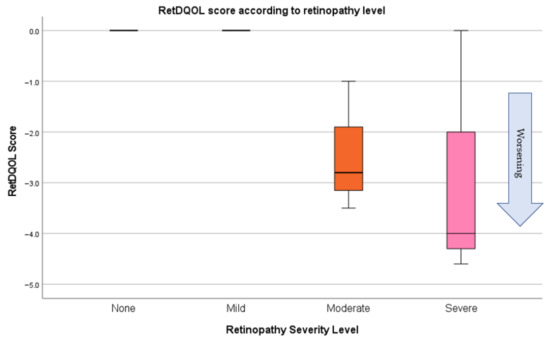
Figure 7.
RetDQol scores in the NTDR group.
3.2.2. Diabetes Distress
The DDS17 showed that two people were in total distress (score of 3 or higher), both of whom had TDR (Figure 8). Results showed that people with TDR had higher emotional burden (average of 5.1 for TDR versus 3.88 for NTDR) and regimen distress (4.68 versus 3.61 average) than those with NTDR. Interpersonal and physician related distress was low in both groups. Neither NTDR nor TDR had more significant levels of distress (p = 0.900).
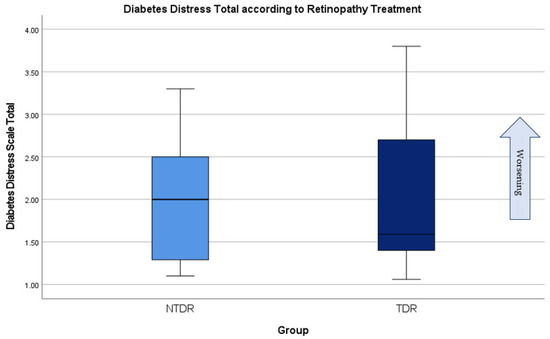
Figure 8.
Diabetes distress in people with NTDR and TDR.
3.2.3. NaviSight Study Questionnaire
Results (Table 1) show over half (63.6%) of people with RP stated they felt walking around towns and cities was difficult while only one person in the TDR group did. Despite this, over 72% of people with RP felt street clutter and parked cars were issues on streetscapes. In addition, while only one person in the TDR group found towns and cities difficult to navigate, four people with TDR felt that street clutter and cars parked on pavements were problematic. Many, 81% of people with RP and 50% of people with TDR, felt that the shared space was problematic. Lighting levels were also deemed to be an issue by 66.7% TDR and 72.7% RP. Over 70% of participants with TDR and RP felt that bright markings on hazards would help navigation.

Table 1.
NaviSight Study Questionnaire results.
3.2.4. Walkaround Analysis
Prior knowledge of the area—Prior to commencing the walk, participants were asked if they knew the area or lived in Belfast. Nine participants lived and were local to Belfast and 24 did not. Three people stated they knew the route well and six stated they had walked in the area before. All other participants stated they were unfamiliar with the area.
3.2.5. Confidence, Anxiety and Difficulty
Figure 9 shows a graphic depiction of anxiety, confidence, and difficulty levels at different points along the walkaround. Results show that people with RP had significantly reduced levels of confidence (p = 0.006) when walking around the route than other groups. In addition, people with RP felt that the route was significantly more difficult (p = 0.000). Qualitative analysis showed people with TDR and NTDR did not have problems with confidence apart from two participants. However, people with RP had much more confidence issues with the lowest score of 1.5. The difficulty mirrored the results of confidence, with people with RP finding the walkaround more difficult than those with NTDR and TDR. Only three participants with NTDR/TDR deemed the route difficult. Anxiety was low in all participants with all falling below a score of 2/5. Four participants in the NTDR and TDR felt some anxiety; however, one of these had a hearing problem while the other three participants self-reported anxiety. When comparing confidence and difficulty, there is a correlation between confidence being low or very low in areas where participants reported moderately or very difficult sections. This correlation can be visually seen in Figure 9.
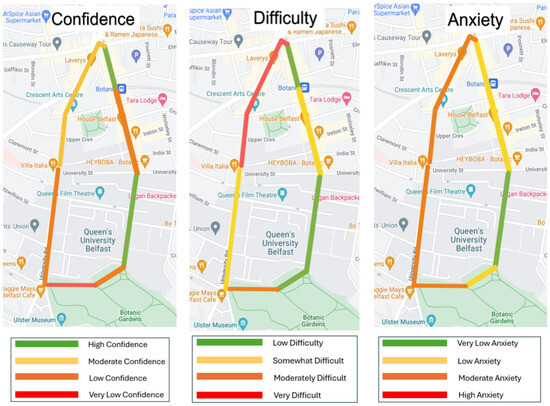
Figure 9.
Confidence, difficulty, and anxiety by participants.
Participants also discussed issues related to light and noise during the walkaround. Participants in the RP group found very bright days extremely difficulty due to photophobia or light casting shadows on pavements (usually caused by buildings and trees overhead). In addition, very dark and dull days (especially in heavy rain) were difficult for people with RP as these created less contrast and darkened the whole environment. The constant changes in light levels were also reported as difficult for some participants with RP as their eyes could not adapt quickly. One participant with a hearing difficulty mentioned that it was difficult to understand the researcher along the walkaround due to noise. In addition, some participants in both groups felt that high noise areas were difficult as they could not hear potential hazards such as bikes, skateboards, scooters, and even passers-by.
3.2.6. Qualitative Analysis of the Walkaround
Some of the most common barriers discussed by participants in the RP and TDR groups can be seen in Figure 10. Some of the most common werepavement issues, bollards, parked cars, uneven pavements, alfresco dining, light levels, and street features such as tree roots, poles, A-boards, and street clutter. In addition, one participant in the RP group fell over a takeaway carton on the ground, one participant with RP would have walked into an advertisement board without intervention, one participant with RP said they felt ‘trapped’ in Botanic Gardens due to the non-accessibility of the gates/fence, and one participant in the TDR group stated they were ‘busy watching the ground for hazards so they miss what’s in front’. In addition, intervention by the researcher was necessary in two TDR participants walks as they did not see cars coming due to visual field loss. Participants also reported that at night, they struggled with new streetlights (due to LED technology) and a lack of streetlights. Participants in both groups felt that the corner at Shaftesbury Square was particularly difficult; kerbs with a curved gradient rather than a step, street cafés, and pedestrian crossings with no sounds/broken ‘green man’ were particularly difficult. Several participants in both groups also stated that leaves were also particularly slippery at certain times of the year and caused visual contrast issues.
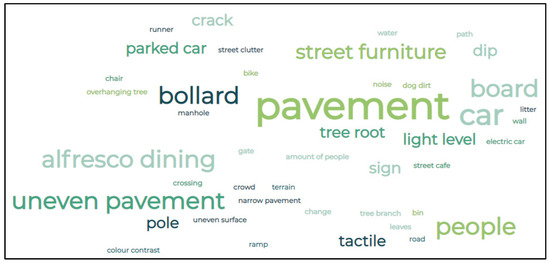
Figure 10.
Word cloud of the most common phrases and issues.
During the walkaround, some people with diabetes in both the NTDR and TDR groups, who had previously stated they anticipated no confidence or difficulty issues, then stated they had issues with visual fields when completing the walkaround. Some quotes include ‘if you hadn’t been here, that car would have hit me as I can’t see anything to my far left’ or ‘I would have walked into that bin because my lower visual field is bad’.
3.3. Correlation of Walkaround Results with Clinical Parameters
Spearman’s correlation (Table 2) showed that average anxiety had no correlation with any clinical parameters. Average confidence was correlated with visual acuity, RetDQol, mean visual fields, and vertical peripheral diameter visual fields. Average difficulty was associated with visual acuity, RetDQol, dark adaptation, mean visual fields, percentage of the retina with pathology, and both horizontal and vertical diameter visual fields. The results show that people with RP have significantly reduced levels of confidence (p = 0.006) when walking around the route than other groups. In addition, people with RP felt that the route was significantly more difficult (p < 0.001).

Table 2.
Spearman’s correlation of walkaround and clinical parameters.
Further multiple regression analyses into Optical Coherence Tomography (OCT) grading results showed that the absence of well-formed outer retinal layers such as the External Limiting Membrane (ELM) and Ellipsoid Zone (EZ) did matter. Discontinuous ELM was significantly associated with lower average confidence (p = 0.011) and increased difficulty (p = 0.019). EZ absence was also significantly associated with reduced confidence (p = 0.010) and more difficulty (p = 0.001) during the walkaround.
4. Discussion
Interestingly, our study found that only one person with TDR stated that the streets were difficult to navigate on the questionnaire; however, more responded that specific pavement issues such as street clutter, parked cars on pavements, and shared spaces were difficult. In addition, while all people with diabetes stated they had no issues walking around the built environment, two required researcher intervention to avoid cars and obstacles due to field loss. The fact that people with TDR often have slow progression of the disease itself may account for their better adaptation to vision loss and therefore less awareness of barriers within the street scape. This may be important to assess the effects of slow progressive diseases on people living with a visual impairments’ quality of life and adaptation to visual loss. The previous literature states that people with a visual impairment find shared spaces difficult to navigate [18,19,20]. Our results showed that most people with some level of treatment or disease (81% of those with RP and half with TDR) reported that the shared space was problematic.
Lighting levels were also deemed to be an issue both from the questionnaire (66.7% for TDR and 72.7% for RP) and the walkaround. Discussions on the walkaround with participants with RP often focused on light levels and changes in light levels around the walk. Participants with RP reported that there were light casting shadows especially in areas with trees and on bright days. The trees created shaded areas that participants could not adapt to. They also commented that the contrast was poor between building colours, pavements, kerbs, and the road, often making it more difficult to navigate. This would be in keeping with dark adaptation problems, contrast sensitivity, and night vision loss for people with RP. Bright days and changes in light could also impact someone with photosensitivity issues. In addition to changes in lighting levels during the day, there was discussion on lighting levels at night. Participants with both TDR and RP reported that new street lighting (with LED lights) could be problematic. Discussion with participants suggested that while LED lights were brighter and more efficient, they create less diffuse light and therefore there are more dark areas in between streetlights. Noise levels may also play a role; one participant in the TDR group felt the route was much more difficult due to the noise rather than any vision loss. Some areas, especially in the latter half of the walk, had large multi-lane roads and tall buildings, causing more noise.
Participants from both the TDR and RP groups discussed pedestrian crossings and the lack of sound in many of them. Participants and researchers alike have noticed increasingly in Northern Ireland that sounds are being ‘turned off’ or removed due to local residents’ complaints about noise. Unfortunately, this often means people with a visual impairment have a more difficult time crossing the road. One suggestion would be to implement tactile feedback such as vibrating buttons for pedestrian crossings. In addition, new pedestrian crossings being put in place now in Northern Ireland are difficult for people with a visual impairment. This is because the ‘green man’ is no longer shown both beside the pedestrian and on the light in front but only beside the pedestrian. This can be very problematic especially at a busy crossing where there are crowds of people crossing and the green man is not visible.
Many participants felt that bright markings would be helpful in streetscapes. These yellow lines are used within streetscapes and stairs as a warning for people with sight loss. Despite this, it is not consistent throughout streetscapes and is often only used in areas such as train stations and platforms. Other barriers mentioned such as pavement issues, bollards, parked cars, uneven pavements, alfresco dining, light levels, and street features such as tree roots, poles, A-boards, and street clutter are mirrored in the literature [18,19,20]. In addition to the literature, one of the study participants became ‘trapped’ in a large open park due to a poor path and exit line up. This shows the importance of access to routes in and out of public spaces. In this case, the exit is a space of one doorway for large crowds and is not obvious. There are also other hazards around the area, including a sculpture with trip hazards and a café/coffee cart. While many of the obstacles reflect the literature, it is interesting that one participant stated that there are so many potential hazards that they are missing them in areas of their vision when they are looking at and for others.
No other study has looked at confidence, anxiety, and difficulty levels around a walkaround with different streetscapes. The results from this study showed that there was commonality between areas that people found more difficult and where they were less confident. This inverse correlation would be expected as when the area is ‘fraught with dangers’ or ‘hostile’ [13,14], it will likely reduce the person’s confidence. Confidence levels were low on Botanic Avenue (points 1–2) due to the busy road, street clutter, crowds of students, street cafes, and food delivery bikes/motorbikes on pavements—it is a street that has a lot of sensory overload. The Botanic Gardens (points 4–5) were also an area with poor confidence due to the unstructured nature of paths, crowds, skateboards, bikes and scooters, changes of light levels due to overhanging trees, and issues with the gates without clearly marked exits. It was expected that points 6–7 would be easier to navigate due to its wide pavements with little street clutter; however, many found it very difficult due to bollards and cobblestones. In addition, people with white canes had extra difficulty due to paving flags causing the cane to ‘stab [them] in the stomach’ constantly. The difficulty increased from points 7 to 8 where there were small paving flagstones, tree roots, more bollards, especially random single bollards, and street crossings without lights. Anxiety was higher around the end of the walk, which is interesting as participants found the earlier areas more difficult with low confidence. This might be explained by the fact that ‘Shaftesbury Square’ is located at the end of the walk and is a very busy and loud traffic area, which feels more exposed to traffic and is very dark due to tree cover. This area is also prone to having ‘unexpected’ obstacles such as litter, skips, and work signs. It should be noted that many participants also stated, ‘if you weren’t here, I would be more anxious’. This could account for the lower anxiety scores, generally.
On comparison against clinical measures, it was interesting to note that increased difficulty and reduced confidence were associated with VA, quality of life, and visual field. As the VA reduces, the loss of fine detail occurs, which could account for the increased difficulty and reduced confidence. In addition, as the visual field is impaired, the window of vision will be reduced, causing barriers and obstacles to be missed. This is reflected in the participant saying they are missing obstacles as they are looking for others. This is also reflected by the two participants who missed obstacles due to visual field loss. As all these visual functions decrease and visual impairment becomes more profound, there will likely be an impact on navigating and completing daily tasks, correlating to a reduced quality of life. Interestingly, increased difficulty was associated with dark adaptation and but not confidence. This is likely due to the above-mentioned issues of casting shadows due to overhanging trees or buildings.
The results from OCT image analysis showed that an outer retinal layer disruption or absence (EZ and ELM) had a negative effect on confidence and increased the difficulty of the route. As the ELM is comprised of photoreceptor nuclei and muller cells, if affected, the vision is also likely to be greatly affected. The same stands for the EZ layer, which is often used as a biomarker for photoreceptor structure, meaning if this is impacted, vision will likely be greatly affected. This will likely lead to outer retinal loss, causing loss in visual function, which affects the ability to navigate. Once this ability is lost, issues with isolation and mental health often occur [2,8,9,10,11].
4.1. Commonality amongst Other Mobility Issues, Disabilities, and Impairments
Our study concentrated on those with visual impairment; however, many of these problems have been reported by groups with other disabilities or mobility issues. Cracks on pavements [36] and unevenness [37] impact older people, people with dementia, those with physical impairments, or with autism spectrum condition (ASC) and people using prams and wheelchairs. Narrow pavements make navigation difficult for people with prams, wheelchairs (especially electric wheelchairs) [38] and older people [36]. Street clutter, litter, and overhanging branches pose problems for older people, people with ASC, and other physical disabilities [36,38,39,40]. Cyclists and skateboarders can be perilous to some users and cause sensory overload for people with ASC [39]. Shared space has been demonstrated to be problematic for people with a visual impairment [20,24,41,42], people with hearing loss [43], and people with ASC [37]. Therefore, developing strategies that would help people with visual impairments is likely to have a major impact on a wide range of society.
Enablers such as lighting not only make areas safer but also help older people with arthritis and those with dementia to navigate [36,44,45]. Lighting designs, however, do need to cater both for those who cannot have it too dull (elderly or visually impaired) or those who are bothered by it if it is too intense (ASC or photosensitivity) [46]. Colour contrast and yellow markings can be helpful for people with a visual impairment, but colourful pavements and crossings can create visual stimulation overload for older people [44] and those with dementia, visual impairment [47], or ASC [39].
4.2. Recommendations
A wider consultation and establishment of best practices in given communities, considering the needs of the aging population, is crucial for keeping our cities liveable [46]. This shows that changes made for people with a visual impairment in our streetscapes not only help people living a visual impairment but also could benefit people with neurodivergent issues and other disabilities. Exploring best practices for co-design processes, involving people with visual impairment in public space design, and studying the impact of technological innovations like smart pedestrian crossings and tactile paving are crucial. Longitudinal studies assessing the long-term benefits of these changes, comparative studies between different cities, and research on the broader social and economic impacts of accessible streetscapes will further enhance our understanding and implementation of inclusive urban environments.
Policymakers should mandate inclusive design principles in urban planning to ensure streetscapes are accessible to all, including those with vision impairment. Developing regulations for auditory and/or vibrating signals at pedestrian crossings, allocating funding for accessibility projects, and requiring co-design with people with visual impairments are essential steps. Additionally, implementing training programmes for urban planners, ongoing monitoring and evaluation systems, and encouraging public engagement and education about the importance of accessible streetscapes will help create more inclusive and supportive communities for people with vision impairments and other disabilities.
4.3. Limitations
There were some limitations to the study, including the participants’ prior knowledge and use of the area used for the walkaround potentially confounding the results. Participants were asked if they had previously walked this area or lived in the area. In addition, bilateral visual fields would have been more comparable to other clinical and walkaround measurements. We also did not ask participants about race, ethnicity, or ancestry, which could be a limitation; however, the population of Northern Ireland is predominantly white, reflecting the demographics observed in this study.
5. Conclusions
This study has shown a correlation between objective clinical findings and the navigation of the built environment. As expected, poorer visual function is related to an increase in difficulty when navigating environments and a decrease in confidence. From this research, it is clear that consideration into how our streetscapes are designed is essential for accessibility for all. Consideration of street lighting (especially new schemes), pedestrian crossing design, street furniture lines, contrast in streetscapes, and routes in and out of public spaces should be given before design and implementation. Co-design is essential to make areas accessible for all. Some small changes will lead to the reduction and removal of barriers, allowing for a more accessible and enjoyable streetscape for all, including people with a disability or impairment.
Supplementary Materials
The following supporting information can be downloaded at: https://www.mdpi.com/article/10.3390/disabilities4030032/s1, Supplementary File S1: NaviSight Questionnaire: Sight loss and the built environment section. Table S1: Rationale of NaviSight Questionnaire. References [18,19,20,21,22,24,28,48,49,50,51,52] are cited in the Supplementary Materials.
Author Contributions
Conceptualization, L.N.C., T.P., N.G. and G.S.; methodology, L.N.C., T.P., N.G. and G.S.; formal analysis, L.N.C., G.V., K.C. and L.C. investigation, L.N.C. and K.C.; resources, L.N.C. and L.C.; data curation, L.N.C., K.C. and L.C.; writing—original draft preparation, L.N.C.; writing—review and editing, L.N.C., L.C., G.V., K.C., G.S., N.G. and T.P.; visualization, L.N.C., L.C. and T.P. supervision, N.G. and T.P.; project administration, L.N.C. and T.P.; funding acquisition, L.N.C. and T.P. All authors have read and agreed to the published version of the manuscript.
Funding
This study was funded by Department for Education, Queen’s University Belfast, and Optos Plc as part of a collaborative studentship.
Institutional Review Board Statement
Research ethics permission was granted by Queen’s University Belfast (MHLS_20_67) and WalesREC5 (20/WA/0350).
Informed Consent Statement
Informed written consent was obtained from all subjects involved in the study.
Data Availability Statement
The original contributions presented in the study are included in the article/Supplementary Materials, further inquiries can be directed to the corresponding author.
Acknowledgments
In thanks to colleagues in the Belfast Ophthalmic Reading Centre (BORC) and Central Angiographic Reading Centre (CARF) for their help throughout the study. Thanks to the Staff at the Northern Ireland Clinical Research Facility for their support throughout the study.
Conflicts of Interest
The authors declare that this study received funding from Optos Plc and the funder was not involved in the study design, collection, analysis, interpretation of data, the writing of this article, or the decision to submit it for publication.
References
- World Health Organization. Blindness and Vision Impairment; World Health Organization: Geneva, Switzerland, 2023. [Google Scholar]
- Brown, G.C.; Brown, M.M.; Sharma, S. The Five Senses: A Patient Preference-Based Comparative Analysis. Clin. Res. Ophthalmol. 2018, 1, 1–8. [Google Scholar]
- Lin, J.C.; Yu, J.H. Assessment of quality of life among Taiwanese patients with visual impairment. J. Formos. Med. Assoc. 2012, 111, 572–579. [Google Scholar] [CrossRef] [PubMed]
- Nutheti, R.; Shamanna, B.R.; Nirmalan, P.K.; Keeffe, J.E.; Krishnaiah, S.; Rao, G.N.; Thomas, R. Impact of impaired vision and eye disease on quality of life in Andhra Pradesh. Investig. Ophthalmol. Vis. Sci. 2006, 47, 4742–4748. [Google Scholar] [CrossRef] [PubMed]
- Sharma, H.E.; A Mathewson, P.; Lane, M.; Shah, P.; Glover, N.; Palmer, H.; Haque, M.S.; Denniston, A.K.; Tsaloumas, M.D. The role of social deprivation in severe neovascular age-related macular degeneration. Br. J. Ophthalmol. 2014, 98, 1625–1628. [Google Scholar] [CrossRef] [PubMed]
- Court, H.; McLean, G.; Guthrie, B.; Mercer, S.W.; Smith, D.J. Visual impairment is associated with physical and mental comorbidities in older adults: A cross-sectional study. BMC Med. 2014, 12, 181. [Google Scholar] [CrossRef] [PubMed]
- Chaumet-Riffaud, A.E.; Chaumet-Riffaud, P.; Cariou, A.; Devisme, C.; Audo, I.; Sahel, J.-A.; Mohand-Said, S. Impact of Retinitis Pigmentosa on Quality of Life, Mental Health, and Employment Among Young Adults. Am. J. Ophthalmol. 2017, 177, 169–174. [Google Scholar] [CrossRef] [PubMed]
- Fenwick, E.K.; Pesudovs, K.; Khadka, J.; Dirani, M.; Rees, G.; Wong, T.Y.; Lamoureux, E.L. The impact of diabetic retinopathy on quality of life: Qualitative findings from an item bank development project. Qual. Life Res. 2012, 21, 1771–1782. [Google Scholar] [CrossRef] [PubMed]
- Lamoreux, E.L.; Chong, E.; Wang, J.J.; Saw, S.M.; Aung, T.; Mitchell, P.; Wong, T.Y. Visual impairment, causes of vision loss, and falls: The singapore malay eye study. Investig. Ophthalmol. Vis. Sci. 2008, 49, 528–533. [Google Scholar] [CrossRef] [PubMed]
- Sharma, S.; Oliver-Fernandez, A.; Liu, W.; Buchholz, P.; Walt, J. The impact of diabetic retinopathy on health-related quality of life. Curr. Opin. Ophthalmol. 2005, 16, 155–159. [Google Scholar] [CrossRef] [PubMed]
- Woodcock, A.; Bradley, C.; Plowright, R.; Ffytche, T.; Kennedy-Martin, T.; Hirsch, A. The influence of diabetic retinopathy on quality of life: Interviews to guide the design of a condition-specific, individualised questionnaire: The RetDQoL. Patient Educ. Couns. 2004, 53, 365–383. [Google Scholar] [CrossRef] [PubMed]
- Rooney, C.; Hadjri, K.; Mcallister, K.; Rooney, M.; Faith, V.; Craig, C. Experiencing visual impairment in a lifetime home: An interpretative phenomenological inquiry. J. Hous. Built Environ. 2018, 33, 45–67. [Google Scholar] [CrossRef] [PubMed]
- Imrie, R. Disability and discourses of mobility and movement. Environ. Plan. A 2000, 32, 1641–1656. [Google Scholar] [CrossRef]
- Imrie, R. Disability and the City: International Perspectives; SAGE Publications Ltd.: Thousand Oaks, CA, USA, 1996; p. 97. [Google Scholar]
- Afrooz, A.E.; Hanaee, T.; Parolin, B. Wayfinding Performance of Visually Impaired Pedestrians in an Urban Area. In Proceedings of the REAL CORP 2012, Schwechat, Austria, 14–16 May 2012; pp. 1081–1091. [Google Scholar]
- Gustafson-Pearce, O.; Billett, E.; Cecelja, F. Perceptual impact of environmental factors in sighted and visually impaired individuals. Br. J. Vis. Impair. 2005, 23, 25–30. [Google Scholar] [CrossRef]
- Jenkins, G.R.; Yuen, H.K.; Vogtle, L.K. Experience of multisensory environments in public space among people with visual impairment. Int. J. Environ. Res. Public Health 2015, 12, 8644–8657. [Google Scholar] [CrossRef] [PubMed]
- Guide Dogs. Inclusive Streets: Design Principles for Blind and Partially Sighted People; Guide Dogs: London, UK, 2010; pp. 3–18. [Google Scholar]
- Kitchin, R.M.; Jacobson, R.D.; Golledge, R.G.; Blades, M. Belfast without sight: Exploring geographies of blindness. Ir. Geogr. 1998, 31, 34–46. [Google Scholar] [CrossRef]
- Norgate, S.H. Accessibility of urban spaces for visually impaired pedestrians. Proc. Inst. Civ. Eng. Munic. Eng. 2012, 165, 231–237. [Google Scholar] [CrossRef]
- Manduchi, R.; Kurniawan, S.; Bagherinia, H. Blind guidance using mobile computer vision: A usability study. In Proceedings of the 12th International ACM SIGACCESS Conference on Computers and Accessibility, Orlando, FL, USA, 25–27 October 2010. [Google Scholar]
- Stevens, R.G.; Rea, M.S. Light in the built environment: Potential role of circadian disruption in endocrine disruption and breast cancer. Cancer Causes Control 2001, 12, 279–287. [Google Scholar] [CrossRef] [PubMed]
- Campisi, T.; Ignaccolo, M.; Inturri, G.; Tesoriere, G.; Torrisi, V. Evaluation of walkability and mobility requirements of visually impaired people in urban spaces. Res. Transp. Bus. Manag. 2021, 40, 100592. [Google Scholar] [CrossRef]
- Havik, E.M.; Steyvers, F.J.; Kooijman, A.C.; Melis-Dankers, B.J. Accessibility of shared space for visually impaired persons: A comparative field study. Br. J. Vis. Impair. 2015, 33, 96–110. [Google Scholar] [CrossRef]
- Timmis, M.A.; Allsop, J.; Baranian, M.; Baker, J.; Basevitch, I.; Latham, K.; Pardhan, S.; van Paridon, K.N. Visual Search Behavior in Individuals with Retinitis Pigmentosa During Level Walking and Obstacle Crossing. In Proceedings of the ARVO 2017, Baltimore, MD, USA, 7–11 May 2017. [Google Scholar]
- Turano, K.A.; Geruschat, D.R.; Baker, F.H.; Stahl, J.W.; Shapiro, M.D. Direction of Gaze while Walking a Simple Route: Persons with Normal Vision and Persons with Retinitis Pigmentosa. Optom. Vis. Sci. 2001, 78, 667–675. [Google Scholar] [CrossRef] [PubMed]
- Vivekananda-Schmidt, P.; Anderson, R.S.; Reinhardt-Rutland, A.H.; Shields, T.J. Simulated impairment of contrast sensitivity: Performance and gaze behavior during locomotion through a built environment. Optom. Vis. Sci. 2004, 81, 844–852. [Google Scholar] [CrossRef] [PubMed]
- Cushley, L.; Galway, N.; Peto, T. The unseen barriers of the built environment: Navigation for people with visual impairment. Town Plan. Rev. 2022, 94, 11–35. [Google Scholar] [CrossRef]
- Habtamu, E.; Bastawrous, A.; Bolster, N.M.; Tadesse, Z.; Callahan, E.K.; Gashaw, B.; Macleod, D.; Burton, M.J. Development and Validation of a Smartphone-based Contrast Sensitivity Test. Transl. Vis. Sci. Technol. 2019, 8, 13. [Google Scholar] [CrossRef] [PubMed]
- Evans, J.; Jones, P. The walking interview: Methodology, mobility and place. Appl. Geogr. 2011, 31, 849–858. [Google Scholar] [CrossRef]
- Springgay, S.; Truman, S.E. Walking Methodologies in a More-Than-Human World: WalkingLab, 1st ed.; Routledge: London, UK, 2019; Volume 1. [Google Scholar]
- Gallagher, M. Landscape Audio In Situ. Contemp. Music. Rev. 2015, 34, 316–326. [Google Scholar] [CrossRef]
- Pink, S. Doing Sensory Ethnography; Sage Publications Ltd.: London, UK, 2009. [Google Scholar]
- Tesoriere, G.; Campisi, T.; Canale, A.; Severino, A. The effects of urban traffic noise on children at kindergarten and primary school: A case study in Enna. In AIP Conference Proceedings 2018; AIP: New York, NY, USA, 2018; Volume 2040. [Google Scholar]
- Braun, V.; Clarke, V. Using thematic analysis in psychology. Qual. Res. Psychol. 2006, 3, 77–101. [Google Scholar] [CrossRef]
- Rosenberg, D.E.; Huang, D.L.; Simonovich, S.D.; Belza, B. Outdoor Built Environment Barriers and Facilitators to Activity among Midlife and Older Adults with Mobility Disabilities. Gerontologist 2013, 53, 268–279. [Google Scholar] [CrossRef] [PubMed]
- Clarke, P.J.; Ailshire, J.A.; Nieuwenhuijsen, E.R.; de Kleijn–de Vrankrijker, M.W. Participation among adults with disability: The role of the urban environment. Soc. Sci. Med. 2011, 72, 1674–1684. [Google Scholar] [CrossRef] [PubMed]
- Basha, R. Disability and Public Space—Case Studies of Prishtina and Prizren. Int. J. Contemp. Archit. 2015, 2, 54–66. [Google Scholar]
- McAllister, K.; McBeth, A.; Galway, N. Autism spectrum condition and the built environment. Cities Health 2022, 6, 1164–1178. [Google Scholar] [CrossRef]
- Tola, G.; Talu, V.; Congiu, T.; Bain, P.; Lindert, J. Built Environment Design and People with Autism Spectrum Disorder (ASD): A Scoping Review. Int. J. Environ. Res. Public Health 2021, 18, 3203. [Google Scholar] [CrossRef] [PubMed]
- Imrie, R. Auto-disabilities: The case of shared space environments. Environ. Plan. A 2012, 44, 2260–2277. [Google Scholar] [CrossRef]
- Lawson, A.; Eskytė, I.; Orchard, M. Pedestrians with Disabilities and Town and City Streets: From Shared to Inclusive Space? J. Public Space 2022, 7, 41–62. [Google Scholar] [CrossRef]
- Renel, W. ‘Auraldiversity’: Defining a Hearing-Centred Perspective to Socially Equitable Design of the Built Environment. Built Environ. 2018, 44, 36–51. [Google Scholar] [CrossRef]
- Kleibusch, K. Wayfinding & Dementia: How Design Can Improve Navigation Among Older Adults in Assisted-Living Facilities. SPNHA Rev. 2018, 14, 25–42. [Google Scholar]
- Brittain, D.R.; Gyurcsik, N.C.; McElroy, M.; Hillard, S.A. General and arthritis-specific barriers to moderate physical activity in women with arthritis. Womens Health Issues 2011, 21, 57–63. [Google Scholar] [CrossRef] [PubMed]
- Black, M.H.; McGarry, S.; Churchill, L.; D’arcy, E.; Dalgleish, J.; Nash, I.; Jones, A.; Tse, T.Y.; Gibson, J.; Bölte, S.; et al. Considerations of the built environment for autistic individuals: A review of the literature. Autism 2022, 26, 1904–1915. [Google Scholar] [CrossRef] [PubMed]
- Association, T.A. Colourful Pedestrian Crossings Letter to Ministers. 2021. Available online: https://accessassociation.co.uk/2021/09/06/colourful-pedestrian-crossings-letter-to-ministers/ (accessed on 3 January 2023).
- Hamilton-Bailie, B. Shared Space: Reconciling People, Places and Traffic. Built Environ. 2008, 34, 161–181. [Google Scholar] [CrossRef]
- Hamilton-Baillie, B. Towards shared space. Urban Des. Int. 2008, 13, 130–138. [Google Scholar] [CrossRef]
- Sbrulli, S. Coronavirus: Social Distancing for the Visually Impaired in Italy, in Coronavirus Pandemic. 2020. BBC News. Available online: https://www.bbc.co.uk/news/in-pictures-53403780 (accessed on 1 March 2021).
- Royal National Institute of the Blind. RNIB Moves Coronavirus Response to Next Stage as It Urges More Government Action; Royal National Institute of the Blind: London, UK, 2020. [Google Scholar]
- IMTAC. Basic Guidelines for the Development of Inclusive Walking, Wheeling1 and Cycling Infrastructure in Response to COVID-19; IMTAC, Ed.; IMTAC: Muscat, Oman, 2020; p. 4. Available online: www.accessibletravelni.org (accessed on 1 February 2021).
Disclaimer/Publisher’s Note: The statements, opinions and data contained in all publications are solely those of the individual author(s) and contributor(s) and not of MDPI and/or the editor(s). MDPI and/or the editor(s) disclaim responsibility for any injury to people or property resulting from any ideas, methods, instructions or products referred to in the content. |
© 2024 by the authors. Licensee MDPI, Basel, Switzerland. This article is an open access article distributed under the terms and conditions of the Creative Commons Attribution (CC BY) license (https://creativecommons.org/licenses/by/4.0/).