Article

Fully Digital Audio Haptic Maps for Individuals with Blindness

1
Department of Electrical Engineering, University of South Florida, Tampa, FL 33620, USA
2
Department of Chemical, Biological and Materials Engineering, University of South Florida, Tampa, FL 33620, USA
*
Author to whom correspondence should be addressed.
Disabilities 2024, 4(1), 64-78; https://doi.org/10.3390/disabilities4010005
Submission received: 29 September 2023 / Revised: 31 December 2023 / Accepted: 4 January 2024 / Published: 9 January 2024

Abstract

:
Tactile maps designed for individuals with blindness can greatly improve their mobility, safety and access to new locations. While 3D-printed maps have already been demonstrated to be a powerful tool for delivering spatial information, they might not always be available. Alternatively, a combination of audio and haptic information can be used to efficiently encode 2D maps. In this paper, we discuss the development and user-testing of a novel audio-haptic map creator application. Maps created using this application can provide people with blindness with a tool for understanding the navigational routes and layouts of spaces before physically visiting the site. Thirteen people with blindness tested various components of the virtual map application, such as audio, haptic feedback and navigation controls. Participants’ data and feedback were collected and analyzed to determine the effectiveness of the virtual maps as it relates to this user group’s readability and usability. The study showed that it was easy to use and that it efficiently delivered information about travel routes and landmarks that the participants could successfully understand.

1. Introduction

Tactile maps are used for the effective delivery of spatial information to people with blindness [1,2,3,4,5,6]. They offer an efficient way to introduce a new space to individuals with blindness, far surpassing verbal descriptions [7,8]. Additionally, it was demonstrated that the combination of audio and tactile information is significantly more powerful than just a verbal description [9,10]. Before physically visiting a location, users can efficiently establish connections to reference points using tactile maps, aiding in the creation of mental mini-maps for a better understanding and navigation of the environment [11,12]. The use of tactile maps, both before and during navigation, not only enhances cognitive map formation but also improves overall navigation success, cognitive awareness, wayfinding, and spatial knowledge [13,14,15]. Additionally, tactile maps contribute to better decision-making, environmental knowledge, and independent travel, ultimately improving the quality of life for individuals with blindness [16,17,18].
There are many ways to create tactile maps, including 3D printing, embossing, thermoforming, handcrafting from materials, or using swell paper [3,4,5,19,20,21]. This introduces delays lasting from hours to weeks, depending on the availability of the production method. The approach that we investigate in this study requires the use of an Microsoft XBOX gamepad manufactured in China (2019), which can be purchased once and then used for reading all maps without any delays. Also, one of the great benefits of fully digital maps is that they can be easily shared and accessed on-demand. Tactile maps can be supplemented by audio, as presented by Talking Tactile Tablet (TTT), Tactile Maps Automated Production (TMAP), and LucentMaps [22,23,24,25]. While there are many types of accessible digital maps based on pin arrays [26], tactile overlays [27], force feedback, and vibrotactile feedback, these maps are typically proprietary and require the use of expensive hardware and software. Our approach is based on a widely available web interface and XBOX 360 gamepad, which makes the technology highly accessible to the end user.
There are multiple new technologies supporting indoor navigation using Bluetooth, Location Beacons, and mobile apps. For example, travelers with low vision or blindness often use third party apps, such as BlindSquare 5.56, to access live turn-by-turn directions for outdoor navigation. Clew 1.6.9 is a path-retracing app designed for blind and visually impaired users to help them independently return to any desired location [28]. Seeing AI 5.2.1 is another indoor navigation app [29]. The first generation of indoor navigation began with bar codes and beacons that were physically placed in strategic locations, and the information was relayed to the person walking past [30,31]. An example of a beacon-based app is NavCog 3 iPhone indoor navigation app., which achieves accurate localization using a novel algorithm which combines Bluetooth Low Energy Beacons and smartphone sensors [32]. Seeing AI uses artificial intelligence to map indoor locations and to create indoor routes with virtual beacons. Additionally, there are also four blindness-aware mobile navigation apps: Nearby ExplorerVer. 1.511 for Android, The Seeing Eye GPS 3.7.4 App, BlindSquare [33] and WeWALK 3.4.3 App for blind and low-vision navigation [34]. A mobile assistive application called “GuiderMoi” Ver. 1.2 retrieves information about directions using color targets and identifies the next orientation for the visually impaired [35]. Finally, Azure Maps can be used to create indoor maps from any CAD file for private or public web or mobile applications [36]. All these approaches are typically used in real-time at the navigation location, while the method that we propose helps the user learn about the routes and the environment prior to the visit, allowing them to much better prepare for orientation in a new environment and supporting their planning.
There have been multiple studies evaluating the use of haptic feedback and touch screens for tactile maps [37,38,39,40,41]. While they show significant promise in some tasks, the interaction interfaces are very limited by the devices (e.g., continuous direct manual exploration). In this study, we wanted to evaluate if additional buttons and controls might assist the users by providing additional ways to interact with the map (e.g., jumping from one landmark to another).
In this study, we investigate a fully digital form of map designed for individuals with blindness using a combination of haptically provided spatial information and audio signals describing specific landmarks. We also created an application that allows for the web-based creation of audio-haptic maps that can be directly used by the future users and researchers. As a control and read-out device, we chose an XBOX gamepad. There was a study demonstrating that the XBOX gamepad’s high- and low-frequency vibrations can be used to represent various colors to blind participants [42]. Game developers have also utilized audio haptic feedback not only to enhance gameplay experiences for sighted individuals, but also as accessibility features that allow for blind and visually impaired game players to enjoy the same video games as everyone else. Companies such as Microsoft have also explored Adaptive Controllers with a built-in Braille display [43]. A paper published on the BlindAudio Tactile System (BATS) demonstrated the successful use of a Logitech Wingman Rumble gamepad by blind individuals on a virtual map of Roman Britain [44], where haptic vibrations were used for sensing state and county boundaries. Studies have shown that using both audio and haptic feedback can benefit cognitive skills, specifically the orientation and mobility of individuals with blindness [45]. The haptic visualizations of charts, networks, and maps helps users to effectively understand those structures [46]. Similarly, a study on the TouchOver map showed that both basic audio prompts, given as speech descriptions of map components, and haptic vibration feedback were successful in enabling users to follow streets and obtain a basic overview of the location [47]. The biggest limitation of the vibrotactile maps presented on touchscreen devices [39,40,47] is that the map size is limited by the size of the screen. Without looking at the screen, users cannot scroll through the map and virtually extend it, because this scrolling would disorient the user. The addition of raised or embossed paper or Swell maps placed on a multitouch device, such as a Santo display, connected to a computer to provide an audio output of the user’s location, provides another method for multimodal maps for the blind [48]. Other contemporary technologies such as augmented reality (AR) have been implemented, along with audio feedback, for the real-time navigation of interior and exterior locations [49].
Our research question was “Is a gamepad viable as a tool for people with blindness to be able to explore interactive digital maps?” Based on previous studies, we concluded that hybrid modalities combining audio descriptions with the spatial information delivered using haptic feedback can be used for the convenient delivery of 2D map information and we conducted several sets of experiments to confirm this theoretical conclusion. Specifically, we wanted to check if these maps can be studied before navigation to build a mental map of the location. The rest of the paper describes the iterative development of the haptic technology and its integration with the audio description. Each of the consecutive experiments tests the next level of functionality, starting from simple scenarios and progressing to the actual map designs. Each of the steps is evaluated by real-world users, and their feedback is continuously implemented into the next iteration of the haptic audio maps.

2. Materials and Methods

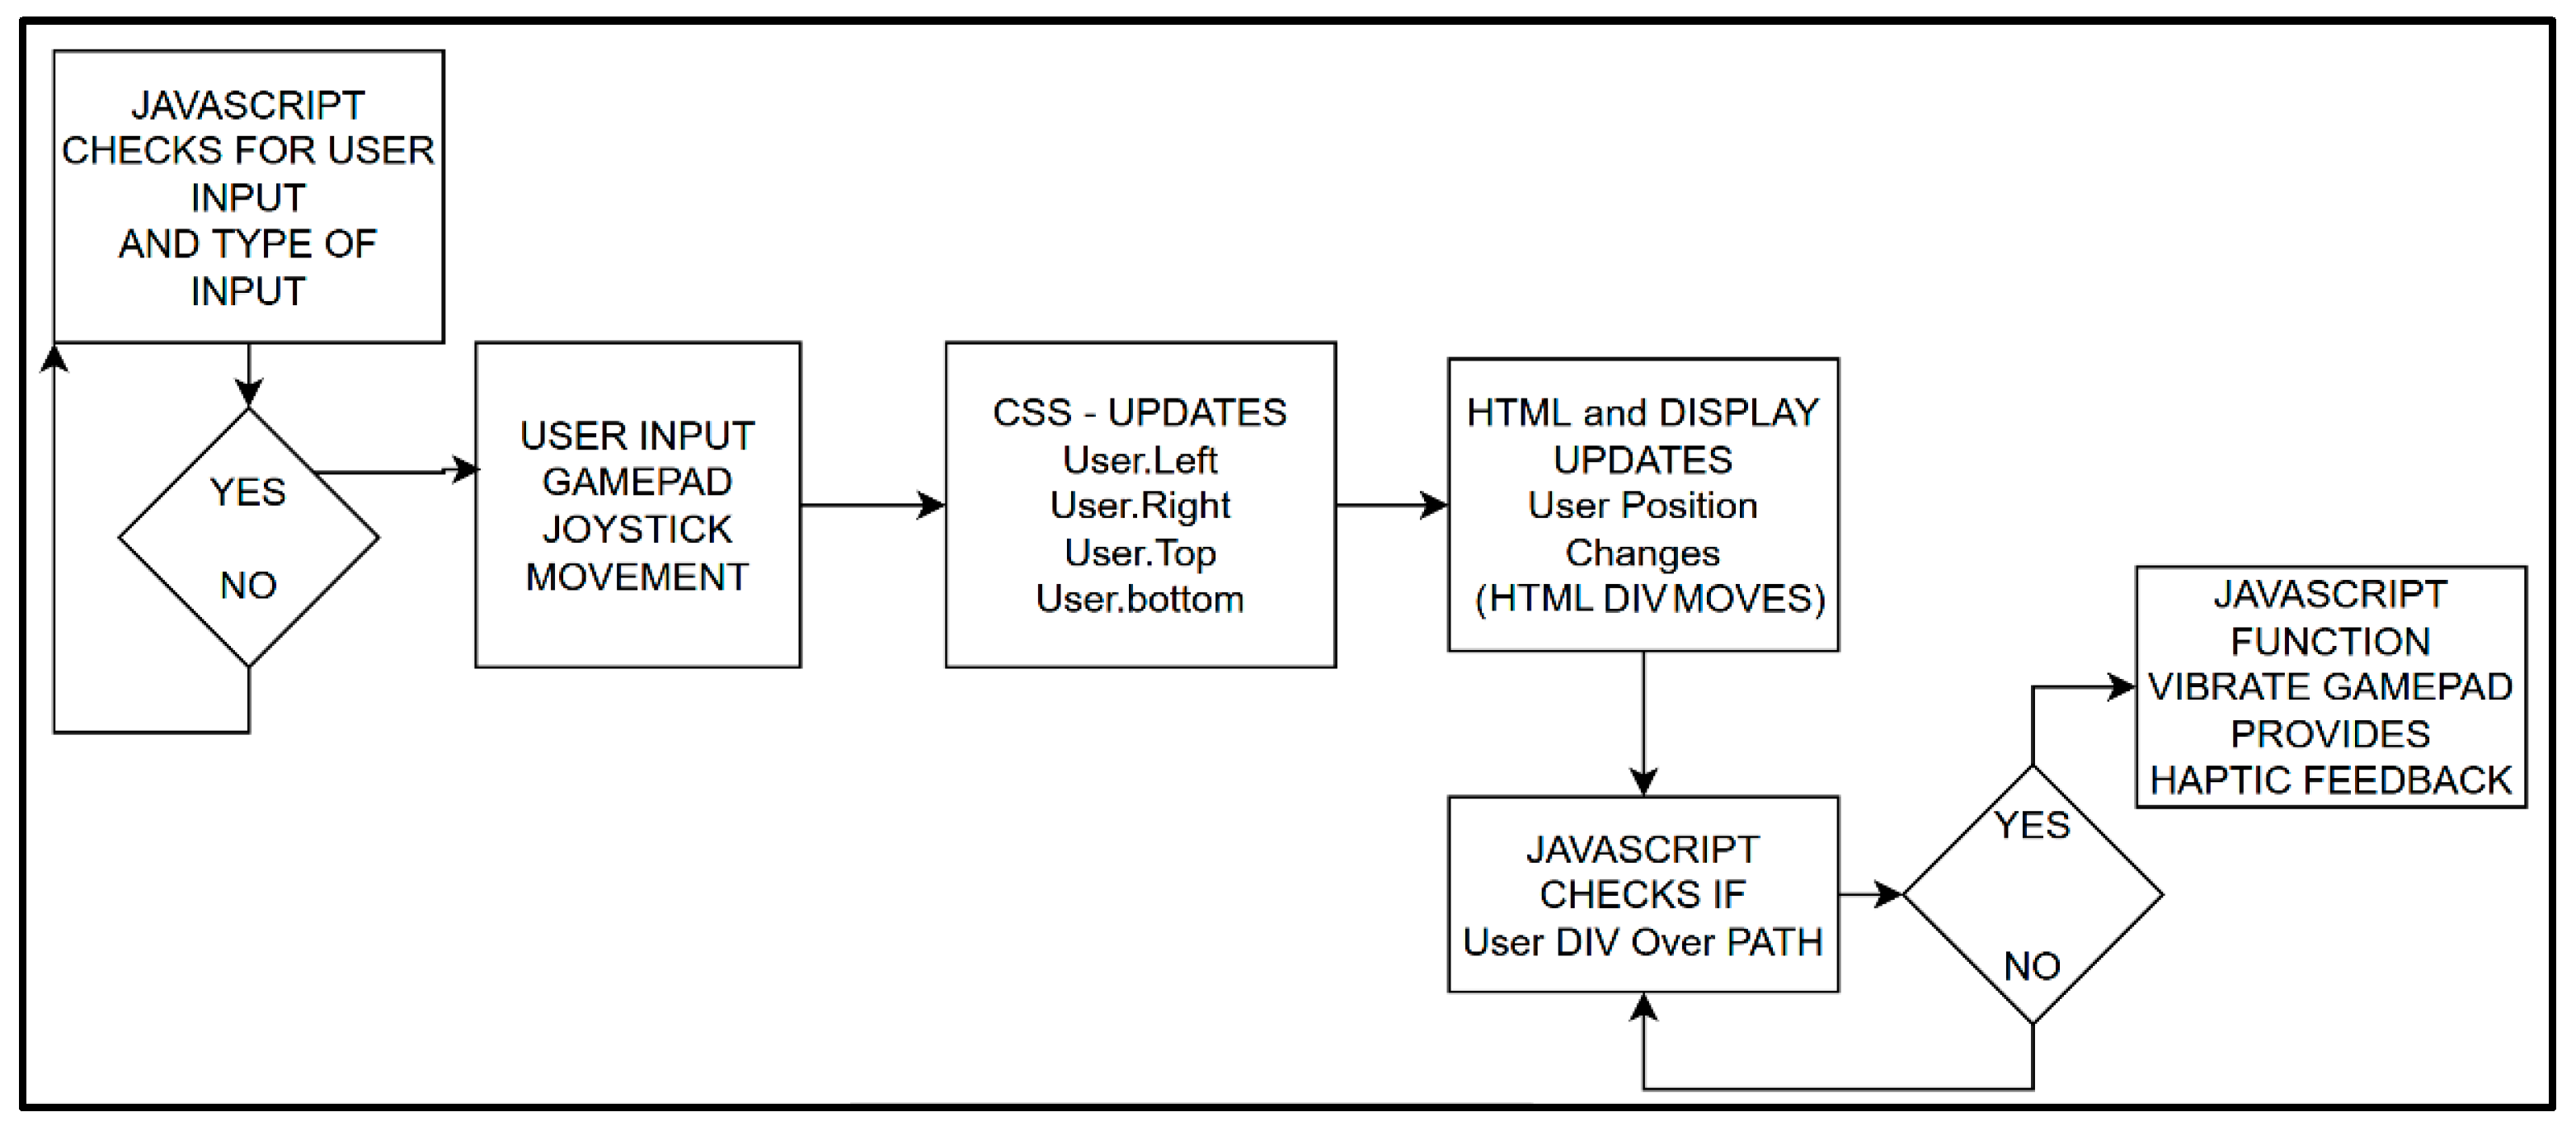
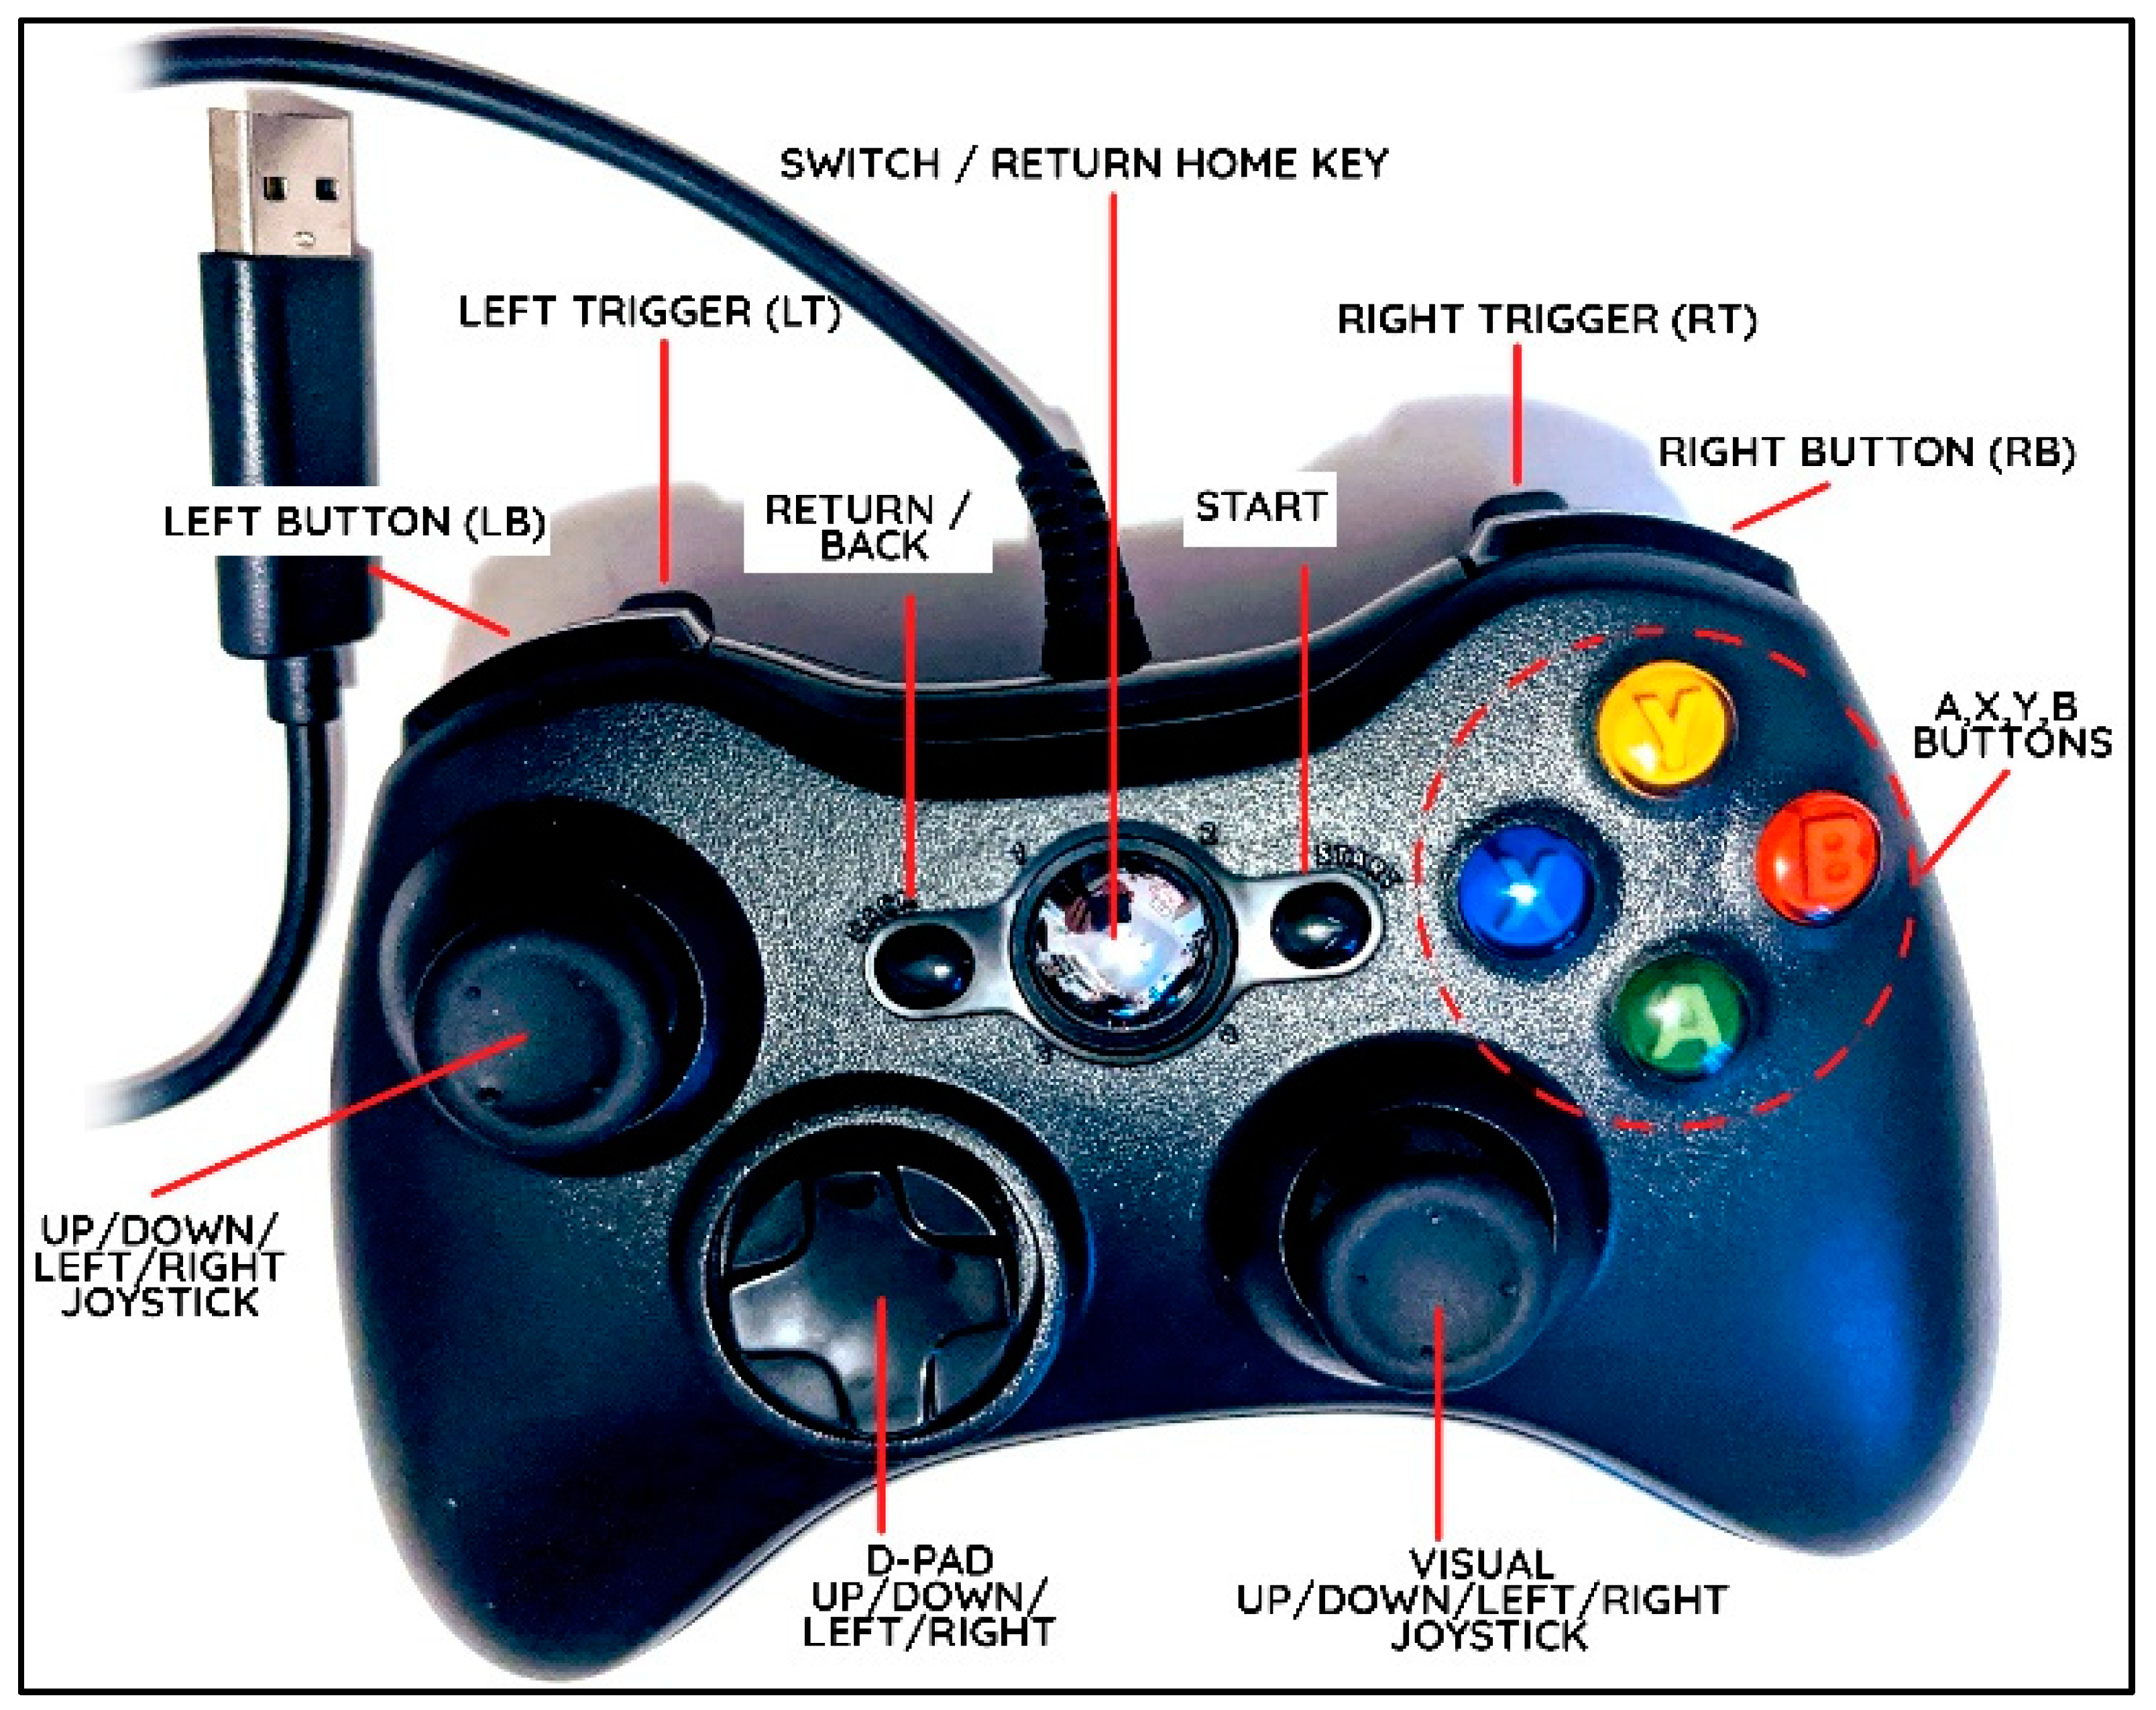
2.1. Audio-Haptic Map Creator Application Development

All audio haptic maps created and evaluated in this study were constructed using our custom-made Audio-haptic Map Creator Application. This application was developed using HTML5, CSS 4.15, and JavaScript ES2022 (a diagram is shown in Figure 1). HTML5 is used to provide the main visual display feedback to the user and is where the main application functions. CSS is used to style the application, such as the colors, margins, and layout. JavaScript is used to provide functionality and updates HTML and CSS with the proper display based on the user input (mouse, keyboard and/or gamepad).
The application runs in most modern browsers that support the necessary Gamepad API functions [50]. However, some browsers, such as Firefox and Safari, currently do not support some of the functions required for this application, such as the hapticActuators used for interfacing with the haptic feedback hardware. The Gamepad API (2021) provides a way for web applications to directly interface with gamepad data. The low-level implementation allows for programming that provides access to hardware features. The web application works with Chromium bowsers such as Microsoft Edge 79 and the recommended Google Chrome 88 [50], with the recommended gamepad being XBOX 360 (Figure 2). However, most generic USB gamepads will work [51]. The main requirement is that the gamepad needs to have rumble motors providing vibrations that can be used for the haptic feedback. We have successfully used the XBOX 360, GameSir G3s (2016), and PlayStation 4 gamepads.
The Audio-haptic Map Creator application uses JavaScript to query input and supply functionality to and from the application and gamepad device. There are two input types that are used to provide user input: buttons and movement using a joystick. User interactions with the buttons and joysticks are collected using JavaScript. The application also uses the web browsers native text-to-speech API that supports the audio component of the map. The application allows users to add text to their map, and when the user travels over the text, a JavaScript function calls on the API SpeechSynthesis to automatically read the text data as audio.
Another important aspect of the application is that it can be used from, and saves the map data on, the client side. When the user is finished creating their map, they can save the entire application to their computer, including the map they created. They can then share and/or edit it later by opening it in the browser. The elements positions are all stored in the HTML document itself, including the paths’ data. This was achieved using SVG polyline and JavaScript drawLine, which stores the 2D point coordinates (x,y positions) of the line.

2.2. Participants and Recruitment

A total of 13 participants with blindness (8 female and 5 male), ranging in age from 19 to 72, tested the application (Table 1). Each participant was seated in front of a computer and handed a gamepad. The participant was given a verbal description of the study procedure and asked if they had any questions or concerns prior to the start of the tasks. The participants’ age, age of blindness, gender, preferred mobility device, experience with haptic devices, and experience with the gamepads was collected.
The application was loaded to the task screen during each study component. The participant was handed a gamepad and given a verbal description of the gamepad layout, including the button names and locations, and what each item was used for in the application. If needed, assistance locating the buttons was also provided by physically guiding and moving the participant’s figures and hands into position. The study was approved by the University of South Florida’s Internal Review Board (IRB), and each participant gave verbal consent. The study was conducted in three main parts, with each consisting of multiple tasks: Part 1: Baseline, Calibration, and Training; Part 2: Map Reading; Part 3: Usability Survey. The three parts were designed to capture specific data related to various application features, such as audio, haptic vibration feedback, and user controls during navigation tasks, as well as the participants’ feedback regarding the quality of the feature and its overall application. During the first two parts of the study, participants were asked to complete various tasks and data were collected and later analyzed to measure the application’s readability and usability.

2.3. Usability Methodology

Our study was based on the PrincipLes for Evaluating Usability of Multimodal Video Games for people who are Blind (PLUMB) and Standard List of Usability Problems (SLUP) [52,53,54]. The SLUP provides usability problems related to Audio, Adaptation, Interaction Mode and Feedback. The expert input for our studies was obtained early on, before the development of the system, from the Student Accessibility Services department at the University of South Florida. The study was designed using the SLUP recommendation to avoid recurrent usability issues occurring in the early design stages. Since this application is a multimodal prototype, our aim was to include end-users in system testing at the earliest stages so that we could first determine if this type of audio–haptic interface for maps would be acceptable and usable for people with blindness, and then to analyze potentially problematic parts of the system–gamepad, audio output, and web interface. PLUMB were also very helpful for the proper planning and the usability evaluation of our multimodal system based on audio and haptics. In this prototype study, the end-user (a person with blindness) included in the research not only tests the usability of a gamepad device, but also provides feedback regarding the design (layout) of the buttons designated for interaction, and the features (paths, landmarks, and audio components) of the application. Through the various tasks, and with the help of the researchers and observers, the group was able to identify usability issue sources, such as speed and path size, and obtain direct information about how people who are blind use the multimodal map application.
Our task-based study addresses the frequent usability issues that occur in multimodal interfaces, such as Interaction Mode, Feedback, and Adaptation, by enabling the person creating the map (in this case, researchers) to adjust and customize the features during the tasks, such as the path size, audio locations, and speed, as the participants note these issues verbally, and/or as the researchers observe task-based issues. This allows us, as researchers and developers, to determine the optimal parameters for each user, and identify outliers (problem areas for certain user types of users, such as older adults), which could lead to more consistent or general user preference and performance outcomes in future versions of the application.

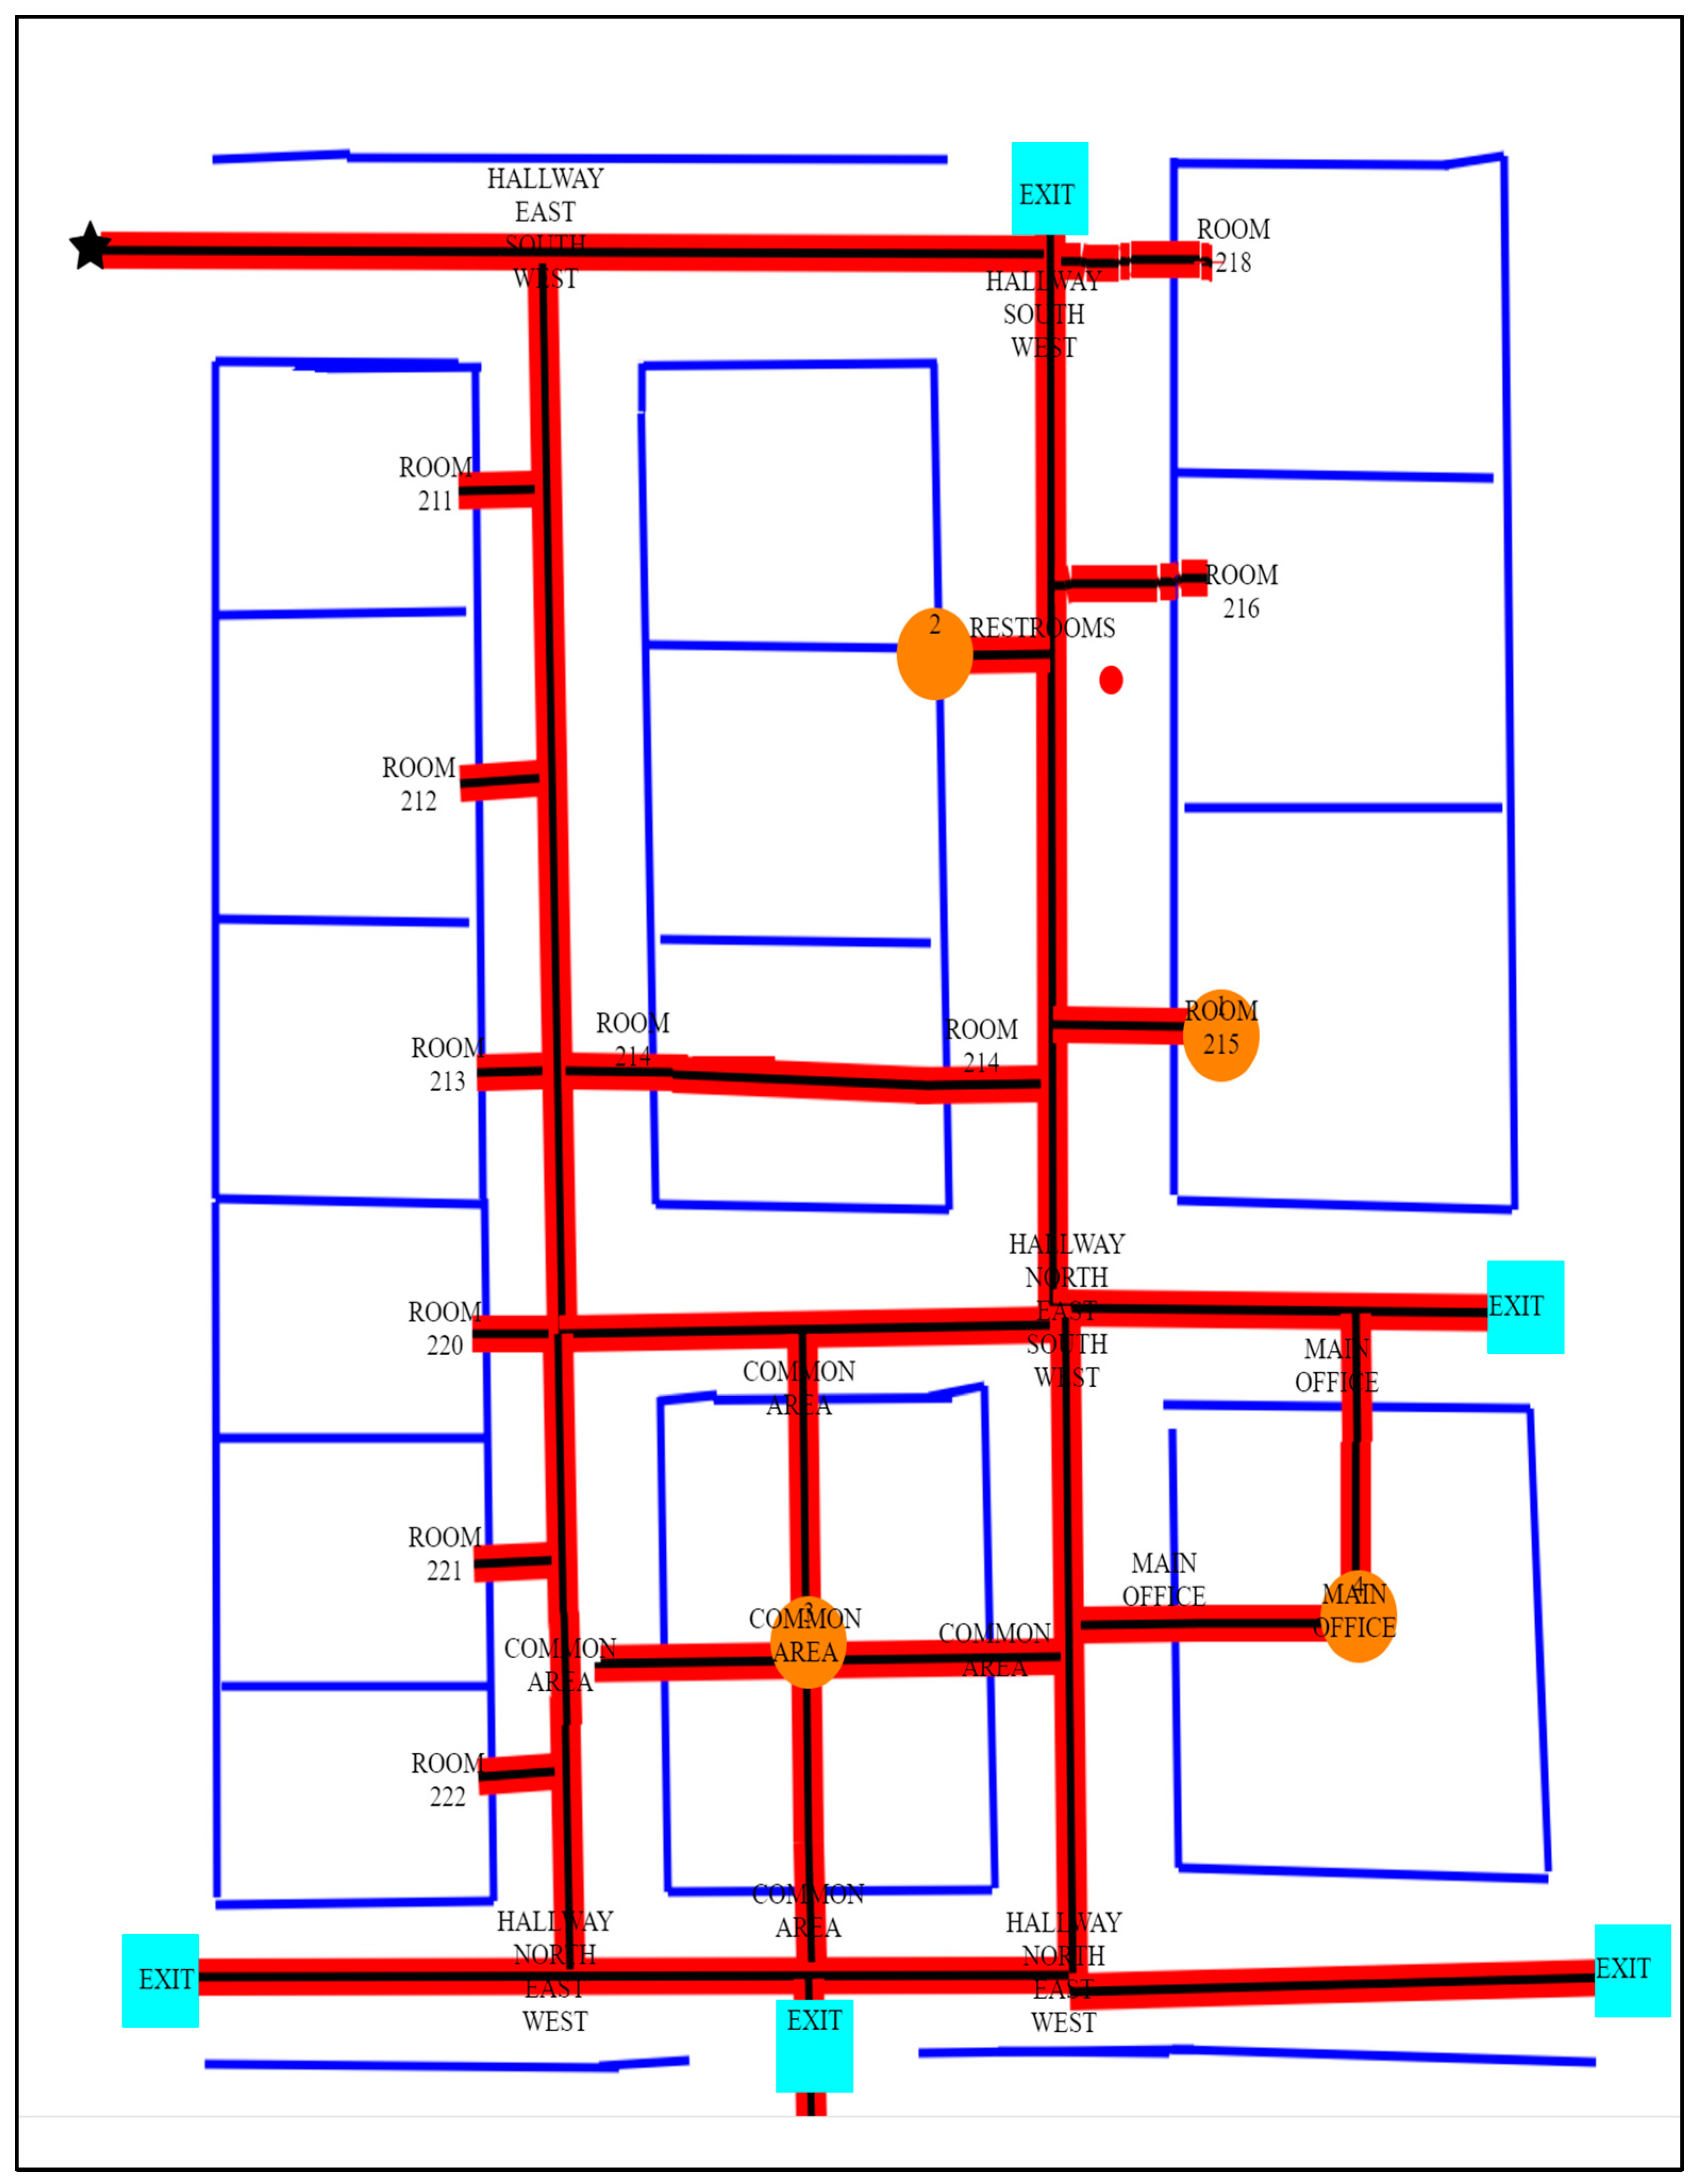
3. Experimental Results

3.1. Study: Part1: Baseline, Calibration, and Training

At the beginning of the study, a researcher described the application; then, the gamepad is controlled by the participant both verbally and through the researcher’s assisting them with hand and finger placement on the gamepad and its associated buttons and joystick controls. This initial training ranged in time from 5 to 15 min. Once the participant verbally communicated that they were ready to start, a baseline speed calibration task was initiated. Calibration was necessary to determine the speed at which the user navigation icon moved over the travel line when the participant used the gamepad joystick that initiated haptic feedback (Figure 3). Participants were not told that anything (haptic feedback) would happen prior to this task. This vibration feedback aligned with the application’s navigation icon and communicated to the participant that they were moving along or over a travel path when they used the gamepad joystick. For the calibration, the application’s user navigation icon speed was set to the fastest setting of 5. The haptic vibration was always of the same intensity; however, the cursor moved slower and took longer to move along the path. When the cursor stays on the active pixels for longer, the vibration lasts longer and can be easier to feel.
The participant used the gamepad “A” button to position the navigation icon at the top of the task drawing, as indicated to the participant verbally through audio feedback comprising the word “Start”, and visually to the researcher or map creator through the star icon in Figure 3. After that, the participant was instructed to move the joystick up and down five times and wait no more than five seconds after each move. If the participant made no verbal or any other observed hand movement or expression, the researcher adjusted the speed level to the next slowest speed. This process was repeated until the participant reacted. Examples of a reaction included: “Oh, um, it’s moving”, and “I feel it vibrating”. It should be noted that even after the participant responded to a faster speed setting, the researchers continued the experiment for all speed levels, going from 5 (fastest speed) to 1 (slowest speed). It was observed that once the participant felt feedback at a higher speed, they could feel the haptic vibration at slower speeds. The average calibration speed setting for the 13 participants was 4.3, with the fastest speed setting being 5 and the slowest being 3.
The next task was focused on determining an optimal speed that allows for a continuous non-straight path to be tracked. Again, tracking began at the “Start” location. The user had to use the haptic feedback at different speed settings and follow a path without any assistance. For this task, the researchers designed two different travel paths (A and B) and randomly provided the participants with one of the paths (Figure 4). Six participants completed the task using path A, and seven completed the task using path B. Participants were asked to restart from the start position if they went off track or got lost and could not return to the travel path. The duration of the task was not recorded since this was part of the baseline, calibration, and training. The speed setting was adjusted up and down during the task to determine the speed at which the participant could accurately follow the path. The vibration feedback was continuously provided when the user navigation icon remained on the path. The researchers collected the number of adjustments made for each user, as well as the most effective speed, as determined by the participants’ ability to complete the navigation along the travel path from the start to the end (Table 2). If the participant did not like or had difficulty with the higher speed setting, it was decreased. When path-following was successful, the researchers asked the participants if they preferred that specific speed. They asked the participant: “Do you like this speed or is it too slow or fast?”. Their responses were recorded. It was concluded that the average speed setting allowing for accurate path-following was approximately 1.7, with approximately 2.8 adjustments made during the task, and the participants’ preferred speed was approximately 2.4. This indicated that even though the participants liked the faster speed for navigation along the haptic path, a slower speed was required to maintain accurate path-following.
For the final task of part 1, the study participants were asked to explore a multi-section path (Figure 5) using the gamepad’s Left Joystick, A-button (moving user back to start “star” position), and the Right Trigger. When the user presses the Right Trigger button, the user navigation icon is repositioned to a landmark icon and the text associated with that landmark is read aloud via the application’s text-to-audio feature. If more than one landmark icon is present on the display, the user is repositioned or jumped to the next landmark each time they press the Right Trigger button. The graphic for this task consisted of a start position (star icon), zig-zag travel path, and four landmarks. The landmarks were labeled as follows: ROOM 7, RESTROOM, ROOM 3, and OFFICE (Figure 5). Participants were given as much time as they needed and allowed to ask questions during the task. The user navigation icon speed was set to the most accurate speed from the Path Accuracy Task and adjusted if needed. The participants were asked how many landmarks were on the map, and how they would describe the travel path. The user navigation icon speed, time to complete the exploration task, a description of the graphic, how many times assistance was requested, and observational data were collected (Table 3).
All of the participants were able to correctly identify the names and total number of landmarks. The average user navigation icon speed for this task was 1.3, with an average task time of 5 min 26 s. Help was requested a total of six times from three participants. One of the participants (P2) needed assistance and started over four times during the task. This participant needed help with both the trigger button and keeping the user navigation icon on the path. One of the other participants asked, “Am I on the path?”, and started over twice. The other participant asked if there was more to the graphic and continued exploring. Descriptions of the graphic varied but displayed similarities in overall shape and direction (Table 3).

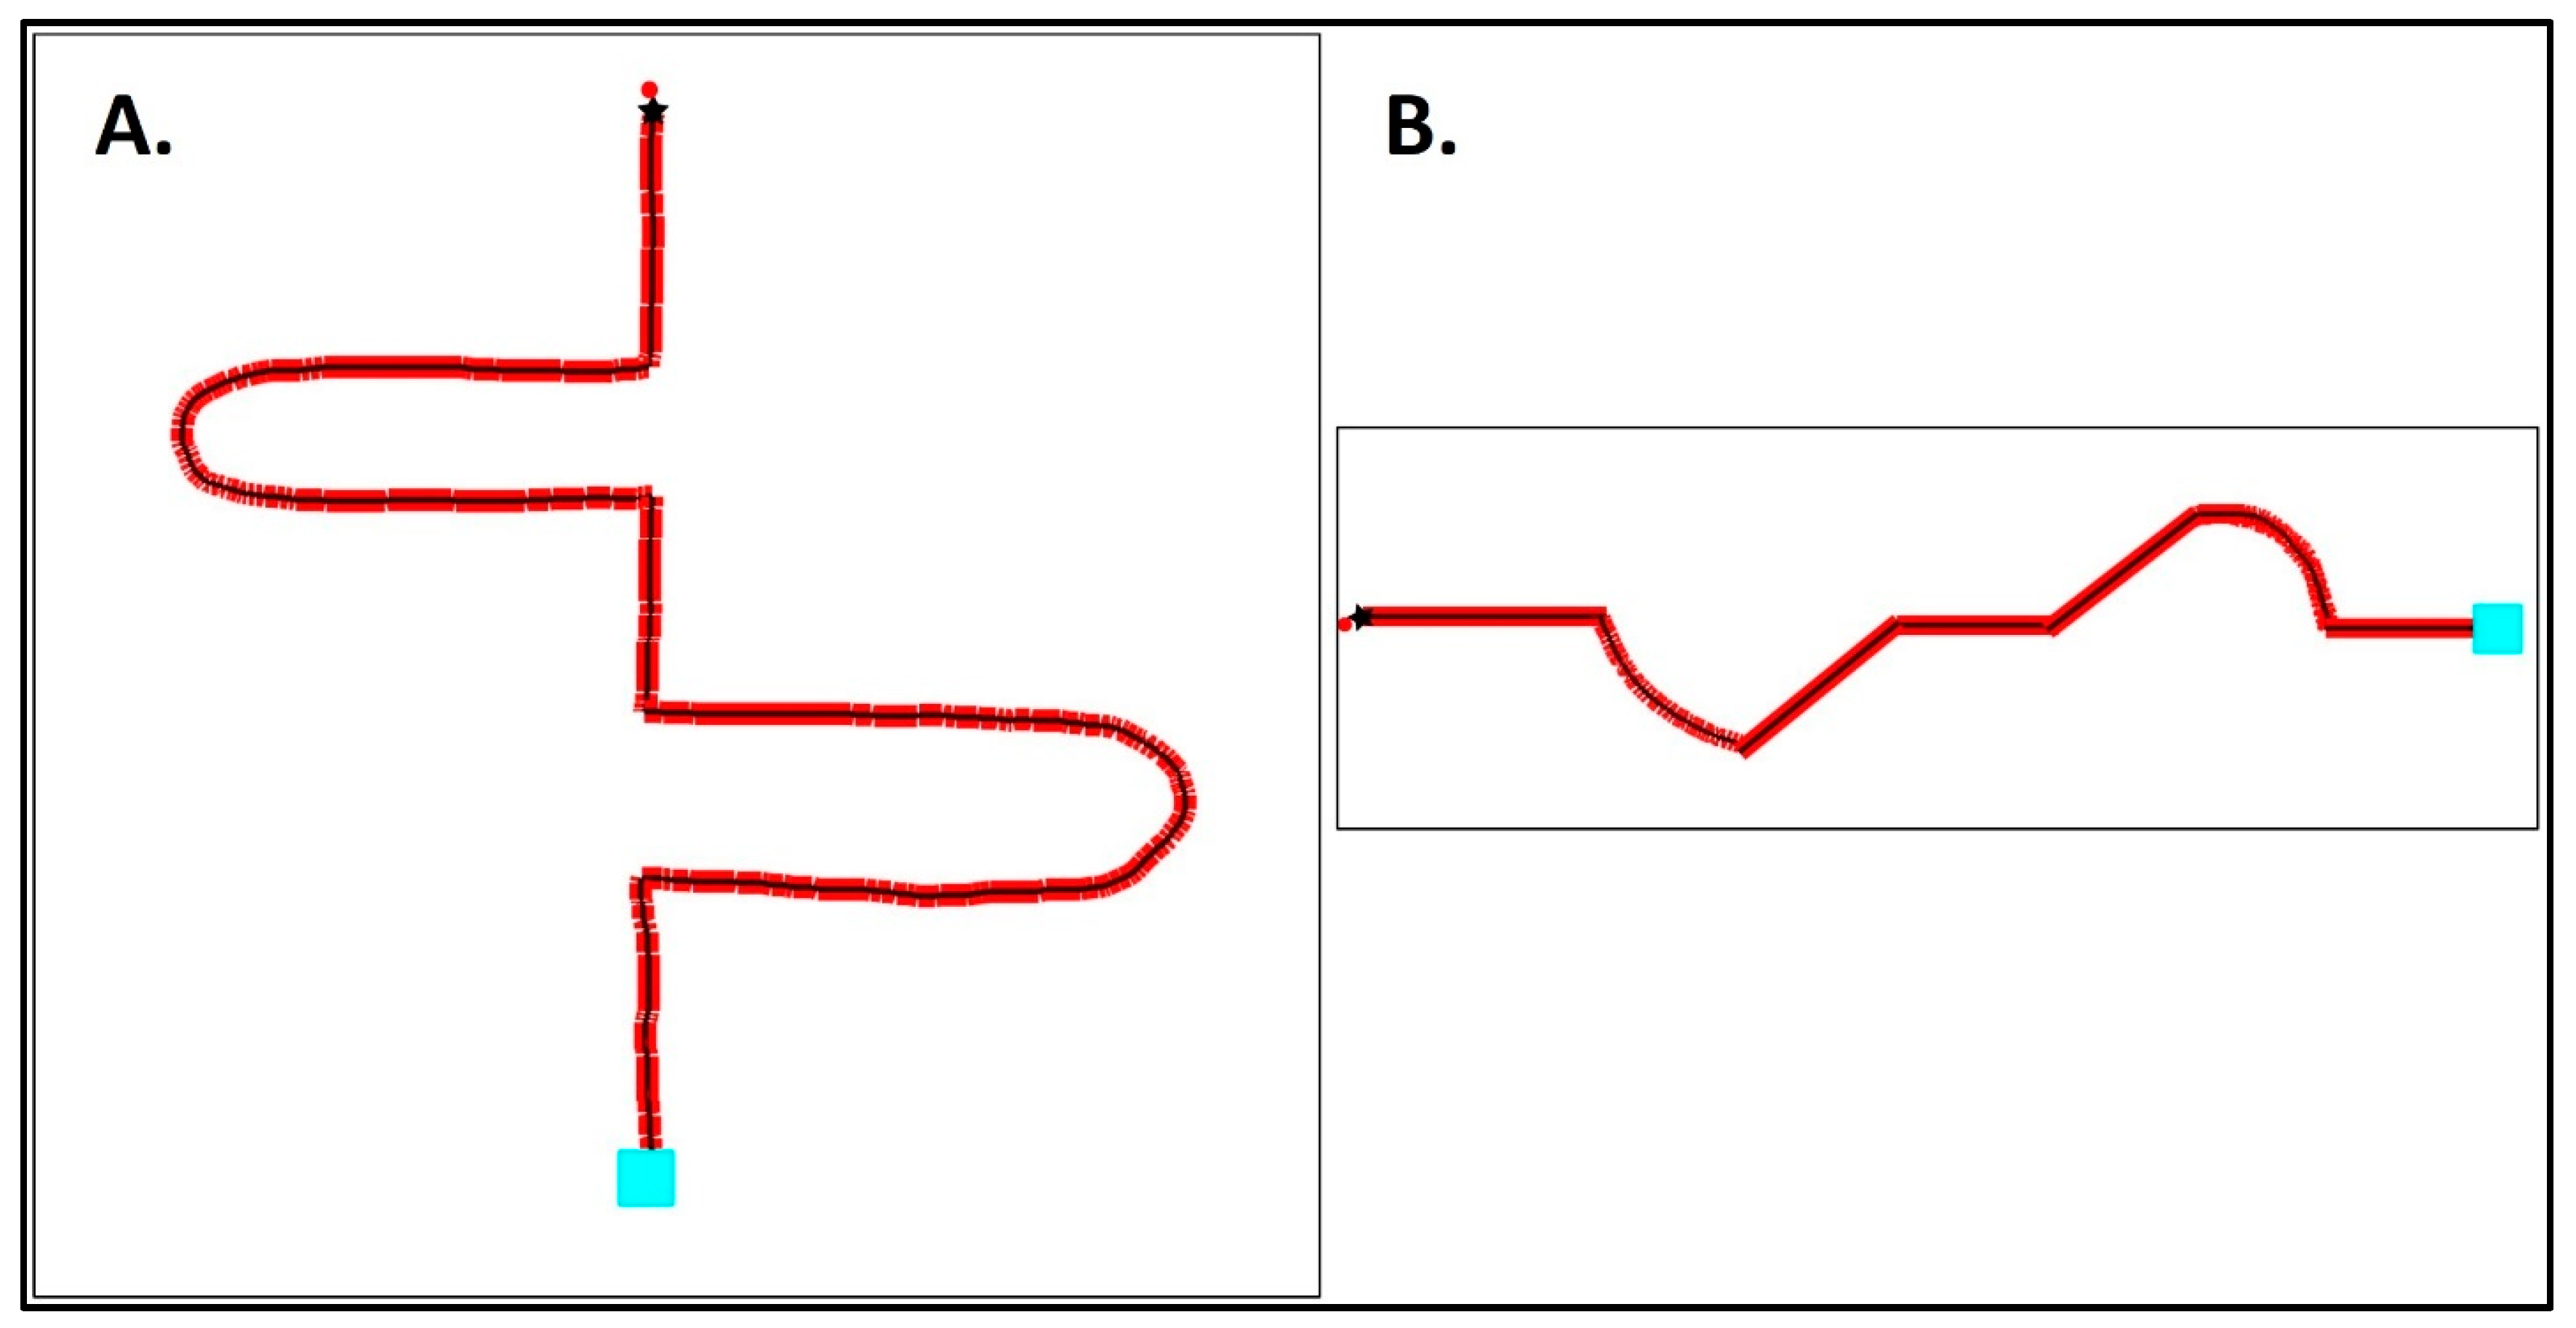
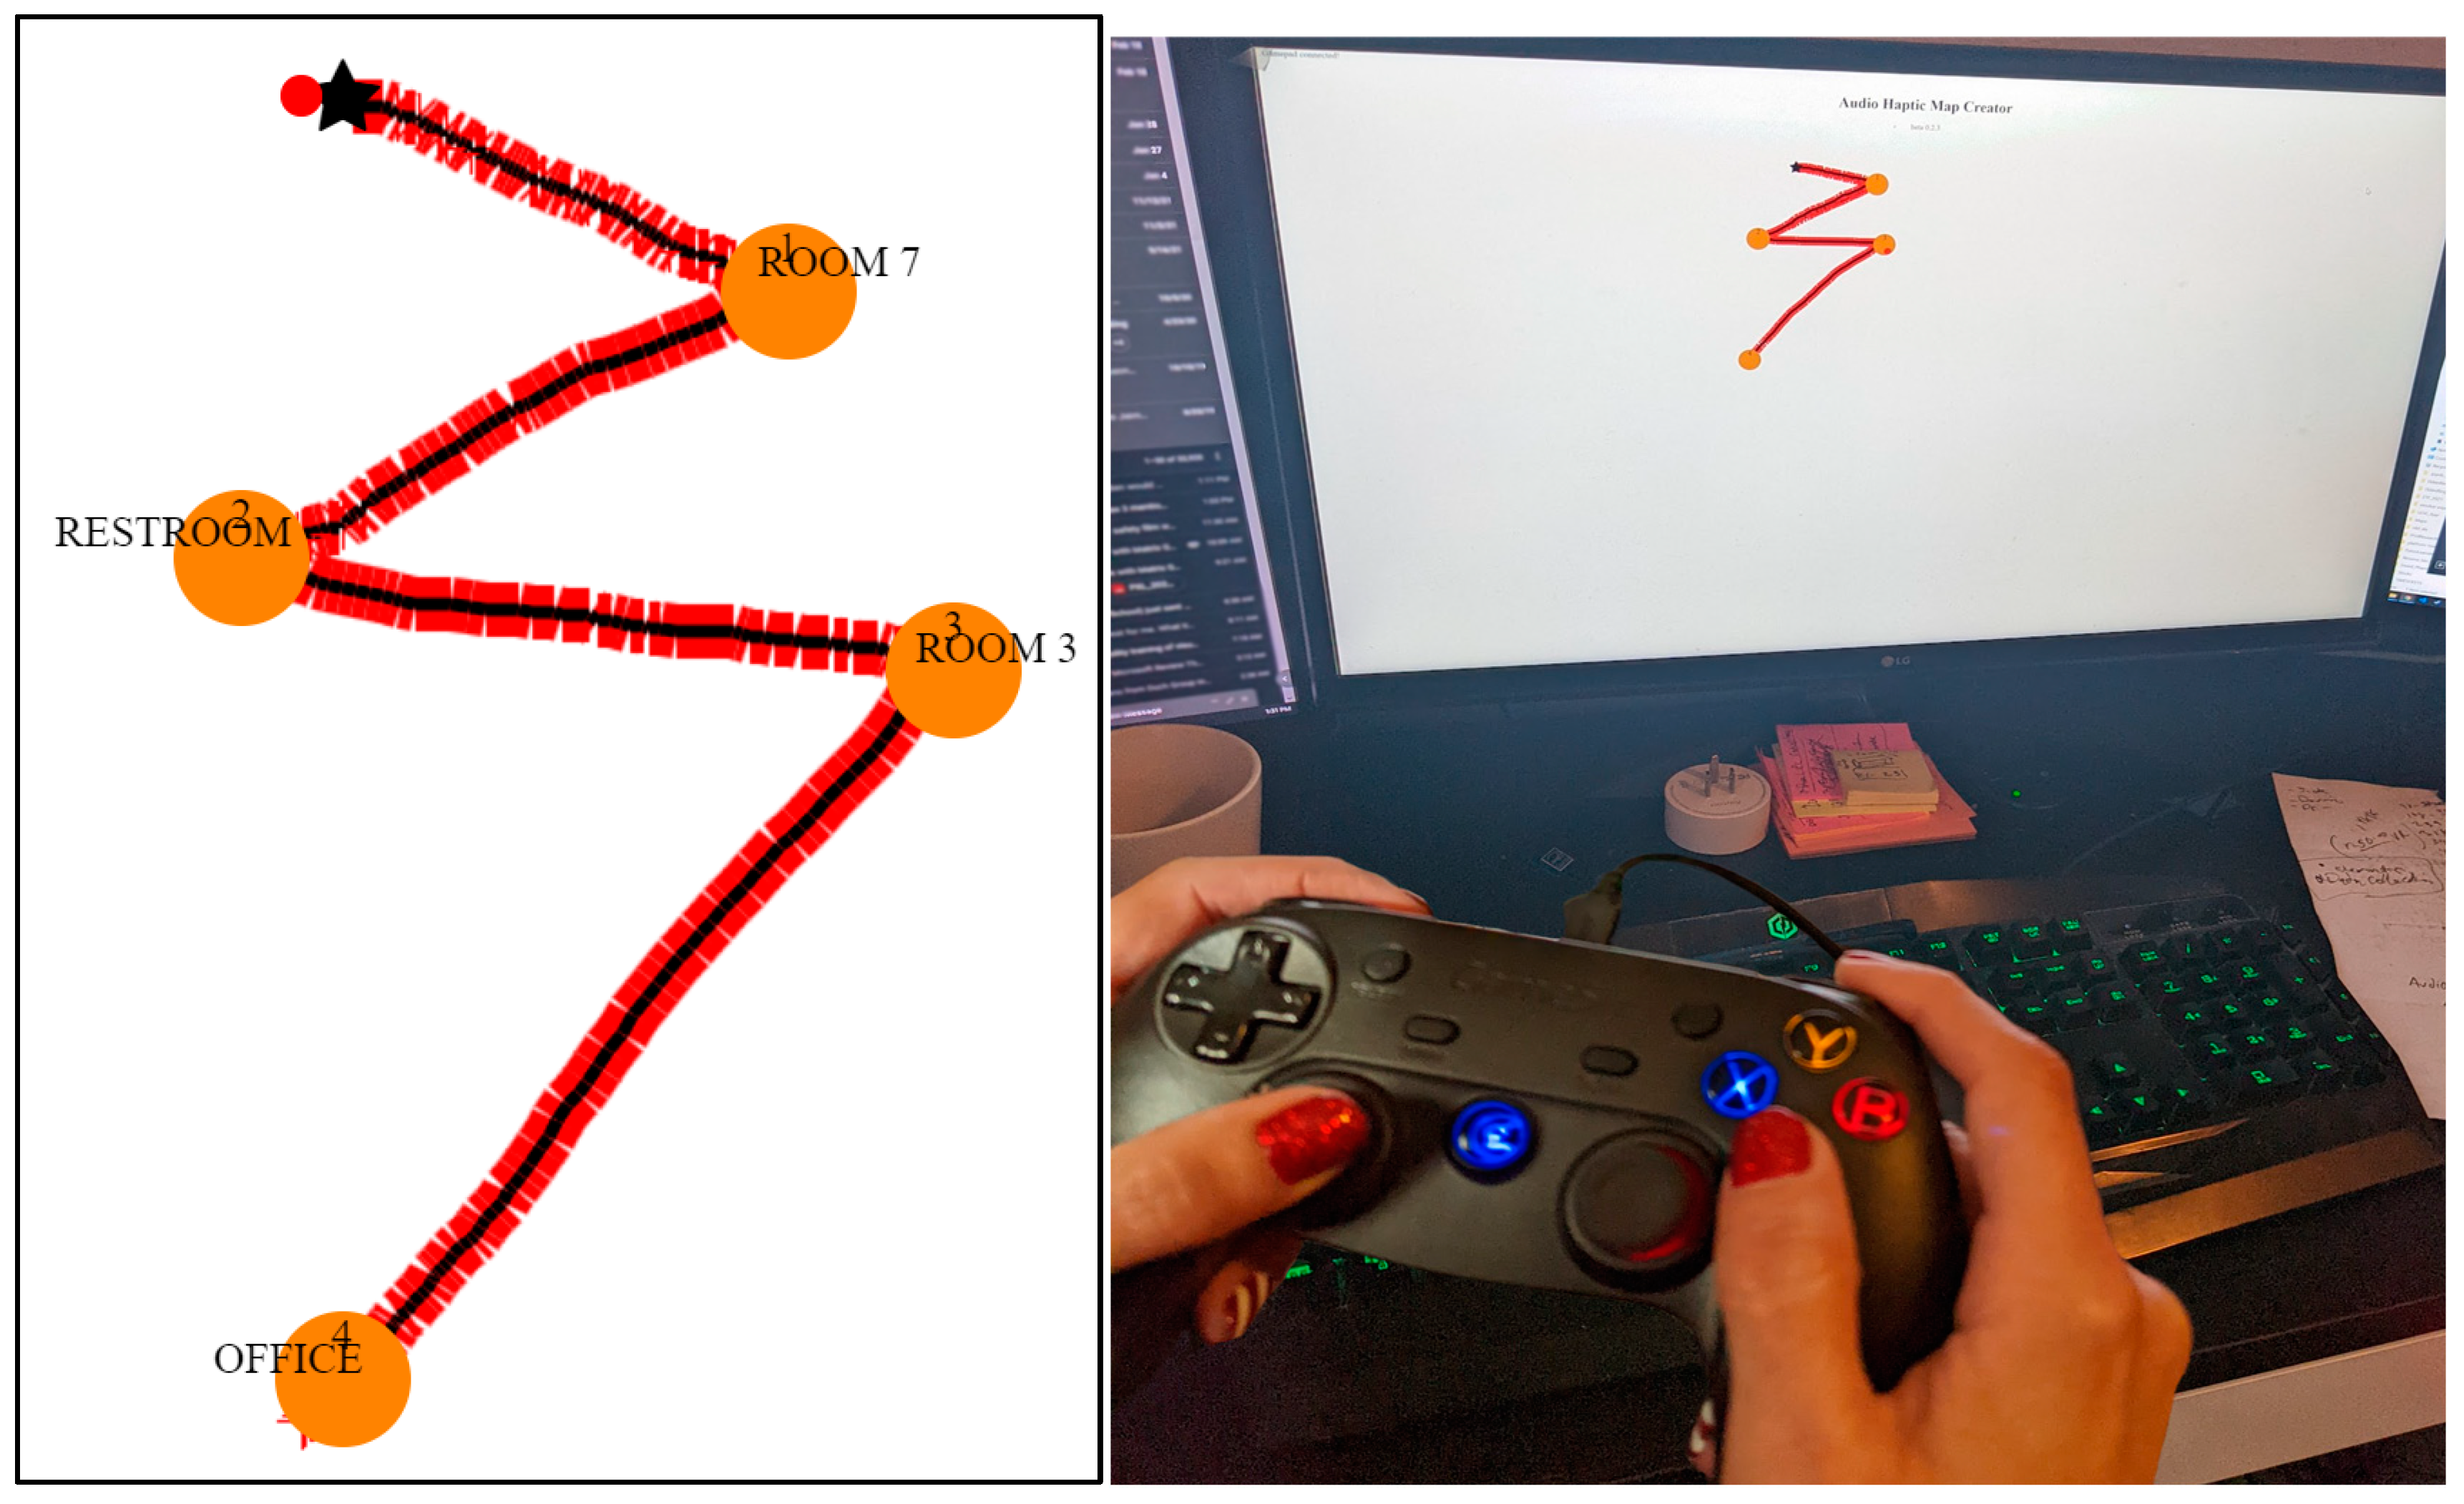
3.2. Study: Part 2: Map Reading

The next part of the study, Map Reading, consisted of three tasks involving the same map (Figure 6). Participants completed one task at a time, focusing on either wayfinding and navigation or orientation. The first two tasks required the participants to start at a specific point on the map and navigate to a given destination using the haptic feedback provided by the gamepad and the audio communication that was initiated when the user passed over a text label as they moved the joystick along the path. The third task focused on the landmarks and their orientation from three predetermined locations on the map. Participants were not given assistance during the three tasks.
During the first two tasks, before starting the experiment, the user navigation icon was set at a specific location. For the first map-reading and path-following, participants had to navigate from the “Start” (Star) position to Room 215. Participants could take any route that they wanted, as long as they stayed on the travel path. The second map-reading and path-following task had the participants start at Room 215 and find and travel to the nearest building exit. Going through walls or other interior features on the path did not satisfy an accurate reading or completion of the task. Data on whether the participant completed the task (Yes or No), the number of adjustments made to speed, the most accurate speed, the number of attempts, the route taken, and the task duration were collected and later analyzed. If an adjustment was made to the user navigation icon speed, and/or the participant lost the path, they would have to restart the task.

3.3. Study: Part 3: Usability Study

The third task was four questions, provided one at a time, in which the participants had to determine the number of landmarks on the map, and specific locations relative to a landmark. A researcher asked the question and then gave the participants 10 min to explore the map and answer the question. This was repeated for each question. The questions were as follows: (1) How many landmarks are on the map?; (2) What direction is the Main Office from Room 215?; (3) What direction is the restroom from Room 215?; (4) What direction is the Common Area from the restroom? Participants’ responses varied in terms of direction, with some using up and down, and others describing compass directions such as, north, or south. The duration of each response, if the participant described the direction to the location correctly or incorrectly, the number of landmarks, and observational data were also collected (Table 4). All of the participants correctly answered that there were four landmarks, and every participant was able to describe the direction in which to travel to get to the specified destination. For example, one participant’s response to question 2, what direction is the Main Office from Room 215, was, “You go down, south, near the common area”. Another participant responded to question 3 with, “You go out of the room and right up to the restroom”. Another participant responded to the same question with, “I would go up toward the start and it’s on the left”.
After conducting the detailed study, we collected a 7-point Likert survey asking if: (1) the map was easy to understand, (2) participants would use this tool as often as needed, (3) the application was fun to use, (4) using the gamepad was difficult. The participants answered the questions using the following scale: strongly disagree, disagree, somewhat disagree, neutral, somewhat agree, agree, and strongly agree (Table 5). Each participant took part in the survey individually. Questions and answers were provided verbally and recorded. Table 4 demonstrated that 10 out of 13 participants found the map to be easy to understand, and also would use it as needed. Also, all of them considered the system to be fun to use, and only one participant found using gamepad difficult.

4. Discussion

The study demonstrated that fully digital audio haptic maps can be used to efficiently deliver information to users with blindness. Even though most of the users had no prior experience with the gamepad, it took minutes to learn how to use it and the location of all controls. The survey demonstrated that 12 out of 13 participants were comfortable with using the gamepad. The age of the participants ranged from 19 to 72 (average—38). This demonstrates that our technology can be used by a variety of individuals. Additionally, haptic feedback can be reliably used to track a pathway of a reasonably complex shape, as long as the speed is optimized for the specific user. Probably, with more experience, the users would be able to use higher speeds, since they would be more proficient with the hardware. Another important observation is that audio haptic map allows for the users to create accurate mental maps of the space. After exploring the maps, users were able to describe the shapes of the paths, the relative location of different items on the map, and the number of landmarks. Finally, our new software that we developed for the intuitive creation of the audio haptic maps provides an alternative production approach that is more accessible to map creators and users.
The use of the gamepad provides multiple advantages over the haptic version provided by touchscreens that are limited with respect to the number of controls and possible user interactions with the map. Touch screens also limit the size of the map (as determined by the hardware screen), while our system allows for an exploration of indefinitely large virtual maps.
Additionally, the system is designed so that the data are stored on the client side. This means that they are on the user’s computer, and no data are stored elsewhere. The map that was created and/or shared with the user is only saved to their computer if they click the “Save” button. If the “Save” button is not clicked, then the map is gone when the user closes the webpage. No other data are collected or stored. Therefore, this eliminates most privacy concerns and ethical considerations.
Finally, it is important to mention the limitations of the current study and suggest possible improvements. First of all, use of the gamepad makes the system less portable and slightly more expensive than the use of a mobile phone. Also, we observed that. for older adult participants, there may be limitations in the use and handling of the gamepad, especially in users with restricted hand mobility and fine motor functions due to such conditions as arthritis. Additionally, we determined that the users require varying speeds, specifically the lower speed range, for the user icon. The path needed to be drawn more widely for some of the users; therefore, we will look at implementing a brush width size feature in future developments so that the path can be provided in various sizes depending on the end-user’s needs. Other features, such as audio text, will also be explored. Currently, the text is limited to the size of the input text. However, allowing for the user to scale or extend the activation area of the audio output of the text-to-speech would allow for greater flexibility and could improve the end-users’ understanding of the space.

5. Conclusions

Here, we presented our studies focused on the optimization and evaluation of audio haptic maps designed using our custom software. This software allows for the creation of maps consisting of pathways, landmarks and audio labels that can be read out using a gamepad and an audio-playing device. Several stages of the study focused on evaluation of the haptic feedback, which demonstrated that it should be optimized according to the individual user’s preferences. The next stages of the study demonstrated the effectiveness of the map’s exploration in mental map formation. Users showed their ability to use the map to understand the spatial map components, their relative positions, and the position of the landmarks relative to each other and to other labeled areas. Our conclusion is that the software that we developed for the map design can be used to create convenient and informative maps for individuals with blindness. These maps can be explored in advance, before visiting a location, to form a mental map of the area. This, in turn, can greatly help with the mobility, orientation and safety of individuals with blindness. To summarize, in this pilot study, we confirmed that a gamepad with a haptic vibration and buttons, together with the web interface and text-to-speech generation, can be used for the development of audio-haptic maps. In the future, a larger study should be conducted to determine the range of environments, and various end-user performances and preferences for this system.

Author Contributions

Conceptualization, methodology, software, validation, H.K.; writing—original draft preparation, review and editing, H.K. and A.P.; supervision, A.P. All authors have read and agreed to the published version of the manuscript.

Funding

This research received no external funding.

Institutional Review Board Statement

The study was conducted according to the guidelines of the University of South Florida’s Internal Review Board approval #00033464.

Informed Consent Statement

Informed consent was obtained from all subjects involved in the study.

Data Availability Statement

The prototype is available at https://howiek.com/tactilemapcreator/HowardKaplanAudioHapticMapCreator/HapticMap.html (accessed on 1 December 2023).

Conflicts of Interest

The authors declare no conflicts of interest.

References

  1. Holloway, L.; Marriott, K.; Reinders, S.; Butler, M. 3D printed maps and icons for inclusion: Testing in the wild by people who are blind or have low vision. In Proceedings of the ASSETS ’19—The 21st International ACM SIGACCESS Conference on Computers and Accessibility, Pittsburgh, PA, USA, 28–30 October 2019; Azenkot, S., Kane, S., Eds.; Association for Computing Machinery (ACM): New York, NY, USA, 2019; pp. 183–195. [Google Scholar] [CrossRef]
  2. Rowell, J.; Ungar, S. Feeling your way—A tactile map user survey. In Proceedings of the 21st International Cartographic Conference, Durban, South Africa, 10–16 August 2003. [Google Scholar]
  3. Kaplan, H.; Pyayt, A. Development of User Feedback-Based Optimized Encoding System for 3D-Printed Tactile Maps. Disabilities 2022, 2, 379–397. [Google Scholar] [CrossRef]
  4. Kaplan, H.; Pyayt, A. Development of the Tactile Map Creator (TMC) Application. Disabilities 2021, 2, 19–27. [Google Scholar] [CrossRef]
  5. Kaplan, H.; Pyayt, A. Tactile Visualization and 3D Printing for Education. In Encyclopedia of Computer Graphics and Games; Springer: Cham, Switzerland, 2015; pp. 1–8. [Google Scholar] [CrossRef]
  6. Kaplan, H. Assistive Technologies for Independent Navigation for People with Blindness. Doctoral Dissertation, University of South Florida, Tampa, FL, USA, 2022. [Google Scholar]
  7. Papadopoulos, K.; Koustriava, E.; Barouti, M. Cognitive maps of individuals with blindness for familiar and unfamiliar spaces: Construction through audio-tactile maps and walked experience. Comput. Hum. Behav. 2017, 75, 376–384. [Google Scholar] [CrossRef]
  8. Espinosa, M.; Ochaíta, E. Using Tactile Maps to Improve the Practical Spatial Knowledge of Adults who are Blind. J. Vis. Impair. Blind. 1998, 92, 338–345. [Google Scholar] [CrossRef]
  9. Cappagli, G.; Finocchietti, S.; Cocchi, E.; Giammari, G.; Zumiani, R.; Cuppone, A.V.; Baud-Bovy, G.; Gori, M. Audio motor training improves mobility and spatial cognition in visually impaired children. Sci. Rep. 2019, 9, 3303. [Google Scholar] [CrossRef] [PubMed]
  10. Papadopoulos, K.; Koustriava, E.; Koukourikos, P. Orientation and mobility aids for individuals with blindness: Verbal description vs. audio-tactile map. Assist. Technol. 2017, 30, 191–200. [Google Scholar] [CrossRef]
  11. Schinazi, V.R.; Thrash, T.; Chebat, D. Spatial navigation by congenitally blind individuals. WIREs Cogn. Sci. 2015, 7, 37–58. [Google Scholar] [CrossRef] [PubMed]
  12. Karimi, H.A. Indoor Wayfinding and Navigation; Taylor & Francis Ltd.: London, UK, 2015; ISBN 9780429172014. [Google Scholar]
  13. Blades, M.; Ungar, S.; Spencer, C. Map Use by Adults with Visual Impairments. Prof. Geogr. 1999, 51, 539–553. [Google Scholar] [CrossRef]
  14. Guerreiro, J.; Sato, D.; Ahmetovic, D.; Ohn-Bar, E.; Kitani, K.M.; Asakawa, C. Virtual navigation for blind people: Transferring route knowledge to the real-World. Int. J. Hum.-Comput. Stud. 2019, 135, 102369. [Google Scholar] [CrossRef]
  15. Perkins, C. Cartography: Progress in tactile mapping. Prog. Hum. Geogr. 2002, 26, 521–530. [Google Scholar] [CrossRef]
  16. Aldrich, F.; Sheppard, L.; Hindle, Y. First steps towards a model of tactile graphicacy. Br. J. Vis. Impair. 2002, 20, 62–67. [Google Scholar] [CrossRef]
  17. Siekierska, E.; Müller, A. Tactile and Audio-Tactile Maps within the Canadian ‘Government On-Line’ Program. Cartogr. J. 2003, 40, 299–304. [Google Scholar] [CrossRef]
  18. Challis, B.P.; Edwards, A.D. Design principles for tactile interaction. In International Workshop on Haptic Human-Computer Interaction; Springer: Berlin/Heidelberg, Germany, 2000; pp. 17–24. [Google Scholar]
  19. Cavanaugh, T.W.; Eastham, N.P. Creating tactile graphs for students with visual impairments: 3D printing as assistive technology. In Interdisciplinary and International Perspectives on 3D Printing in Education; Santos, I.M., Ali, N., Areepattamannil, S., Eds.; IGI Global: Hershey, PA, USA, 2019; pp. 223–240. [Google Scholar] [CrossRef]
  20. Holloway, L.; Marriott, K.; Butler, M. Accessible Maps for the Blind: Comparing 3D Printed Models with Tactile Graphics. In Proceedings of the 2018 CHI Conference on Human Factors in Computing Systems—CHI ’18, Montreal, QC, Canada, 21–26 April 2018. [Google Scholar] [CrossRef]
  21. Edman, P.K. Tactile Graphics; American Foundation for the Blind: New York, NY, USA, 1992. [Google Scholar]
  22. Touch Mapper. Available online: https://touch-mapper.org/en/ (accessed on 3 May 2019).
  23. Tactile Map Automated Production (TMAP). Available online: https://www.ski.org/project/tactile-map-automated-production-tmap (accessed on 3 May 2020).
  24. Götzelmann, T. LucentMaps: 3D printed audiovisual tactile maps for blind and visually impaired people. In Proceedings of the 18th International ACM Sigaccess Conference on Computers and Accessibility, Reno, NV, USA, 23–26 October 2016; pp. 81–90. [Google Scholar]
  25. Miele, J.A.; Landau, S.; Gilden, D. Talking TMAP: Automated generation of audio-tactile maps using Smith-Kettlewell’s TMAP software. Br. J. Vis. Impair. 2006, 24, 93–100. [Google Scholar] [CrossRef]
  26. Zeng, L.; Weber, G. ATMap: Annotated: Tactile Maps for the Visually Impaired. In Cognitive Behavioural Systems. Lecture Notes in Computer Science; Springer: Berlin/Heidelberg, Germany, 2012; Volume 7403, pp. 290–298. [Google Scholar]
  27. Brock, A.M.; Truillet, P.; Oriola, B.; Picard, D.; Jouffrais, C. Interactivity improves usability of geographic maps for visually impaired people. Hum. Comput. Interact. 2015, 30, 156–194. [Google Scholar] [CrossRef]
  28. Clew. Available online: http://www.clewapp.org/ (accessed on 13 November 2022).
  29. Seeing AI: Indoor Navigation. Introducing Accessible Indoor Navigation Using AI. Available online: https://www.perkins.org/resource/seeing-ai-indoor-navigation/ (accessed on 12 August 2022).
  30. Indoor Navigation at the NC Museum of Natural Sciences. Available online: https://www.perkins.org/resource/indoor-navigation-nc-museum-natural-sciences/ (accessed on 23 July 2022).
  31. Bringing Freedom Indoors. Available online: https://www.perkins.org/resource/bringing-freedom-indoors/ (accessed on 20 July 2022).
  32. Cognitive Assistance Lab. Available online: https://www.cs.cmu.edu/~NavCog/navcog.html (accessed on 15 June 2023).
  33. Three Blindness-Aware Mobile Navigation Apps. Available online: https://www.afb.org/blindness-and-low-vision/using-technology/smartphone-gps-navigation-people-visual-impairments/three (accessed on 14 May 2023).
  34. WeWALK App—Blind and Low Vision Navigation—Find Your Best Route. Available online: https://www.youtube.com/watch?v=fGCbSmoWgVc (accessed on 18 April 2021).
  35. Jabnoun, H.; Hashish, M.A.; Benzarti, F. Mobile assistive application for blind people in indoor navigation. In Proceedings of the Impact of Digital Technologies on Public Health in Developed and Developing Countries: 18th International Conference, ICOST 2020, Hammamet, Tunisia, 24–26 June 2020; pp. 395–403. [Google Scholar]
  36. Introducing Azure Maps Creator. Available online: https://www.microsoft.com/en-us/maps/azure/azure-maps-creator?gclid=CjwKCAiAg9urBhB_EiwAgw88mYk2nD61wBFq9TgBVrNVUqMeUKXtCEpMq-orK4jqlk4fOP53Q1aICRoCVN4QAvD_BwE (accessed on 12 July 2021).
  37. Brock, A.; Jouffrais, C. Interactive audio-tactile maps for visually impaired people. ACM SIGACCESS Access. Comput. 2015, 113, 3–12. [Google Scholar] [CrossRef]
  38. Ducasse, J.; Brock, A.; Jouffrais, C. Accessible Interactive Maps for Visually Impaired Users. In Mobility of Visually Impaired People; Springer: Berlin/Heidelberg, Germany, 2018; pp. 537–584. [Google Scholar] [CrossRef]
  39. Giudice, N.A.; Guenther, B.A.; Jensen, N.A.; Haase, K.N. Cognitive Mapping Without Vision: Comparing Wayfinding Performance After Learning From Digital Touchscreen-Based Multimodal Maps vs. Embossed Tactile Overlays. Front. Hum. Neurosci. 2020, 14, 87. [Google Scholar] [CrossRef] [PubMed]
  40. Palani, H.P.; Fink, P.D.S.; Giudice, N.A. Comparing Map Learning between Touchscreen-Based Visual and Haptic Displays: A Behavioral Evaluation with Blind and Sighted Users. Multimodal Technol. Interact. 2021, 6, 1. [Google Scholar] [CrossRef]
  41. Simonnet, M.; Brock, A.M.; Serpa, A.; Oriola, B.; Jouffrais, C. Comparing Interaction Techniques to Help Blind People Explore Maps on Small Tactile Devices. Multimodal Technol. Interact. 2019, 3, 27. [Google Scholar] [CrossRef]
  42. Trifanica, V.; Butean, A.; Moldoveanu, A.D.; Butean, D. Gamepad Vibration Methods to Help Blind People Perceive Colors. In Proceedings of the Romanian Conference on Human-Computer Interaction, Bucharest, Romania, 24 September 2015. Available online: http://rochi.utcluj.ro/proceedings/en/articles-RoCHI2015.php (accessed on 17 February 2020).
  43. Coldewey, D. An Xbox Controller with a Built-In Braille Display Is Microsoft’s Latest Gaming Accessibility Play. TechCrunch. Available online: https://techcrunch.com/2019/05/06/an-xbox-controller-with-a-built-in-braille-display-ismicrosofts-latest-gaming-accessibility-play/ (accessed on 14 March 2021).
  44. Parente, P.; Bishop, G. BATS: The Blind Audio Tactile Mapping System. In Proceedings of the ACM Southeastern Conference, Savannah, GA, USA, 7–8 March 2003; ACM Press: New York, NY, USA, 2003. [Google Scholar]
  45. Espinoza, M.; Sánchez, J.; Campos, M.d.B. Videogaming Interaction for Mental Model Construction in Learners Who Are Blind. In Proceedings of the International Conference on Universal Access in Human-Computer Interaction, Crete, Greece, 22–27 June 2014; pp. 525–536. [Google Scholar]
  46. Paneels, S.; Roberts, J.C. Review of Designs for Haptic Data Visualization. IEEE Trans. Haptics 2009, 3, 119–137. [Google Scholar] [CrossRef] [PubMed]
  47. Magnusson, C.; Poppinga, B.; Pielot, M.; Rassmus-Gr, K. TouchOver map: Audio-tactile exploration of interactive maps. In Proceedings of the 13th International Conference on Human Computer Interaction with Mobile Devices and Services, Stockholm, Sweden, 30 August–2 September 2011. [Google Scholar]
  48. Multimodal Maps for Blind People. 2010. Available online: https://www.youtube.com/watch?v=mB-6TNHS7X0 (accessed on 8 September 2023).
  49. Olin College of Engineering. Clew; Revolutionary Indoor Navigation for iOS. Available online: http://www.clewapp.org/#technology (accessed on 18 January 2018).
  50. Gamepad. Available online: https://www.w3.org/TR/gamepad/ (accessed on 29 September 2023).
  51. Nyman, R. The Gamepad API. Mozilla Hacks—The Web Developer Blog. 13 December 2013. Available online: https://hacks.mozilla.org/2013/12/the-gamepad-api/ (accessed on 23 January 2021).
  52. Darin, T.G.R.; Andrade, R.M.C.; Merabet, L.B.; Sánchez, J.H. Investigating the Mode in Multimodal Video Games. In Proceedings of the CHI ‘17: CHI Conference on Human Factors in Computing Systems, Denver, CO, USA, 6–11 May 2017; pp. 2487–2495. [Google Scholar]
  53. Oviatt, S. Multimodal Interfaces. In The Human-Computer Interaction Handbook; CRC Press: Boca Raton, FL, USA, 2007; pp. 439–458. [Google Scholar]
  54. Darin, T.; Andrade, R.; Sánchez, J. Principles for Evaluating Usability in Multimodal Games for People Who Are Blind. In Proceedings of the International Conference on Human-Computer Interaction, Orlando, FL, USA, 26–31 July 2019; pp. 209–223. [Google Scholar]
Figure 1. Diagram of the application.
Disabilities 04 00005 g001
Figure 2. The XBOX 360 gamepad and all corresponding buttons and controls.
Disabilities 04 00005 g002
Figure 3. The first task focused on feeling the vibration when the user’s red circle cursor crosses the red and blackline. The cursor is moved up or down using the joystick on XBOX 360 gamepad. The black five-pointed star indicated the starting position of the user. The red circle indicated the user’s current position.
Disabilities 04 00005 g003
Figure 4. Two different red paths (A,B) that the user had to follow using the haptic feedback, starting at the point shown with a five-point star and red circle and ending with a blue square.
Disabilities 04 00005 g004
Figure 5. Left: Mini-map with a zigzag pathway and four different landmarks. The five-point star indicates the start position, The red circle is the user’s position, and the orange circles are points of interests along the red and black travel path: Room 7, Restroom, Room 13, and Office. Right: User is exploring the mini-map.
Disabilities 04 00005 g005
Figure 6. Map of a building with multiple paths shown in red and black, walls drown in dark blue, building exits labeled as blue squares, landmarks shown as orange circles, and many word labels that identify different rooms and locations. The black five-pointed star indicates the starting position of the user. The red circle indicates the user’s current position.
Disabilities 04 00005 g006
Table 1. Characteristics of the users participating in the user study.
Participant IDAge of BlindnessAgeGenderMobility DeviceExperience with Haptic DeviceExperience with Gamepad
P1Congenital37FCaneSomeNone
P2Congenital72MCaneSomeNone
P3Congenital66MCaneSomeNone
P4Congenital28FCaneNoneNone
P5Congenital20FGuide DogSomeNone
P6Congenital22FCaneSomeNone
P7Congenital24MCaneSomeSome
P8Congenital19FGuide DogSomeNone
P9Congenital26FCaneSomeSome
P10Congenital59MCaneSomeNone
P11Congenital47FCaneSomeNone
P12844MCaneNoneNone
P131632FCaneNoneNone
Table 2. Path-following optimization.
Part1: Baseline, Calibration, and Training, Task 1 Speed Accuracy Preference Test
Travel Path (A or B)Accuracy SpeedNumber of AdjustmentsPreferred Speed
P1B253
P2B1102
P3B272
P4B152
P5B263
P6B283
P7B272
P8A282
P9A2103
P10A182
P11A252
P12A193
P13A272
Table 3. Landmark shape test.
Part 1: Baseline, Calibration, and Training, Task 2 Landmark Shape Test
IDHow Many Landmarks Are There?Name the LandmarksDescribe the Shape of the Path?
P14YESpointed with her fingers, across and down
P24YESzigzag
P34YESlike a “Z”
P44YESzigzag
P54YESlike arrows pointing to the right
P64YESlightening
P74YESnext to each other across, like a zipper
P84YESlike lightening bolt
P94YESlike a “Z”
P104YESback and forth, crossing
P114YESlike a “Z”
P124YESdescribed the directions: “It goes right then, left and down, and across to the right and then down”
P134YESdiagonal from one another
Table 4. Navigation of the map from the start point to room 215.
Part 2: Map Reading, TASK 1, Start/Star to Room 215
CompletionNumber of Adjustments to Speed Most Accurate SpeedNumber of AttemptsRoute TakenDuration (the Entire Task Time) min:s
YES3—(started at 1, went to 2, then 3, back to 2)23right path/hallway 20:04:12
NO—needed help5—(1 to 2 to 3 to 1 to 2 to 1)18 0:12:23
YES4, (1 to 2, then 3, then 4, back to 2.)14right path/hallway 20:04:46
YES2—(1 to 2)22right path/hallway 20:04:31
YES3—(1 to 2, to 3 to 2)24right path/hallway 20:05:16
YES4—(1 to 2, to 3 to 2, to 1)15right path/hallway 20:06:09
NO 2—(2 to 3 to 2)24 0:06:24
YES1—(2 to 1)12right path/hallway 20:04:11
YES2—(2 to 1 to 2)22 0:04:23
YES2—(1 to 2 to 1)13right path/hallway 20:06:04
YES3—(1 to 2 to 3 to 2)24right path/hallway 20:06:23
YES3—(1 to 2 to 3 to 2)24left path/hallway 1 to common area and then up0:05:05
YES1—(2 to 1)12right path/hallway 20:04:41
Average Average Time
1.54 0:05:44
Table 5. Results of the Likert survey.
Strongly DisagreeDisagreeSomewhat DisagreeNeutralSomewhat AgreeAgreeStrongly Agree
Q1 12 64
Q2 3 55
Q3 112
Q43 81 1
Disclaimer/Publisher’s Note: The statements, opinions and data contained in all publications are solely those of the individual author(s) and contributor(s) and not of MDPI and/or the editor(s). MDPI and/or the editor(s) disclaim responsibility for any injury to people or property resulting from any ideas, methods, instructions or products referred to in the content.

