1. Introduction
While tactile maps are very useful for people with blindness [
1,
2], they are still not widely used. The current bottleneck for broader adaptation is the ability of caregivers (often non-technical individuals) to design and produce the maps for the end users. Furthermore, creation of tactile graphics, specifically maps, requires not only advanced technical skill and 3D design expertise but also an understanding of the tactile properties necessary to convey the sensory information to the user [
3,
4]. Although there are companies that offer tactile mapping services, they are costly, contain few encodings, and take a long time to produce and deliver [
5]. Most of the map creator applications also rely heavily on geographic information system (GIS) which provides data about exterior environments. Another technology currently available to users is the Tactile Maps Automated Production (TMAP), a service that generates maps based on street locations and can send an embossed map or map file that can be used independently with an automatically produced audio enabled Talking Tactile Tablet (TTT) [
6] and TMAP [
7]. Tactile Map Automated Creation System (TMACS) also uses GIS data to generate tactile maps on capsule paper [
8]. Similarly, HaptoRender and TouchMapper use an open-source geocoding map application OpenStreet Maps (OMS) to generate 3D printed maps based on OMS geolocation [
9]. In addition to do that, previous research has already shown that generating tactile maps using traditional designs for sighted people (Google Maps and OpenStreet Maps), does not provide sufficient tactile information to a blind or visually impaired user [
10]. These types of tactile map applications focus on exterior locations and mainly use map data optimized for sighted individuals with the tactile elements raised above the surface. Other examples of these technologies include LucentMaps and TacTile, which use partially raised overlays (some 3D printed) on top of a touchscreen device (i.e., mobile phone, tablet) combined with an interactive audiovisual software. These systems require technically advanced individuals capable of development, assembly, and set-up of the complete system. In addition to that, they require regular hardware and software updates, since mobile devices and operating systems (iOS and Android) quickly evolve.
It has also been demonstrated by Lobben and Lawrence [
11] that it is beneficial to create new map encodings using a set of street symbols describing different street objects. The encodings were found to be discriminable, meaningful, and usable in large-scale navigational tactile maps. The symbol set contained basic geometric shapes and was designed for microcapsule paper. Recently this symbol set has been used in 3D printed maps that were accepted well by users with blindness [
3]. Other studies have explored 3D printing more representational or realistic symbols for use in exterior tactile maps [
12] Additional studies have demonstrated the effectiveness of map reading using tactile icons for the blind [
13].
3D printing provides a low-cost solution to produce tactile maps. However, 3D-printed tactile maps must be designed and generated by a person that has expertise of computer-aided design (CAD) software and production techniques. Furthermore, the individuals creating the map would need to have knowledge of the appropriate map encodings and parameters to design for the optimal maps. Additionally, determining which elements of an interior environment should be included or excluded and the stylization of the tactile map components is challenging. A mobility instructor, for instance, does not necessarily have the skillset or knowledge required to produce maps using these methods. Additionally, even if an individual does possess needed technical skills, the maps would most likely be designed using a non-optimal style, since there is no one standardized set of symbols for 3D-printed interior or exterior tactile maps. Since, a lack of technology expertise, time, and cost restraints contribute to limited access to tactile maps, developing a method for enabling individuals, such as orientation and mobility (O&M) instructors and caregivers to efficiently produce their own low-cost maps is vital to providing greater acceptance and accessibility.
Here we specifically focus on interior maps, since they are very important for individuals with blindness [
14]. Specific requests from participants with blindness in previous studies were made for information about safety exits from buildings, available pathways, information about types of the doors (automatic vs. manual), and other items [
15] that sighted people take for granted but can be very hard for these users to know otherwise [
16]. This prior study with eight generations of maps and approximately 20 variations of symbols resulted in a set of optimized encodings that was iteratively evaluated by with users with blindness till most of them accepted the encodings as useful and informative [
16] (more details in the following section). Our goal was to design an application that can use this set of encodings and automate the tactile map creation process enabling people to easily create and share 3D-printed tactile maps. The map creator application uses a 2D graphic user interface and a set of previously optimized encodings, and then it auto-generates a 3D model of the map that can be 3D printed. This goal was to provide an integrated system that is user friendly for caregivers and mobility and orientation professionals so that they may provide tactile maps to aid people with blindness and visual impairments in safe navigation of interior spaces. The application makes these aids more accessible and provides the user the ability to quickly make edits should the space change. The maps can be created on-demand for a specific individual’s needs. These types of tactile maps are used by people with blindness to familiarize themselves with the space prior to visiting the location [
1]. The map creator application can be accessed online by most modern browsers on desktop PCs with internet access. In addition to that, this application can be an excellent solution for low- and middle-income countries where 3D printers have already become available, but many caregivers might lack special CAD expertise to create the maps on their own.
2. Our Prior Results
The study presented here is based on years of previous research focused on the development of a set of design rules and encoding for maps accepted by individuals with blindness [
15,
16,
17]. We used an iterative process to develop individual encoding symbols representing different physical objects and integrated them into real-world maps using feedback from the users. Evaluation of the 3D printed maps was conducted with the help of fifteen study participants at various locations. Four participants were from the University of South Florida (USF), Tampa campus, three participants from the Conklin Center, Daytona Florida, four from Lighthouse of Tampa Bay, and four from Southeastern Guide Dogs organization.
There were eight generations of maps that were iteratively improved after each user study. Initially, a set of the most important physical objects to be encoded on the map was identified based on the user requests. After, multiple encodings were evaluated individually and while integrated on maps. Videos of the participants’ hands interacting with the maps and their voices while talking out loud about their experience were recorded. Later, these videos were reviewed, and detailed feedback with the specific comments from the users for each generation of the maps was extracted. Videos of the field tests were also recorded, and data relating to navigation and orientation with the use of the map and without were collected and analyzed. The data collected from the videos and information from the questionnaires following the field tests helped to update the designs and further enhance the user experience. This resulted in a set of optimal encodings that was most positively perceived by all participants.
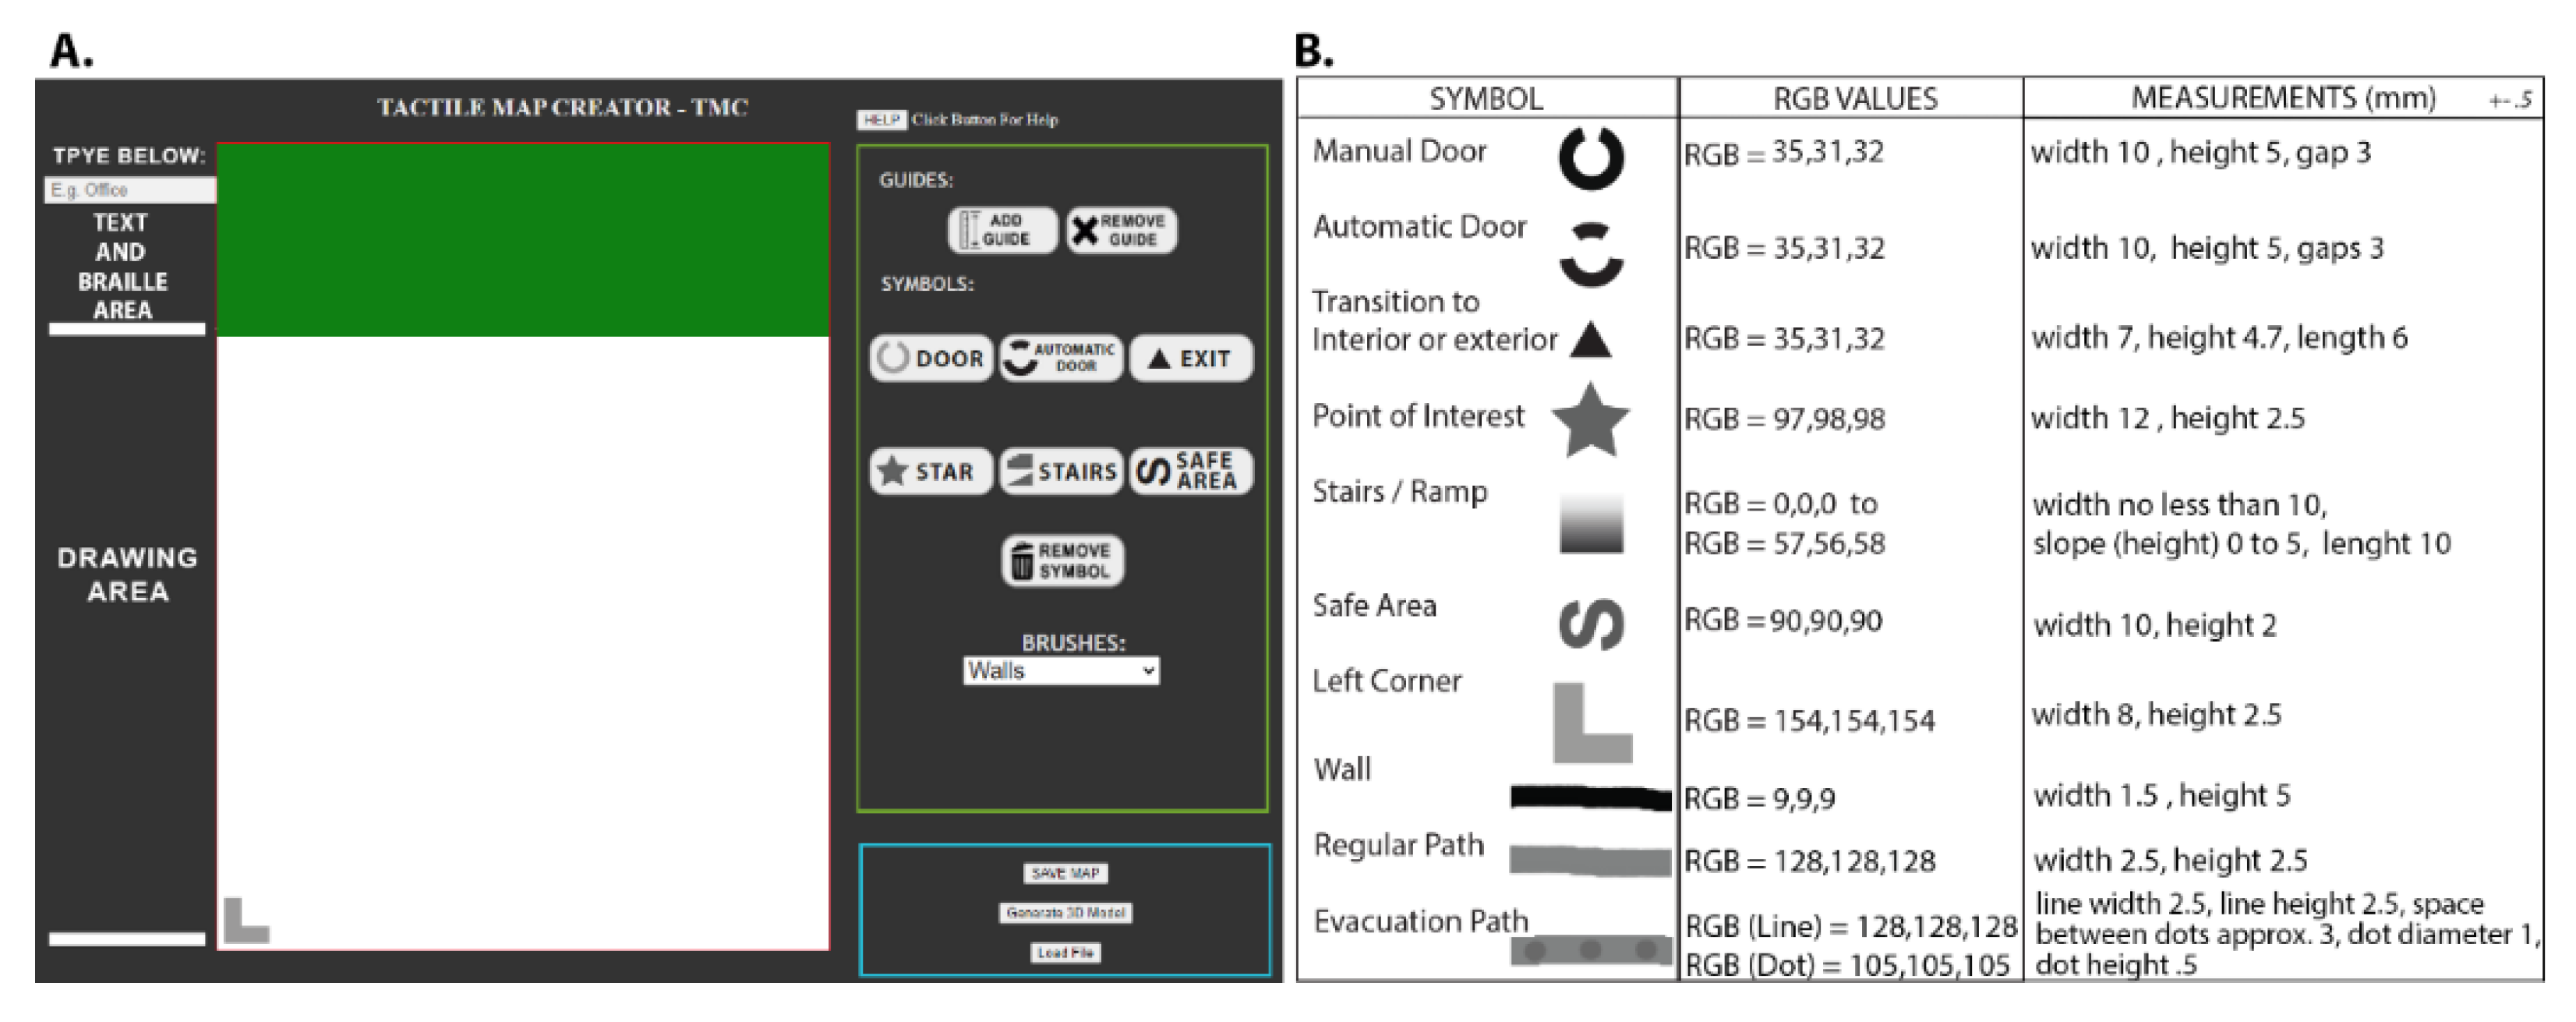
The optimized set of encodings is shown in
Figure 1B. There are three columns: “symbol”—shows the shape and the meaning of the encoding, “RGB values”—encodes the height of the symbols that will be generated for the 3D representation, “measurements”—optimized size of the symbol. A gradual change of color in “stairs” indicates that it is 3D shape that has gradually decreasing height. Our study demonstrated that user feedback was critical for determining encodings that are most easily recognizable by the user even in complex maps. As a result, with each design iteration we observed significant improvements in map readability and encoding representation as well as a decrease in the difficulty level. We incorporated optimized symbols into the application interface (
Figure 1A), so the user can just drag and drop encoding without worrying about drawing them correctly or properly sizing them.
The creation of the maps was performed following a process that would be quite complicated for a person without 3D CAD experience. The initial 2D drawings for the encodings and maps were designed and later 3D modeled using the Autodesk Maya. Once the 3D models were created, they were exported as either an OBJ or STL file and imported into the Cura application for slicing and set-up of the 3D printing parameters. Once the 3D printed maps were printed, they were evaluated by the study’s participants, and their feedback was used for further iterative improvement.
Even though the optimized maps were accepted well by individuals with blindness, there was a bottleneck in how many maps could be produced. Since the process was so complicated, it took a long time to create each map, and it could only be done by a person with a strong technical background. It became clear that the research was not going to have any real-world impact if there was not a simple way to help people create the maps themselves without worrying about 3D CAD, limitations of the design rules, etc. Because of that, the next step was to investigate if it was possible to automate the process of map creation by people with basic computer skills (e.g., web browsing and drawing in Paint). The hypothesis was that it could be done with an application that takes care of all challenging aspects of the map creation—generation of a 3D model and use of optimized symbols, height, and dimensions. The goal of the current study was to design and implement software that can automate all these complex steps required for 3D model generation and choice of appropriate encodings to the level that they can be performed by individuals with basic computer skills (web browsing and drawing in Paint or similar program). The long-term goal would be to provide access to the application to the general public and, hopefully, make 3D maps much more widely available.
3. Prototype Development
The Tactile Map Creator (TMC) is a web-based application that runs in any standard modern web browsers such as Chrome and Firefox. The application is built on Hyper Text Markup Language (HTML5), JavaScript, and CSS. The application has two steps/interfaces that the user accesses during the map’s creation process. During the first step, the user accesses the Drawing area, where s/he designs and draws their 2D map (
Figure 1A). The Drawing area is automatically sized to the optimal dimensions of the needed map type (single room or floor map), based on the user’s selection. All the encoding for different items on the map (walls, pathways, doors, stairs, etc.) have been previously optimized for better tactile readability and higher acceptance by people with blindness [
16]. To simplify personalized map design by the caregivers, the application interface provides custom-made scalable vector graphics (SVG) icons representing doors, stairs, safe area, exits, and points of interest that can be dragged and dropped onto the Drawing area (
Figure 1A). The explanation for each encoding symbol is shown in the “Symbol” column in
Figure 1B. The black lines represent walls, grey lines with and without dots represent travel paths and evacuation paths, respectfully, stars indicate points of interest. The 2D map drawings also include stairs represented by a black to white gradient square, and black rings encoding doors. Rings with two gaps are automatic doors, and a ring with a single gap is a manual door. The position of the gap in the manual door indicates the direction that the door swings open. A ring with a triangle represents a transition from an interior to exterior space. All these encodings were previously iteratively improved based on feedback from individual with blindness, and the finalized encodings represent shapes that worked best individually and while integrated into complex maps [
16]. Information about the size and color (RGB values) for each symbol are also shown in
Figure 1B.
Pre-programmed optimized encodings allow for the creation of even complex maps that can be easily assembled from pre-designed building blocks. In addition to that, the brush tool can be used for freehand drawing and erasing of walls and paths. The brushes were developed with HTML 5, using canvas elements to render various lines, patterns, and shapes that represent walls, stairs, travel and evacuation paths, and other map elements. The user can draw straight lines or curves and can use the built-in straight line tool. The application also includes a Guide tool to help the user measure and align the map elements. The generated 3D model does not store the guides that are used only during the Drawing steps. Moreover, any symbol or guide can be erased.
There is a Text box within the Drawing area. The user can use it to type a room or map name, and the application will automatically provide the appropriate size, spacing, and braille translation under the raised text version. The application also automatically produces a braille and raised text map key that can be downloaded, 3D printed, and provided along with the tactile map. The map can be saved as a portable network graphics (PNG) file that can be reused to recreate or edit the tactile map. Additionally, the map “drawing file” can be shared and/or used to generate a 3D model.
The second interface of the application is “Generate 3D Model”, where the drawing is converted into a 3D model. The “Generate 3D Model” feature uses the Three.js library and WebGL to create a 3D model using the pixel data of the map image. There are various methods for generating three-dimensional models such as using CAD, medical imaging, and 3D scanning [
18]. The map creator application uses a process where a high-resolution polygonal cube mesh is used to generate the 3D model from a 2D map drawing performed in the application. This subdivided cube mesh allows for greater detail, as the image pixels can be correlated to vertex points on the mesh. The associated 2D image pixel data and cube mesh point locations can then be used to extrude and/or raise the points based on the 2D pixel information. The color image is converted to greyscale during this process, as color is not calculated in the 3D model; however, the pixel brightness is used to determine the extrusion height. This approach is computationally expensive, as it is required to process and calculate large numbers of pixels to compute the 3D extrusion levels. This means that, in general, this method has limitations with memory processing of high-resolution images that contain a large number of pixels. However, for traditional map dimensions, the application operates quickly and reliably. Once the 3D model is generated, it can be viewed virtually in the application’s 3D viewer and downloaded as a stereolithography (STL) file for 3D printing or further editing. For this study, the tactile maps were 3D printed using fused deposition modeling (FDM), printing on a variety of different 3D printers including Flash Forge Creator Pro, Makerbot Replicator, Monoprice Maker Ultimate, and MakergearM2.
4. User Testing and Features
Two studies were conducted for the prototype application. One was the usability test of the application. This study required users to create maps using the Tactile Map Creator application (
Figure 2). The study was performed with ten participants (
Table 1) including O&M trainers, subject experts, and health specialists. These types of users were chosen for the study because of their involvement with assisting the end-user group and their knowledge of similar resources. The aim of the usability pilot test was to gather information about the features, output, and user-experience with the application. This testing and feedback provided us with a better understanding of the participants drawing and design process and the necessary features to incorporate or eliminate in the application. A second study was also conducted to evaluate the output of the 3D-printed tactile map generated from the application. Eight congenitally blind participants compared and provided feedback about the 3D printed maps. Both studies were conducted by researchers at the University of South Florida under IRB approval #00033464.
4.1. Map Creator Application Testing Procedure
The Tactile Map Creator application sessions were conducted with one participant at a time. Participants were seated at a computer with the application loaded and displaying the start screen. A ten-minute introduction of the application was presented prior to the participants using the application. In the future, this introduction can be performed a using pre-recorded video and a list of frequently asked questions with answers. A help section that described the symbols, tools, features, and techniques which could be used to create a map was also available to the participants to use at any time during the study process. A resource list in the application provided additional information about external 3D printing services, online information sites, and related software. Participants were then asked to create a map of a single room for a given floor plan and to include hallways (travel paths), emergency routes, doors, and exits (
Figure 2). In
Figure 2, the left map drawings were created by the participant. They made the maps with the guide tool so that the room of interest had the appropriate dimensions 4 cm × 4 cm, while the additional rooms were drawn smaller as they were less important for the future users.
The application’s evaluators were given as much time as they needed to create a map. The participants were also told to verbally communicate any likes or dislikes as they explored the application. Some of the participants used pen and paper to hand draw the map first before moving to the application. All participants could ask question at any time during the mapmaking session. The mapmaking session lasted no more than 40 min with the quickest map being created in 15 min.
After the participants exported their 3D map, an online survey consisting of 45 questions on a 7-point Likert scale was administered. The usability testing survey administered for this study was similar to other surveys that analyzed acceptance and use of technology for related products [
19]. The survey was divided into eight sections to collect information from the participants—performance expectancy (PE), effort expectancy (EE), social influence (SI), facilitating conditions (FC), attitude towards using technology (ATUT), computer self-efficacy (CE), computer anxiety (CA), and behavioral intentions (BI)—after using the Tactile Map Creator. The survey type and test method were in line with other studies conducted to determine the overall effectiveness, use, and user acceptance and behavior towards technology resources [
20].
The surveys eight sections are outlined below:
Performance Expectancy—“The degree to which an individual believes that using the system will help him or her to attain gains in job performance”;
Effort Expectancy—“The degree of ease associated with the use of the system”;
Social influence—“The degree to which an individual perceives that it is important that others believe that he or she should use the new system”;
Facilitating conditions—“The degree to which an individual believes that an organizational and technical infrastructure exists to support use of the system”;
Attitude toward using technology—“An individual’s overall affective reaction to using a system”;
Computer Self-Efficacy—“An individual’s ability to learn and use the system independently”;
Computer Anxiety—“An individual’s emotional response in using the system”;
Behavioral Intentions—“An individual’s intended use of use the system” [
21,
22].
Based on the results of evaluations, we can conclude that, overall, the users liked the application. While the detailed scores for the sets of questions are provided in the
Supplementary Materials, the following summarizes the feedback: (1) users of the application found that it would greatly improve their productivity and work efficiency; (2) the map creator application was both easy to learn and easy to use; (3) participants agreed that co-workers would support the use of the map creator application in the workplace: (4) all participants had access to the resources, knowledge, and support that were necessary to use the map creator application; (5) the map creator application was fun and pleasant to use; (6) users felt that they could use the application on their own, as well as with the built-in help feature; (7) the map creator application was not intimidating or scary; (8) participants intend to use the map creator application frequently and on a regular basis.
4.2. End-User Testing of 3D-Printed Tactile Maps
Since the first study confirmed that individuals without a significant technical background were positive about the use of the software, the next step was to evaluate maps created using this application with people with blindness. Previously, the users with blindness had positive experiences with maps created by CAD and 3D printing specialists, and it was important to confirm that maps created using automated tools were as good as manually created in CAD.
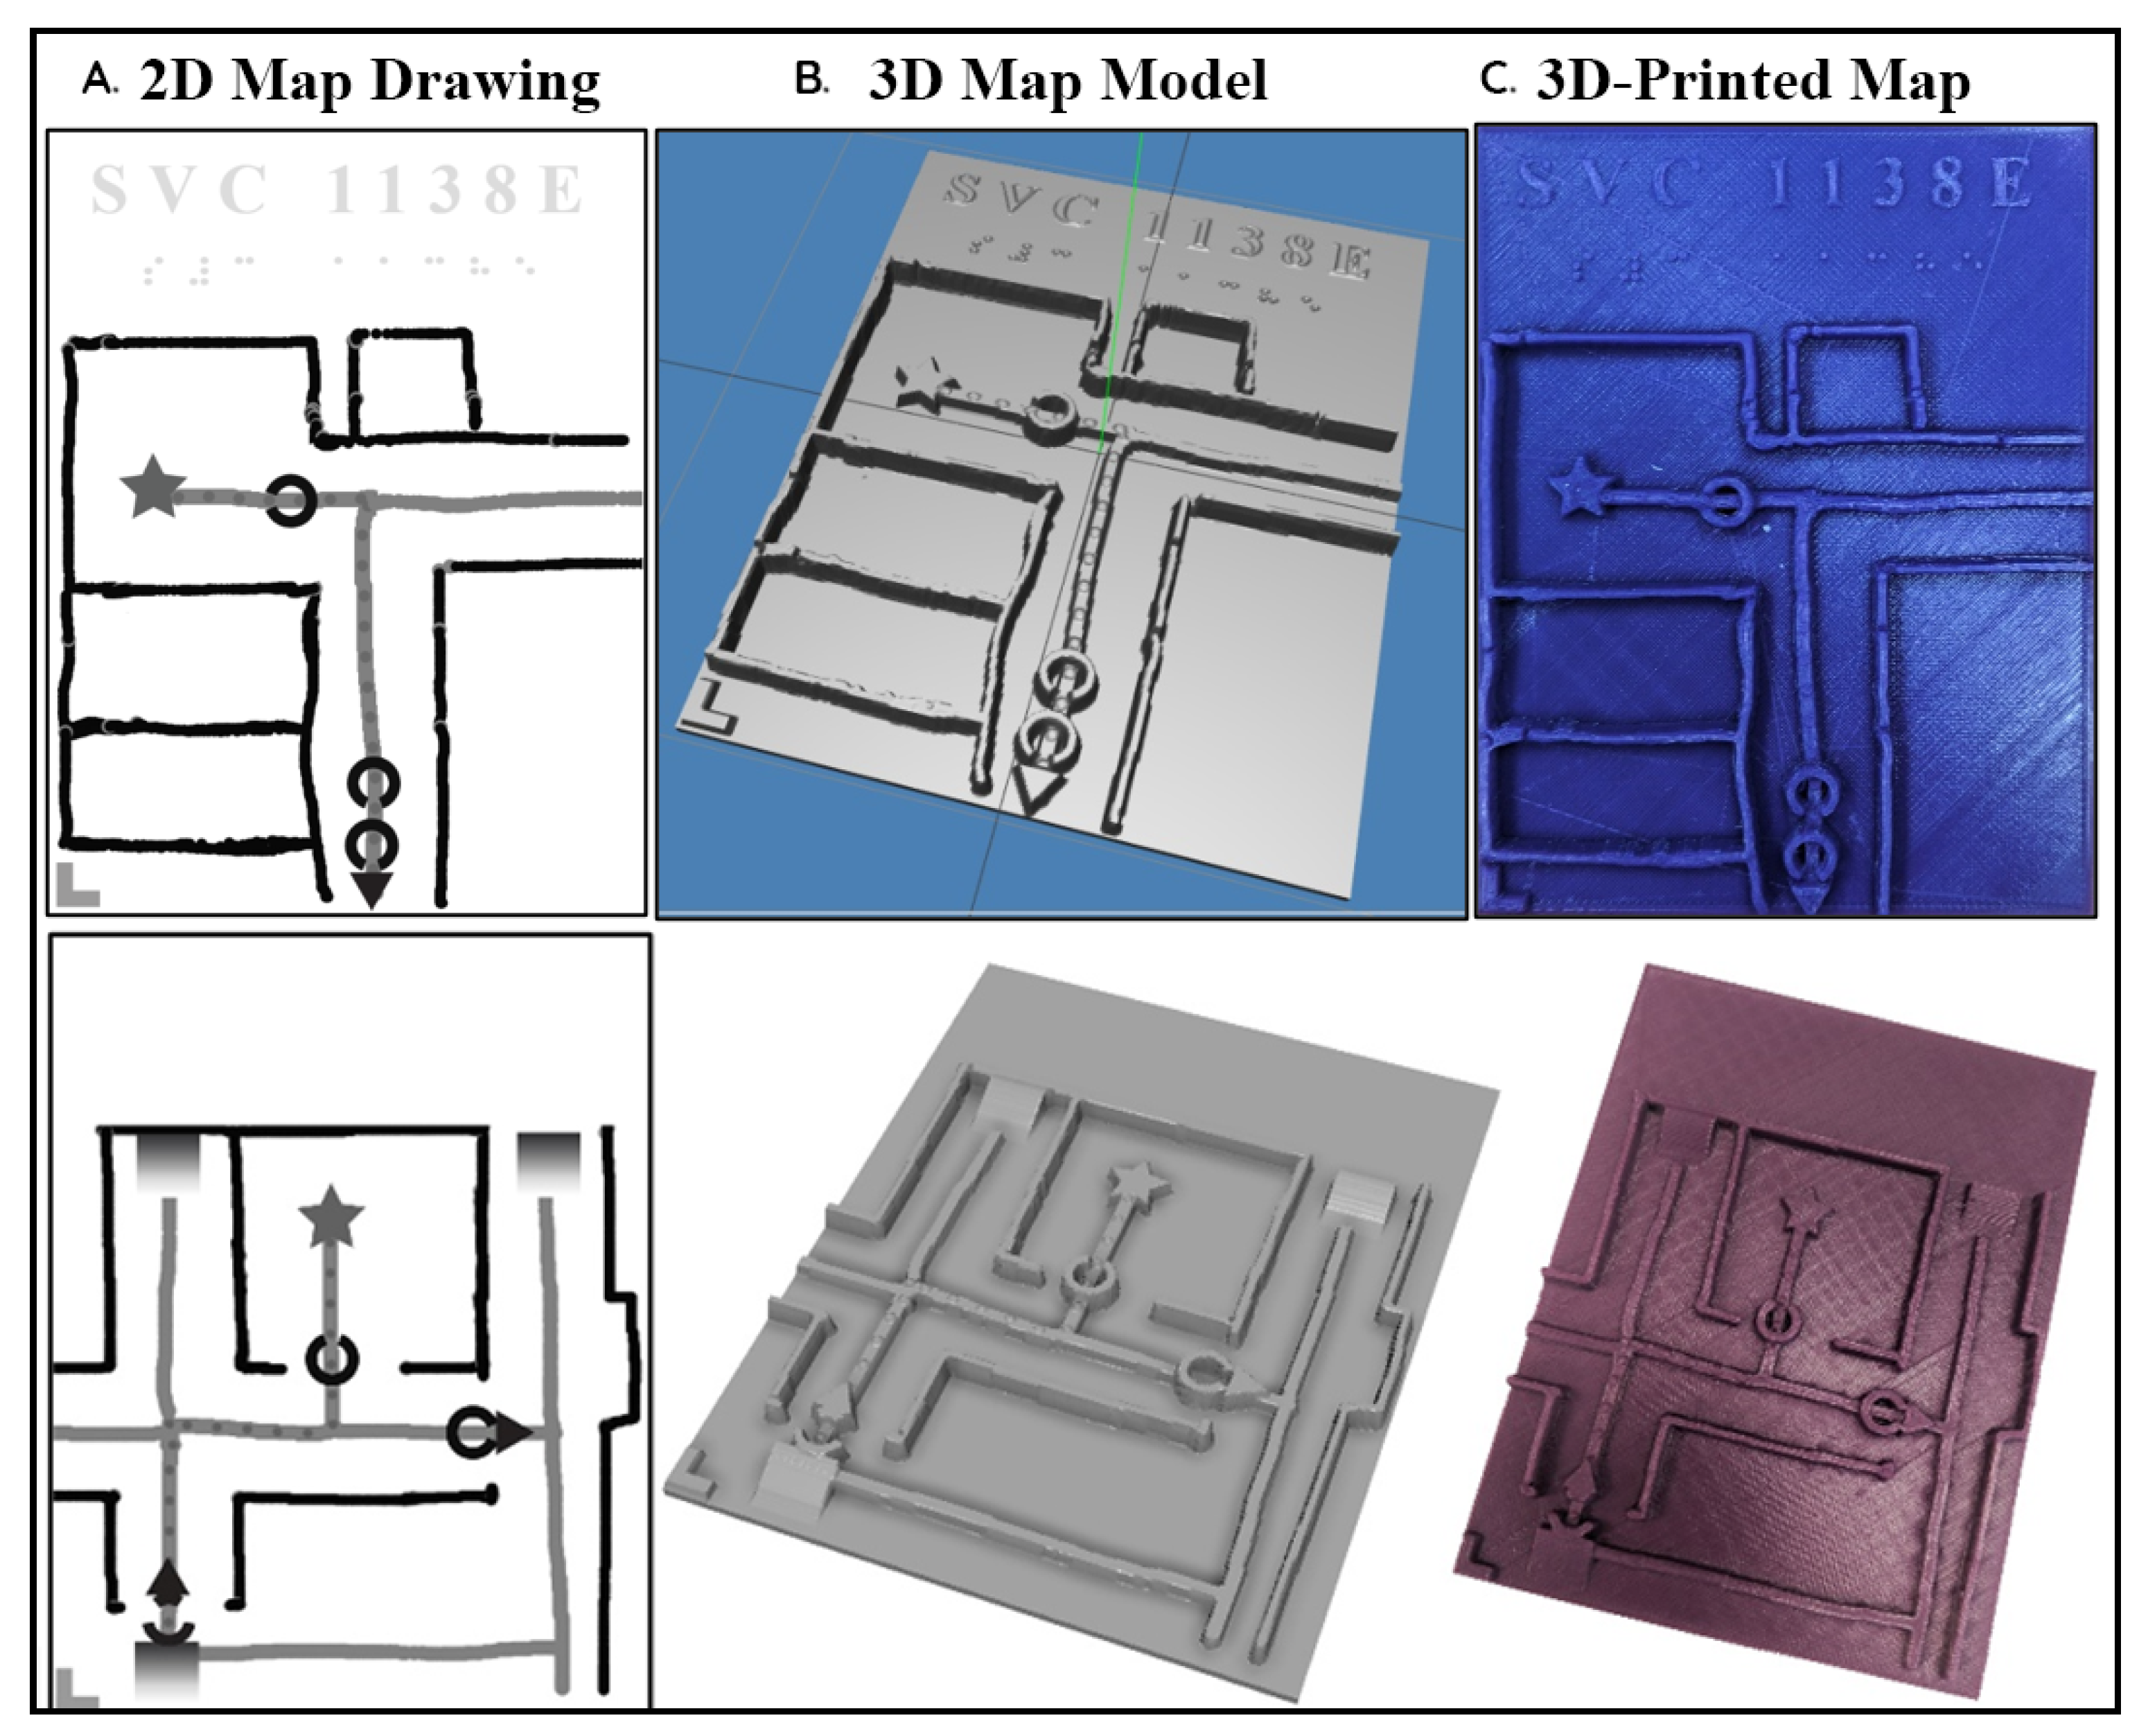
A small pilot test was conducted with eight congenitally blind participants to collect their opinion about the maps produced by the TMC application. Each participant took part in the test individually and provided verbal feedback while using the 3D printed map. 3D versions of each 3D-pinted tactile map were provided one at a time to the participant. The participants were asked to compare maps fabricated using the Tactile Map Creator application and manually designed in 3D CAD (
Figure 3). The study time ranged from 30 min to 1 h with an average study time of 43.5 min. The age of the participants ranged from 19 to 26 with an average age of 20.75. All participants liked both types of the maps, and only one of them was even able to distinguish them (more details about specific questions in the
Supporting Materials).
5. Conclusions
Our preliminary study demonstrated new design of software enabling individual with the basic computer experience to successfully create tactile maps. We collected evaluation data via surveys similar to ones typically used to analyze different aspects of acceptance and usability of similar technologies. Overall, the users were able to complete the tasks very well, were very satisfied with the application, and were planning to use it in their work. In addition, the individuals with blindness evaluated the maps created using our application and liked them as much as the maps they had previously used that were developed by professionals [
16]. This application can help to provide meaningful and inclusive maps to the end-user and is currently available to anybody interested in the creation of tactile maps. We plan to continue development of this technology for people with blindness and their caregivers. Our hope is that the TMC application will not only provide more efficient ways to create maps, but also bring awareness of these technologies and tools to people in need. Even though it is on-going project, the link to the functional prototype is available at
tactilemapcreator.com (accessed on 17 October 2021).


