1. Introduction
People with disabilities (PwDs) have been recently identified as an unrecognized health disparity population [
1] and a vulnerable group that is at least four times more likely to be injured or die than non-disabled people during public health emergencies and disaster events [
2]. The social vulnerability of PwDs is often amplified by their lower socioeconomic status, since almost 62% of PwDs in the U.S. are unemployed and 27% live below the poverty line [
3]. The need to examine increased risks faced by PwDs from the COVID-19 pandemic has been emphasized as a research priority in a World Health Organization report [
4]. Compared to the non-disabled population, PwDs face higher risks of contracting COVID-19 because of barriers in implementing basic hygiene measures (e.g., washing hands), enacting social distancing, and accessing public health information, as well as the need to touch objects to obtain information or for physical support [
4,
5,
6]. PwDs are also at greater risk of developing severe disease if they become infected because of pre-existing health conditions underlying their disability [
4] and barriers to accessing health care [
7]. Additionally, PwDs may be disproportionately impacted by the COVID-19 outbreak because of disruptions to services they depend on [
4,
6]. PwDs who reside in places facing higher exposure or vulnerability to COVID-19 risks are more likely to experience these adverse consequences and challenges [
8].
Recent studies have reported greater COVID-19 infection and mortality rates in counties containing higher proportions of racial/ethnic minorities, people in poverty, and other socially disadvantaged groups [
9,
10,
11,
12,
13], but the relationship between disability status and COVID-19 vulnerability has not been investigated in similar detail. The only national-scale study to focus specifically on PwDs found higher COVID-19 incidence to be negatively correlated with the overall percentage of PwDs, but positively associated with the presence of socially disadvantaged PwDs [
8]. While this study used COVID-19 cases as the only measure of pandemic vulnerability and did not examine types of difficulties experienced by PwDs, it emphasizes the growing need for more detailed and systematic analyses to better understand and address the needs of PwDs affected by COVID-19.
This article seeks to analyze the relationship between COVID-19 vulnerability and disability status in the U.S. by utilizing a comprehensive indicator of pandemic vulnerability and examining six types of difficulties experienced by PwDs. The key research objective is to determine whether vulnerability to the COVID-19 pandemic is significantly greater in U.S. counties containing higher percentages of PwDs and those reporting specific types of difficulties, after controlling for spatial clustering. An additional goal is to explore whether these statistical relationships between COVID-19 vulnerability and relevant disability variables have changed over time, during the first 12 months of the pandemic.
2. Materials and Methods
Vulnerability to COVID-19 is measured using the recently developed U.S. COVID-19 Pandemic Vulnerability Index (PVI) model, which integrates multiple variables into an overall county-level score based on 12 different indicators [
14]. These include a variety of well-established vulnerability factors for public health and pandemic-relevant factors distributed across four domains: infection rates (transmissible cases and disease spread), baseline population concentration (population mobility and residential density), intervention measures (social distance and testing), and health and environmental vulnerabilities (minority percentage, air pollution, age distribution, co-morbidities, health disparities, and hospital beds). The PVI profile for each county is calculated using the Toxicological Prioritization Index (ToxPi) framework for data integration within a geospatial context [
15,
16]. Data sources include the Social Vulnerability Index developed by the Centers for Disease Control and Prevention (CDC) for emergency response and hazard mitigation planning [
17], testing rates from the COVID Tracking Project [
18], social distancing metrics from mobile device data [
19], and dynamic measures of disease spread and case numbers [
20]. Methodological details associated with the integration of data streams, including the daily time series of all source data since February 2020 and resultant PVI scores, are available on the public GitHub project page [
21].
Visual representations of PVI profiles for each U.S. county are provided in the COVID-19 PVI Dashboard [
22] maintained by the National Institute of Environmental Health Sciences (NIEHS) and the CDC. For this study, PVI scores for all 3142 counties in the U.S. were downloaded for PVI Model 11.2 [
23] for four specific dates: 1 May 2020, 1 August 2020, 1 November 2020, and 1 February 2021. PVI data from these dates enabled a comparison of pandemic vulnerability with disability status across four equal timeframes (every three months) for the first 12 months since COVID-19 cases were officially recorded in the U.S. Descriptive statistics for these variables are listed in
Table 1.
Self-reported data on disability characteristics of the residential population were obtained from the 2019 American Community Survey (ACS) five-year estimates. The U.S. Census definition of disability is based on responses to six specific questions on the ACS form. A person is identified as having a disability if she/he or a proxy respondent answers affirmatively for one or more of these six categories [
24]:
Hearing difficulty (asked of all ages): Is this person deaf or have serious difficulty hearing?
Vision difficulty (asked of all ages): Is this person blind or have serious difficulty seeing even when wearing glasses?
Cognitive difficulty (asked of persons ages 5 or older): Because of a physical, mental, or emotional condition, does this person have serious difficulty concentrating, remembering, or making decisions?
Ambulatory difficulty (asked of persons ages 5 or older): Does this person have serious difficulty walking or climbing stairs?
Self-care difficulty (asked of persons ages 5 or older): Does this person have difficulty dressing or bathing?
Independent living difficulty (asked of persons ages 15 or older): Because of a physical, mental, or emotional condition, does this person have difficulty doing errands alone such as visiting a doctor’s office or shopping?
This study includes the percentage of PwDs reporting any disability, two of more types of disability, and each type of difficulty used to define disability. County percentages for each disability variable were calculated by dividing the relevant number of PwDs by the total civilian non-institutionalized population, the universe for all disability status variables in the ACS. Descriptive statistics for these variables are provided in
Table 1.
In the first phase of the statistical analysis, counties are classified into five quintiles based on PVI scores for each timeframe and mean percentage of PwDs in each quintile is estimated. A two-sample t-test for difference in means is then used to compare the percentages of PwDs in the first (lowest 20%) and fifth quintiles (highest 20%) of PVI scores. For each disability variable, the ANOVA F-test for linearity is also used to check for a statistically significant linear trend across the five PVI quintiles.
The second phase of the analysis uses bivariate generalized estimating equations (GEEs) to examine county-level statistical associations between PVI scores and each disability variable, in each of the four timeframes. GEEs extend the generalized linear model to accommodate clustered data [
25,
26], in addition to relaxing several assumptions of classical regression (e.g., normality). For estimating a GEE, clusters of analytic units must be defined based on the assumption that units within a cluster are correlated, while units from different clusters are independent. A combination of two approaches were utilized to define county clusters for the GEE models. The state in which a county is located was first used to account for potential correlation in counties within the same state, because counties in a given state are likely to be similar in terms of various relevant characteristics (e.g., COVID-19 response and testing policies, socio-cultural attributes, and healthcare systems). Since the use of states as the only clustering variable potentially ignores intra-state variations and urban-rural differences, a second approach based on the county Rural-Urban Continuum (RUC) code was utilized. This classification scheme developed by the U.S. Department of Agriculture [
27] groups all counties into metropolitan and nonmetropolitan, and non-metropolitan counties can be further subdivided based on whether they are adjacent to a metropolitan area. This combination of 51 states and 3 RUC categories (metropolitan, non-metropolitan adjacent, and non-metropolitan non-adjacent county) resulted in a total of 142 clusters, with the number of counties per cluster ranging from 1 to 98. GEEs also need an intra-cluster dependency correlation matrix to be specified [
26]. After experimentation with several different specifications, the ‘independent’ correlation matrix was selected since this specification yielded the best statistical fit. To further improve model fit, normal, gamma, and inverse Gaussian distributions with logarithmic and identity link functions were tested, since PVI scores were not normally distributed. The gamma distribution with logarithmic link function was chosen for all GEEs since this model specification indicated the best statistical fit. Statistical significance of disability variables in bivariate GEEs were estimated using two-tailed
p-values from the Wald chi-square test.
3. Results
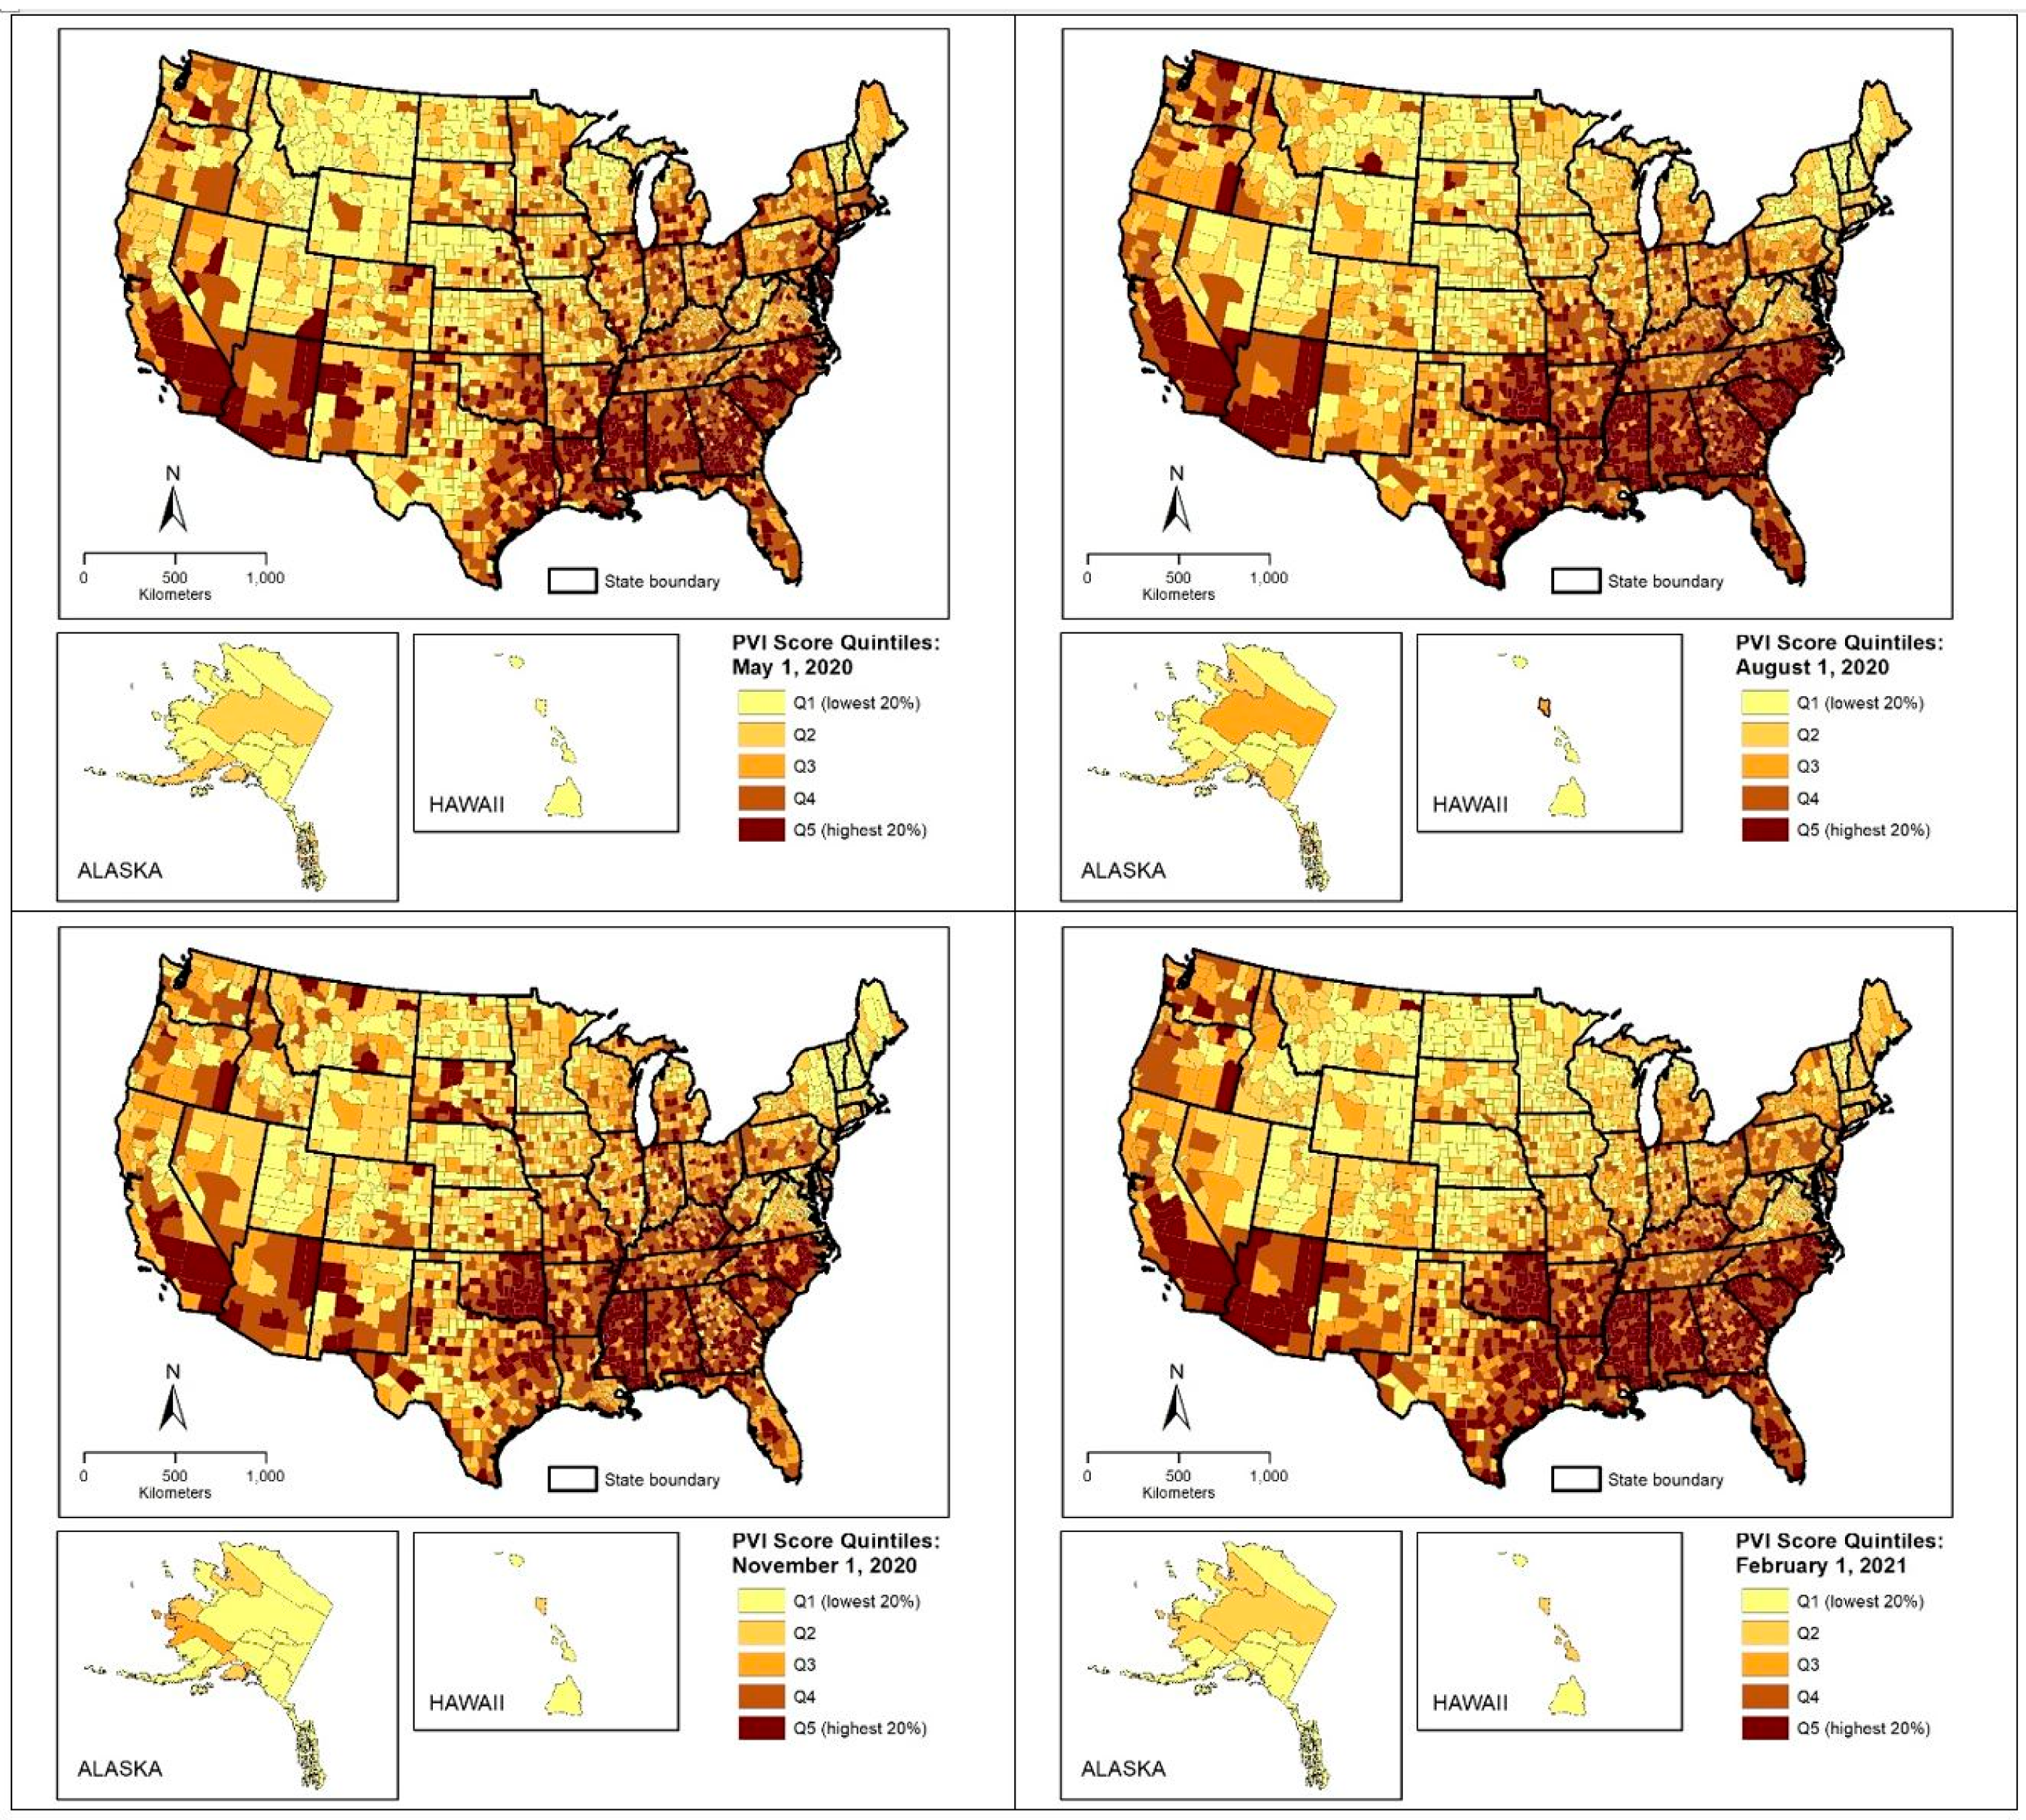
Spatial patterns of pandemic vulnerability are depicted as classified choropleth maps in
Figure 1, where U.S. counties are grouped into five quintiles based on their PVI scores in each timeframe. Counties in the highest quintile (top 20% of PVI) are located mainly in the southeastern and southwestern U.S., while those in the lowest PVI quintile can be found in the northern areas of the West and Midwest. The overall spatial distribution of the PVI did not appear to have changed substantially from May 2020 to February 2021.
The first phase of the statistical analysis compares the mean percentage of PwDs in each quintile and timeframe shown in
Figure 1. These results are summarized in
Table 2.
In the first three months of COVID-19 reporting (1 May 2020), the overall percentage of PwDs and those with specific types of difficulties increase gradually from the first (lowest 20%) to the fifth (highest 20%) quintile. The only exception is the percentage of PwDs with hearing difficulty, which shows a gradual decline across these quintiles. The ANOVA F-test results support a linear trend for changes in all disability variables with respect to the PVI score quintiles. Similar linear patterns of increases in percentage of PwDs and those with specific types of difficulty (except hearing difficulty) can be observed in the three other timeframes. The t-test results denote that the percentage of PwDs and those with specific types of difficulty (except hearing difficulty) are also significantly greater (p < 0.01) in counties located in the highest quintile compared to those in the lowest quintile of the PVI, in all four timeframes. PwDs with ambulatory difficulty indicate the largest percentages in the highest quintile of PVI scores, as well as the largest percentage difference between the highest and lowest PVI quintiles, compared to those reporting other types of difficulties.
The bivariate GEE model results, summarized in
Table 3, align with the comparison of quintile means. In all timeframes, positive and significant associations can be observed between PVI scores and the overall percentage of PwDs and those with two or more of types of disability, as well as with the percentages of PwDs with specific types of difficulties. The only exception again is the percentage of PwDs with hearing difficulty, which shows a significantly negative bivariate relationship with the PVI. PwDs with self-care and independent living difficulties indicate the largest beta coefficients, in all four timeframes. For the overall percentage of PwDs and those reporting two or more difficulties, the smallest positive beta coefficients are observed in May 2021 and the largest in February 2021. For those reporting specific types of difficulties, the bivariate relationship with the PVI was found to be relatively similar in the four timeframes examined here.
4. Discussion
This study sought to examine statistical associations between disability status and vulnerability to the COVID-19 pandemic in the U.S., using the most comprehensive measure of pandemic vulnerability currently available. Overall, the results reveal that PwDs and those experiencing specific types of difficulties are significantly overrepresented in U.S. counties with higher pandemic vulnerability, even after controlling for spatial clustering based on the state and urban-rural differences. Specifically, the percentages of civilian non-institutionalized people reporting vision, cognitive, ambulatory, self-care, and independent living difficulties are significantly greater in counties in the top 20% of pandemic vulnerability, and positively related to pandemic vulnerability, in all four timeframes examined. The results indicate that these statistical associations have remained relatively unchanged over time, from May 2020 to February 2021.
PwDs with hearing difficulty is the only group that is consistently and significantly more likely to reside counties with lower COVID-19 vulnerability. This finding could be related to the fact that hearing problems are the most prevalent disability among U.S. military veterans [
28]. States with relatively higher percentages of the civilian population who are U.S. veterans (e.g., Montana and Wyoming) contain larger percentages of PwDs with hearing difficulties and smaller percentages of PwDs reporting other difficulties, in addition to indicating low pandemic vulnerability. The percentages of those reporting self-care and independent living difficulties, in contrast, were found to be particularly higher in counties with greater pandemic vulnerability. These findings have important public health implications, since people reporting these two types of difficulties are more likely to face problems adopting recommended health guidelines and practicing routing prevention measures, as well as rely on personal care services that may be disrupted during the COVID-19 pandemic.
5. Conclusions
This study revealed that PwDs and those with vision, cognitive, ambulatory, self-care, and independent living difficulties were significantly more likely to reside in U.S. counties with higher vulnerability to COVID-19, during the first year of the pandemic. These county-level associations demonstrate an urgent need for more detailed analyses to document and understand the negative impacts of this pandemic on PwDs and develop appropriate intervention strategies. A major impediment to such analyses is the current availability of data on COVID-19 infections, hospitalizations, deaths, testing rates, mitigation measures, and treatments for PwDs. Although COVID-19 Case Surveillance Data are now available in the U.S., these individual records do not provide disability-related information. The findings of this study emphasize the necessity for COVID-19 data collection and reporting systems to include disability indicators, in addition to existing demographic and socioeconomic indicators (i.e., age, race/ethnicity, and gender). Additionally, while the ACS represents the most reliable data source on PwDs in the U.S., it is important to consider that disability information is collected and provided for only the civilian noninstitutionalized population. The excluded population includes individuals who reside in institutional group quarters such as nursing home facilities that experienced disproportionately large numbers of COVID-19 infections and related deaths. Since the ACS does not provide county level data on disability status of individuals in group quarters, future studies should explore the use of additional data sources and national surveys that provide reliable information on institutionalized PwDs. To understand and address the needs of PwDs affected by the COVID-19 pandemic, more detailed data and evidence-based research is urgently needed on their increased vulnerability, living situations, and specific consequences such as health problems, inadequate health care, loss of income, and social isolation.
Funding
This research is funded, in part, by the Geospatial Fellows Program supported by the U.S. National Science Foundation (NSF) under grant number 1743184. Any opinions, findings, and conclusions or recommendations expressed in this article are those of the author and do not necessarily reflect the views of the NSF.
Institutional Review Board Statement
Not applicable.
Informed Consent Statement
Not applicable.
Data Availability Statement
The data that support the findings of this study are available from the corresponding author, upon reasonable request.
Conflicts of Interest
The author declares no conflict of interest. The funders had no role in the design of the study; in the collection, analyses, or interpretation of data; in the writing of the manuscript, or in the decision to publish the results.
References
- Krahn, G.L.; Walker, D.K.; Correa-De-Araujo, R. Persons with disabilities as an unrecognized health disparity population. Am. J. Public Health 2015, 105, S198–S206. [Google Scholar] [CrossRef] [PubMed]
- Pineda, S.V.; Corburn, J. Disability, urban health equity, and the coronavirus pandemic: Promoting cities for all. J. Urban Health 2020, 97, 336–341. [Google Scholar] [CrossRef] [PubMed] [Green Version]
- Houtenville, A.; Boege, S. 2019 Annual Report on People with Disabilities in America. University of New Hampshire: Institute on Disability. 2019. Available online: https://eric.ed.gov/?id=ED605685 (accessed on 15 July 2021).
- World Health Organization (WHO). Disability Considerations during the COVID-19 Outbreak. 2020. Available online: https://www.who.int/publications/i/item/WHO-2019-ncov-Disability-2020-1 (accessed on 15 July 2021).
- Boyle, C.A.; Fox, M.H.; Havercamp, S.M. The public health response to the COVID-19 pandemic for people with disabilities. Disabil. Health J. 2020, 13, 100943. [Google Scholar] [CrossRef] [PubMed]
- Turk, M.A.; McDermott, S. The COVID-19 pandemic and people with disability. Disabil. Health J. 2020, 13, 100944. [Google Scholar] [CrossRef] [PubMed]
- Pendo, E. COVID-19 and Disability-Based Discrimination in Health Care. 2020. Available online: https://www.americanbar.org/groups/diversity/disabilityrights/resources/covid19-disability-discrimination (accessed on 1 July 2021).
- Chakraborty, J. Social inequities in the distribution of COVID-19: An intra-categorical analysis of people with disabilities in the US. Disabil. Health J. 2021, 14, 101007. [Google Scholar] [CrossRef] [PubMed]
- Finch, W.H.; Finch, H.M. Poverty and COVID-19: Rates of incidence and deaths in the United States during the first 10 weeks of the pandemic. Front. Sociol. 2020, 5, 47. [Google Scholar] [CrossRef] [PubMed]
- Hendryx, M.; Luo, J. COVID-19 prevalence and mortality rates in association with Black race and segregation in the United States April 1 to April 15, 2020. Lancet Public Health 2020. [Google Scholar] [CrossRef]
- Karaye, I.M.; Horney, J. The impact of social vulnerability on COVID-19 in the U.S.: An analysis of spatially varying relationships. Am. J. Prev. Med. 2020, 59, 317–325. [Google Scholar] [CrossRef] [PubMed]
- Mahajan, U.V.; Larkins-Pettigrew, K. Racial demographics and COVID-19 confirmed cases and deaths: A correlational analysis of 2886 US counties. J. Public Health 2020, 42, 445–447. [Google Scholar] [CrossRef] [PubMed]
- Karmakar, M.; Lantz, P.M.; Tipirneni, R. Association of social and demographic factors with COVID-19 incidence and death rates in the US. JAMA Netw. Open 2021, 4, e2036462. [Google Scholar] [CrossRef] [PubMed]
- Marvel, S.W.; House, J.S.; Wheeler, M.; Song, K.; Zhou, Y.-H.; Wright, F.A.; Chiu, W.A.; Rusyn, I.; Motsinger-Reif, A.; Reif, D.M. The COVID-19 pandemic vulnerability index (PVI) dashboard: Monitoring county-level vulnerability using visualization, statistical modeling, and machine learning. Environ. Health Perspect. 2021, 129, 017701. [Google Scholar] [CrossRef] [PubMed]
- Marvel, S.W.; To, K.; Grimm, F.A.; Wright, F.A.; Rusyn, I.; Reif, D.M. ToxPi Graphical User Interface 2.0: Dynamic exploration, visualization, and sharing of integrated data models. BMC Bioinform. 2018, 19, 80. [Google Scholar] [CrossRef] [PubMed] [Green Version]
- Bhandari, S.; Lewis, P.G.T.; Craft, E.; Marvel, S.W.; Reif, D.M.; Chiu, W.A. HGBEnviroScreen: Enabling community action through data integration in the Houston–Galveston–Brazoria region. Int. J. Environ. Res. Public Health 2020, 17, 1130. [Google Scholar] [CrossRef] [PubMed] [Green Version]
- Horney, J.; Nguyen, M.; Salvesen, D.; Dwyer, C.; Cooper, J.; Berke, P. Assessing the quality of rural hazard mitigation plans in the southeastern United States. J. Plan. Educ. Res. 2018, 37, 56–65. [Google Scholar] [CrossRef]
- Atlantic Monthly Group. The COVID Tracking Project. 2020. Available online: https://covidtracking.com/https://www.unacast.com/covid19/social-distancing-scoreboard (accessed on 15 July 2021).
- Unacast. Understand the Impact of COVID-19 Using Real Data. 2021. Available online: https://www.unacast.com/covid19/social-distancing-scoreboard (accessed on 15 July 2021).
- USA Facts. Understanding the COVID-19 Pandemic. 2021. Available online: https://usafacts.org/issues/coronavirus/ (accessed on 15 July 2021).
- COVID-19 Pandemic Vulnerability Index (PVI). COVID-19 PVI Data GitHub Project Page. 2021. Available online: https://github.com/COVID19PVI/data (accessed on 24 July 2021).
- National Institute of Environmental Health Sciences (NIEHS). COVID-19 Pandemic Vulnerability Index (PVI) Dashboard. 2021. Available online: https://covid19pvi.niehs.nih.gov/ (accessed on 24 July 2021).
- NIEHS. COVID-19 PVI Dashboard: Details of Current Model 11.2. 2021. Available online: https://www.niehs.nih.gov/research/programs/coronavirus/covid19pvi/details/index.cfm (accessed on 24 July 2021).
- US Census Bureau. How Disability Data Are Collected from the American Community Survey. 2021. Available online: https://www.census.gov/topics/health/disability/guidance/data-collection-acs.html (accessed on 15 July 2021).
- Liang, K.; Zeger, S. Longitudinal data analysis using generalized linear models. Biometrika 1986, 73, 13–22. [Google Scholar] [CrossRef]
- Garson, G. Generalized Linear Models and Generalized Estimating Equations; Statistical Associates Publishing: Asheboro, NC, USA, 2021. [Google Scholar]
- United States Department of Agriculture, Economic Research Service. Rural-Urban Continuum Codes. Available online: https://www.ers.usda.gov/data-products/rural-urban-continuum-codes/ (accessed on 15 July 2021).
- US Department of Veteran Affairs. Hearing Loss. 2021. Available online: https://www.research.va.gov/topics/hearing.cfm (accessed on 9 August 2021).
| Publisher’s Note: MDPI stays neutral with regard to jurisdictional claims in published maps and institutional affiliations. |
© 2021 by the author. Licensee MDPI, Basel, Switzerland. This article is an open access article distributed under the terms and conditions of the Creative Commons Attribution (CC BY) license (https://creativecommons.org/licenses/by/4.0/).


